
Mercado global de automatización de laboratorio, por tipo de producto (equipo, software e informática y analizador), tipo de automatización (automatización modular y automatización total de laboratorio), aplicación (descubrimiento de fármacos, diagnóstico clínico, soluciones genómicas , soluciones proteómicas, bioanálisis, ingeniería de proteínas, liofilización, biología de sistemas, química analítica y otros), usuarios finales (biotecnología y productos farmacéuticos, hospitales y laboratorios, instituciones de investigación y académicas y otros) - Tendencias de la industria y pronóstico hasta 2029.
Análisis y perspectivas del mercado de automatización de laboratorios
La demanda del mercado de automatización de laboratorios está aumentando debido al avance de la tecnología en todo el mundo. Para el sector de la salud se utilizan equipos y herramientas de automatización de laboratorio. Como el gasto en atención médica ha aumentado debido a varios factores, las principales empresas farmacéuticas y de atención médica tienen que automatizar los laboratorios para brindar servicios de atención médica avanzados en la puerta de su casa en menos tiempo.
La creciente demanda de atención médica en el mercado es la principal causa de la competencia entre las principales empresas de atención médica y farmacéuticas en la mejora de la automatización de laboratorios en todo el mundo. El aumento en el uso de equipos, analizadores y software para el laboratorio se ha aprovechado. El enfoque de los actores del mercado es proporcionar variabilidad de herramientas, equipos, máquinas y técnicas para respaldar el desarrollo y la fabricación de infraestructura de laboratorio automatizada. Los actores del mercado están aportando más inversiones y financiación para construir tecnología y métodos avanzados.
El gasto en atención médica ha aumentado debido a varios factores, como el envejecimiento de la población, la prevalencia de enfermedades crónicas, el aumento de los precios de los medicamentos, los costos de los servicios de atención médica y los costos administrativos, entre otros. Además, los hospitales, los laboratorios privados, los centros de investigación clínica y de diagnóstico están aumentando, lo que aumenta la demanda del mercado de automatización de laboratorios.
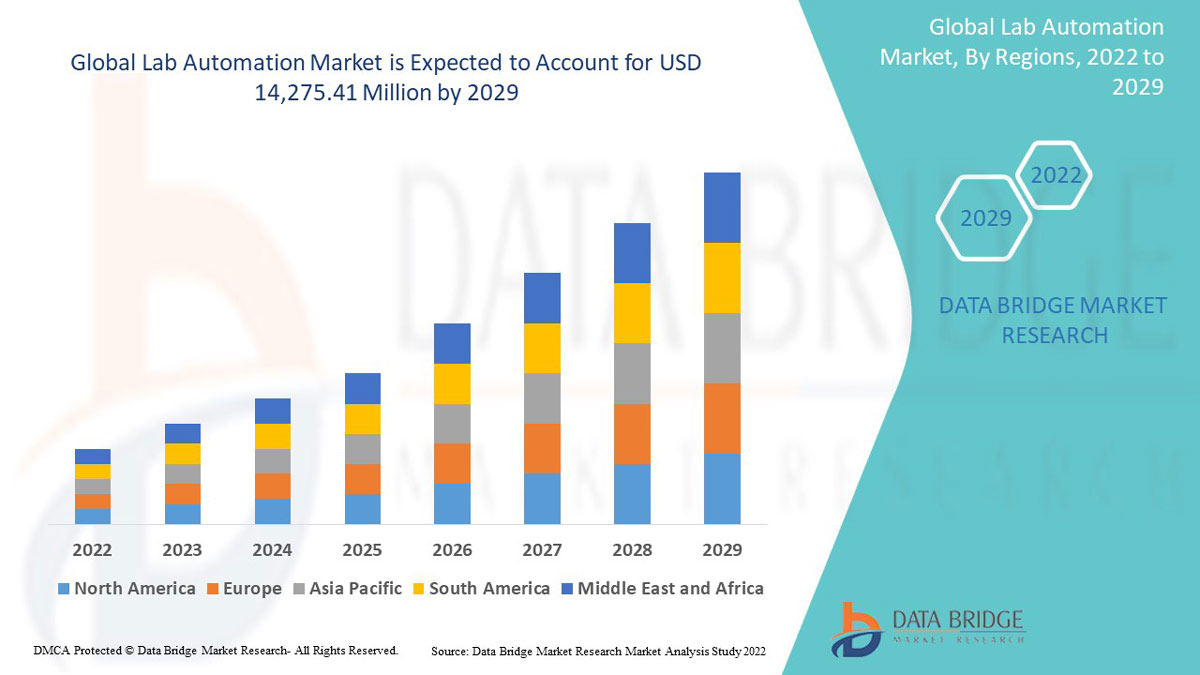
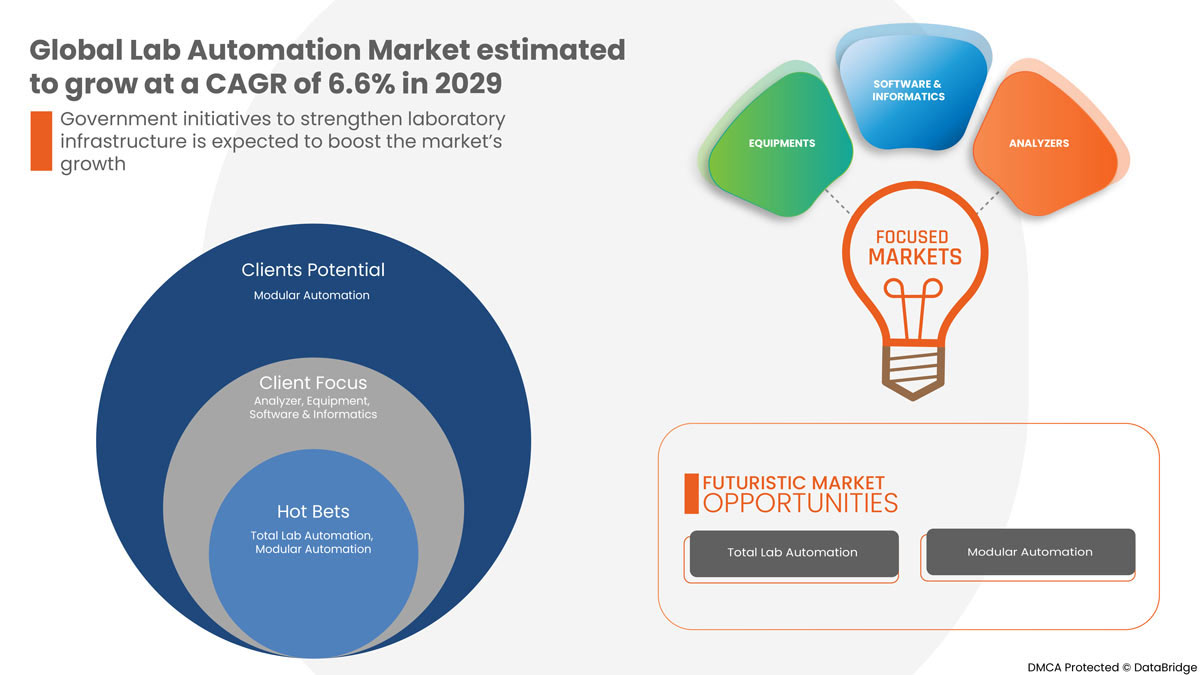
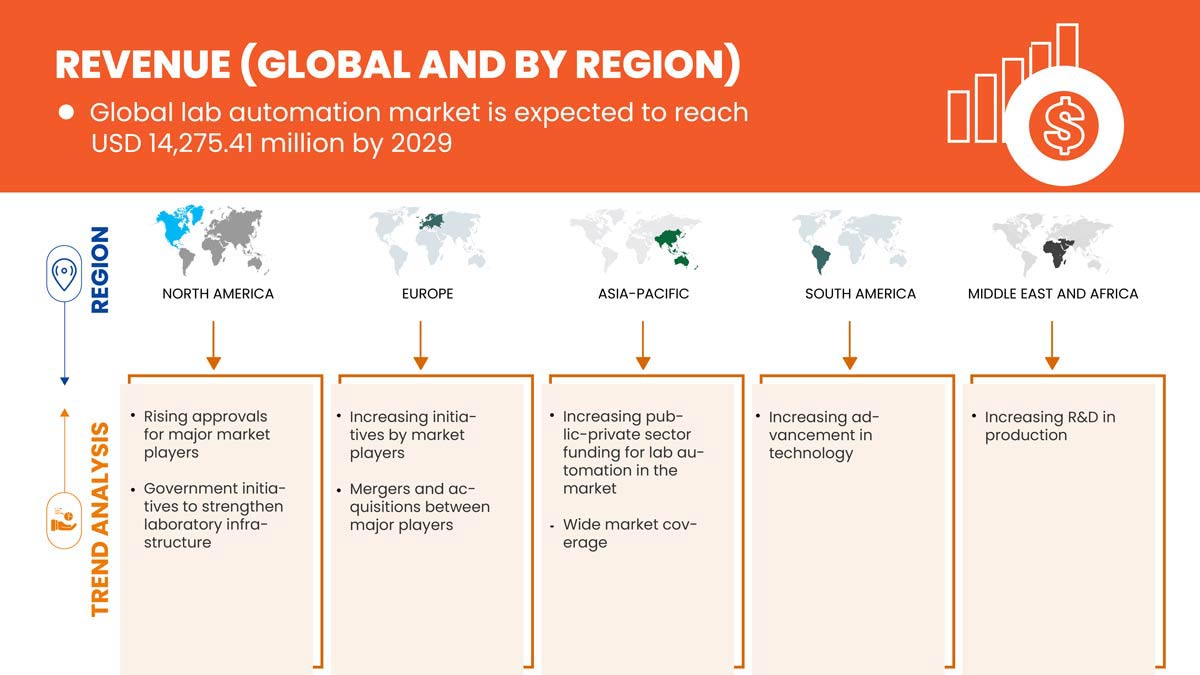
Se espera que el mercado global de automatización de laboratorio gane crecimiento de mercado en el período de pronóstico de 2022 a 2029. Data Bridge Market Research analiza que el mercado está creciendo con una CAGR del 6,6% en el período de pronóstico de 2022 a 2029 y se espera que alcance los USD 14.275,41 millones para 2029.
|
Métrica del informe |
Detalles |
|
Período de pronóstico |
2022 a 2029 |
|
Año base |
2021 |
|
Años históricos |
2020 (Personalizable para 2019-2014) |
|
Unidades cuantitativas |
Ingresos en millones de USD |
|
Segmentos cubiertos |
Por tipo de producto (equipos, software e informática y analizadores), tipo de automatización (automatización modular y automatización total de laboratorio), aplicación (descubrimiento de fármacos, diagnóstico clínico, soluciones genómicas, soluciones proteómicas, bioanálisis, ingeniería de proteínas, liofilización, biología de sistemas, química analítica y otros), usuarios finales (biotecnología y productos farmacéuticos, hospitales y laboratorios, instituciones académicas y de investigación y otros) |
|
Países cubiertos |
EE. UU., Canadá, México, Alemania, Francia, Reino Unido, Italia, España, Países Bajos, Rusia, Bélgica, Suiza, Turquía, Resto de Europa, China, Japón, India, Corea del Sur, Australia, Singapur, Tailandia, Malasia, Indonesia, Filipinas, Resto de Asia-Pacífico, Brasil, Argentina, Resto de Sudamérica, Sudáfrica, Arabia Saudita, Emiratos Árabes Unidos y Resto de Medio Oriente y África |
|
Actores del mercado cubiertos |
QIAGEN, Siemens Healthcare, F. Hoffman Roche, Hamilton Company, Hudson Robotics, LabVantage Solutions Inc., Abbott, BD, BIOMERIEUX, Aurora Biomed Inc., Danaher, Tecan Trading AG, PerkinElmer Inc, Thermo Fisher Scientific, Agilent Technologies, Azenta US Inc, Eppendorf SE y Labware, entre otros. |
Definición de mercado
La automatización de laboratorio es la combinación de tecnologías automatizadas en el laboratorio para permitir procesos nuevos y mejorados. Se utiliza como estrategia para investigar, desarrollar, optimizar y aprovechar las tecnologías en el laboratorio. Se utiliza especialmente para automatizar procesos de laboratorio que requieren una intervención humana mínima y eliminan el error humano. La automatización de laboratorio se utiliza con el objetivo de proporcionar pruebas y diagnósticos más eficientes.
La automatización de laboratorios permite a los investigadores y técnicos producir resultados de manera eficiente y eficaz en menos tiempo, lo que se espera que impulse el mercado de la automatización de laboratorios. Además, la rápida propagación de enfermedades, junto con los nuevos descubrimientos en el campo de la atención médica, aumentan la demanda de diagnósticos y tratamientos, lo que se espera que impulse el mercado de la automatización de laboratorios. La alta financiación gubernamental y privada para la investigación y el descubrimiento y la presencia de importantes actores del mercado también contribuyen al crecimiento del mercado.
Dinámica del mercado global de automatización de laboratorios
Conductores
- Aumento de la inversión y de las iniciativas estratégicas de los actores del mercado
El mercado de la automatización de laboratorios está aumentando debido a la gran demanda de servicios automatizados avanzados especializados que eliminen los errores humanos. El objetivo de los actores del mercado y las empresas es proporcionar una variabilidad de herramientas, equipos, máquinas y técnicas para respaldar el desarrollo y la fabricación de infraestructura de laboratorio automatizada. El mercado de la automatización de laboratorios está aumentando debido a la gran demanda de servicios automatizados avanzados especializados que eliminen los errores humanos. Para capturar la participación de mercado global, los actores del mercado están realizando más inversiones y financiación para desarrollar tecnología y métodos avanzados. Estos actores están más centrados en reducir los esfuerzos manuales y el tiempo de trabajo práctico para el proceso tradicionalmente intensivo en mano de obra. Se espera que esto impulse el crecimiento del mercado.
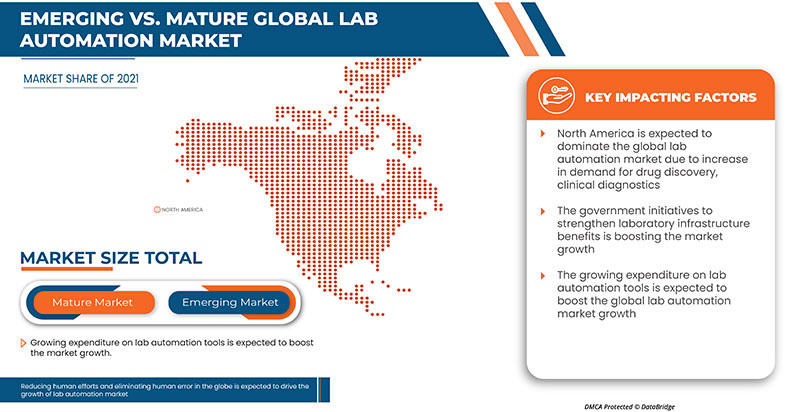
- Iniciativas gubernamentales para fortalecer las infraestructuras de laboratorio
Para fortalecer aún más el sector de la atención médica y la infraestructura de laboratorio, las organizaciones gubernamentales desempeñan un papel importante. La financiación y la iniciativa del gobierno para expandir la automatización de laboratorios ayudarán al crecimiento del mercado y aumentarán el número de actores del mercado. Las colaboraciones y los acuerdos del gobierno con los actores clave del mercado fortalecerán aún más la infraestructura de laboratorio.
- Creciente gasto en herramientas y equipos de automatización de laboratorio
El gasto en herramientas y equipos de automatización de laboratorio va en aumento. Esto se debe principalmente a que la demanda de análisis de laboratorio aumenta rápidamente por diversas razones, como el envejecimiento de la población, el aumento de enfermedades crónicas, el descubrimiento de biomarcadores nuevos y más eficaces y un aumento de las demandas generales de salud o de diagnóstico.
- Reducir los esfuerzos humanos y eliminar el error humano
Existen varias formas tradicionales de reducir los errores humanos, pero desarrollar un sistema para minimizar el riesgo de errores humanos ayudará a garantizar que no se repitan los mismos errores nuevamente. Las instalaciones de fabricación se centran en la creación de sistemas avanzados para utilizar tecnología de inteligencia artificial para reconocer y corregir problemas antes de que ocurran.
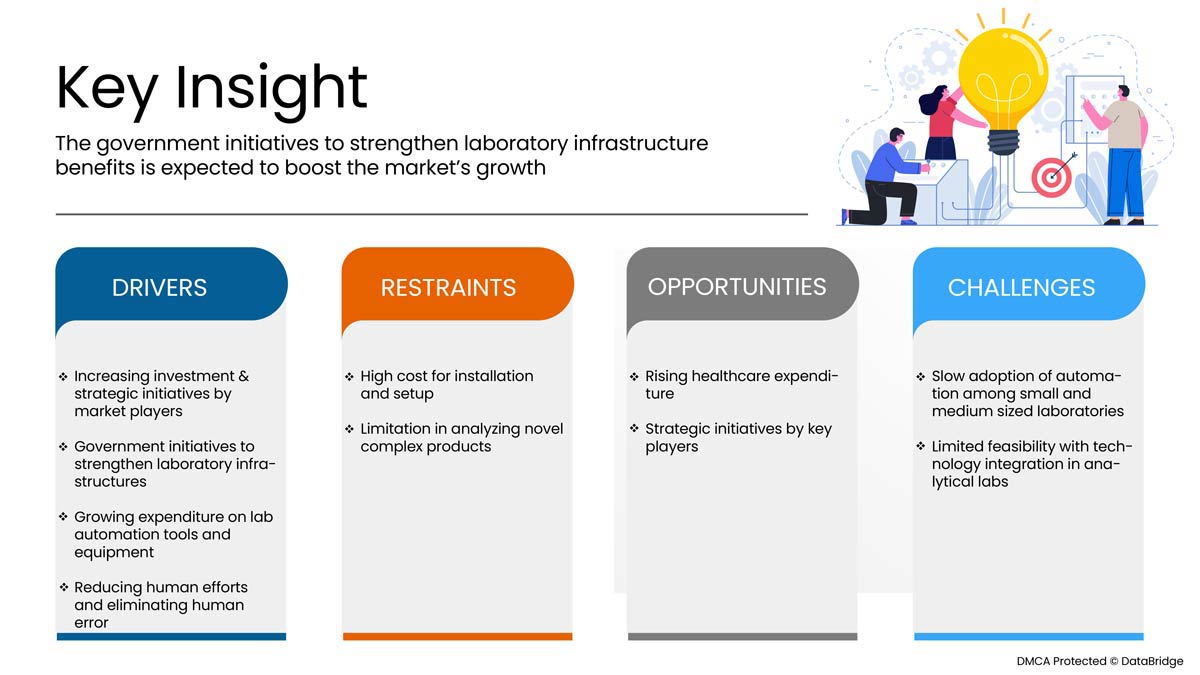
Oportunidades
-
Aumento del gasto sanitario
El gasto en atención médica ha aumentado debido a varios factores, como el envejecimiento de la población, la prevalencia de enfermedades crónicas, el aumento de los precios de los medicamentos, los costos de los servicios de atención médica y los costos administrativos, entre otros. Sin embargo, 2020 fue el punto de inflexión en el que los gastos ocuparon el primer lugar debido a la pandemia de COVID-19. Se ha descubierto que en 2020, el gasto en atención médica creció al ritmo de crecimiento más rápido experimentado desde 2002 debido a la pandemia .
-
Iniciativas estratégicas de actores clave
Las principales empresas farmacéuticas y de atención médica han tomado varias iniciativas para automatizar los laboratorios y ofrecer servicios de atención médica avanzados en menos tiempo. La creciente demanda de atención médica en el mercado es la principal causa de competencia entre las principales empresas farmacéuticas y de atención médica en la mejora de la automatización de laboratorios en todo el mundo. Por lo tanto, se espera que las iniciativas estratégicas de los actores del mercado actúen como una oportunidad para el crecimiento del mercado de automatización de laboratorios.
-
Aumento del número de empresas farmacéuticas
La industria farmacéutica ha experimentado un crecimiento significativo durante las últimas dos décadas. El aumento de los ingresos disponibles, el mayor acceso a los servicios de salud, la creciente concienciación sobre la atención sanitaria entre las personas y la mayor penetración de los servicios médicos están haciendo que las empresas farmacéuticas aumenten en número para satisfacer la demanda.
La pandemia de COVID-19 tuvo un gran impacto en la industria farmacéutica debido al aumento de la demanda de servicios médicos y suministros de medicamentos. Las industrias farmacéuticas han estado creciendo rápidamente en todo el mundo para satisfacer la alta demanda de la humanidad y, por lo tanto, el servicio debe brindarse lo antes posible. Por lo tanto, para lograr instalaciones de atención médica avanzadas que brinden un servicio rápido y sin errores en menos tiempo, se necesita la automatización de laboratorios. Por lo tanto, se espera que el aumento en el número de empresas farmacéuticas actúe como una oportunidad para el crecimiento del mercado de automatización de laboratorios.
Restricciones/Desafíos
- Limitación del análisis de nuevos productos complejos
Existen diversos factores que contribuyen a la complejidad de los nuevos productos que se utilizan en los laboratorios automatizados. La interacción constante entre el personal y los fabricantes de dispositivos en las primeras fases del proceso de desarrollo es muy necesaria y se vuelve obligatoria para comprender el funcionamiento de la pieza o la configuración general. Las limitaciones en la detección y el análisis de nuevos productos complejos, como máquinas, herramientas y equipos, están obstaculizando la instalación y el funcionamiento de los laboratorios automatizados en el mercado.
- Alto costo de instalación y configuración
La instalación y configuración de sistemas automatizados de laboratorio son procedimientos mucho más complejos y que requieren mucho trabajo. La instalación de laboratorios automatizados requiere mucho tiempo, esfuerzo, planificación, implementación y aprobaciones de varios departamentos gubernamentales. Además, lo esencial para la instalación de un nuevo laboratorio requiere una inversión crítica en infraestructura debido al alto costo de las máquinas, herramientas y equipos avanzados.
- Actualización, mantenimiento y revisiones periódicas
La operación eficiente de los laboratorios es la principal preocupación después de la instalación. El mantenimiento, la actualización y las revisiones periódicas de los equipos son necesarios para la operación. El gasto que se requiere para esto es uno de los principales factores restrictivos para los actores del mercado. Los propietarios de los laboratorios están obligados por la regulación o el control de calidad a probar sus productos independientemente de las empresas fabricantes para operar sin problemas y evitar circunstancias que puedan frenar el crecimiento del mercado.
Impacto posterior a la COVID-19 en el mercado global de automatización de laboratorios
El COVID-19 ha afectado positivamente al mercado de la automatización. Debido a la pandemia, la salud de las personas se ha visto afectada, por lo que se han realizado muchas pruebas de diagnóstico y ha aumentado la demanda. Los laboratorios privados, los hospitales y la investigación clínica aumentaron debido a la pandemia. Por lo tanto, el COVID-19 aumentó positivamente el mercado de la automatización de laboratorios.
Acontecimientos recientes
- En junio de 2022, BD anunció que había completado la adquisición de Straub Medical AG, una empresa privada. Con esta adquisición, la empresa ha incorporado la valiosa experiencia y conocimientos de Straub Medical AG y ha ampliado su cartera de productos.
- En enero de 2022, QIAGEN anunció que había iniciado nuevas colaboraciones con Atlia Biosystems para proporcionar soluciones de pruebas prenatales no invasivas.
Alcance del mercado global de automatización de laboratorios
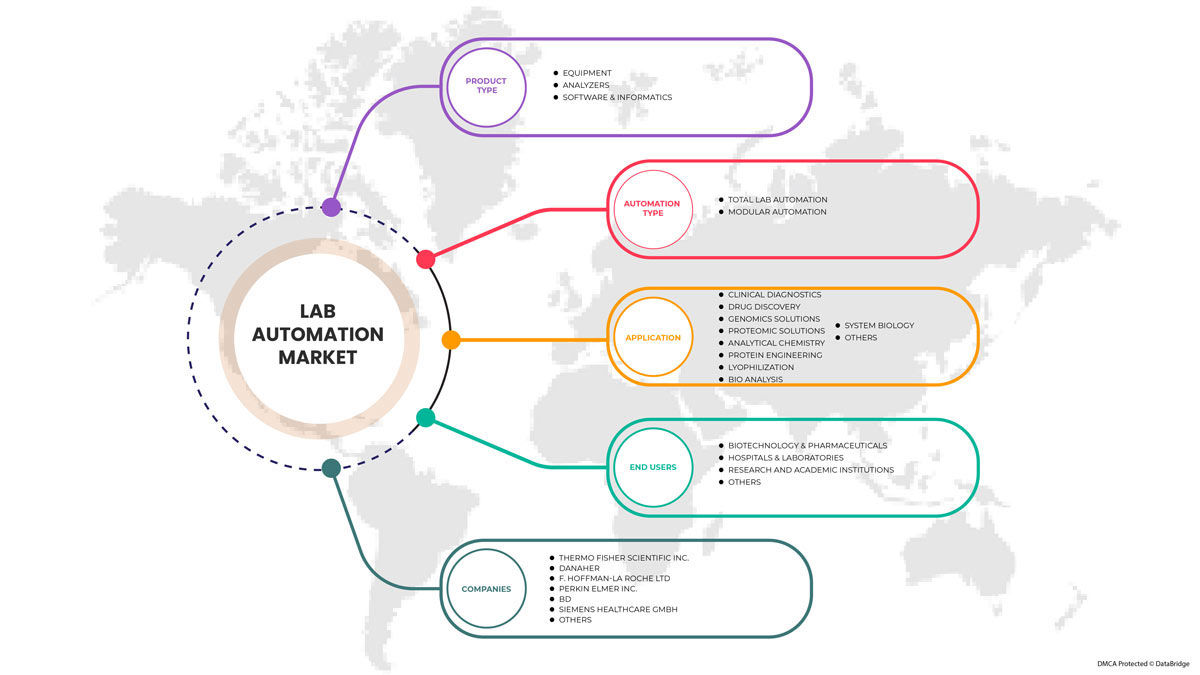
El mercado global de automatización de laboratorios está segmentado por tipo de producto, categoría de producto, sistemas automatizados, aplicación y usuario final. El crecimiento entre estos segmentos le ayudará a analizar segmentos de crecimiento reducido en las industrias y brindará a los usuarios una valiosa descripción general del mercado y conocimientos del mercado para tomar decisiones estratégicas para identificar las principales aplicaciones del mercado.
Tipo de producto
- Equipo
- Analizador
- Software e informática
Según el tipo de producto, el mercado global de automatización de laboratorio está segmentado en equipos, analizadores, software e informática.
Sistemas automatizados
- Automatización total del laboratorio
- Automatización de laboratorio modular
Basado en sistemas automatizados, el mercado global de automatización de laboratorio está segmentado en automatización total de laboratorio y automatización modular de laboratorio.
Solicitud
- Diagnóstico clínico
- Descubrimiento de fármacos
- Soluciones genómicas
- Soluciones proteómicas
- Química Analítica
- Ingeniería de proteínas
- Liofilización
- Análisis biológico
- Biología de sistemas
- Otros
Según la aplicación, el mercado global de automatización de laboratorio está segmentado en descubrimiento de fármacos, diagnóstico clínico, soluciones genómicas, soluciones proteómicas, bioanálisis, ingeniería de proteínas, liofilización, biología de sistemas, química analítica y otros.
Usuario final
- Biotecnología y productos farmacéuticos
- Hospitales y laboratorios
- Institutos de investigación y académicos
- Otros
Según el usuario final, el mercado global de automatización de laboratorio está segmentado en biotecnología y productos farmacéuticos, hospitales y laboratorios, instituciones de investigación y académicas y otros.
Análisis y perspectivas regionales del mercado global de automatización de laboratorios
Se analiza el mercado global de automatización de laboratorio y se proporcionan información y tendencias del tamaño del mercado por país, tipo de producto, sistemas automatizados, aplicación y usuario final.
Los países cubiertos en el mercado son EE. UU., Canadá, México, Alemania, Francia, Reino Unido, Italia, España, Países Bajos, Rusia, Bélgica, Suiza, Turquía, resto de Europa, China, Japón, India, Corea del Sur, Australia, Singapur, Tailandia, Malasia, Indonesia, Filipinas, resto de Asia-Pacífico, Brasil, Argentina, resto de Sudamérica, Sudáfrica, Arabia Saudita, Emiratos Árabes Unidos y resto de Medio Oriente y África.
Se espera que la región Asia-Pacífico domine el mercado mundial de automatización de laboratorios debido a un número creciente de actividades de investigación. Se espera que un aumento en la demanda de equipos, analizadores y software impulse el crecimiento del mercado en el período de pronóstico.
La sección de regiones del informe también proporciona factores de impacto individuales en el mercado y cambios en las regulaciones del mercado que afectan las tendencias actuales y futuras del mercado. Los puntos de datos, como las ventas de productos nuevos y de reemplazo, la demografía del país, la epidemiología de las enfermedades y los aranceles de importación y exportación, son algunos de los principales indicadores utilizados para pronosticar el escenario del mercado para cada país. Además, se consideran la presencia y disponibilidad de las marcas de América Central y los desafíos que enfrentan debido a la alta competencia de las marcas locales y nacionales, y el impacto de los canales de venta al proporcionar un análisis de pronóstico de los datos del país.
Análisis del panorama competitivo y de la cuota de mercado global de la automatización de laboratorios
El panorama competitivo del mercado global de automatización de laboratorios proporciona detalles de los competidores. Los detalles incluidos son una descripción general de la empresa, las finanzas de la empresa, los ingresos generados, el potencial de mercado, la inversión en investigación y desarrollo, las nuevas iniciativas de mercado, la presencia global, los sitios e instalaciones de producción, las capacidades de producción, las fortalezas y debilidades de la empresa, el lanzamiento de productos, la amplitud y la variedad de productos y el dominio de las aplicaciones. Los puntos de datos anteriores proporcionados solo están relacionados con el enfoque de las empresas en el mercado global de automatización de laboratorios.
Algunos de los principales actores que operan en el mercado global de automatización de laboratorio son QIAGEN, Siemens Healthcare, F. Hoffman Roche, Hamilton Company, Hudson Robotics, LabVantage Solutions Inc., Abbott, BD, BIOMERIEUX, Aurora Biomed Inc., Danaher, Tecan Trading AG, PerkinElmer Inc, Thermo Fisher Scientific, Agilent Technologies, Azenta US Inc, Eppendorf SE y Labware, entre otros.
Metodología de la investigación
La recopilación de datos y el análisis del año base se realizan utilizando módulos de recopilación de datos con tamaños de muestra grandes. Los datos del mercado se analizan y estiman utilizando modelos estadísticos y coherentes de mercado. Además, el análisis de la participación de mercado y el análisis de tendencias clave son los principales factores de éxito en el informe de mercado. La metodología de investigación clave utilizada por el equipo de investigación de DBMR es la triangulación de datos que implica la extracción de datos, el análisis del impacto de las variables de datos en el mercado y la validación primaria (experto en la industria). Aparte de esto, los modelos de datos incluyen una cuadrícula de posicionamiento de proveedores, análisis de la línea de tiempo del mercado, descripción general y guía del mercado, cuadrícula de posicionamiento de la empresa, análisis de la participación de mercado de la empresa, estándares de medición, análisis global frente a regional y de la participación de los proveedores. Solicite una llamada de un analista en caso de tener más consultas.
SKU-
Obtenga acceso en línea al informe sobre la primera nube de inteligencia de mercado del mundo

- Panel de análisis de datos interactivo
- Panel de análisis de empresas para oportunidades con alto potencial de crecimiento
- Acceso de analista de investigación para personalización y consultas
- Análisis de la competencia con panel interactivo
- Últimas noticias, actualizaciones y análisis de tendencias
- Aproveche el poder del análisis de referencia para un seguimiento integral de la competencia
Tabla de contenido
1 INTRODUCTION
1.1 OBJECTIVES OF THE STUDY
1.2 MARKET DEFINITION
1.3 OVERVIEW OF THE GLOBAL LAB AUTOMATION MARKET
1.4 LIMITATIONS
1.5 MARKETS COVERED
2 MARKET SEGMENTATION
2.1 MARKETS COVERED
2.2 GEOGRAPHICAL SCOPE
2.3 YEARS CONSIDERED FOR THE STUDY
2.4 CURRENCY AND PRICING
2.5 DBMR TRIPOD DATA VALIDATION MODEL
2.6 MULTIVARIATE MODELLING
2.7 PRODUCT TYPE LIFELINE CURVE
2.8 PRIMARY INTERVIEWS WITH KEY OPINION LEADERS
2.9 DBMR MARKET POSITION GRID
2.1 MARKET END USER COVERAGE GRID
2.11 VENDOR SHARE ANALYSIS
2.12 SECONDARY SOURCES
2.13 ASSUMPTIONS
3 EXECUTIVE SUMMARY
4 PREMIUM INSIGHTS
4.1 PESTEL ANALYSIS
4.2 PORTER’S FIVE FORCES
5 REGULATION
6 MARKET OVERVIEW
6.1 DRIVERS
6.1.1 INCREASING INVESTMENT & STRATEGIC INITIATIVES BY MARKET PLAYERS
6.1.2 GOVERNMENT INITIATIVES TO STRENGTHEN LABORATORY INFRASTRUCTURES
6.1.3 GROWING EXPENDITURE ON LAB AUTOMATION TOOLS AND EQUIPMENT
6.1.4 REDUCING HUMAN EFFORTS AND ELIMINATING HUMAN ERROR
6.2 RESTRAINTS
6.2.1 LIMITATION ANALYZING NOVEL COMPLEX PRODUCT
6.2.2 HIGH COST FOR INSTALLATION AND SETUP
6.2.3 UPGRADATION, MAINTENANCE, AND PERIODICAL CHECKUPS
6.3 OPPORTUNITIES
6.3.1 RISING HEALTHCARE EXPENDITURE
6.3.2 STRATEGIC INITIATIVES BY KEY PLAYERS
6.3.3 RISE IN THE NUMBER OF PHARMA COMPANIES
6.4 CHALLENGES
6.4.1 SLOW ADOPTION OF AUTOMATION AMONG SMALL AND MEDIUM SIZED LABORATORIES
6.4.2 LIMITED FEASIBILITY WITH TECHNOLOGY INTEGRATION IN ANALYTICAL LABS
7 GLOBAL LAB AUTOMATION MARKET, BY PRODUCT TYPE
7.1 OVERVIEW
7.2 EQUIPMENT
7.2.1 AUTOMATED WORKSTATIONS
7.2.1.1 AUTOMATED LIQUID HANDLING SYSTEMS
7.2.1.2 AUTOMATED INTEGRATED WORKSTATIONS
7.2.1.3 PIPETTING SYSTEMS
7.2.1.4 MICROPLATE WASHERS
7.2.1.5 REAGENT DISPENSERS
7.2.2 MICROPLATE READERS
7.2.2.1 MULTI-MODE MICROPLATE READERS
7.2.2.2 SINGLE-MODE MICROPLATE READERS
7.2.2.3 AUTOMATED NUCLEIC ACID PURIFICATION SYSTEMS
7.2.2.4 AUTOMATED ELISA SYSTEMS
7.2.3 OFF-THE-SHELF AUTOMATED WORKCELLS
7.2.4 ROBOTIC SYSTEMS
7.2.4.1 ROBOTIC ARMS
7.2.4.2 TRACK ROBOTS
7.2.5 AUTOMATE STORAGE & RETRIEVALS (ASRS)
7.2.6 OTHERS
7.3 ANALYZER
7.3.1 BIO CHEMISTRY ANALYZERS
7.3.2 HAEMATOLOGY ANALYZERS
7.3.3 IMMUNO-BASED ANALYZERS
7.4 SOFTWARE & INFORMATICS
7.4.1 LABORATORY INFORMATION MANAGEMENT SYSTEM (LIMS)
7.4.2 ELECTRONIC LABORATORY NOTEBOOK (ELN)
7.4.3 LABORATORY EXECUTION SYSTEMS (LES)
7.4.4 SCIENTIFIC DATA MANAGEMENT SYSTEMS (SDMS)
8 GLOBAL LAB AUTOMATION MARKET, BY AUTOMATION TYPE
8.1 OVERVIEW
8.2 TOTAL LAB AUTOMATION
8.3 MODULAR AUTOMATION
9 GLOBAL LAB AUTOMATION MARKET, BY APPLICATION
9.1 OVERVIEW
9.2 CLINICAL DIAGNOSTICS
9.3 DRUG DISCOVERY
9.4 GENOMICS SOLUTIONS
9.5 PROTEOMIC SOLUTIONS
9.6 ANALYTICAL CHEMISTRY
9.7 PROTEIN ENGINEERING
9.8 BIO ANALYSIS
9.9 SYSTEM BIOLOGY
9.1 OTHERS
10 GLOBAL LAB AUTOMATION MARKET, BY END USER
10.1 OVERVIEW
10.2 BIOTECHNOLOGY & PHARMACEUTICALS
10.3 HOSPITALS & LABORATORIES
10.4 RESEARCH & ACADEMIC INSTITUTES
10.5 OTHERS
11 GLOBAL LAB AUTOMATION MARKET, BY REGION
11.1 OVERVIEW
11.2 NORTH AMERICA
11.2.1 U.S.
11.2.2 CANADA
11.2.3 MEXICO
11.3 EUROPE
11.3.1 GERMANY
11.3.2 FRANCE
11.3.3 U.K.
11.3.4 ITALY
11.3.5 RUSSIA
11.3.6 SPAIN
11.3.7 NETHERLANDS
11.3.8 SWITZERLAND
11.3.9 TURKEY
11.3.10 BELGIUM
11.3.11 REST OF EUROPE
11.4 ASIA-PACIFIC
11.4.1 CHINA
11.4.2 JAPAN
11.4.3 SOUTH KOREA
11.4.4 INDIA
11.4.5 AUSTRALIA
11.4.6 SINGAPORE
11.4.7 THAILAND
11.4.8 MALAYSIA
11.4.9 INDONESIA
11.4.10 PHILIPPINES
11.4.11 REST OF ASIA-PACIFIC
11.5 SOUTH AMERICA
11.5.1 BRAZIL
11.5.2 ARGENTINA
11.5.3 REST OF SOUTH AMERICA
11.6 MIDDLE EAST AND AFRICA
11.6.1 SOUTH AFRICA
11.6.2 SAUDI ARABIA
11.6.3 U.A.E.
11.6.4 REST OF MIDDLE EAST AND AFRICA
12 GLOBAL LAB AUTOMATION MARKET: COMPANY LANDSCAPE
12.1 COMPANY SHARE ANALYSIS: GLOBAL
12.2 COMPANY SHARE ANALYSIS: NORTH AMERICA
12.3 COMPANY SHARE ANALYSIS: EUROPE
12.4 COMPANY SHARE ANALYSIS: ASIA-PACIFIC
13 SWOT ANALYSIS
14 COMPANY PROFILE
14.1 THERMO FISHER SCIENTIFIC INC.
14.1.1 COMPANY SNAPSHOT
14.1.2 REVENUE ANALYSIS
14.1.3 COMPANY SHARE ANALYSIS
14.1.4 PRODUCT PORTFOLIO
14.1.5 RECENT DEVELOPMENTS
14.2 DANAHER
14.2.1 COMPANY SNAPSHOT
14.2.2 REVENUE ANALYSIS
14.2.3 COMPANY SHARE ANALYSIS
14.2.4 PRODUCT PORTFOLIO
14.2.5 RECENT DEVELOPMENTS
14.3 F. HOFFMANN- LA ROCHE LTD
14.3.1 COMPANY SNAPSHOT
14.3.2 REVENUE ANALYSIS
14.3.3 COMPANY SHARE ANALYSIS
14.3.4 PRODUCT PORTFOLIO
14.3.5 RECENT DEVELOPMENTS
14.4 PERKINELMER INC
14.4.1 COMPANY SNAPSHOT
14.4.2 REVENUE ANALYSIS
14.4.3 COMPANY SHARE ANALYSIS
14.4.4 PRODUCT PORTFOLIO
14.4.5 RECENT DEVELOPMENTS
14.5 BD
14.5.1 COMPANY SNAPSHOT
14.5.2 REVENUE ANALYSIS
14.5.3 COMPANY SHARE ANALYSIS
14.5.4 PRODUCT PORTFOLIO
14.5.5 RECENT DEVELOPMENTS
14.6 ABBOTT
14.6.1 COMPANY SNAPSHOT
14.6.2 REVENUE ANALYSIS
14.6.3 PRODUCT PORTFOLIO
14.6.3 RECENT DEVELOPMENTS
14.7 AGILENT TECHNOLOGIES
14.7.1 COMPANY SNAPSHOT
14.7.2 REVENUE ANALYSIS
14.7.3 PRODUCT PORTFOLIO
14.7.4 RECENT DEVELOPMENTS
14.8 AURORA BIOMED INC.
14.8.1 COMPANY SNAPSHOT
14.8.2 PRODUCT PORTFOLIO
14.8.3 RECENT DEVELOPMENTS
14.9 AZENTA US INC
14.9.1 COMPANY SNAPSHOT
14.9.2 REVENUE ANALYSIS
14.9.3 PRODUCT PORTFOLIO
14.9.4 RECENT DEVELOPMENTS
14.1 BIOMERIEUX
14.10.1 COMPANY SNAPSHOT
14.10.2 REVENUE ANALYSIS
14.10.3 PRODUCT PORTFOLIO
14.10.4 RECENT DEVELOPMENTS
14.11 EPPENDORF SE
14.11.1 COMPANY SNAPSHOT
14.11.2 PRODUCT PORTFOLIO
14.11.3 RECENT DEVELOPMENTS
14.12 HAMILTON COMPANY
14.12.1 COMPANY SNAPSHOT
14.12.2 PRODUCT PORTFOLIO
14.12.3 RECENT DEVELOPMENTS
14.13 HUDSON ROBOTICS
14.13.1 COMPANY SNAPSHOT
14.13.2 PRODUCT PORTFOLIO
14.13.3 RECENT DEVELOPMENTS
14.14 LABLYNX LIMS
14.14.1 COMPANY SNAPSHOT
14.14.2 PRODUCT PORTFOLIO
14.14.3 RECENT DEVELOPMENTS
14.15 LABVANTAGE SOLUTIONS INC.
14.15.1 COMPANY SNAPSHOT
14.15.2 PRODUCT PORTFOLIO
14.15.3 RECENT DEVELOPMENTS
14.16 LABWARE
14.16.1 COMPANY SNAPSHOT
14.16.2 PRODUCT PORTFOLIO
14.16.3 RECENT DEVELOPMENTS
14.17 QIAGEN
14.17.1 COMPANY SNAPSHOT
14.17.2 REVENUE ANALYSIS
14.17.3 PRODUCT PORTFOLIO
14.17.4 RECENT DEVELOPMENTS
14.18 SIEMENS HEALTHCARE GMBH
14.18.1 COMPANY SNAPSHOT
14.18.2 REVENUE ANALYSIS
14.18.3 PRODUCT PORTFOLIO
14.18.4 RECENT DEVELOPMENTS
14.19 TECAN TRADING AG
14.19.1 COMPANY SNAPSHOT
14.19.2 REVENUE ANALYSIS
14.19.3 PRODUCT PORTFOLIO
14.19.4 RECENT DEVELOPMENTS
15 QUESTIONNAIRE
16 RELATED REPORTS
Lista de Tablas
TABLE 1 GLOBAL LAB AUTOMATION MARKET, BY PRODUCT TYPE, 2020-2029 (USD MILLION)
TABLE 2 GLOBAL EQUIPMENT IN LAB AUTOMATION MARKET, BY REGION, 2020-2029 (USD MILLION)
TABLE 3 GLOBAL AUTOMATED WORKSTATIONS IN LAB AUTOMATION MARKET, BY PRODUCT TYPE, 2020-2029 (USD MILLION)
TABLE 4 GLOBAL MICROPLATE READERS IN LAB AUTOMATION MARKET, BY PRODUCT TYPE, 2020-2029 (USD MILLION)
TABLE 5 GLOBAL ROBOTIC SYSTEMS IN LAB AUTOMATION MARKET, BY PRODUCT TYPE, 2020-2029 (USD MILLION)
TABLE 6 GLOBAL ANALYZER IN LAB AUTOMATION MARKET, BY REGION, 2020-2029 (USD MILLION)
TABLE 7 GLOBAL ANALYZER IN LAB AUTOMATION MARKET, BY PRODUCT TYPE, 2020-2029 (USD MILLION)
TABLE 8 GLOBAL SOFTWARE & INFORMATICS IN LAB AUTOMATION MARKET, BY REGION, 2020-2029 (USD MILLION)
TABLE 9 GLOBAL SOFTWARE & INFORMATICS IN LAB AUTOMATION MARKET, BY PRODUCT TYPE, 2020-2029 (USD MILLION)
TABLE 10 GLOBAL LAB AUTOMATION MARKET, BY AUTOMATION TYPE, 2020-2029 (USD MILLION)
TABLE 11 GLOBAL TOTAL LAB AUTOMATION IN LAB AUTOMATION MARKET, BY REGION, 2020-2029 (USD MILLION)
TABLE 12 GLOBAL MODULAR AUTOMATION IN LAB AUTOMATION MARKET, BY REGION, 2020-2029 (USD MILLION)
TABLE 13 GLOBAL LAB AUTOMATION MARKET, BY APPLICATION, 2020-2029 (USD MILLION)
TABLE 14 GLOBAL CLINICAL DIAGNOSTICS IN LAB AUTOMATION MARKET, BY REGION, 2020-2029 (USD MILLION)
TABLE 15 GLOBAL DRUG DISCOVERY IN LAB AUTOMATION MARKET, BY REGION, 2020-2029 (USD MILLION)
TABLE 16 GLOBAL GENOMICS SOLUTIONS IN LAB AUTOMATION MARKET, BY REGION, 2020-2029 (USD MILLION)
TABLE 17 GLOBAL PROTEOMIC SOLUTIONS IN LAB AUTOMATION MARKET, BY REGION, 2020-2029 (USD MILLION)
TABLE 18 GLOBAL ANALYTICAL CHEMISTRY IN LAB AUTOMATION MARKET, BY REGION, 2020-2029 (USD MILLION)
TABLE 19 GLOBAL PROTEIN ENGINEERING IN LAB AUTOMATION MARKET, BY REGION, 2020-2029 (USD MILLION)
TABLE 20 GLOBAL BIO ANALYSIS IN LAB AUTOMATION MARKET, BY REGION, 2020-2029 (USD MILLION)
TABLE 21 GLOBAL SYSTEM BIOLOGY IN LAB AUTOMATION MARKET, BY REGION, 2020-2029 (USD MILLION)
TABLE 22 GLOBAL OTHERS IN LAB AUTOMATION MARKET, BY REGION, 2020-2029 (USD MILLION)
TABLE 23 GLOBAL LAB AUTOMATION MARKET, BY END USER, 2020-2029 (USD MILLION)
TABLE 24 GLOBAL BIOTECHNOLOGY & PHARMACEUTICALS IN LAB AUTOMATION MARKET, BY REGION, 2020-2029 (USD MILLION)
TABLE 25 GLOBAL HOSPITALS & LABORATORIES IN LAB AUTOMATION MARKET, BY REGION, 2020-2029 (USD MILLION)
TABLE 26 GLOBAL RESEARCH & ACADEMIC INSTITUTES IN LAB AUTOMATION MARKET, BY REGION, 2020-2029 (USD MILLION)
TABLE 27 GLOBAL OTHERS IN LAB AUTOMATION MARKET, BY REGION, 2020-2029 (USD MILLION)
TABLE 28 GLOBAL LAB AUTOMATION MARKET, BY REGION, 2020-2029 (USD MILLION)
TABLE 29 NORTH AMERICA LAB AUTOMATION MARKET, BY COUNTRY, 2020-2029 (USD MILLION)
TABLE 30 NORTH AMERICA LAB AUTOMATION MARKET, BY PRODUCT TYPE, 2020-2029 (USD MILLION)
TABLE 31 NORTH AMERICA EQUIPMENT IN LAB AUTOMATION MARKET, BY PRODUCT TYPE, 2020-2029 (USD MILLION)
TABLE 32 NORTH AMERICA AUTOMATED WORKSTATIONS IN LAB AUTOMATION MARKET, BY PRODUCT TYPE, 2020-2029 (USD MILLION)
TABLE 33 NORTH AMERICA MICROPLATE READERS IN LAB AUTOMATION MARKET, BY PRODUCT TYPE, 2020-2029 (USD MILLION)
TABLE 34 NORTH AMERICA ROBOTIC SYSTEMS IN LAB AUTOMATION MARKET, BY PRODUCT TYPE, 2020-2029 (USD MILLION)
TABLE 35 NORTH AMERICA ANALYZER IN LAB AUTOMATION MARKET, BY PRODUCT TYPE , 2020-2029 (USD MILLION)
TABLE 36 NORTH AMERICA SOFTWARE & INFORMATICS IN LAB AUTOMATION MARKET, BY PRODUCT TYPE, 2020-2029 (USD MILLION)
TABLE 37 NORTH AMERICA LAB AUTOMATION MARKET, BY AUTOMATION TYPE, 2020-2029 (USD MILLION)
TABLE 38 NORTH AMERICA LAB AUTOMATION MARKET, BY APPLICATION, 2020-2029 (USD MILLION)
TABLE 39 NORTH AMERICA LAB AUTOMATION MARKET, BY END USER, 2020-2029 (USD MILLION)
TABLE 40 U.S. LAB AUTOMATION MARKET, BY PRODUCT TYPE, 2020-2029 (USD MILLION)
TABLE 41 U.S. EQUIPMENT IN LAB AUTOMATION MARKET, BY PRODUCT TYPE, 2020-2029 (USD MILLION)
TABLE 42 U.S. AUTOMATED WORKSTATIONS IN LAB AUTOMATION MARKET, BY PRODUCT TYPE, 2020-2029 (USD MILLION)
TABLE 43 U.S. MICROPLATE READERS IN LAB AUTOMATION MARKET, BY PRODUCT TYPE, 2020-2029 (USD MILLION)
TABLE 44 U.S. ROBOTIC SYSTEMS IN LAB AUTOMATION MARKET, BY PRODUCT TYPE, 2020-2029 (USD MILLION)
TABLE 45 U.S. ANALYZER IN LAB AUTOMATION MARKET, BY PRODUCT TYPE , 2020-2029 (USD MILLION)
TABLE 46 U.S. SOFTWARE & INFORMATICS IN LAB AUTOMATION MARKET, BY PRODUCT TYPE, 2020-2029 (USD MILLION)
TABLE 47 U.S. LAB AUTOMATION MARKET, BY AUTOMATION TYPE, 2020-2029 (USD MILLION)
TABLE 48 U.S. LAB AUTOMATION MARKET, BY APPLICATION, 2020-2029 (USD MILLION)
TABLE 49 U.S. LAB AUTOMATION MARKET, BY END USER, 2020-2029 (USD MILLION)
TABLE 50 CANADA LAB AUTOMATION MARKET, BY PRODUCT TYPE, 2020-2029 (USD MILLION)
TABLE 51 CANADA EQUIPMENT IN LAB AUTOMATION MARKET, BY PRODUCT TYPE, 2020-2029 (USD MILLION)
TABLE 52 CANADA AUTOMATED WORKSTATIONS IN LAB AUTOMATION MARKET, BY PRODUCT TYPE, 2020-2029 (USD MILLION)
TABLE 53 CANADA MICROPLATE READERS IN LAB AUTOMATION MARKET, BY PRODUCT TYPE, 2020-2029 (USD MILLION)
TABLE 54 CANADA ROBOTIC SYSTEMS IN LAB AUTOMATION MARKET, BY PRODUCT TYPE, 2020-2029 (USD MILLION)
TABLE 55 CANADA ANALYZER IN LAB AUTOMATION MARKET, BY PRODUCT TYPE , 2020-2029 (USD MILLION)
TABLE 56 CANADA SOFTWARE & INFORMATICS IN LAB AUTOMATION MARKET, BY PRODUCT TYPE, 2020-2029 (USD MILLION)
TABLE 57 CANADA LAB AUTOMATION MARKET, BY AUTOMATION TYPE, 2020-2029 (USD MILLION)
TABLE 58 CANADA LAB AUTOMATION MARKET, BY APPLICATION, 2020-2029 (USD MILLION)
TABLE 59 CANADA LAB AUTOMATION MARKET, BY END USER, 2020-2029 (USD MILLION)
TABLE 60 MEXICO LAB AUTOMATION MARKET, BY PRODUCT TYPE, 2020-2029 (USD MILLION)
TABLE 61 MEXICO EQUIPMENT IN LAB AUTOMATION MARKET, BY PRODUCT TYPE, 2020-2029 (USD MILLION)
TABLE 62 MEXICO AUTOMATED WORKSTATIONS IN LAB AUTOMATION MARKET, BY PRODUCT TYPE, 2020-2029 (USD MILLION)
TABLE 63 MEXICO MICROPLATE READERS IN LAB AUTOMATION MARKET, BY PRODUCT TYPE, 2020-2029 (USD MILLION)
TABLE 64 MEXICO ROBOTIC SYSTEMS IN LAB AUTOMATION MARKET, BY PRODUCT TYPE, 2020-2029 (USD MILLION)
TABLE 65 MEXICO ANALYZER IN LAB AUTOMATION MARKET, BY PRODUCT TYPE , 2020-2029 (USD MILLION)
TABLE 66 MEXICO SOFTWARE & INFORMATICS IN LAB AUTOMATION MARKET, BY PRODUCT TYPE, 2020-2029 (USD MILLION)
TABLE 67 MEXICO LAB AUTOMATION MARKET, BY AUTOMATION TYPE, 2020-2029 (USD MILLION)
TABLE 68 MEXICO LAB AUTOMATION MARKET, BY APPLICATION, 2020-2029 (USD MILLION)
TABLE 69 MEXICO LAB AUTOMATION MARKET, BY END USER, 2020-2029 (USD MILLION)
TABLE 70 EUROPE LAB AUTOMATION MARKET, BY COUNTRY, 2020-2029 (USD MILLION)
TABLE 71 EUROPE LAB AUTOMATION MARKET, BY PRODUCT TYPE, 2020-2029 (USD MILLION)
TABLE 72 EUROPE EQUIPMENT IN LAB AUTOMATION MARKET, BY PRODUCT TYPE, 2020-2029 (USD MILLION)
TABLE 73 EUROPE AUTOMATED WORKSTATIONS IN LAB AUTOMATION MARKET, BY PRODUCT TYPE, 2020-2029 (USD MILLION)
TABLE 74 EUROPE MICROPLATE READERS IN LAB AUTOMATION MARKET, BY PRODUCT TYPE, 2020-2029 (USD MILLION)
TABLE 75 EUROPE ROBOTIC SYSTEMS IN LAB AUTOMATION MARKET, BY PRODUCT TYPE, 2020-2029 (USD MILLION)
TABLE 76 EUROPE ANALYZER IN LAB AUTOMATION MARKET, BY PRODUCT TYPE , 2020-2029 (USD MILLION)
TABLE 77 EUROPE SOFTWARE & INFORMATICS IN LAB AUTOMATION MARKET, BY PRODUCT TYPE, 2020-2029 (USD MILLION)
TABLE 78 EUROPE LAB AUTOMATION MARKET, BY AUTOMATION TYPE, 2020-2029 (USD MILLION)
TABLE 79 EUROPE LAB AUTOMATION MARKET, BY APPLICATION, 2020-2029 (USD MILLION)
TABLE 80 EUROPE LAB AUTOMATION MARKET, BY END USER, 2020-2029 (USD MILLION)
TABLE 81 GERMANY LAB AUTOMATION MARKET, BY PRODUCT TYPE, 2020-2029 (USD MILLION)
TABLE 82 GERMANY EQUIPMENT IN LAB AUTOMATION MARKET, BY PRODUCT TYPE, 2020-2029 (USD MILLION)
TABLE 83 GERMANY AUTOMATED WORKSTATIONS IN LAB AUTOMATION MARKET, BY PRODUCT TYPE, 2020-2029 (USD MILLION)
TABLE 84 GERMANY MICROPLATE READERS IN LAB AUTOMATION MARKET, BY PRODUCT TYPE, 2020-2029 (USD MILLION)
TABLE 85 GERMANY ROBOTIC SYSTEMS IN LAB AUTOMATION MARKET, BY PRODUCT TYPE, 2020-2029 (USD MILLION)
TABLE 86 GERMANY ANALYZER IN LAB AUTOMATION MARKET, BY PRODUCT TYPE , 2020-2029 (USD MILLION)
TABLE 87 GERMANY SOFTWARE & INFORMATICS IN LAB AUTOMATION MARKET, BY PRODUCT TYPE, 2020-2029 (USD MILLION)
TABLE 88 GERMANY LAB AUTOMATION MARKET, BY AUTOMATION TYPE, 2020-2029 (USD MILLION)
TABLE 89 GERMANY LAB AUTOMATION MARKET, BY APPLICATION, 2020-2029 (USD MILLION)
TABLE 90 GERMANY LAB AUTOMATION MARKET, BY END USER, 2020-2029 (USD MILLION)
TABLE 91 FRANCE LAB AUTOMATION MARKET, BY PRODUCT TYPE, 2020-2029 (USD MILLION)
TABLE 92 FRANCE EQUIPMENT IN LAB AUTOMATION MARKET, BY PRODUCT TYPE, 2020-2029 (USD MILLION)
TABLE 93 FRANCE AUTOMATED WORKSTATIONS IN LAB AUTOMATION MARKET, BY PRODUCT TYPE, 2020-2029 (USD MILLION)
TABLE 94 FRANCE MICROPLATE READERS IN LAB AUTOMATION MARKET, BY PRODUCT TYPE, 2020-2029 (USD MILLION)
TABLE 95 FRANCE ROBOTIC SYSTEMS IN LAB AUTOMATION MARKET, BY PRODUCT TYPE, 2020-2029 (USD MILLION)
TABLE 96 FRANCE ANALYZER IN LAB AUTOMATION MARKET, BY PRODUCT TYPE, 2020-2029 (USD MILLION)
TABLE 97 FRANCE SOFTWARE & INFORMATICS IN LAB AUTOMATION MARKET, BY PRODUCT TYPE, 2020-2029 (USD MILLION)
TABLE 98 FRANCE LAB AUTOMATION MARKET, BY AUTOMATION TYPE, 2020-2029 (USD MILLION)
TABLE 99 FRANCE LAB AUTOMATION MARKET, BY APPLICATION, 2020-2029 (USD MILLION)
TABLE 100 FRANCE LAB AUTOMATION MARKET, BY END USER, 2020-2029 (USD MILLION)
TABLE 101 U.K. LAB AUTOMATION MARKET, BY PRODUCT TYPE, 2020-2029 (USD MILLION)
TABLE 102 U.K. EQUIPMENT IN LAB AUTOMATION MARKET, BY PRODUCT TYPE, 2020-2029 (USD MILLION)
TABLE 103 U.K. AUTOMATED WORKSTATIONS IN LAB AUTOMATION MARKET, BY PRODUCT TYPE, 2020-2029 (USD MILLION)
TABLE 104 U.K. MICROPLATE READERS IN LAB AUTOMATION MARKET, BY PRODUCT TYPE, 2020-2029 (USD MILLION)
TABLE 105 U.K. ROBOTIC SYSTEMS IN LAB AUTOMATION MARKET, BY PRODUCT TYPE, 2020-2029 (USD MILLION)
TABLE 106 U.K. ANALYZER IN LAB AUTOMATION MARKET, BY PRODUCT TYPE, 2020-2029 (USD MILLION)
TABLE 107 U.K. SOFTWARE & INFORMATICS IN LAB AUTOMATION MARKET, BY PRODUCT TYPE, 2020-2029 (USD MILLION)
TABLE 108 U.K. LAB AUTOMATION MARKET, BY AUTOMATION TYPE, 2020-2029 (USD MILLION)
TABLE 109 U.K. LAB AUTOMATION MARKET, BY APPLICATION, 2020-2029 (USD MILLION)
TABLE 110 U.K. LAB AUTOMATION MARKET, BY END USER, 2020-2029 (USD MILLION)
TABLE 111 ITALY LAB AUTOMATION MARKET, BY PRODUCT TYPE, 2020-2029 (USD MILLION)
TABLE 112 ITALY EQUIPMENT IN LAB AUTOMATION MARKET, BY PRODUCT TYPE, 2020-2029 (USD MILLION)
TABLE 113 ITALY AUTOMATED WORKSTATIONS IN LAB AUTOMATION MARKET, BY PRODUCT TYPE, 2020-2029 (USD MILLION)
TABLE 114 ITALY MICROPLATE READERS IN LAB AUTOMATION MARKET, BY PRODUCT TYPE, 2020-2029 (USD MILLION)
TABLE 115 ITALY ROBOTIC SYSTEMS IN LAB AUTOMATION MARKET, BY PRODUCT TYPE, 2020-2029 (USD MILLION)
TABLE 116 ITALY ANALYZER IN LAB AUTOMATION MARKET, BY PRODUCT TYPE , 2020-2029 (USD MILLION)
TABLE 117 ITALY SOFTWARE & INFORMATICS IN LAB AUTOMATION MARKET, BY PRODUCT TYPE, 2020-2029 (USD MILLION)
TABLE 118 ITALY LAB AUTOMATION MARKET, BY AUTOMATION TYPE, 2020-2029 (USD MILLION)
TABLE 119 ITALY LAB AUTOMATION MARKET, BY APPLICATION, 2020-2029 (USD MILLION)
TABLE 120 ITALY LAB AUTOMATION MARKET, BY END USER, 2020-2029 (USD MILLION)
TABLE 121 RUSSIA LAB AUTOMATION MARKET, BY PRODUCT TYPE, 2020-2029 (USD MILLION)
TABLE 122 RUSSIA EQUIPMENT IN LAB AUTOMATION MARKET, BY PRODUCT TYPE, 2020-2029 (USD MILLION)
TABLE 123 RUSSIA AUTOMATED WORKSTATIONS IN LAB AUTOMATION MARKET, BY PRODUCT TYPE, 2020-2029 (USD MILLION)
TABLE 124 RUSSIA MICROPLATE READERS IN LAB AUTOMATION MARKET, BY PRODUCT TYPE, 2020-2029 (USD MILLION)
TABLE 125 RUSSIA ROBOTIC SYSTEMS IN LAB AUTOMATION MARKET, BY PRODUCT TYPE, 2020-2029 (USD MILLION)
TABLE 126 RUSSIA ANALYZER IN LAB AUTOMATION MARKET, BY PRODUCT TYPE , 2020-2029 (USD MILLION)
TABLE 127 RUSSIA SOFTWARE & INFORMATICS IN LAB AUTOMATION MARKET, BY PRODUCT TYPE, 2020-2029 (USD MILLION)
TABLE 128 RUSSIA LAB AUTOMATION MARKET, BY AUTOMATION TYPE, 2020-2029 (USD MILLION)
TABLE 129 RUSSIA LAB AUTOMATION MARKET, BY APPLICATION, 2020-2029 (USD MILLION)
TABLE 130 RUSSIA LAB AUTOMATION MARKET, BY END USER, 2020-2029 (USD MILLION)
TABLE 131 SPAIN LAB AUTOMATION MARKET, BY PRODUCT TYPE, 2020-2029 (USD MILLION)
TABLE 132 SPAIN EQUIPMENT IN LAB AUTOMATION MARKET, BY PRODUCT TYPE, 2020-2029 (USD MILLION)
TABLE 133 SPAIN AUTOMATED WORKSTATIONS IN LAB AUTOMATION MARKET, BY PRODUCT TYPE, 2020-2029 (USD MILLION)
TABLE 134 SPAIN MICROPLATE READERS IN LAB AUTOMATION MARKET, BY PRODUCT TYPE, 2020-2029 (USD MILLION)
TABLE 135 SPAIN ROBOTIC SYSTEMS IN LAB AUTOMATION MARKET, BY PRODUCT TYPE, 2020-2029 (USD MILLION)
TABLE 136 SPAIN ANALYZER IN LAB AUTOMATION MARKET, BY PRODUCT TYPE , 2020-2029 (USD MILLION)
TABLE 137 SPAIN SOFTWARE & INFORMATICS IN LAB AUTOMATION MARKET, BY PRODUCT TYPE, 2020-2029 (USD MILLION)
TABLE 138 SPAIN LAB AUTOMATION MARKET, BY AUTOMATION TYPE, 2020-2029 (USD MILLION)
TABLE 139 SPAIN LAB AUTOMATION MARKET, BY APPLICATION, 2020-2029 (USD MILLION)
TABLE 140 SPAIN LAB AUTOMATION MARKET, BY END USER, 2020-2029 (USD MILLION)
TABLE 141 NETHERLANDS LAB AUTOMATION MARKET, BY PRODUCT TYPE, 2020-2029 (USD MILLION)
TABLE 142 NETHERLANDS EQUIPMENT IN LAB AUTOMATION MARKET, BY PRODUCT TYPE, 2020-2029 (USD MILLION)
TABLE 143 NETHERLANDS AUTOMATED WORKSTATIONS IN LAB AUTOMATION MARKET, BY PRODUCT TYPE, 2020-2029 (USD MILLION)
TABLE 144 NETHERLANDS MICROPLATE READERS IN LAB AUTOMATION MARKET, BY PRODUCT TYPE, 2020-2029 (USD MILLION)
TABLE 145 NETHERLANDS ROBOTIC SYSTEMS IN LAB AUTOMATION MARKET, BY PRODUCT TYPE, 2020-2029 (USD MILLION)
TABLE 146 NETHERLANDS ANALYZER IN LAB AUTOMATION MARKET, BY PRODUCT TYPE , 2020-2029 (USD MILLION)
TABLE 147 NETHERLANDS SOFTWARE & INFORMATICS IN LAB AUTOMATION MARKET, BY PRODUCT TYPE, 2020-2029 (USD MILLION)
TABLE 148 NETHERLANDS LAB AUTOMATION MARKET, BY AUTOMATION TYPE, 2020-2029 (USD MILLION)
TABLE 149 NETHERLANDS LAB AUTOMATION MARKET, BY APPLICATION, 2020-2029 (USD MILLION)
TABLE 150 NETHERLANDS LAB AUTOMATION MARKET, BY END USER, 2020-2029 (USD MILLION)
TABLE 151 SWITZERLAND LAB AUTOMATION MARKET, BY PRODUCT TYPE, 2020-2029 (USD MILLION)
TABLE 152 SWITZERLAND EQUIPMENT IN LAB AUTOMATION MARKET, BY PRODUCT TYPE, 2020-2029 (USD MILLION)
TABLE 153 SWITZERLAND AUTOMATED WORKSTATIONS IN LAB AUTOMATION MARKET, BY PRODUCT TYPE, 2020-2029 (USD MILLION)
TABLE 154 SWITZERLAND MICROPLATE READERS IN LAB AUTOMATION MARKET, BY PRODUCT TYPE, 2020-2029 (USD MILLION)
TABLE 155 SWITZERLAND ROBOTIC SYSTEMS IN LAB AUTOMATION MARKET, BY PRODUCT TYPE, 2020-2029 (USD MILLION)
TABLE 156 SWITZERLAND ANALYZER IN LAB AUTOMATION MARKET, BY PRODUCT TYPE , 2020-2029 (USD MILLION)
TABLE 157 SWITZERLAND SOFTWARE & INFORMATICS IN LAB AUTOMATION MARKET, BY PRODUCT TYPE, 2020-2029 (USD MILLION)
TABLE 158 SWITZERLAND LAB AUTOMATION MARKET, BY AUTOMATION TYPE, 2020-2029 (USD MILLION)
TABLE 159 SWITZERLAND LAB AUTOMATION MARKET, BY APPLICATION, 2020-2029 (USD MILLION)
TABLE 160 SWITZERLAND LAB AUTOMATION MARKET, BY END USER, 2020-2029 (USD MILLION)
TABLE 161 TURKEY LAB AUTOMATION MARKET, BY PRODUCT TYPE, 2020-2029 (USD MILLION)
TABLE 162 TURKEY EQUIPMENT IN LAB AUTOMATION MARKET, BY PRODUCT TYPE, 2020-2029 (USD MILLION)
TABLE 163 TURKEY AUTOMATED WORKSTATIONS IN LAB AUTOMATION MARKET, BY PRODUCT TYPE, 2020-2029 (USD MILLION)
TABLE 164 TURKEY MICROPLATE READERS IN LAB AUTOMATION MARKET, BY PRODUCT TYPE, 2020-2029 (USD MILLION)
TABLE 165 TURKEY ROBOTIC SYSTEMS IN LAB AUTOMATION MARKET, BY PRODUCT TYPE, 2020-2029 (USD MILLION)
TABLE 166 TURKEY ANALYZER IN LAB AUTOMATION MARKET, BY PRODUCT TYPE , 2020-2029 (USD MILLION)
TABLE 167 TURKEY SOFTWARE & INFORMATICS IN LAB AUTOMATION MARKET, BY PRODUCT TYPE, 2020-2029 (USD MILLION)
TABLE 168 TURKEY LAB AUTOMATION MARKET, BY AUTOMATION TYPE, 2020-2029 (USD MILLION)
TABLE 169 TURKEY LAB AUTOMATION MARKET, BY APPLICATION, 2020-2029 (USD MILLION)
TABLE 170 TURKEY LAB AUTOMATION MARKET, BY END USER, 2020-2029 (USD MILLION)
TABLE 171 BELGIUM LAB AUTOMATION MARKET, BY PRODUCT TYPE, 2020-2029 (USD MILLION)
TABLE 172 BELGIUM EQUIPMENT IN LAB AUTOMATION MARKET, BY PRODUCT TYPE, 2020-2029 (USD MILLION)
TABLE 173 BELGIUM AUTOMATED WORKSTATIONS IN LAB AUTOMATION MARKET, BY PRODUCT TYPE, 2020-2029 (USD MILLION)
TABLE 174 BELGIUM MICROPLATE READERS IN LAB AUTOMATION MARKET, BY PRODUCT TYPE, 2020-2029 (USD MILLION)
TABLE 175 BELGIUM ROBOTIC SYSTEMS IN LAB AUTOMATION MARKET, BY PRODUCT TYPE, 2020-2029 (USD MILLION)
TABLE 176 BELGIUM ANALYZER IN LAB AUTOMATION MARKET, BY PRODUCT TYPE , 2020-2029 (USD MILLION)
TABLE 177 BELGIUM SOFTWARE & INFORMATICS IN LAB AUTOMATION MARKET, BY PRODUCT TYPE, 2020-2029 (USD MILLION)
TABLE 178 BELGIUM LAB AUTOMATION MARKET, BY AUTOMATION TYPE, 2020-2029 (USD MILLION)
TABLE 179 BELGIUM LAB AUTOMATION MARKET, BY APPLICATION, 2020-2029 (USD MILLION)
TABLE 180 BELGIUM LAB AUTOMATION MARKET, BY END USER, 2020-2029 (USD MILLION)
TABLE 181 REST OF EUROPE LAB AUTOMATION MARKET, BY PRODUCT TYPE, 2020-2029 (USD MILLION)
TABLE 182 ASIA-PACIFIC LAB AUTOMATION MARKET, BY COUNTRY, 2020-2029 (USD MILLION)
TABLE 183 ASIA-PACIFIC LAB AUTOMATION MARKET, BY PRODUCT TYPE, 2020-2029 (USD MILLION)
TABLE 184 ASIA-PACIFIC EQUIPMENT IN LAB AUTOMATION MARKET, BY PRODUCT TYPE, 2020-2029 (USD MILLION)
TABLE 185 ASIA-PACIFIC AUTOMATED WORKSTATIONS IN LAB AUTOMATION MARKET, BY PRODUCT TYPE, 2020-2029 (USD MILLION)
TABLE 186 ASIA-PACIFIC MICROPLATE READERS IN LAB AUTOMATION MARKET, BY PRODUCT TYPE, 2020-2029 (USD MILLION)
TABLE 187 ASIA-PACIFIC ROBOTIC SYSTEMS IN LAB AUTOMATION MARKET, BY PRODUCT TYPE, 2020-2029 (USD MILLION)
TABLE 188 ASIA-PACIFIC ANALYZER IN LAB AUTOMATION MARKET, BY PRODUCT TYPE , 2020-2029 (USD MILLION)
TABLE 189 ASIA-PACIFIC SOFTWARE & INFORMATICS IN LAB AUTOMATION MARKET, BY PRODUCT TYPE, 2020-2029 (USD MILLION)
TABLE 190 ASIA-PACIFIC LAB AUTOMATION MARKET, BY AUTOMATION TYPE, 2020-2029 (USD MILLION)
TABLE 191 ASIA-PACIFIC LAB AUTOMATION MARKET, BY APPLICATION, 2020-2029 (USD MILLION)
TABLE 192 ASIA-PACIFIC LAB AUTOMATION MARKET, BY END USER, 2020-2029 (USD MILLION)
TABLE 193 CHINA LAB AUTOMATION MARKET, BY PRODUCT TYPE, 2020-2029 (USD MILLION)
TABLE 194 CHINA EQUIPMENT IN LAB AUTOMATION MARKET, BY PRODUCT TYPE, 2020-2029 (USD MILLION)
TABLE 195 CHINA AUTOMATED WORKSTATIONS IN LAB AUTOMATION MARKET, BY PRODUCT TYPE, 2020-2029 (USD MILLION)
TABLE 196 CHINA MICROPLATE READERS IN LAB AUTOMATION MARKET, BY PRODUCT TYPE, 2020-2029 (USD MILLION)
TABLE 197 CHINA ROBOTIC SYSTEMS IN LAB AUTOMATION MARKET, BY PRODUCT TYPE, 2020-2029 (USD MILLION)
TABLE 198 CHINA ANALYZER IN LAB AUTOMATION MARKET, BY PRODUCT TYPE , 2020-2029 (USD MILLION)
TABLE 199 CHINA SOFTWARE & INFORMATICS IN LAB AUTOMATION MARKET, BY PRODUCT TYPE, 2020-2029 (USD MILLION)
TABLE 200 CHINA LAB AUTOMATION MARKET, BY AUTOMATION TYPE, 2020-2029 (USD MILLION)
TABLE 201 CHINA LAB AUTOMATION MARKET, BY APPLICATION, 2020-2029 (USD MILLION)
TABLE 202 CHINA LAB AUTOMATION MARKET, BY END USER, 2020-2029 (USD MILLION)
TABLE 203 JAPAN LAB AUTOMATION MARKET, BY PRODUCT TYPE, 2020-2029 (USD MILLION)
TABLE 204 JAPAN EQUIPMENT IN LAB AUTOMATION MARKET, BY PRODUCT TYPE, 2020-2029 (USD MILLION)
TABLE 205 JAPAN AUTOMATED WORKSTATIONS IN LAB AUTOMATION MARKET, BY PRODUCT TYPE, 2020-2029 (USD MILLION)
TABLE 206 JAPAN MICROPLATE READERS IN LAB AUTOMATION MARKET, BY PRODUCT TYPE, 2020-2029 (USD MILLION)
TABLE 207 JAPAN ROBOTIC SYSTEMS IN LAB AUTOMATION MARKET, BY PRODUCT TYPE, 2020-2029 (USD MILLION)
TABLE 208 JAPAN ANALYZER IN LAB AUTOMATION MARKET, BY PRODUCT TYPE , 2020-2029 (USD MILLION)
TABLE 209 JAPAN SOFTWARE & INFORMATICS IN LAB AUTOMATION MARKET, BY PRODUCT TYPE, 2020-2029 (USD MILLION)
TABLE 210 JAPAN LAB AUTOMATION MARKET, BY AUTOMATION TYPE, 2020-2029 (USD MILLION)
TABLE 211 JAPAN LAB AUTOMATION MARKET, BY APPLICATION, 2020-2029 (USD MILLION)
TABLE 212 JAPAN LAB AUTOMATION MARKET, BY END USER, 2020-2029 (USD MILLION)
TABLE 213 SOUTH KOREA LAB AUTOMATION MARKET, BY PRODUCT TYPE, 2020-2029 (USD MILLION)
TABLE 214 SOUTH KOREA EQUIPMENT IN LAB AUTOMATION MARKET, BY PRODUCT TYPE, 2020-2029 (USD MILLION)
TABLE 215 SOUTH KOREA AUTOMATED WORKSTATIONS IN LAB AUTOMATION MARKET, BY PRODUCT TYPE, 2020-2029 (USD MILLION)
TABLE 216 SOUTH KOREA MICROPLATE READERS IN LAB AUTOMATION MARKET, BY PRODUCT TYPE, 2020-2029 (USD MILLION)
TABLE 217 SOUTH KOREA ROBOTIC SYSTEMS IN LAB AUTOMATION MARKET, BY PRODUCT TYPE, 2020-2029 (USD MILLION)
TABLE 218 SOUTH KOREA ANALYZER IN LAB AUTOMATION MARKET, BY PRODUCT TYPE , 2020-2029 (USD MILLION)
TABLE 219 SOUTH KOREA SOFTWARE & INFORMATICS IN LAB AUTOMATION MARKET, BY PRODUCT TYPE, 2020-2029 (USD MILLION)
TABLE 220 SOUTH KOREA LAB AUTOMATION MARKET, BY AUTOMATION TYPE, 2020-2029 (USD MILLION)
TABLE 221 SOUTH KOREA LAB AUTOMATION MARKET, BY APPLICATION, 2020-2029 (USD MILLION)
TABLE 222 SOUTH KOREA LAB AUTOMATION MARKET, BY END USER, 2020-2029 (USD MILLION)
TABLE 223 INDIA LAB AUTOMATION MARKET, BY PRODUCT TYPE, 2020-2029 (USD MILLION)
TABLE 224 INDIA EQUIPMENT IN LAB AUTOMATION MARKET, BY PRODUCT TYPE, 2020-2029 (USD MILLION)
TABLE 225 INDIA AUTOMATED WORKSTATIONS IN LAB AUTOMATION MARKET, BY PRODUCT TYPE, 2020-2029 (USD MILLION)
TABLE 226 INDIA MICROPLATE READERS IN LAB AUTOMATION MARKET, BY PRODUCT TYPE, 2020-2029 (USD MILLION)
TABLE 227 INDIA ROBOTIC SYSTEMS IN LAB AUTOMATION MARKET, BY PRODUCT TYPE, 2020-2029 (USD MILLION)
TABLE 228 INDIA ANALYZER IN LAB AUTOMATION MARKET, BY PRODUCT TYPE , 2020-2029 (USD MILLION)
TABLE 229 INDIA SOFTWARE & INFORMATICS IN LAB AUTOMATION MARKET, BY PRODUCT TYPE, 2020-2029 (USD MILLION)
TABLE 230 INDIA LAB AUTOMATION MARKET, BY AUTOMATION TYPE, 2020-2029 (USD MILLION)
TABLE 231 INDIA LAB AUTOMATION MARKET, BY APPLICATION, 2020-2029 (USD MILLION)
TABLE 232 INDIA LAB AUTOMATION MARKET, BY END USER, 2020-2029 (USD MILLION)
TABLE 233 AUSTRALIA LAB AUTOMATION MARKET, BY PRODUCT TYPE, 2020-2029 (USD MILLION)
TABLE 234 AUSTRALIA EQUIPMENT IN LAB AUTOMATION MARKET, BY PRODUCT TYPE, 2020-2029 (USD MILLION)
TABLE 235 AUSTRALIA AUTOMATED WORKSTATIONS IN LAB AUTOMATION MARKET, BY PRODUCT TYPE, 2020-2029 (USD MILLION)
TABLE 236 AUSTRALIA MICROPLATE READERS IN LAB AUTOMATION MARKET, BY PRODUCT TYPE, 2020-2029 (USD MILLION)
TABLE 237 AUSTRALIA ROBOTIC SYSTEMS IN LAB AUTOMATION MARKET, BY PRODUCT TYPE, 2020-2029 (USD MILLION)
TABLE 238 AUSTRALIA ANALYZER IN LAB AUTOMATION MARKET, BY PRODUCT TYPE , 2020-2029 (USD MILLION)
TABLE 239 AUSTRALIA SOFTWARE & INFORMATICS IN LAB AUTOMATION MARKET, BY PRODUCT TYPE, 2020-2029 (USD MILLION)
TABLE 240 AUSTRALIA LAB AUTOMATION MARKET, BY AUTOMATION TYPE, 2020-2029 (USD MILLION)
TABLE 241 AUSTRALIA LAB AUTOMATION MARKET, BY APPLICATION, 2020-2029 (USD MILLION)
TABLE 242 AUSTRALIA LAB AUTOMATION MARKET, BY END USER, 2020-2029 (USD MILLION)
TABLE 243 SINGAPORE LAB AUTOMATION MARKET, BY PRODUCT TYPE, 2020-2029 (USD MILLION)
TABLE 244 SINGAPORE EQUIPMENT IN LAB AUTOMATION MARKET, BY PRODUCT TYPE, 2020-2029 (USD MILLION)
TABLE 245 SINGAPORE AUTOMATED WORKSTATIONS IN LAB AUTOMATION MARKET, BY PRODUCT TYPE, 2020-2029 (USD MILLION)
TABLE 246 SINGAPORE MICROPLATE READERS IN LAB AUTOMATION MARKET, BY PRODUCT TYPE, 2020-2029 (USD MILLION)
TABLE 247 SINGAPORE ROBOTIC SYSTEMS IN LAB AUTOMATION MARKET, BY PRODUCT TYPE, 2020-2029 (USD MILLION)
TABLE 248 SINGAPORE ANALYZER IN LAB AUTOMATION MARKET, BY PRODUCT TYPE , 2020-2029 (USD MILLION)
TABLE 249 SINGAPORE SOFTWARE & INFORMATICS IN LAB AUTOMATION MARKET, BY PRODUCT TYPE, 2020-2029 (USD MILLION)
TABLE 250 SINGAPORE LAB AUTOMATION MARKET, BY AUTOMATION TYPE, 2020-2029 (USD MILLION)
TABLE 251 SINGAPORE LAB AUTOMATION MARKET, BY APPLICATION, 2020-2029 (USD MILLION)
TABLE 252 SINGAPORE LAB AUTOMATION MARKET, BY END USER, 2020-2029 (USD MILLION)
TABLE 253 THAILAND LAB AUTOMATION MARKET, BY PRODUCT TYPE, 2020-2029 (USD MILLION)
TABLE 254 THAILAND EQUIPMENT IN LAB AUTOMATION MARKET, BY PRODUCT TYPE, 2020-2029 (USD MILLION)
TABLE 255 THAILAND AUTOMATED WORKSTATIONS IN LAB AUTOMATION MARKET, BY PRODUCT TYPE, 2020-2029 (USD MILLION)
TABLE 256 THAILAND MICROPLATE READERS IN LAB AUTOMATION MARKET, BY PRODUCT TYPE, 2020-2029 (USD MILLION)
TABLE 257 THAILAND ROBOTIC SYSTEMS IN LAB AUTOMATION MARKET, BY PRODUCT TYPE, 2020-2029 (USD MILLION)
TABLE 258 THAILAND ANALYZER IN LAB AUTOMATION MARKET, BY PRODUCT TYPE , 2020-2029 (USD MILLION)
TABLE 259 THAILAND SOFTWARE & INFORMATICS IN LAB AUTOMATION MARKET, BY PRODUCT TYPE, 2020-2029 (USD MILLION)
TABLE 260 THAILAND LAB AUTOMATION MARKET, BY AUTOMATION TYPE, 2020-2029 (USD MILLION)
TABLE 261 THAILAND LAB AUTOMATION MARKET, BY APPLICATION, 2020-2029 (USD MILLION)
TABLE 262 THAILAND LAB AUTOMATION MARKET, BY END USER, 2020-2029 (USD MILLION)
TABLE 263 MALAYSIA LAB AUTOMATION MARKET, BY PRODUCT TYPE, 2020-2029 (USD MILLION)
TABLE 264 MALAYSIA EQUIPMENT IN LAB AUTOMATION MARKET, BY PRODUCT TYPE, 2020-2029 (USD MILLION)
TABLE 265 MALAYSIA AUTOMATED WORKSTATIONS IN LAB AUTOMATION MARKET, BY PRODUCT TYPE, 2020-2029 (USD MILLION)
TABLE 266 MALAYSIA MICROPLATE READERS IN LAB AUTOMATION MARKET, BY PRODUCT TYPE, 2020-2029 (USD MILLION)
TABLE 267 MALAYSIA ROBOTIC SYSTEMS IN LAB AUTOMATION MARKET, BY PRODUCT TYPE, 2020-2029 (USD MILLION)
TABLE 268 MALAYSIA ANALYZER IN LAB AUTOMATION MARKET, BY PRODUCT TYPE , 2020-2029 (USD MILLION)
TABLE 269 MALAYSIA SOFTWARE & INFORMATICS IN LAB AUTOMATION MARKET, BY PRODUCT TYPE, 2020-2029 (USD MILLION)
TABLE 270 MALAYSIA LAB AUTOMATION MARKET, BY AUTOMATION TYPE, 2020-2029 (USD MILLION)
TABLE 271 MALAYSIA LAB AUTOMATION MARKET, BY APPLICATION, 2020-2029 (USD MILLION)
TABLE 272 MALAYSIA LAB AUTOMATION MARKET, BY END USER, 2020-2029 (USD MILLION)
TABLE 273 INDONESIA LAB AUTOMATION MARKET, BY PRODUCT TYPE, 2020-2029 (USD MILLION)
TABLE 274 INDONESIA EQUIPMENT IN LAB AUTOMATION MARKET, BY PRODUCT TYPE, 2020-2029 (USD MILLION)
TABLE 275 INDONESIA AUTOMATED WORKSTATIONS IN LAB AUTOMATION MARKET, BY PRODUCT TYPE, 2020-2029 (USD MILLION)
TABLE 276 INDONESIA MICROPLATE READERS IN LAB AUTOMATION MARKET, BY PRODUCT TYPE, 2020-2029 (USD MILLION)
TABLE 277 INDONESIA ROBOTIC SYSTEMS IN LAB AUTOMATION MARKET, BY PRODUCT TYPE, 2020-2029 (USD MILLION)
TABLE 278 INDONESIA ANALYZER IN LAB AUTOMATION MARKET, BY PRODUCT TYPE , 2020-2029 (USD MILLION)
TABLE 279 INDONESIA SOFTWARE & INFORMATICS IN LAB AUTOMATION MARKET, BY PRODUCT TYPE, 2020-2029 (USD MILLION)
TABLE 280 INDONESIA LAB AUTOMATION MARKET, BY AUTOMATION TYPE, 2020-2029 (USD MILLION)
TABLE 281 INDONESIA LAB AUTOMATION MARKET, BY APPLICATION, 2020-2029 (USD MILLION)
TABLE 282 INDONESIA LAB AUTOMATION MARKET, BY END USER, 2020-2029 (USD MILLION)
TABLE 283 PHILIPPINES LAB AUTOMATION MARKET, BY PRODUCT TYPE, 2020-2029 (USD MILLION)
TABLE 284 PHILIPPINES EQUIPMENT IN LAB AUTOMATION MARKET, BY PRODUCT TYPE, 2020-2029 (USD MILLION)
TABLE 285 PHILIPPINES AUTOMATED WORKSTATIONS IN LAB AUTOMATION MARKET, BY PRODUCT TYPE, 2020-2029 (USD MILLION)
TABLE 286 PHILIPPINES MICROPLATE READERS IN LAB AUTOMATION MARKET, BY PRODUCT TYPE, 2020-2029 (USD MILLION)
TABLE 287 PHILIPPINES ROBOTIC SYSTEMS IN LAB AUTOMATION MARKET, BY PRODUCT TYPE, 2020-2029 (USD MILLION)
TABLE 288 PHILIPPINES ANALYZER IN LAB AUTOMATION MARKET, BY PRODUCT TYPE , 2020-2029 (USD MILLION)
TABLE 289 PHILIPPINES SOFTWARE & INFORMATICS IN LAB AUTOMATION MARKET, BY PRODUCT TYPE, 2020-2029 (USD MILLION)
TABLE 290 PHILIPPINES LAB AUTOMATION MARKET, BY AUTOMATION TYPE, 2020-2029 (USD MILLION)
TABLE 291 PHILIPPINES LAB AUTOMATION MARKET, BY APPLICATION, 2020-2029 (USD MILLION)
TABLE 292 PHILIPPINES LAB AUTOMATION MARKET, BY END USER, 2020-2029 (USD MILLION)
TABLE 293 REST OF ASIA-PACIFIC LAB AUTOMATION MARKET, BY PRODUCT TYPE, 2020-2029 (USD MILLION)
TABLE 294 SOUTH AMERICA LAB AUTOMATION MARKET, BY COUNTRY, 2020-2029 (USD MILLION)
TABLE 295 SOUTH AMERICA LAB AUTOMATION MARKET, BY PRODUCT TYPE, 2020-2029 (USD MILLION)
TABLE 296 SOUTH AMERICA EQUIPMENT IN LAB AUTOMATION MARKET, BY PRODUCT TYPE, 2020-2029 (USD MILLION)
TABLE 297 SOUTH AMERICA AUTOMATED WORKSTATIONS IN LAB AUTOMATION MARKET, BY PRODUCT TYPE, 2020-2029 (USD MILLION)
TABLE 298 SOUTH AMERICA MICROPLATE READERS IN LAB AUTOMATION MARKET, BY PRODUCT TYPE, 2020-2029 (USD MILLION)
TABLE 299 SOUTH AMERICA ROBOTIC SYSTEMS IN LAB AUTOMATION MARKET, BY PRODUCT TYPE, 2020-2029 (USD MILLION)
TABLE 300 SOUTH AMERICA ANALYZER IN LAB AUTOMATION MARKET, BY PRODUCT TYPE , 2020-2029 (USD MILLION)
TABLE 301 SOUTH AMERICA SOFTWARE & INFORMATICS IN LAB AUTOMATION MARKET, BY PRODUCT TYPE, 2020-2029 (USD MILLION)
TABLE 302 SOUTH AMERICA LAB AUTOMATION MARKET, BY AUTOMATION TYPE, 2020-2029 (USD MILLION)
TABLE 303 SOUTH AMERICA LAB AUTOMATION MARKET, BY APPLICATION, 2020-2029 (USD MILLION)
TABLE 304 SOUTH AMERICA LAB AUTOMATION MARKET, BY END USER, 2020-2029 (USD MILLION)
TABLE 305 BRAZIL LAB AUTOMATION MARKET, BY PRODUCT TYPE, 2020-2029 (USD MILLION)
TABLE 306 BRAZIL EQUIPMENT IN LAB AUTOMATION MARKET, BY PRODUCT TYPE, 2020-2029 (USD MILLION)
TABLE 307 BRAZIL AUTOMATED WORKSTATIONS IN LAB AUTOMATION MARKET, BY PRODUCT TYPE, 2020-2029 (USD MILLION)
TABLE 308 BRAZIL MICROPLATE READERS IN LAB AUTOMATION MARKET, BY PRODUCT TYPE, 2020-2029 (USD MILLION)
TABLE 309 BRAZIL ROBOTIC SYSTEMS IN LAB AUTOMATION MARKET, BY PRODUCT TYPE, 2020-2029 (USD MILLION)
TABLE 310 BRAZIL ANALYZER IN LAB AUTOMATION MARKET, BY PRODUCT TYPE , 2020-2029 (USD MILLION)
TABLE 311 BRAZIL SOFTWARE & INFORMATICS IN LAB AUTOMATION MARKET, BY PRODUCT TYPE, 2020-2029 (USD MILLION)
TABLE 312 BRAZIL LAB AUTOMATION MARKET, BY AUTOMATION TYPE, 2020-2029 (USD MILLION)
TABLE 313 BRAZIL LAB AUTOMATION MARKET, BY APPLICATION, 2020-2029 (USD MILLION)
TABLE 314 BRAZIL LAB AUTOMATION MARKET, BY END USER, 2020-2029 (USD MILLION)
TABLE 315 ARGENTINA LAB AUTOMATION MARKET, BY PRODUCT TYPE, 2020-2029 (USD MILLION)
TABLE 316 ARGENTINA EQUIPMENT IN LAB AUTOMATION MARKET, BY PRODUCT TYPE, 2020-2029 (USD MILLION)
TABLE 317 ARGENTINA AUTOMATED WORKSTATIONS IN LAB AUTOMATION MARKET, BY PRODUCT TYPE, 2020-2029 (USD MILLION)
TABLE 318 ARGENTINA MICROPLATE READERS IN LAB AUTOMATION MARKET, BY PRODUCT TYPE, 2020-2029 (USD MILLION)
TABLE 319 ARGENTINA ROBOTIC SYSTEMS IN LAB AUTOMATION MARKET, BY PRODUCT TYPE, 2020-2029 (USD MILLION)
TABLE 320 ARGENTINA ANALYZER IN LAB AUTOMATION MARKET, BY PRODUCT TYPE , 2020-2029 (USD MILLION)
TABLE 321 ARGENTINA SOFTWARE & INFORMATICS IN LAB AUTOMATION MARKET, BY PRODUCT TYPE, 2020-2029 (USD MILLION)
TABLE 322 ARGENTINA LAB AUTOMATION MARKET, BY AUTOMATION TYPE, 2020-2029 (USD MILLION)
TABLE 323 ARGENTINA LAB AUTOMATION MARKET, BY APPLICATION, 2020-2029 (USD MILLION)
TABLE 324 ARGENTINA LAB AUTOMATION MARKET, BY END USER, 2020-2029 (USD MILLION)
TABLE 325 REST OF SOUTH AMERICA LAB AUTOMATION MARKET, BY PRODUCT TYPE, 2020-2029 (USD MILLION)
TABLE 326 MIDDLE EAST AND AFRICA LAB AUTOMATION MARKET, BY COUNTRY, 2020-2029 (USD MILLION)
TABLE 327 MIDDLE EAST AND AFRICA LAB AUTOMATION MARKET, BY PRODUCT TYPE, 2020-2029 (USD MILLION)
TABLE 328 MIDDLE EAST AND AFRICA EQUIPMENT IN LAB AUTOMATION MARKET, BY PRODUCT TYPE, 2020-2029 (USD MILLION)
TABLE 329 MIDDLE EAST AND AFRICA AUTOMATED WORKSTATIONS IN LAB AUTOMATION MARKET, BY PRODUCT TYPE, 2020-2029 (USD MILLION)
TABLE 330 MIDDLE EAST AND AFRICA MICROPLATE READERS IN LAB AUTOMATION MARKET, BY PRODUCT TYPE, 2020-2029 (USD MILLION)
TABLE 331 MIDDLE EAST AND AFRICA ROBOTIC SYSTEMS IN LAB AUTOMATION MARKET, BY PRODUCT TYPE, 2020-2029 (USD MILLION)
TABLE 332 MIDDLE EAST AND AFRICA ANALYZER IN LAB AUTOMATION MARKET, BY PRODUCT TYPE , 2020-2029 (USD MILLION)
TABLE 333 MIDDLE EAST AND AFRICA SOFTWARE & INFORMATICS IN LAB AUTOMATION MARKET, BY PRODUCT TYPE, 2020-2029 (USD MILLION)
TABLE 334 MIDDLE EAST AND AFRICA LAB AUTOMATION MARKET, BY AUTOMATION TYPE, 2020-2029 (USD MILLION)
TABLE 335 MIDDLE EAST AND AFRICA LAB AUTOMATION MARKET, BY APPLICATION, 2020-2029 (USD MILLION)
TABLE 336 MIDDLE EAST AND AFRICA LAB AUTOMATION MARKET, BY END USER, 2020-2029 (USD MILLION)
TABLE 337 SOUTH AFRICA LAB AUTOMATION MARKET, BY PRODUCT TYPE, 2020-2029 (USD MILLION)
TABLE 338 SOUTH AFRICA EQUIPMENT IN LAB AUTOMATION MARKET, BY PRODUCT TYPE, 2020-2029 (USD MILLION)
TABLE 339 SOUTH AFRICA AUTOMATED WORKSTATIONS IN LAB AUTOMATION MARKET, BY PRODUCT TYPE, 2020-2029 (USD MILLION)
TABLE 340 SOUTH AFRICA MICROPLATE READERS IN LAB AUTOMATION MARKET, BY PRODUCT TYPE, 2020-2029 (USD MILLION)
TABLE 341 SOUTH AFRICA ROBOTIC SYSTEMS IN LAB AUTOMATION MARKET, BY PRODUCT TYPE, 2020-2029 (USD MILLION)
TABLE 342 SOUTH AFRICA ANALYZER IN LAB AUTOMATION MARKET, BY PRODUCT TYPE , 2020-2029 (USD MILLION)
TABLE 343 SOUTH AFRICA SOFTWARE & INFORMATICS IN LAB AUTOMATION MARKET, BY PRODUCT TYPE, 2020-2029 (USD MILLION)
TABLE 344 SOUTH AFRICA LAB AUTOMATION MARKET, BY AUTOMATION TYPE, 2020-2029 (USD MILLION)
TABLE 345 SOUTH AFRICA LAB AUTOMATION MARKET, BY APPLICATION, 2020-2029 (USD MILLION)
TABLE 346 SOUTH AFRICA LAB AUTOMATION MARKET, BY END USER, 2020-2029 (USD MILLION)
TABLE 347 SAUDI ARABIA LAB AUTOMATION MARKET, BY PRODUCT TYPE, 2020-2029 (USD MILLION)
TABLE 348 SAUDI ARABIA EQUIPMENT IN LAB AUTOMATION MARKET, BY PRODUCT TYPE, 2020-2029 (USD MILLION)
TABLE 349 SAUDI ARABIA AUTOMATED WORKSTATIONS IN LAB AUTOMATION MARKET, BY PRODUCT TYPE, 2020-2029 (USD MILLION)
TABLE 350 SAUDI ARABIA MICROPLATE READERS IN LAB AUTOMATION MARKET, BY PRODUCT TYPE, 2020-2029 (USD MILLION)
TABLE 351 SAUDI ARABIA ROBOTIC SYSTEMS IN LAB AUTOMATION MARKET, BY PRODUCT TYPE, 2020-2029 (USD MILLION)
TABLE 352 SAUDI ARABIA ANALYZER IN LAB AUTOMATION MARKET, BY PRODUCT TYPE , 2020-2029 (USD MILLION)
TABLE 353 SAUDI ARABIA SOFTWARE & INFORMATICS IN LAB AUTOMATION MARKET, BY PRODUCT TYPE, 2020-2029 (USD MILLION)
TABLE 354 SAUDI ARABIA LAB AUTOMATION MARKET, BY AUTOMATION TYPE, 2020-2029 (USD MILLION)
TABLE 355 SAUDI ARABIA LAB AUTOMATION MARKET, BY APPLICATION, 2020-2029 (USD MILLION)
TABLE 356 SAUDI ARABIA LAB AUTOMATION MARKET, BY END USER, 2020-2029 (USD MILLION)
TABLE 357 U.A.E. LAB AUTOMATION MARKET, BY PRODUCT TYPE, 2020-2029 (USD MILLION)
TABLE 358 U.A.E. EQUIPMENT IN LAB AUTOMATION MARKET, BY PRODUCT TYPE, 2020-2029 (USD MILLION)
TABLE 359 U.A.E. AUTOMATED WORKSTATIONS IN LAB AUTOMATION MARKET, BY PRODUCT TYPE, 2020-2029 (USD MILLION)
TABLE 360 U.A.E. MICROPLATE READERS IN LAB AUTOMATION MARKET, BY PRODUCT TYPE, 2020-2029 (USD MILLION)
TABLE 361 U.A.E. ROBOTIC SYSTEMS IN LAB AUTOMATION MARKET, BY PRODUCT TYPE, 2020-2029 (USD MILLION)
TABLE 362 U.A.E. ANALYZER IN LAB AUTOMATION MARKET, BY PRODUCT TYPE , 2020-2029 (USD MILLION)
TABLE 363 U.A.E. SOFTWARE & INFORMATICS IN LAB AUTOMATION MARKET, BY PRODUCT TYPE, 2020-2029 (USD MILLION)
TABLE 364 U.A.E. LAB AUTOMATION MARKET, BY AUTOMATION TYPE, 2020-2029 (USD MILLION)
TABLE 365 U.A.E. LAB AUTOMATION MARKET, BY APPLICATION, 2020-2029 (USD MILLION)
TABLE 366 U.A.E. LAB AUTOMATION MARKET, BY END USER, 2020-2029 (USD MILLION)
TABLE 367 REST OF MIDDLE EAST AND AFRICA LAB AUTOMATION MARKET, BY PRODUCT TYPE, 2020-2029 (USD MILLION)
Lista de figuras
FIGURE 1 GLOBAL LAB AUTOMATION MARKET: SEGMENTATION
FIGURE 2 GLOBAL LAB AUTOMATION MARKET: DATA TRIANGULATION
FIGURE 3 GLOBAL LAB AUTOMATION MARKET: DROC ANALYSIS
FIGURE 4 GLOBAL LAB AUTOMATION MARKET: GLOBAL VS REGIONAL MARKET ANALYSIS
FIGURE 5 GLOBAL LAB AUTOMATION MARKET: COMPANY RESEARCH ANALYSIS
FIGURE 6 GLOBAL LAB AUTOMATION MARKET: INTERVIEW DEMOGRAPHICS
FIGURE 7 GLOBAL LAB AUTOMATION MARKET: DBMR MARKET POSITION GRID
FIGURE 8 GLOBAL LAB AUTOMATION MARKET: MARKET END USER COVERAGE GRID
FIGURE 9 GLOBAL LAB AUTOMATION MARKET: VENDOR SHARE ANALYSIS
FIGURE 10 GLOBAL LAB AUTOMATION MARKET: SEGMENTATION
FIGURE 11 GROWING EXPENDITURE ON LAB AUTOMATION TOOLS AND EQUIPMENT IS EXPECTED TO DRIVE THE GLOBAL LAB AUTOMATION MARKET GROWTH IN THE FORECAST PERIOD OF 2022 TO 2029
FIGURE 12 EQUIPMENT SEGMENT IS EXPECTED TO ACCOUNT FOR THE LARGEST SHARE OF THE GLOBAL LAB AUTOMATION MARKET IN 2022 & 2029
FIGURE 13 NORTH AMERICA IS EXPECTED TO DOMINATE THE GLOBAL LAB AUTOMATION MARKET, AND ASIA-PACIFIC IS EXPECTED TO GROW WITH THE HIGHEST CAGR IN THE FORECAST PERIOD OF 2022 TO 2029
FIGURE 14 NORTH AMERICA IS THE FASTEST-GROWING MARKET FOR LAB AUTOMATION MARKET MANUFACTURERS IN THE FORECAST PERIOD OF 2022 TO 2029
FIGURE 15 DRIVERS, RESTRAINTS, OPPORTUNITIES, AND CHALLENGES OF THE GLOBAL LAB AUTOMATION MARKET
FIGURE 16 GLOBAL LAB AUTOMATION MARKET: BY PRODUCT TYPE, 2021
FIGURE 17 GLOBAL LAB AUTOMATION MARKET: BY PRODUCT TYPE, 2022-2029 (USD MILLION)
FIGURE 18 GLOBAL LAB AUTOMATION MARKET: BY PRODUCT TYPE, CAGR (2022-2029)
FIGURE 19 GLOBAL LAB AUTOMATION MARKET: BY PRODUCT TYPE, LIFELINE CURVE
FIGURE 20 GLOBAL LAB AUTOMATION MARKET: BY AUTOMATION TYPE, 2021
FIGURE 21 GLOBAL LAB AUTOMATION MARKET: BY AUTOMATION TYPE, 2022-2029 (USD MILLION)
FIGURE 22 GLOBAL LAB AUTOMATION MARKET: BY AUTOMATION TYPE, CAGR (2022-2029)
FIGURE 23 GLOBAL LAB AUTOMATION MARKET: BY AUTOMATION TYPE, LIFELINE CURVE
FIGURE 24 GLOBAL LAB AUTOMATION MARKET: BY APPLICATION, 2021
FIGURE 25 GLOBAL LAB AUTOMATION MARKET: BY APPLICATION, 2022-2029 (USD MILLION)
FIGURE 26 GLOBAL LAB AUTOMATION MARKET: BY APPLICATION, CAGR (2022-2029)
FIGURE 27 GLOBAL LAB AUTOMATION MARKET: BY APPLICATION, LIFELINE CURVE
FIGURE 28 GLOBAL LAB AUTOMATION MARKET: BY END USER, 2021
FIGURE 29 GLOBAL LAB AUTOMATION MARKET: BY END USER, 2022-2029 (USD MILLION)
FIGURE 30 GLOBAL LAB AUTOMATION MARKET: BY END USER, CAGR (2022-2029)
FIGURE 31 GLOBAL LAB AUTOMATION MARKET: BY END USER, LIFELINE CURVE
FIGURE 32 GLOBAL LAB AUTOMATION MARKET: SNAPSHOT (2021)
FIGURE 33 GLOBAL LAB AUTOMATION MARKET: BY REGION (2021)
FIGURE 34 GLOBAL LAB AUTOMATION MARKET: BY REGION (2022 & 2029)
FIGURE 35 GLOBAL LAB AUTOMATION MARKET: BY REGION (2021 & 2029)
FIGURE 36 GLOBAL LAB AUTOMATION MARKET: BY PRODUCT TYPE (2022-2029)
FIGURE 37 NORTH AMERICA LAB AUTOMATION MARKET: SNAPSHOT (2021)
FIGURE 38 NORTH AMERICA LAB AUTOMATION MARKET: BY COUNTRY (2021)
FIGURE 39 NORTH AMERICA LAB AUTOMATION MARKET: BY COUNTRY (2022 & 2029)
FIGURE 40 NORTH AMERICA LAB AUTOMATION MARKET: BY COUNTRY (2021 & 2029)
FIGURE 41 NORTH AMERICA LAB AUTOMATION MARKET: PRODUCT TYPE (2022-2029)
FIGURE 42 EUROPE LAB AUTOMATION MARKET: SNAPSHOT (2021)
FIGURE 43 EUROPE LAB AUTOMATION MARKET: BY COUNTRY (2021)
FIGURE 44 EUROPE LAB AUTOMATION MARKET: BY COUNTRY (2022 & 2029)
FIGURE 45 EUROPE LAB AUTOMATION MARKET: BY COUNTRY (2021 & 2029)
FIGURE 46 EUROPE LAB AUTOMATION MARKET: BY PRODUCT TYPE (2022-2029)
FIGURE 47 ASIA-PACIFIC LAB AUTOMATION MARKET: SNAPSHOT (2021)
FIGURE 48 ASIA-PACIFIC LAB AUTOMATION MARKET: BY COUNTRY (2021)
FIGURE 49 ASIA-PACIFIC LAB AUTOMATION MARKET: BY COUNTRY (2022 & 2029)
FIGURE 50 ASIA-PACIFIC LAB AUTOMATION MARKET: BY COUNTRY (2021 & 2029)
FIGURE 51 ASIA-PACIFIC LAB AUTOMATION MARKET: BY PRODUCT TYPE (2022-2029)
FIGURE 52 SOUTH AMERICA LAB AUTOMATION MARKET: SNAPSHOT (2021)
FIGURE 53 SOUTH AMERICA LAB AUTOMATION MARKET: BY COUNTRY (2021)
FIGURE 54 SOUTH AMERICA LAB AUTOMATION MARKET: BY COUNTRY (2022 & 2029)
FIGURE 55 SOUTH AMERICA LAB AUTOMATION MARKET: BY COUNTRY (2021 & 2029)
FIGURE 56 SOUTH AMERICA LAB AUTOMATION MARKET: PRODUCT TYPE (2022-2029)
FIGURE 57 MIDDLE EAST AND AFRICA LAB AUTOMATION MARKET: SNAPSHOT (2021)
FIGURE 58 MIDDLE EAST AND AFRICA LAB AUTOMATION MARKET: BY COUNTRY (2021)
FIGURE 59 MIDDLE EAST AND AFRICA LAB AUTOMATION MARKET: BY COUNTRY (2022 & 2029)
FIGURE 60 MIDDLE EAST AND AFRICA LAB AUTOMATION MARKET: BY COUNTRY (2021 & 2029)
FIGURE 61 MIDDLE EAST AND AFRICA LAB AUTOMATION MARKET: PRODUCT TYPE (2022-2029)
FIGURE 62 GLOBAL LAB AUTOMATION MARKET: COMPANY SHARE 2021 (%)
FIGURE 63 NORTH AMERICA LAB AUTOMATION MARKET: COMPANY SHARE 2021 (%)
FIGURE 64 EUROPE LAB AUTOMATION MARKET: COMPANY SHARE 2021 (%)
FIGURE 65 ASIA-PACIFIC LAB AUTOMATION MARKET: COMPANY SHARE 2021 (%)
Metodología de investigación
La recopilación de datos y el análisis del año base se realizan utilizando módulos de recopilación de datos con muestras de gran tamaño. La etapa incluye la obtención de información de mercado o datos relacionados a través de varias fuentes y estrategias. Incluye el examen y la planificación de todos los datos adquiridos del pasado con antelación. Asimismo, abarca el examen de las inconsistencias de información observadas en diferentes fuentes de información. Los datos de mercado se analizan y estiman utilizando modelos estadísticos y coherentes de mercado. Además, el análisis de la participación de mercado y el análisis de tendencias clave son los principales factores de éxito en el informe de mercado. Para obtener más información, solicite una llamada de un analista o envíe su consulta.
La metodología de investigación clave utilizada por el equipo de investigación de DBMR es la triangulación de datos, que implica la extracción de datos, el análisis del impacto de las variables de datos en el mercado y la validación primaria (experto en la industria). Los modelos de datos incluyen cuadrícula de posicionamiento de proveedores, análisis de línea de tiempo de mercado, descripción general y guía del mercado, cuadrícula de posicionamiento de la empresa, análisis de patentes, análisis de precios, análisis de participación de mercado de la empresa, estándares de medición, análisis global versus regional y de participación de proveedores. Para obtener más información sobre la metodología de investigación, envíe una consulta para hablar con nuestros expertos de la industria.
Personalización disponible
Data Bridge Market Research es líder en investigación formativa avanzada. Nos enorgullecemos de brindar servicios a nuestros clientes existentes y nuevos con datos y análisis que coinciden y se adaptan a sus objetivos. El informe se puede personalizar para incluir análisis de tendencias de precios de marcas objetivo, comprensión del mercado de países adicionales (solicite la lista de países), datos de resultados de ensayos clínicos, revisión de literatura, análisis de mercado renovado y base de productos. El análisis de mercado de competidores objetivo se puede analizar desde análisis basados en tecnología hasta estrategias de cartera de mercado. Podemos agregar tantos competidores sobre los que necesite datos en el formato y estilo de datos que esté buscando. Nuestro equipo de analistas también puede proporcionarle datos en archivos de Excel sin procesar, tablas dinámicas (libro de datos) o puede ayudarlo a crear presentaciones a partir de los conjuntos de datos disponibles en el informe.

