
Global Kegs Market
Tamaño del mercado en miles de millones de dólares
Tasa de crecimiento anual compuesta (CAGR) :
% 
 USD
905.50 Million
USD
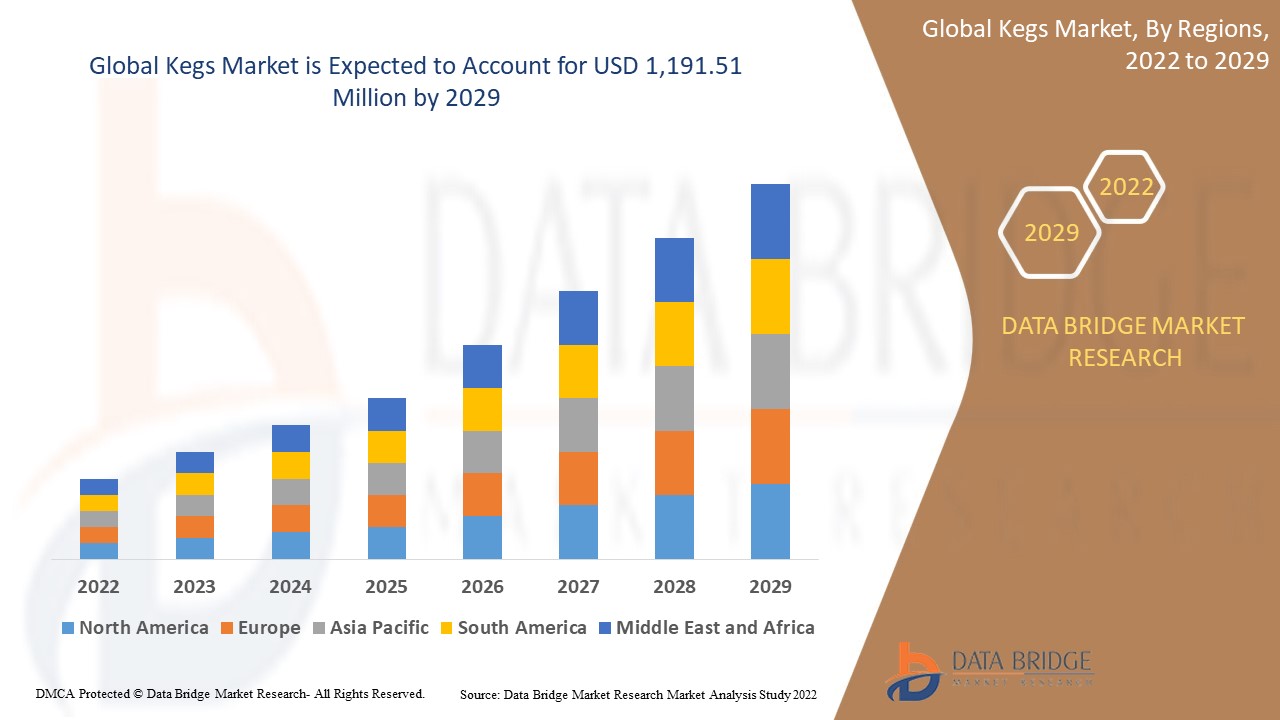
1,191.51 Million
2021
2029
USD
905.50 Million
USD
1,191.51 Million
2021
2029
| 2022 –2029 | |
| USD 905.50 Million | |
| USD 1,191.51 Million | |
| % | |
|
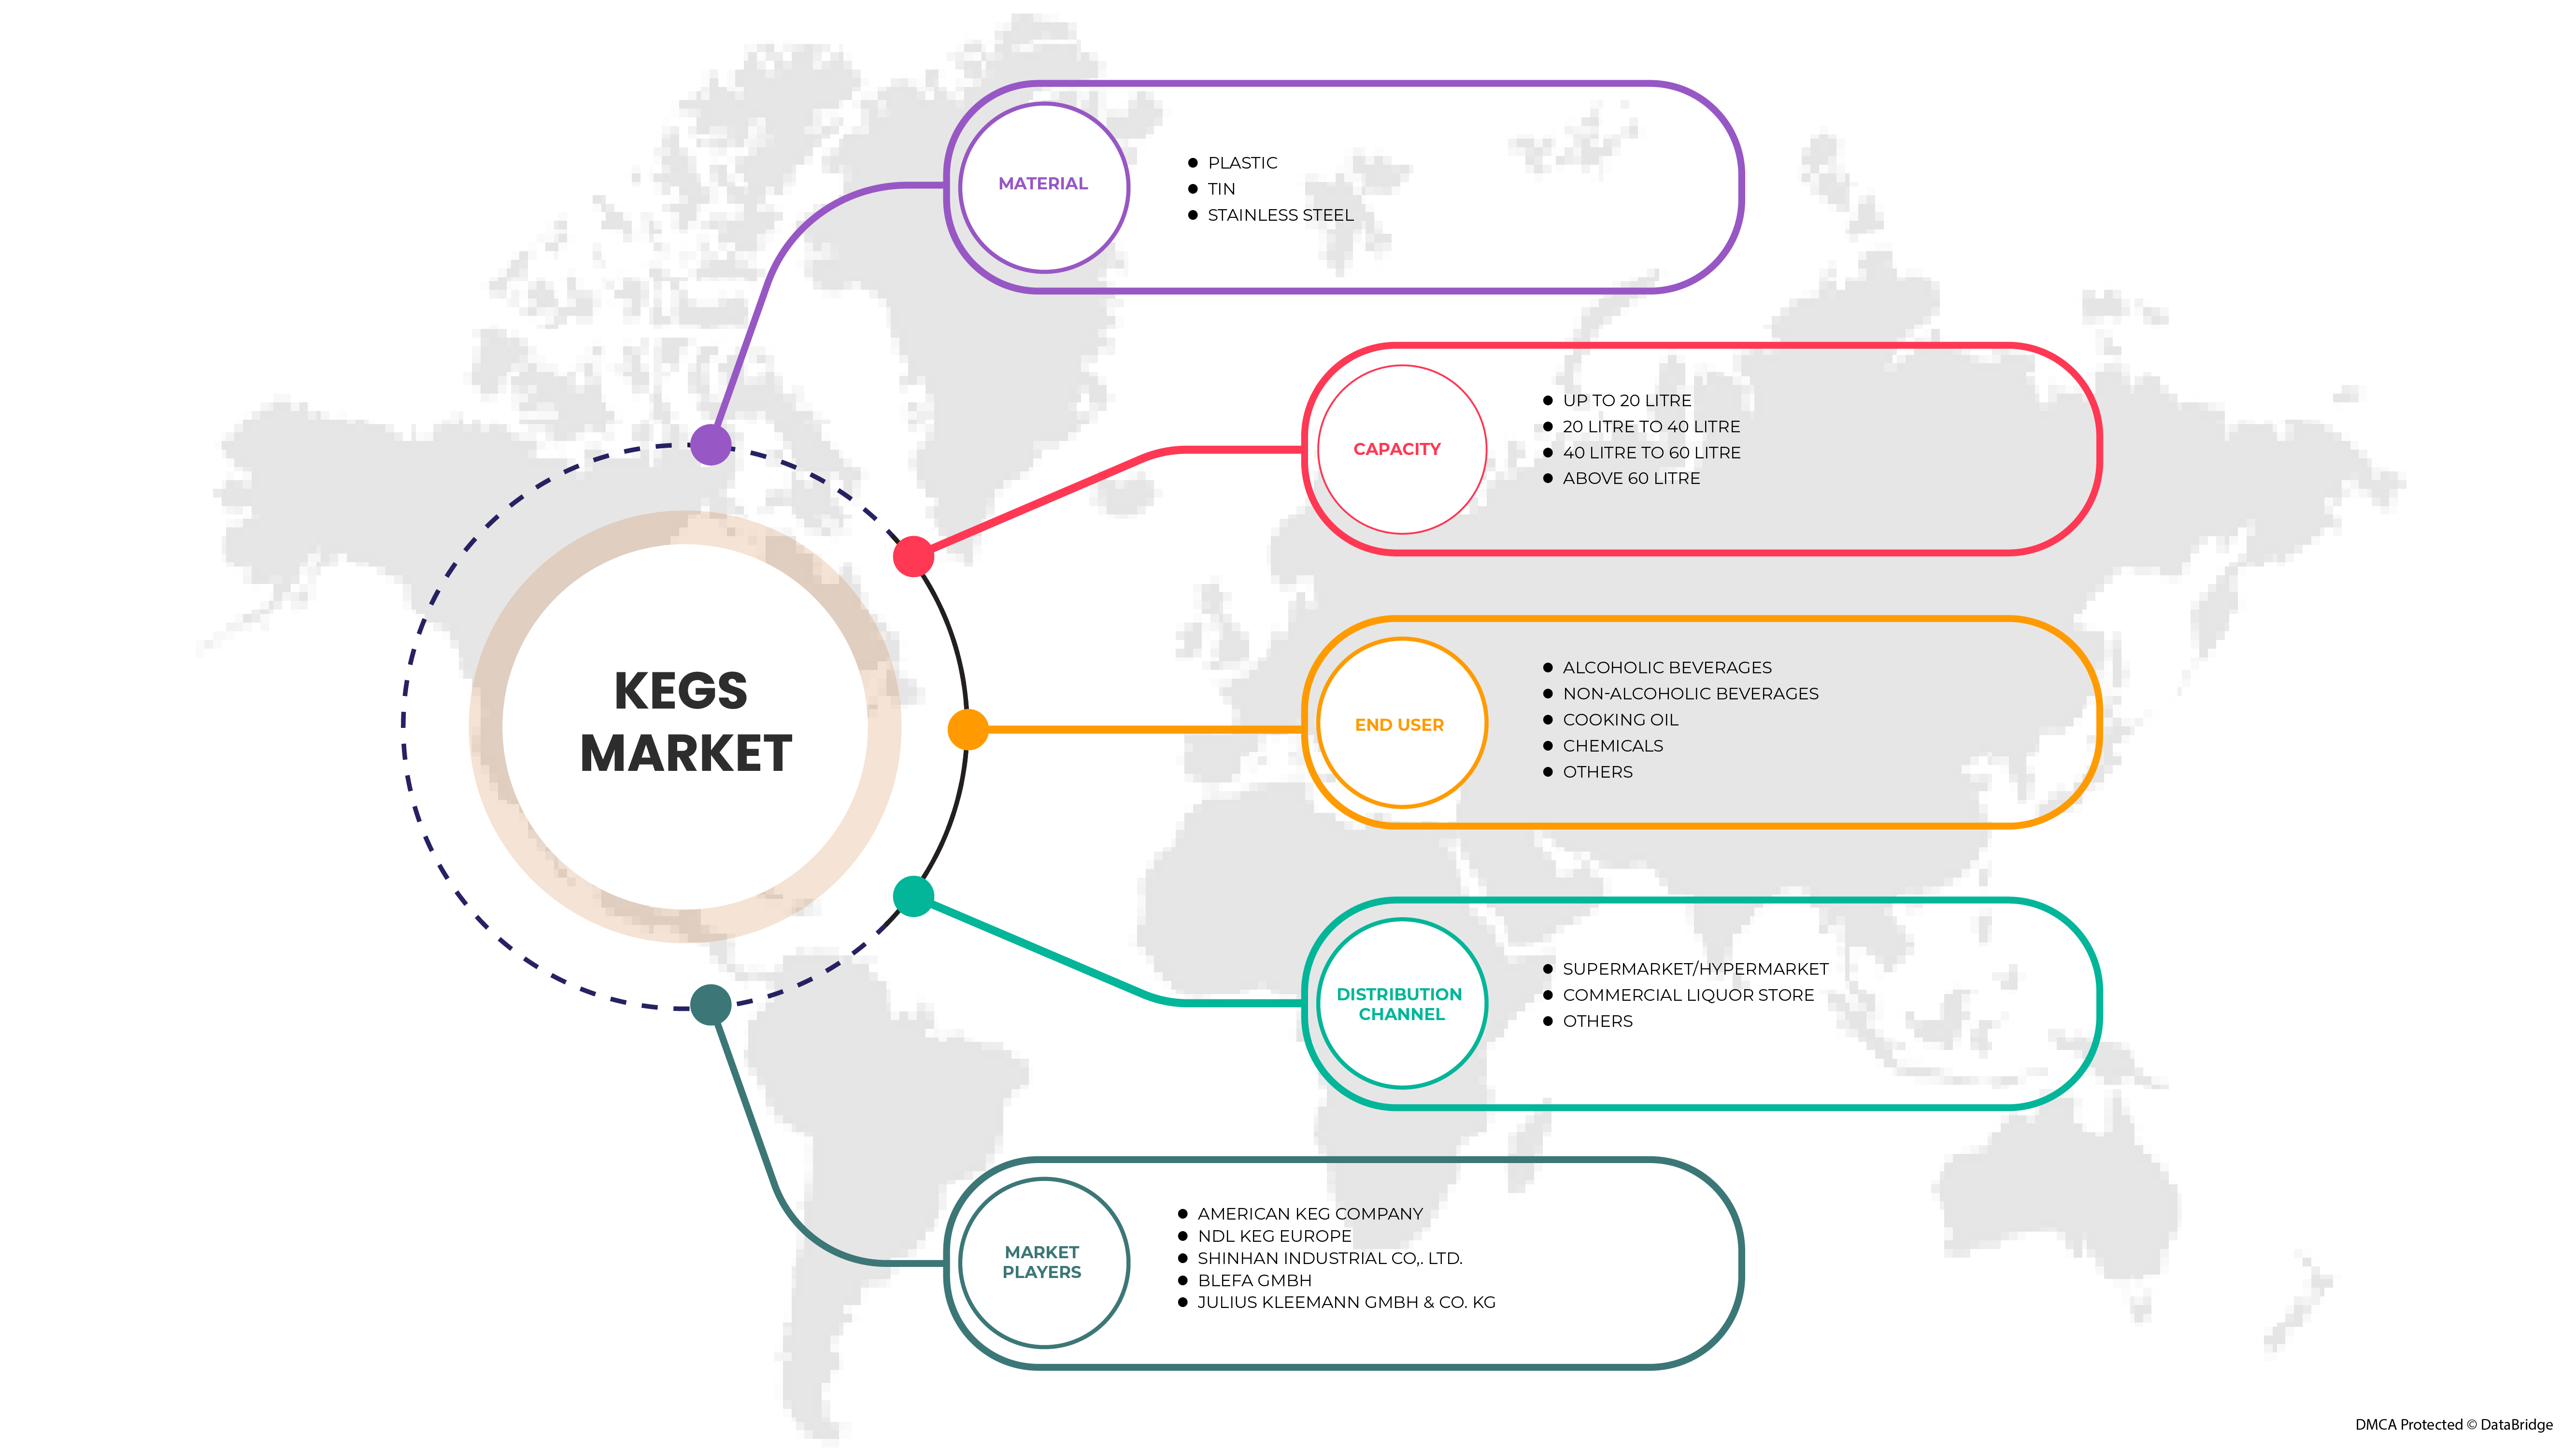
Mercado mundial de barriles, por material (plástico, estaño y acero inoxidable), capacidad (hasta 20 litros, de 20 litros a 40 litros, de 40 litros a 60 litros y más de 60 litros), usuario final (bebidas alcohólicas, bebidas no alcohólicas, aceite de cocina, productos químicos y otros), canal de distribución (supermercado/hipermercado, licorería comercial y otros), tendencias de la industria y pronóstico hasta 2029.
Análisis y tamaño del mercado de barriles
El mercado mundial de barriles está siendo impulsado por el aumento de las aplicaciones de barriles en todas las industrias. Además, el crecimiento del mercado está impulsado por la creciente demanda de bebidas alcohólicas y no alcohólicas. Sin embargo, los principales factores que limitan el crecimiento del mercado son los altos costos asociados con los barriles comerciales. Como resultado de la creciente demanda de barriles, los fabricantes están poniendo más esfuerzo en lanzar nuevos productos con tecnología de vanguardia y certificados por institutos autorizados. La expansión del mercado se ve finalmente ayudada por estas opciones.

Algunos de los factores que impulsan el crecimiento del mercado son el aumento de las aplicaciones de barriles en los sectores químico y de alimentos y bebidas, y el aumento del consumo de bebidas debido a los cambios graduales en el estilo de vida. Sin embargo, se espera que las limitaciones en términos de reemplazo lento de los barriles debido a su prolongada vida útil obstaculicen el crecimiento del mercado.
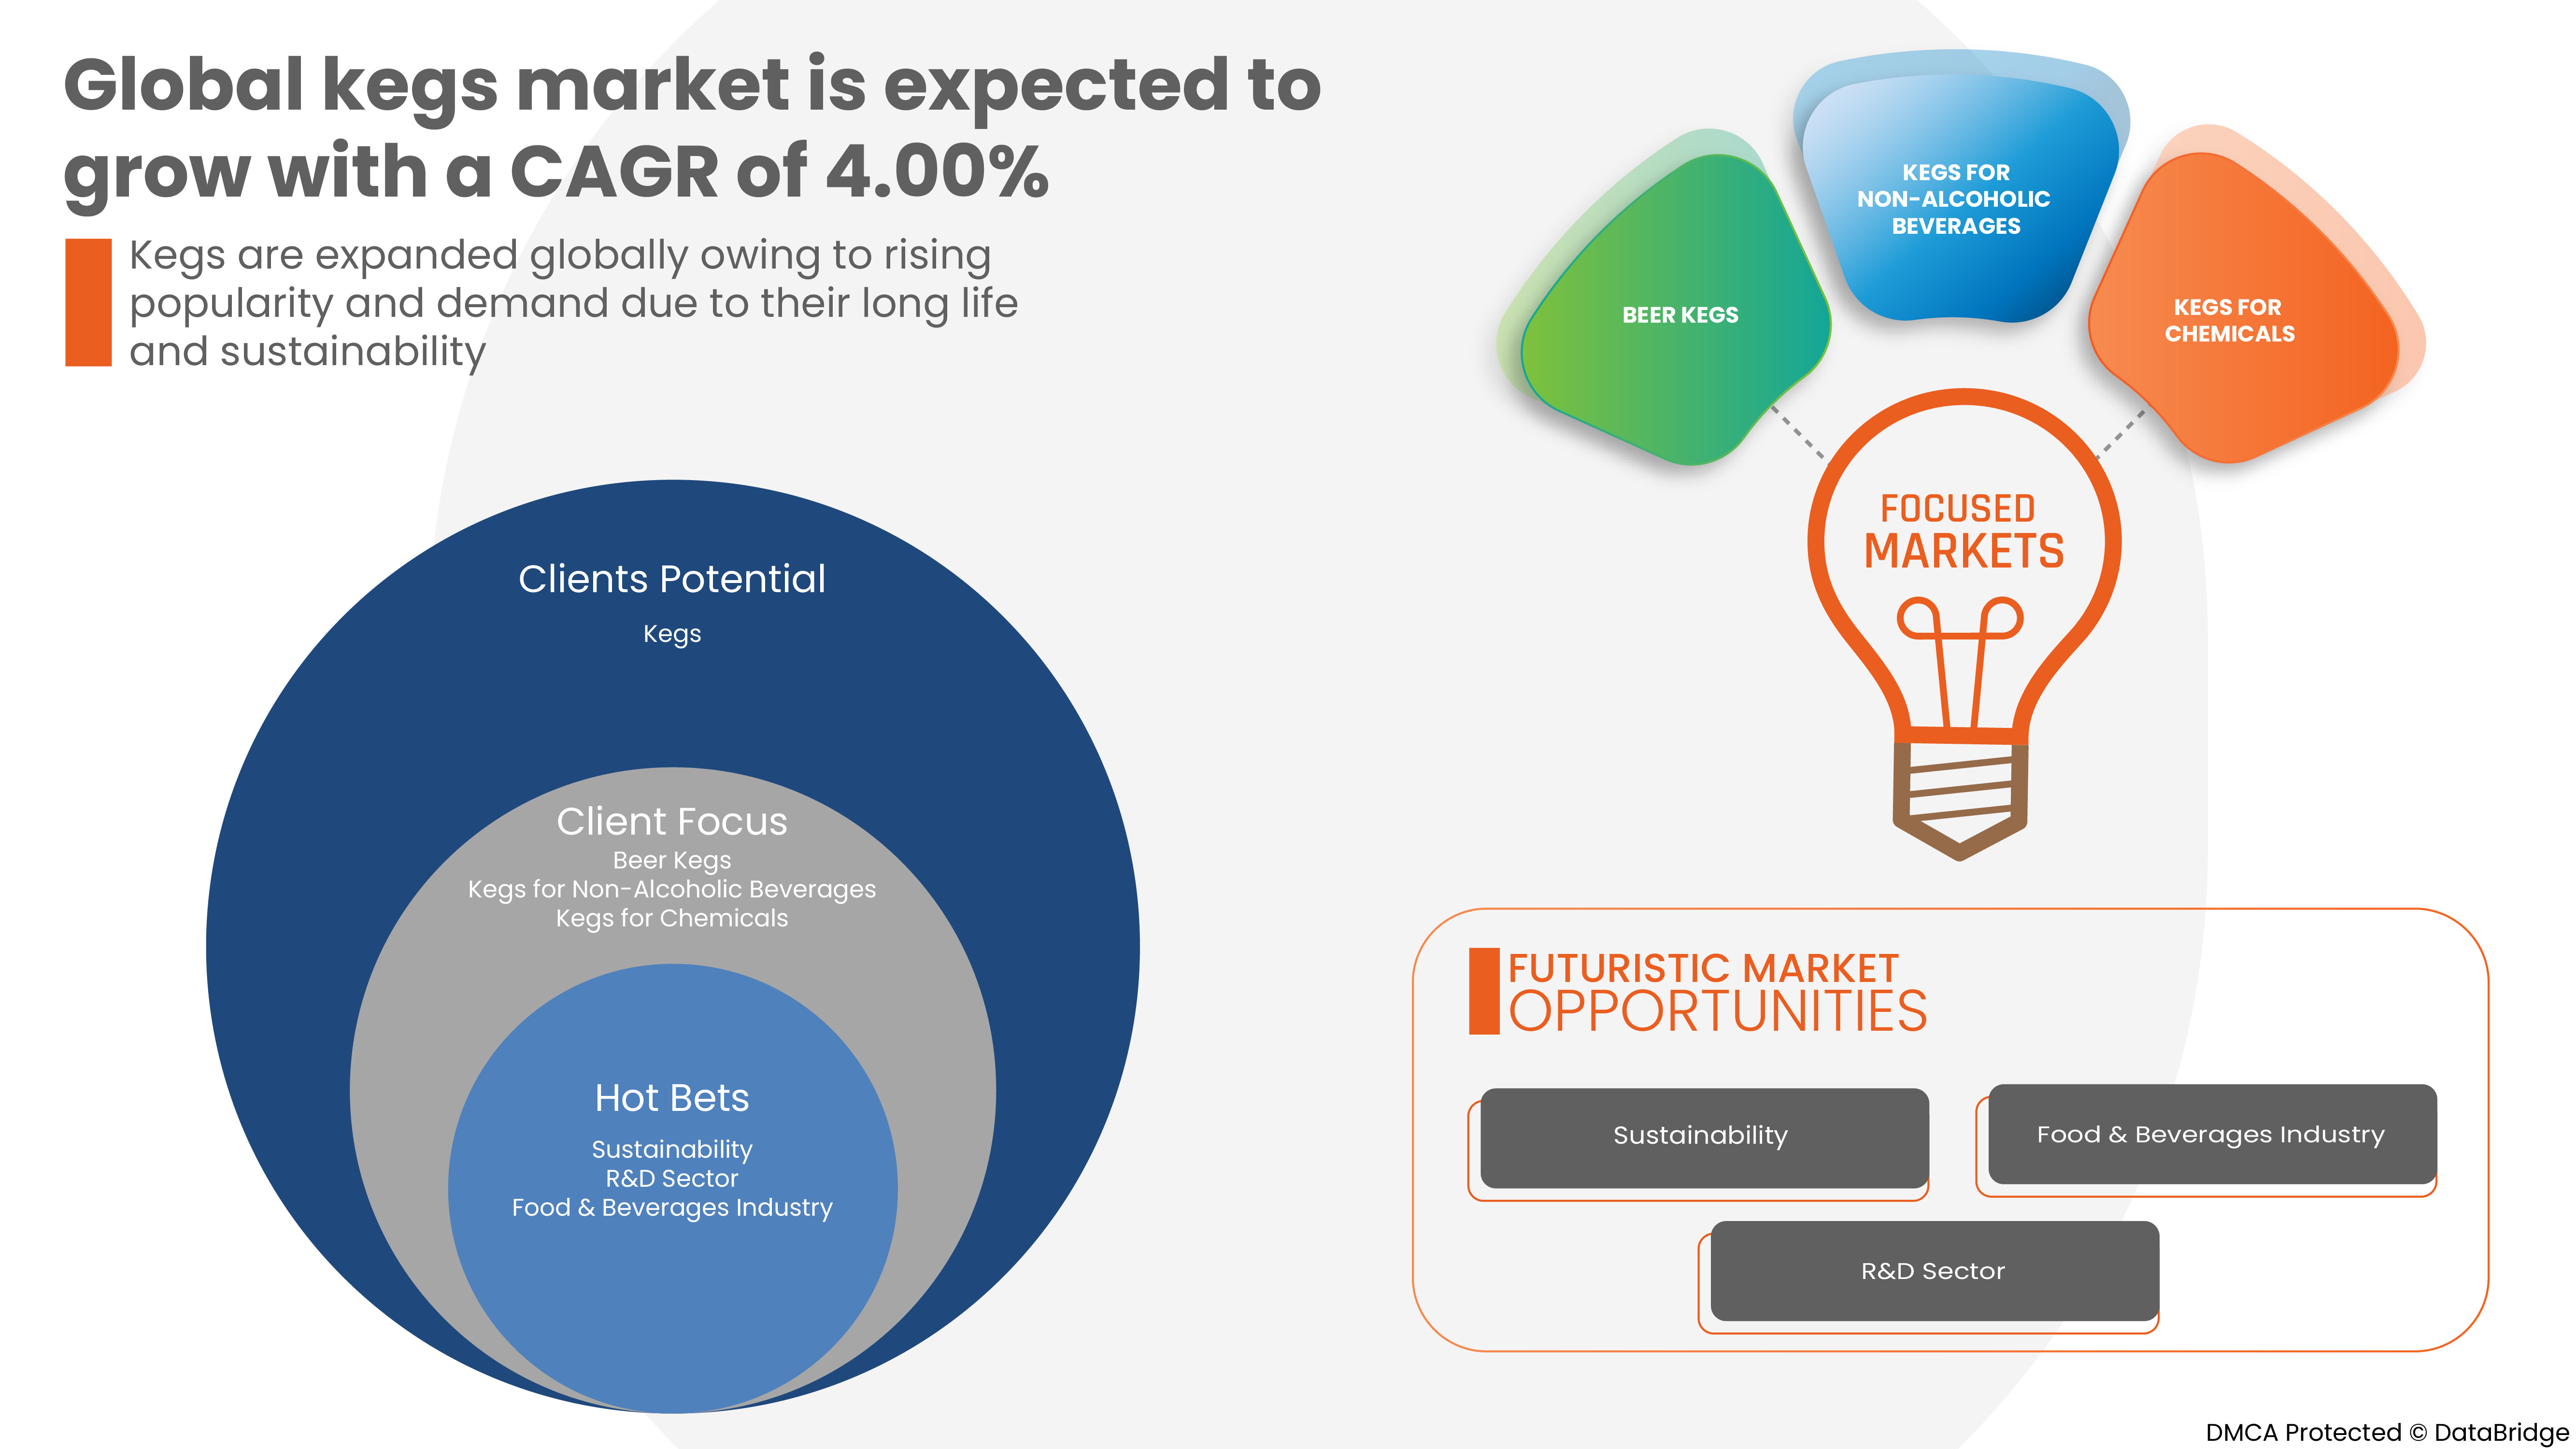
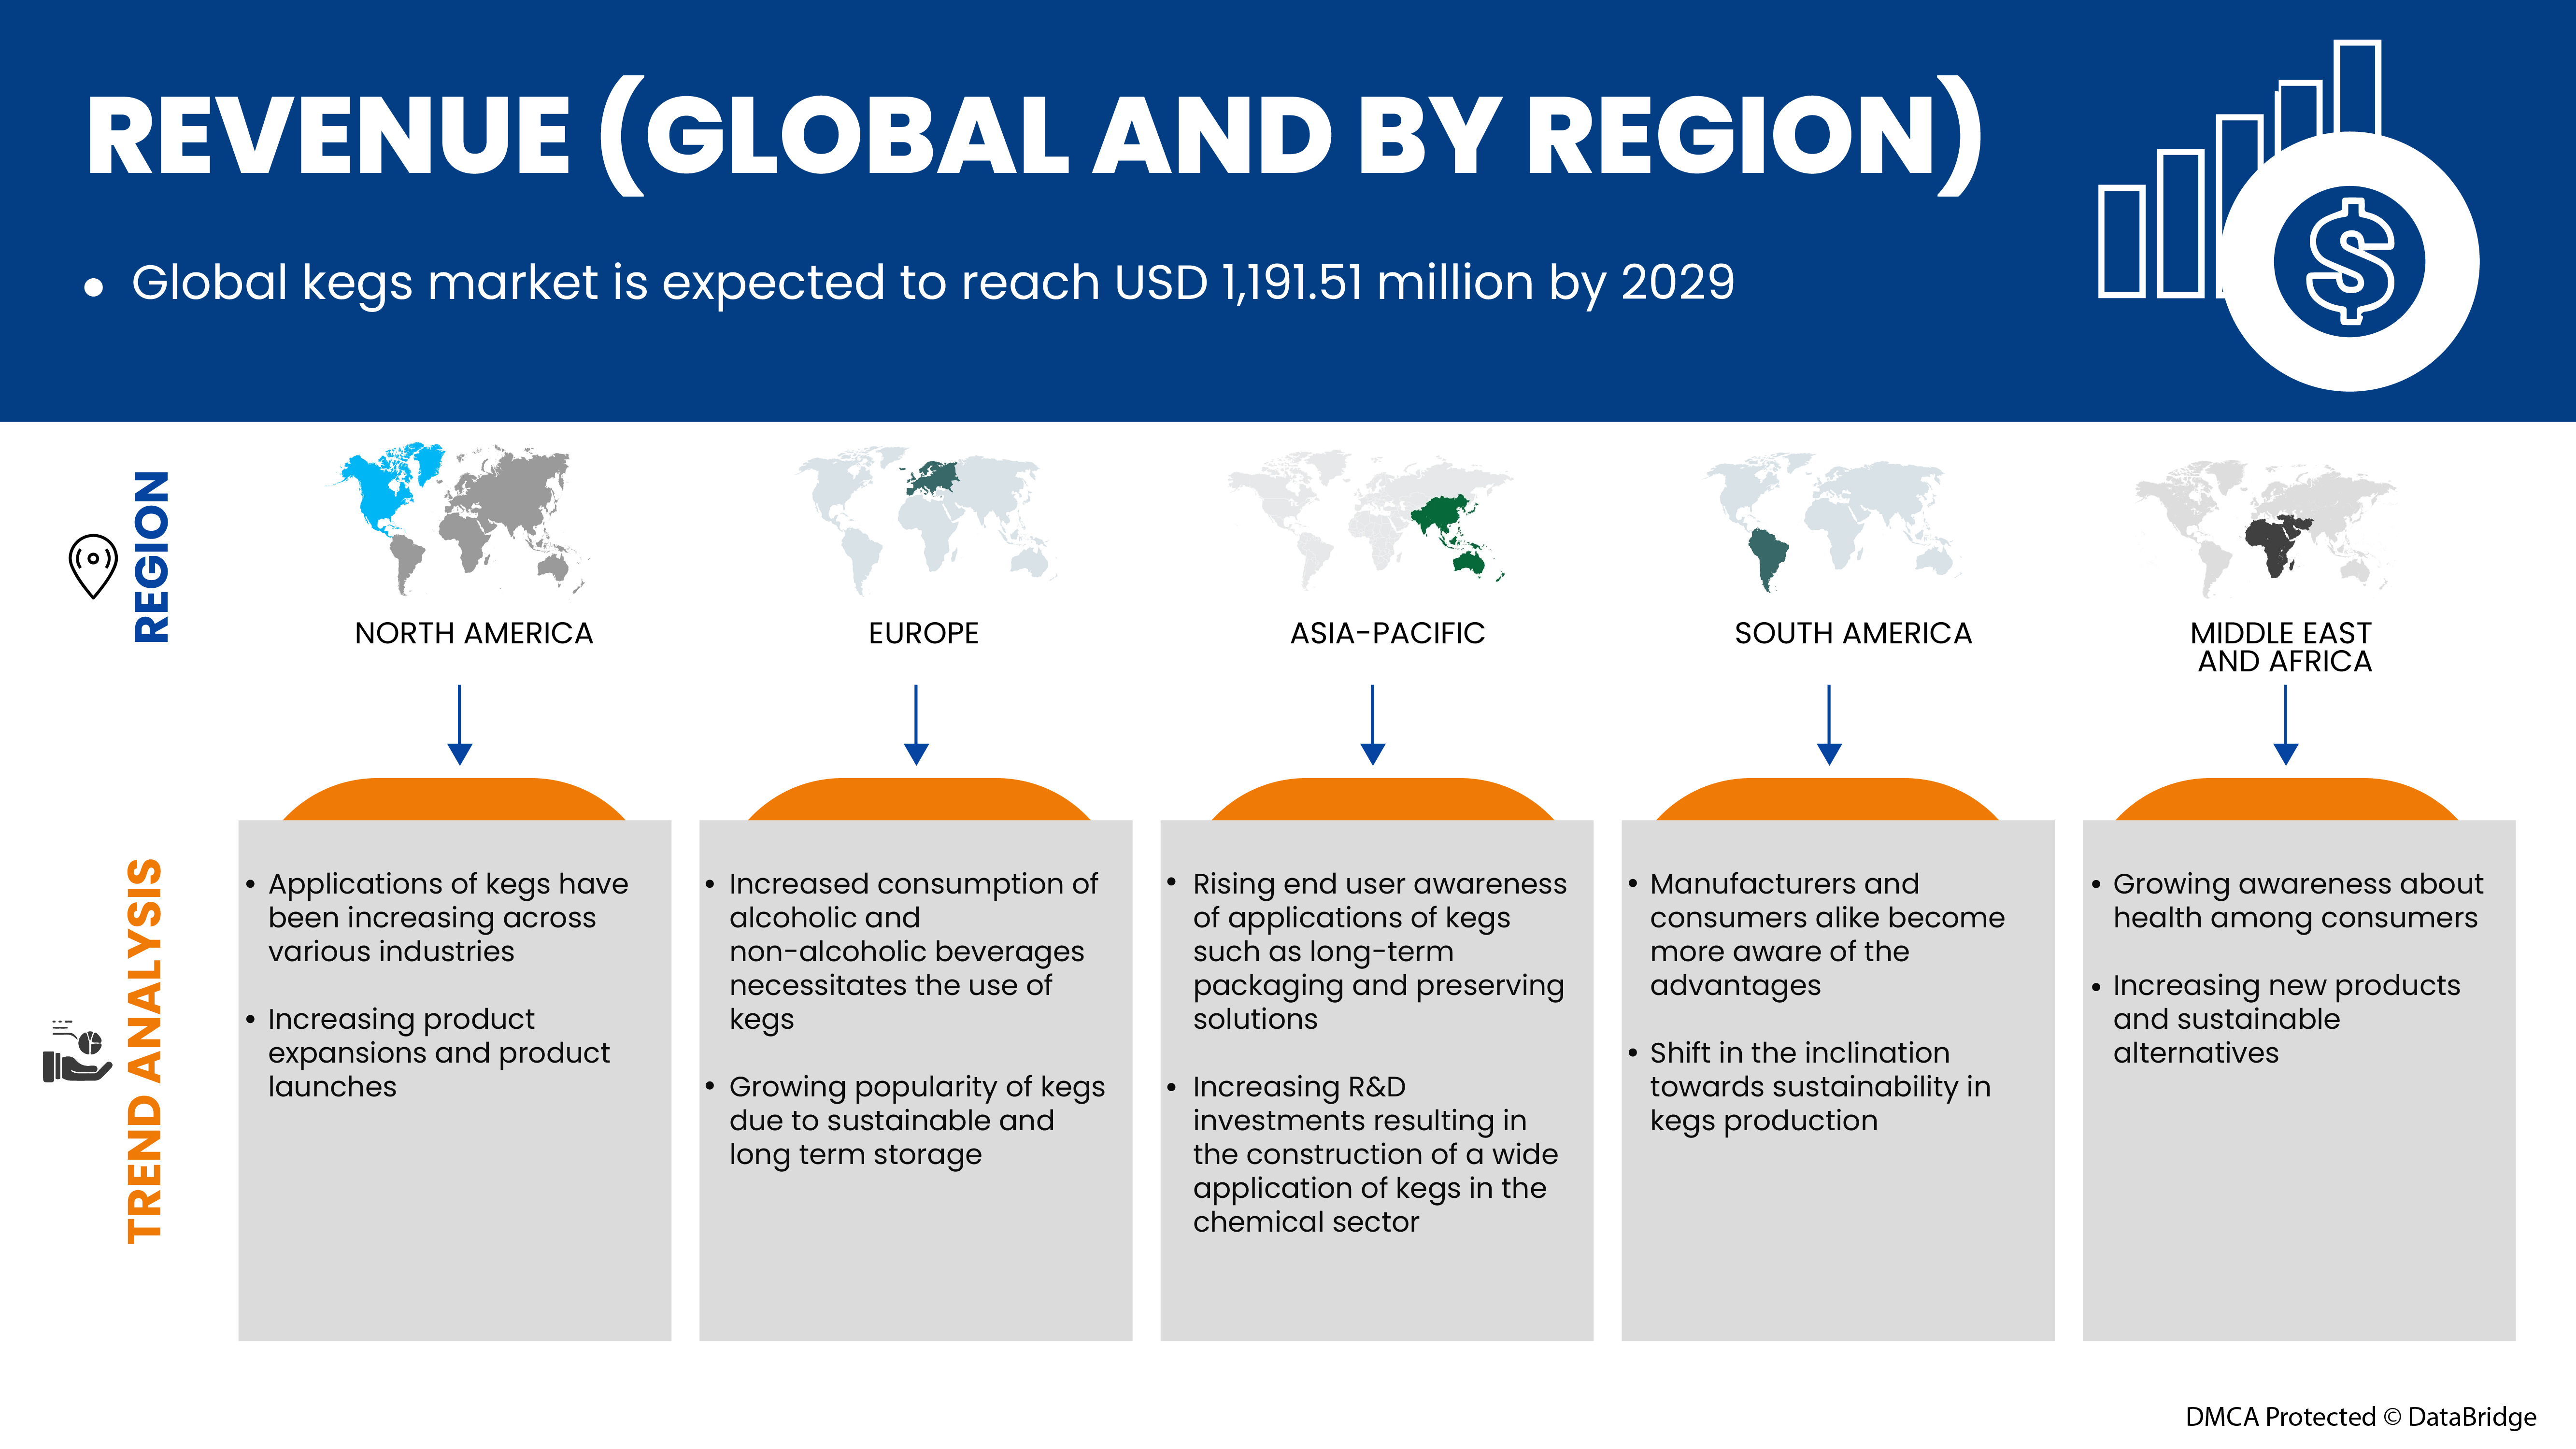
Data Bridge Market Research analiza que se espera que el mercado global de barriles alcance un valor de USD 1.191,51 millones para 2029 con una CAGR del 4,0% durante el período de pronóstico.
|
Métrica del informe |
Detalles |
|
Período de pronóstico |
2022 a 2029 |
|
Año base |
2021 |
|
Año histórico |
2020 (Personalizable para 2019 - 2014) |
|
Unidades cuantitativas |
Ingresos en millones de USD, volumen en millones de unidades y precios en USD |
|
Segmentos cubiertos |
Por material (plástico, hojalata y acero inoxidable), capacidad (hasta 20 litros, de 20 litros a 40 litros, de 40 litros a 60 litros y más de 60 litros), usuario final ( bebidas alcohólicas , bebidas no alcohólicas, aceite de cocina, productos químicos y otros), canal de distribución (supermercado/hipermercado, licorería comercial y otros) |
|
Países cubiertos |
EE. UU., Canadá, México, Alemania, Reino Unido, Italia, Francia, España, Suiza, Países Bajos, Bélgica, Rusia, Turquía, resto de Europa, Japón, China, Corea del Sur, India, Australia y Nueva Zelanda, Hong Kong, Taiwán, Singapur, Tailandia, Indonesia, Malasia, Filipinas, resto de Asia-Pacífico, Sudáfrica, Emiratos Árabes Unidos, Arabia Saudita, Kuwait, Israel, Egipto, Qatar y resto de Medio Oriente y África, Brasil, Argentina, Venezuela y resto de Sudamérica. |
|
Actores del mercado cubiertos |
AMERICAN KEG COMPANY, NDL Keg Europe, SHINHAN INDUSTRIAL CO. LTD., BLEFA GmbH, Julius Kleemann GmbH & Co. KG, The Metal Drum Company, Petainer Ltd., NEW MAISONNEUVE KEG, Schaefer Container Systems, Supermonte Group Italy, Inc. y KeyKeg, entre otras. |
Definición de mercado
Los barriles son pequeños barriles. Bebidas, productos químicos, aceites y diversos líquidos se transportan y almacenan en barriles construidos con diversas materias primas. Un barril suele estar hecho de acero inoxidable, sin embargo, también se puede utilizar aluminio si tiene un revestimiento interior de plástico. La cerveza se transporta, sirve y almacena con frecuencia en él. Un barril también puede contener bebidas alcohólicas y no alcohólicas adicionales, carbonatadas o no. Es una práctica común mantener la presión de las bebidas carbonatadas para mantener el dióxido de carbono en la solución y evitar que la bebida pierda el gas.
Dinámica del mercado mundial de barriles
En esta sección se aborda la comprensión de los factores impulsores, las ventajas, las oportunidades, las limitaciones y los desafíos del mercado. Todo esto se analiza en detalle a continuación:
CONDUCTORES
- Tendencia creciente de soluciones de envasado y conservación a largo plazo
Se prevé que el uso de barriles como solución de envasado en la industria de las bebidas tenga un futuro prometedor. Los barriles de plástico se pueden reciclar y cuesta menos devolverlos. Por otro lado, la adopción de barriles se ha expandido como resultado de la popularidad de los barriles, lo que anima a los fabricantes a ofrecer barriles en alquiler. Los barriles de un solo uso son una alternativa más económica y eficaz a los barriles de acero tradicionales, y se prevé que se utilizarán ampliamente en un futuro próximo. Además, el sector de la microcervecería se está expandiendo debido al entusiasmo de los consumidores por las cervezas artesanales, lo que ha impulsado la industria mundial de los barriles. Se prevé que el uso de barriles se vea fomentado por las restricciones legislativas que favorecen límites de peso más bajos para los envases. Los barriles también se utilizan para conservar soluciones como bebidas, aceite y productos químicos para preservar la calidad y el sabor del producto.
Por ejemplo,
- En septiembre de 2021, Newsmatics Inc. publicó un artículo titulado “Los barriles se han vuelto más populares como una solución de envasado prometedora a largo plazo” y cuenta que, como opción de envasado para bebidas, se prevé que los barriles tengan un futuro prometedor.
- En septiembre de 2020, Hospitality Net™ publicó un artículo titulado “Vino de barril de barril: una innovación sostenible suiza” y cuenta que una cosa era el vino de barril, que protege impecablemente la calidad del vino y al mismo tiempo es práctico, ecológico y rentable.
La creciente conciencia de los usuarios finales sobre las aplicaciones de los barriles, como soluciones de envasado y conservación a largo plazo, está impulsando la expansión del mercado.
- Aumento del consumo de bebidas debido al cambio gradual en el estilo de vida
La preferencia de los clientes, en particular los millennials, por la cerveza sin alcohol y los cócteles sin alcohol está contribuyendo a la creciente demanda de barriles. Los jugos, purés, salsas, refrescos y bebidas carbonatadas, entre otras bebidas no alcohólicas, se consumen a un ritmo cada vez mayor debido al aumento de los ingresos disponibles, la mejora de las condiciones de vida, la tendencia de los millennials a salir de fiesta al aire libre y otros factores que están respaldando el aumento de la demanda de barriles. Además, el aumento del consumo de bebidas alcohólicas en la cultura de los pubs está impulsando el crecimiento del mercado.
Por ejemplo,
- En agosto de 2022, American City Business Journals publicó un artículo titulado “Loudoun wine and beer Tour Company looks to saturate Greater Washington” (La empresa de turismo de vinos y cervezas de Loudoun busca saturar el área metropolitana de Washington). En él se menciona que el aumento del consumo de vino y cerveza afecta la demanda de barriles para su preparación, conservación y transporte.
El aumento del consumo de bebidas alcohólicas y no alcohólicas hace necesario el uso de barriles, lo que impulsa positivamente la expansión del mercado.
RESTRICCIÓN
Alto costo asociado con los barriles comerciales
Es casi seguro que una caída de precios se traducirá en nuevos consumidores o en ventas de barriles. Por otro lado, un precio elevado alienta a los compradores a comprar menos productos, lo que se traduce en una pérdida de ventas para la empresa. El alto coste de los barriles comerciales es una barrera de mercado, ya que los usuarios finales no pueden permitirse seguir invirtiendo en ellos. A la larga, actúa como una barrera para el crecimiento del mercado.
Por ejemplo,
|
Nombre del producto |
Precio |
|
Dispensador de cerveza comercial Kegerator - 4 grifos Almacena 4 barriles |
44.000 INR |
|
Ball Lock Corny Keg: fermentador de cerveza casera |
5.824 INR |
|
Barril de cerveza de acero inoxidable de 50 litros de uso comercial según la norma europea |
USD 55-65/pieza |
|
Barril de cerveza comercial de 1 galón, 30 litros con regulador de CO2 |
USD 54,59-56,69/pieza |
|
Barril de cerveza comercial vacío personalizado Barril de cerveza de acero inoxidable de 30 l Barril de cerveza de 30 l |
USD 44,48-57,65/pieza |
Los precios de los barriles comerciales indicados anteriormente son más altos y están fuera del alcance de los consumidores finales pequeños y medianos. Como resultado, la expansión del mercado eventualmente se desacelerará.

OPORTUNIDAD
Aumento de la demanda de barriles ecológicos como resultado de la tendencia de la sostenibilidad
La mayoría de las empresas que fabrican barriles han comenzado a introducir barriles ecológicos, debido a la creciente conciencia sobre la sostenibilidad y la preservación del medio ambiente. Estos barriles ayudan al medio ambiente al evitar procesos perjudiciales para el medio ambiente durante la producción y el mantenimiento de los barriles. Los barriles de acero inoxidable son uno de los barriles ecológicos más famosos. Debido a esta tendencia de sostenibilidad, las empresas de barriles están lanzando barriles ecológicos.
Por ejemplo,
- En agosto de 2022, BLEFA GmbH publicó un vlog sobre “Sostenibilidad y reciclaje: ¿Qué barril es mejor?”. En él se menciona que el debate mundial sobre el cambio climático asegura que cuestiones como la sostenibilidad y el reciclaje desempeñan un papel fundamental. Varias cervecerías han desarrollado diversos programas de protección medioambiental y están tomando medidas para limitar las emisiones de CO2 en la fabricación, el embotellado y el almacenamiento de su cerveza. Porque los envases de alta calidad y respetuosos con el medio ambiente, como los barriles de acero inoxidable, son una inversión segura y a largo plazo. Los fabricantes de envases de bebidas prestan atención a los comportamientos respetuosos con el medio ambiente en sus procesos de adquisición y producción. Los envases de PET desechables llevan varios años disponibles en el mercado junto con los barriles de acero inoxidable.
Este deseo de barriles ecológicos puede brindar oportunidades al mercado en el futuro.
DESAFÍO
Grandes fluctuaciones en el precio de las materias primas
El acero inoxidable, el vidrio, el caucho y otros materiales se utilizan como materias primas en la fabricación de barriles. La COVID-19, la guerra entre Rusia y Ucrania y otros acontecimientos han provocado fluctuaciones continuas en los precios de las principales materias primas en los últimos años. Estas oscilaciones de precios, que se deben principalmente al aumento de los costes de las materias primas, aumentan el coste de producción de los barriles. Un aumento de los costes de producción puede dar lugar a muy pocas ganancias o pérdidas para la empresa.
Por ejemplo,
- En marzo de 2022, S&P Global Inc. informó que, a medida que los mercados mundiales se recuperan de la pandemia, los precios del acero inoxidable y otros productos de acero han seguido aumentando. El año pasado, los productores informaron sus mayores ganancias en la memoria reciente. Sin embargo, el aumento de los precios de la energía ya era un problema en el cuarto trimestre de 2021, lo que obligó a las acerías a subir los precios. Los precios de la energía estaban aumentando debido a un suministro limitado de un elemento vital, el níquel, que se volvió más escaso debido a la invasión rusa de Ucrania.
Debido al aumento de la demanda, la disminución de la disponibilidad y el aumento de los costos de las materias primas, se prevé que los precios del acero inoxidable aumenten. Estas fluctuaciones en los precios de las materias primas se convierten en un desafío para el crecimiento del mercado.
Impacto post COVID-19 en el mercado mundial de barriles
Después de la pandemia, la demanda de barriles aumentó, ya que no había restricciones de movimiento, por lo que el suministro de productos era fácil. La persistencia de COVID-19 durante un período más largo afectó a la cadena de suministro, ya que se vio interrumpida y se volvió difícil suministrar productos alimenticios a los consumidores, lo que inicialmente aumentó la demanda de productos. Sin embargo, después de COVID-19, la demanda de barriles aumentó significativamente debido al buen contenido de nutrientes y la disponibilidad de otros nutrientes.
Acontecimientos recientes
- En septiembre de 2022, Sonneveld y KeyKeg presentaron el sistema Easy Go Keg a la comunidad de panaderos profesionales de Norteamérica en la IBIE de Las Vegas. Este innovador sistema utiliza un patrón de rociado constante de agentes desmoldantes para productos de panadería de alta calidad, lo que da como resultado un desmoldado perfecto con un bajo costo de uso, una vida útil más prolongada y menos rechazos. Los panaderos pueden aplicar de manera eficiente dosis consistentes y concentradas de agente desmoldante en moldes para hornear, latas, bandejas y cintas transportadoras, gracias a la práctica pistola rociadora del sistema y a los ajustes de presión ajustables. El patrón de rociado también ayuda a mantener la panadería limpia e higiénica al reducir el empañamiento.
- En enero de 2020, American Keg y Blefa Kegs anunciaron una inversión sustancial de capital y tecnología por parte de Blefa en American Keg para garantizar el crecimiento futuro. Este acuerdo garantiza el rápido crecimiento de American Keg en términos de producción y empleo.
Alcance del mercado mundial de barriles
El mercado mundial de barriles se divide en cuatro segmentos importantes según el material, la capacidad, el usuario final y el canal de distribución. El crecimiento entre estos segmentos le ayudará a analizar los principales segmentos de crecimiento en las industrias y brindará a los usuarios una valiosa descripción general del mercado y conocimientos del mercado para ayudarlos a tomar decisiones estratégicas para identificar las principales aplicaciones del mercado.
Material
- Plástico
- Estaño
- Acero inoxidable
Según el tipo, el mercado está segmentado en plástico, estaño y acero inoxidable.
Capacidad
- Hasta 20 litros
- De 20 litros a 40 litros
- De 40 litros a 60 litros
- Más de 60 litros
Según el tipo de producto, el mercado está segmentado en hasta 20 litros, de 20 litros a 40 litros, de 40 litros a 60 litros y más de 60 litros.
Usuario final
- Bebidas alcohólicas
- Bebidas no alcohólicas
- Aceite de cocina
- Productos químicos
- Otros
Según el usuario final, el mercado está segmentado en bebidas alcohólicas, bebidas no alcohólicas, aceite de cocina, productos químicos y otros.
Canal de distribución
- Supermercado/Hipermercado
- Tienda de licores comercial
- Otros
Según el canal de distribución, el mercado está segmentado en supermercados/hipermercados, licorerías comerciales y otros.
Análisis y perspectivas regionales del mercado mundial de barriles
Se analiza el mercado global de barriles y se proporcionan información y tendencias del tamaño del mercado por país, material, capacidad, usuario final y canal de distribución como se menciona anteriormente.
Los países cubiertos en este informe de mercado son EE. UU., Canadá, México, Alemania, Reino Unido, Italia, Francia, España, Suiza, Países Bajos, Bélgica, Rusia, Turquía, resto de Europa, Japón, China, Corea del Sur, India, Australia y Nueva Zelanda, Hong Kong, Taiwán, Australia, Singapur, Tailandia, Indonesia, Malasia, Filipinas, resto de Asia-Pacífico, Sudáfrica, Emiratos Árabes Unidos, Arabia Saudita, Kuwait, resto de Medio Oriente y África, Brasil, Argentina, Venezuela y resto de Sudamérica.
Europa está dominando el mercado de barriles. La creciente demanda de bebidas es la principal razón del crecimiento del mercado. Además, el mercado de bebidas está creciendo progresivamente en la región de Europa. El crecimiento de este mercado afectará directamente el crecimiento del mercado de barriles. Sin embargo, es probable que el alto costo de los barriles comerciales restrinja el crecimiento del mercado. En Europa, Alemania es el país dominante en el mercado debido al aumento en el consumo de bebidas. En América del Norte, Estados Unidos domina debido al aumento en el número de nuevas empresas. En Asia-Pacífico, China domina debido al rápido cambio en el estilo de vida que está aumentando el consumo de alcohol.
La sección de países del informe también proporciona factores de impacto de mercado individuales y cambios en la regulación del mercado que afectan las tendencias actuales y futuras del mercado. Los puntos de datos como el análisis de la cadena de valor aguas abajo y aguas arriba, las tendencias técnicas y el análisis de las cinco fuerzas de Porter, y los estudios de casos son algunos de los indicadores utilizados para pronosticar el escenario del mercado para países individuales. Además, la presencia y disponibilidad de marcas globales y los desafíos que se enfrentan debido a la competencia grande o escasa de las marcas locales y nacionales, y el impacto de los aranceles nacionales y las rutas comerciales se consideran al proporcionar un análisis de pronóstico de los datos del país.
Análisis del panorama competitivo y de la cuota de mercado global de barriles
El panorama competitivo del mercado mundial de barriles de cerveza ofrece detalles por competidor. Los detalles incluidos son una descripción general de la empresa, las finanzas de la empresa, los ingresos generados, el potencial de mercado, la inversión en I+D, las nuevas iniciativas de mercado, la presencia global, los sitios e instalaciones de producción, las capacidades de producción, las fortalezas y debilidades de la empresa, el lanzamiento de productos, la amplitud y variedad de productos y el dominio de las aplicaciones. Los puntos de datos anteriores proporcionados solo están relacionados con el enfoque de las empresas en el mercado.
Algunos de los principales actores que operan en el mercado son AMERICAN KEG COMPANY, NDL Keg Europe, SHINHAN INDUSTRIAL CO,. LTD., BLEFA GmbH, Julius Kleemann GmbH & Co. KG, The Metal Drum Company, Petainer Ltd., NEW MAISONNEUVE KEG, Schaefer Container Systems, Supermonte Group Italy, Inc y KeyKeg, entre otros.
SKU-
Obtenga acceso en línea al informe sobre la primera nube de inteligencia de mercado del mundo

- Panel de análisis de datos interactivo
- Panel de análisis de empresas para oportunidades con alto potencial de crecimiento
- Acceso de analista de investigación para personalización y consultas
- Análisis de la competencia con panel interactivo
- Últimas noticias, actualizaciones y análisis de tendencias
- Aproveche el poder del análisis de referencia para un seguimiento integral de la competencia
Tabla de contenido
1 INTRODUCTION
1.1 OBJECTIVES OF THE STUDY
1.2 MARKET DEFINITION
1.3 OVERVIEW OF GLOBAL KEGS MARKET
1.4 LIMITATIONS
1.5 MARKETS COVERED
2 MARKET SEGMENTATION
2.1 MARKETS COVERED
2.2 GEOGRAPHICAL SCOPE
2.3 YEARS CONSIDERED FOR THE STUDY
2.4 CURRENCY AND PRICING
2.5 DBMR TRIPOD DATA VALIDATION MODEL
2.6 MULTIVARIATE MODELLING
2.7 MATERIAL LIFELINE CURVE
2.8 PRIMARY INTERVIEWS WITH KEY OPINION LEADERS
2.9 DBMR MARKET POSITION GRID
2.1 VENDOR SHARE ANALYSIS
2.11 SECONDARY SOURCES
2.12 ASSUMPTIONS
3 EXECUTIVE SUMMARY
4 PREMIUM INSIGHTS
4.1 PESTEL ANALYSIS
4.2 PORTER’S FIVE FORCES ANALYSIS
4.3 IMPORT-EXPORT ANALYSIS
4.4 LIST OF KEY BUYERS
4.5 PRODUCTION CONSUMPTION ANALYSIS
4.6 TECHNOLOGICAL ADVANCEMENTS BY MANUFACTURERS
4.7 RAW MATERIAL PRODUCTION COVERAGE
5 REGULATION COVERAGE
6 CLIMATE CHANGE SCENARIO
7 SUPPLY CHAIN ANALYSIS
7.1 RAW MATERIAL
7.2 SUPPLYING/MANUFACTURING
7.3 DISTRIBUTION
7.4 END-USERS
8 MARKET OVERVIEW
8.1 DRIVERS
8.1.1 RISING TREND OF LONG-TERM PACKAGING AND PRESERVING SOLUTIONS
8.1.2 INCREASING CONSUMPTION OF BEVERAGES DUE TO CHANGE IN GRADUAL LIFESTYLE
8.1.3 GROWING APPLICATION OF KEGS IN CHEMICAL SECTORS
8.2 RESTRAINTS
8.2.1 HIGH COST ASSOCIATED WITH COMMERCIAL KEGS
8.2.2 SLOW REPLACEMENT OF KEGS DUE TO THEIR PROLONGED LIFESPAN
8.3 OPPORTUNITIES
8.3.1 INCREASED DEMAND FOR ECO-FRIENDLY KEGS AS A RESULT OF THE SUSTAINABILITY TREND
8.3.2 INCREASING ADVANCEMENTS IN TECHNOLOGIES IN KEGS SUCH AS CUTTING-EDGE TECHNOLOGY
8.4 CHALLENGES
8.4.1 WIDE FLUCTUATIONS IN PRICE OF RAW MATERIAL
8.4.2 GROWING STIFF COMPETITION AMONG PLAYERS
9 GLOBAL KEGS MARKET, BY MATERIAL
9.1 OVERVIEW
9.2 STAINLESS STEEL
9.3 PLASTIC
9.4 TIN
10 GLOBAL KEGS MARKET, BY CAPACITY
10.1 OVERVIEW
10.2 40 LITRE TO 60 LITRE
10.3 20 LITRE TO 40 LITRE
10.4 ABOVE 60 LITRE
10.5 UP TO 20 LITRE
11 GLOBAL KEGS MARKET, BY END USER
11.1 OVERVIEW
11.2 ALCOHOLIC BEVERAGES
11.2.1 BEER
11.2.2 WINE
11.2.3 SPIRITS
11.2.4 CIDER
11.3 NON-ALCOHOLIC BEVERAGES
11.3.1 SOFT-DRINKS
11.3.2 RTD-BEVERAGES
11.3.3 JUICES
11.3.4 OTHERS
11.4 CHEMICALS
11.5 COOKING OIL
11.6 OTHERS
12 GLOBAL KEGS MARKET, BY DISTRIBUTION CHANNEL
12.1 OVERVIEW
12.2 COMMERCIAL LIQUOR STORE
12.3 SUPERMARKET / HYPERMARKET
12.4 OTHERS
13 GLOBAL KEGS MARKET, BY REGION
13.1 OVERVIEW
13.2 EUROPE
13.2.1 GERMANY
13.2.2 SPAIN
13.2.3 U.K.
13.2.4 ITALY
13.2.5 FRANCE
13.2.6 NETHERLANDS
13.2.7 BELGIUM
13.2.8 SWITZERLAND
13.2.9 RUSSIA
13.2.10 TURKEY
13.2.11 REST OF EUROPE
13.3 NORTH AMERICA
13.3.1 U.S.
13.3.2 CANADA
13.3.3 MEXICO
13.4 ASIA-PACIFIC
13.4.1 CHINA
13.4.2 AUSTRALIA & NEW ZEALAND
13.4.3 JAPAN
13.4.4 INDIA
13.4.5 SOUTH KOREA
13.4.6 THAILAND
13.4.7 PHILIPPINES
13.4.8 SINGAPORE
13.4.9 MALAYSIA
13.4.10 TAIWAN
13.4.11 INDONESIA
13.4.12 HONG KONG
13.4.13 REST OF ASIA-PACIFIC
13.5 SOUTH AMERICA
13.5.1 BRAZIL
13.5.2 ARGENTINA
13.5.3 VENEZUELA
13.5.4 REST OF SOUTH AMERICA
13.6 MIDDLE EAST & AFRICA
13.6.1 SOUTH AFRICA
13.6.2 UAE
13.6.3 SAUDI ARABIA
13.6.4 ISRAEL
13.6.5 EGYPT
13.6.6 QATAR
13.6.7 KUWAIT
13.6.8 REST OF MIDDLE EAST & AFRICA
14 COMPANY LANDSCAPE
14.1 COMPANY SHARE ANALYSIS: GLOBAL
14.2 COMPANY SHARE ANALYSIS: NORTH AMERICA
14.3 COMPANY SHARE ANALYSIS: EUROPE
14.4 COMPANY SHARE ANALYSIS: ASIA-PACIFIC
15 SWOT ANALYSIS
16 COMPANY PROFILES
16.1 BLEFA GMBH
16.1.1 COMPANY SNAPSHOT
16.1.2 COMPANY SHARE ANALYSIS
16.1.3 PRODUCT PORTFOLIO
16.1.4 RECENT DEVELOPMENTS
16.2 PETAINER LTD.
16.2.1 COMPANY SNAPSHOT
16.2.2 COMPANY SHARE ANALYSIS
16.2.3 PRODUCT PORTFOLIO
16.2.4 RECENT DEVELOPMENT
16.3 JULIUS KLEEMANN GMBH & CO. KG
16.3.1 COMPANY SNAPSHOT
16.3.2 COMPANY SHARE ANALYSIS
16.3.3 PRODUCT PORTFOLIO
16.3.4 RECENT DEVELOPMENT
16.4 NDL KEG EUROPE
16.4.1 COMPANY SNAPSHOT
16.4.2 COMPANY SHARE ANALYSIS
16.4.3 PRODUCT PORTFOLIO
16.4.4 RECENT DEVELOPMENT
16.5 NEW MAISONNEUVE KEG
16.5.1 COMPANY SNAPSHOT
16.5.2 COMPANY SHARE ANALYSIS
16.5.3 PRODUCT PORTFOLIO
16.5.4 RECENT DEVELOPMENT
16.6 AMERICAN KEG COMPANY
16.6.1 COMPANY SNAPSHOT
16.6.2 PRODUCT PORTFOLIO
16.6.3 RECENT DEVELOPMENT
16.7 KEYKEG
16.7.1 COMPANY SNAPSHOT
16.7.2 PRODUCT PORTFOLIO
16.7.3 RECENT DEVELOPMENTS
16.8 SCHAEFER CONTAINER SYSTEMS
16.8.1 COMPANY SNAPSHOT
16.8.2 PRODUCT PORTFOLIO
16.8.3 RECENT DEVELOPMENT
16.9 SHINHAN INDUSTRIAL CO,. LTD.
16.9.1 COMPANY SNAPSHOT
16.9.2 PRODUCT PORTFOLIO
16.9.3 RECENT DEVELOPMENT
16.1 SUPERMONTE GROUP ITALY, INC
16.10.1 COMPANY SNAPSHOT
16.10.2 PRODUCT PORTFOLIO
16.10.3 RECENT DEVELOPMENT
16.11 THE METAL DRUM COMPANY
16.11.1 COMPANY SNAPSHOT
16.11.2 PRODUCT PORTFOLIO
16.11.3 RECENT DEVELOPMENT
17 QUESTIONNAIRE
18 RELATED REPORTS
Lista de Tablas
TABLE 1 IMPORT OF KEGS, 2020-2021, IN USD MILLION
TABLE 2 EXPORT OF KEGS (CASKS, BARRELS, VATS, TUBS AND OTHER COOPERS' PRODUCTS PARTS THEREOF, OF WOOD, INCL. STAVES), 2020-2021, IN USD MILLION
TABLE 3 GLOBAL KEGS MARKET, BY MATERIAL, 2020-2029 (USD MILLION)
TABLE 4 GLOBAL KEGS MARKET, BY MATERIAL, 2020-2029 (THOUSAND UNITS)
TABLE 5 GLOBAL STAINLESS STEEL IN KEGS MARKET, BY REGION, 2020-2029 (USD MILLION)
TABLE 6 GLOBAL STAINLESS STEEL IN KEGS MARKET, BY REGION, 2020-2029 (THOUSAND UNITS)
TABLE 7 GLOBAL PLASTIC IN KEGS MARKET, BY REGION, 2020-2029 (USD MILLION)
TABLE 8 GLOBAL PLASTIC IN KEGS MARKET, BY REGION, 2020-2029 (THOUSAND UNITS)
TABLE 9 GLOBAL TIN IN KEGS MARKET, BY REGION, 2020-2029 (USD MILLION)
TABLE 10 GLOBAL TIN IN KEGS MARKET, BY REGION, 2020-2029 (THOUSAND UNITS)
TABLE 11 GLOBAL KEGS MARKET, BY CAPACITY, 2020-2029 (USD MILLION)
TABLE 12 GLOBAL KEGS MARKET, BY CAPACITY, 2020-2029 (THOUSAND UNITS)
TABLE 13 GLOBAL 40 LITRE TO 60 LITRE IN KEGS MARKET, BY REGION, 2020-2029 (USD MILLION)
TABLE 14 GLOBAL 40 LITRE TO 60 LITRE IN KEGS MARKET, BY REGION, 2020-2029 (THOUSAND UNITS)
TABLE 15 GLOBAL 20 LITRE TO 40 LITRE IN KEGS MARKET, BY REGION, 2020-2029 (USD MILLION)
TABLE 16 GLOBAL 20 LITRE TO 40 LITRE IN KEGS MARKET, BY REGION, 2020-2029 (THOUSAND UNITS)
TABLE 17 GLOBAL ABOVE 60 LITRE IN KEGS MARKET, BY REGION, 2020-2029 (USD MILLION)
TABLE 18 GLOBAL ABOVE 60 LITRE IN KEGS MARKET, BY REGION, 2020-2029 (THOUSAND UNITS)
TABLE 19 GLOBAL UP TO 20 LITRE IN KEGS MARKET, BY REGION, 2020-2029 (USD MILLION)
TABLE 20 GLOBAL UP TO 20 LITRE IN KEGS MARKET, BY REGION, 2020-2029 (THOUSAND UNITS)
TABLE 21 GLOBAL KEGS MARKET, BY END USER, 2020-2029 (USD MILLION)
TABLE 22 GLOBAL KEGS MARKET, BY END USER, 2020-2029 (THOUSAND UNITS)
TABLE 23 GLOBAL ALCOHOLIC BEVERAGES IN KEGS MARKET, BY REGION, 2020-2029 (USD MILLION)
TABLE 24 GLOBAL ALCOHOLIC BEVERAGES IN KEGS MARKET, BY REGION, 2020-2029 (THOUSAND UNITS)
TABLE 25 GLOBAL ALCOHOLIC BEVERAGES IN KEGS MARKET, BY END USER, 2020-2029 (USD MILLION)
TABLE 26 GLOBAL ALCOHOLIC BEVERAGES IN KEGS MARKET, BY END USER, 2020-2029 (THOUSAND UNITS)
TABLE 27 GLOBAL NON-ALCOHOLIC BEVERAGES IN KEGS MARKET, BY REGION, 2020-2029 (USD MILLION)
TABLE 28 GLOBAL NON-ALCOHOLIC BEVERAGES IN KEGS MARKET, BY REGION, 2020-2029 (THOUSAND UNITS)
TABLE 29 GLOBAL NON-ALCOHOLIC BEVERAGES IN KEGS MARKET, BY END USER, 2020-2029 (USD MILLION)
TABLE 30 GLOBAL NON-ALCOHOLIC BEVERAGES IN KEGS MARKET, BY END USER, 2020-2029 (THOUSAND UNITS)
TABLE 31 GLOBAL CHEMICALS IN KEGS MARKET, BY REGION, 2020-2029 (USD MILLION)
TABLE 32 GLOBAL CHEMICALS IN KEGS MARKET, BY REGION, 2020-2029 (THOUSAND UNITS)
TABLE 33 GLOBAL COOKING OIL IN KEGS MARKET, BY REGION, 2020-2029 (USD MILLION)
TABLE 34 GLOBAL COOKING OIL IN KEGS MARKET, BY REGION, 2020-2029 (THOUSAND UNITS)
TABLE 35 GLOBAL OTHERS IN KEGS MARKET, BY REGION, 2020-2029 (USD MILLION)
TABLE 36 GLOBAL OTHERS IN KEGS MARKET, BY REGION, 2020-2029 (THOUSAND UNITS)
TABLE 37 GLOBAL KEGS MARKET, BY DISTRIBUTION CHANNEL, 2020-2029 (USD MILLION)
TABLE 38 GLOBAL KEGS MARKET, BY DISTRIBUTION CHANNEL, 2020-2029 (THOUSAND UNITS)
TABLE 39 GLOBAL COMMERCIAL LIQUOR STORE IN KEGS MARKET, BY REGION, 2020-2029 (USD MILLION)
TABLE 40 GLOBAL COMMERCIAL LIQUOR STORE IN KEGS MARKET, BY REGION, 2020-2029 (THOUSAND UNITS)
TABLE 41 GLOBAL SUPERMARKET / HYPERMARKET IN KEGS MARKET, BY REGION, 2020-2029 (USD MILLION)
TABLE 42 GLOBAL SUPERMARKET / HYPERMARKET IN KEGS MARKET, BY REGION, 2020-2029 (THOUSAND UNITS)
TABLE 43 GLOBAL OTHERS IN KEGS MARKET, BY REGION, 2020-2029 (USD MILLION)
TABLE 44 GLOBAL OTHERS IN KEGS MARKET, BY REGION, 2020-2029 (THOUSAND UNITS)
TABLE 45 GLOBAL KEGS MARKET, BY REGION, 2020-2029 (USD MILLION)
TABLE 46 GLOBAL KEGS MARKET, BY REGION, 2020-2029 (THOUSAND UNITS)
TABLE 47 EUROPE KEGS MARKET, BY COUNTRY, 2020-2029 (USD MILLION)
TABLE 48 EUROPE KEGS MARKET, BY COUNTRY, 2020-2029 (THOUSAND UNITS)
TABLE 49 EUROPE KEGS MARKET, BY MATERIAL, 2020-2029 (USD MILLION)
TABLE 50 EUROPE KEGS MARKET, BY MATERIAL, 2020-2029 (THOUSAND UNITS)
TABLE 51 EUROPE KEGS MARKET, BY CAPACITY, 2020-2029 (USD MILLION)
TABLE 52 EUROPE KEGS MARKET, BY CAPACITY, 2020-2029 (THOUSAND UNITS)
TABLE 53 EUROPE KEGS MARKET, BY END USER, 2020-2029 (USD MILLION)
TABLE 54 EUROPE KEGS MARKET, BY END USER, 2020-2029 (THOUSAND UNITS)
TABLE 55 EUROPE ALCOHOLIC BEVERAGES IN KEGS MARKET, BY END USER, 2020-2029 (USD MILLION)
TABLE 56 EUROPE ALCOHOLIC BEVERAGES IN KEGS MARKET, BY END USER, 2020-2029 (THOUSAND UNITS)
TABLE 57 EUROPE NON-ALCOHOLIC BEVERAGES IN KEGS MARKET, BY END USER, 2020-2029 (USD MILLION)
TABLE 58 EUROPE NON-ALCOHOLIC BEVERAGES IN KEGS MARKET, BY END USER, 2020-2029 (THOUSAND UNITS)
TABLE 59 EUROPE KEGS MARKET, BY DISTRIBUTION CHANNEL, 2020-2029 (USD MILLION)
TABLE 60 EUROPE KEGS MARKET, BY DISTRIBUTION CHANNEL, 2020-2029 (THOUSAND UNITS)
TABLE 61 GERMANY KEGS MARKET, BY MATERIAL, 2020-2029 (USD MILLION)
TABLE 62 GERMANY KEGS MARKET, BY MATERIAL, 2020-2029 (THOUSAND UNITS)
TABLE 63 GERMANY KEGS MARKET, BY CAPACITY, 2020-2029 (USD MILLION)
TABLE 64 GERMANY KEGS MARKET, BY CAPACITY, 2020-2029 (THOUSAND UNITS)
TABLE 65 GERMANY KEGS MARKET, BY END USER, 2020-2029 (USD MILLION)
TABLE 66 GERMANY KEGS MARKET, BY END USER, 2020-2029 (THOUSAND UNITS)
TABLE 67 GERMANY ALCOHOLIC BEVERAGES IN KEGS MARKET, BY END USER, 2020-2029 (USD MILLION)
TABLE 68 GERMANY ALCOHOLIC BEVERAGES IN KEGS MARKET, BY END USER, 2020-2029 (THOUSAND UNITS)
TABLE 69 GERMANY NON-ALCOHOLIC BEVERAGES IN KEGS MARKET, BY END USER, 2020-2029 (USD MILLION)
TABLE 70 GERMANY NON-ALCOHOLIC BEVERAGES IN KEGS MARKET, BY END USER, 2020-2029 (THOUSAND UNITS)
TABLE 71 GERMANY KEGS MARKET, BY DISTRIBUTION CHANNEL, 2020-2029 (USD MILLION)
TABLE 72 GERMANY KEGS MARKET, BY DISTRIBUTION CHANNEL, 2020-2029 (THOUSAND UNITS)
TABLE 73 SPAIN KEGS MARKET, BY MATERIAL, 2020-2029 (USD MILLION)
TABLE 74 SPAIN KEGS MARKET, BY MATERIAL, 2020-2029 (THOUSAND UNITS)
TABLE 75 SPAIN KEGS MARKET, BY CAPACITY, 2020-2029 (USD MILLION)
TABLE 76 SPAIN KEGS MARKET, BY CAPACITY, 2020-2029 (THOUSAND UNITS)
TABLE 77 SPAIN KEGS MARKET, BY END USER, 2020-2029 (USD MILLION)
TABLE 78 SPAIN KEGS MARKET, BY END USER, 2020-2029 (THOUSAND UNITS)
TABLE 79 SPAIN ALCOHOLIC BEVERAGES IN KEGS MARKET, BY END USER, 2020-2029 (USD MILLION)
TABLE 80 SPAIN ALCOHOLIC BEVERAGES IN KEGS MARKET, BY END USER, 2020-2029 (THOUSAND UNITS)
TABLE 81 SPAIN NON-ALCOHOLIC BEVERAGES IN KEGS MARKET, BY END USER, 2020-2029 (USD MILLION)
TABLE 82 SPAIN NON-ALCOHOLIC BEVERAGES IN KEGS MARKET, BY END USER, 2020-2029 (THOUSAND UNITS)
TABLE 83 SPAIN KEGS MARKET, BY DISTRIBUTION CHANNEL, 2020-2029 (USD MILLION)
TABLE 84 SPAIN KEGS MARKET, BY DISTRIBUTION CHANNEL, 2020-2029 (THOUSAND UNITS)
TABLE 85 U.K. KEGS MARKET, BY MATERIAL, 2020-2029 (USD MILLION)
TABLE 86 U.K. KEGS MARKET, BY MATERIAL, 2020-2029 (THOUSAND UNITS)
TABLE 87 U.K. KEGS MARKET, BY CAPACITY, 2020-2029 (USD MILLION)
TABLE 88 U.K. KEGS MARKET, BY CAPACITY, 2020-2029 (THOUSAND UNITS)
TABLE 89 U.K. KEGS MARKET, BY END USER, 2020-2029 (USD MILLION)
TABLE 90 U.K. KEGS MARKET, BY END USER, 2020-2029 (THOUSAND UNITS)
TABLE 91 U.K. ALCOHOLIC BEVERAGES IN KEGS MARKET, BY END USER, 2020-2029 (USD MILLION)
TABLE 92 U.K. ALCOHOLIC BEVERAGES IN KEGS MARKET, BY END USER, 2020-2029 (THOUSAND UNITS)
TABLE 93 U.K. NON-ALCOHOLIC BEVERAGES IN KEGS MARKET, BY END USER, 2020-2029 (USD MILLION)
TABLE 94 U.K. NON-ALCOHOLIC BEVERAGES IN KEGS MARKET, BY END USER, 2020-2029 (THOUSAND UNITS)
TABLE 95 U.K. KEGS MARKET, BY DISTRIBUTION CHANNEL, 2020-2029 (USD MILLION)
TABLE 96 U.K. KEGS MARKET, BY DISTRIBUTION CHANNEL, 2020-2029 (THOUSAND UNITS)
TABLE 97 ITALY KEGS MARKET, BY MATERIAL, 2020-2029 (USD MILLION)
TABLE 98 ITALY KEGS MARKET, BY MATERIAL, 2020-2029 (THOUSAND UNITS)
TABLE 99 ITALY KEGS MARKET, BY CAPACITY, 2020-2029 (USD MILLION)
TABLE 100 ITALY KEGS MARKET, BY CAPACITY, 2020-2029 (THOUSAND UNITS)
TABLE 101 ITALY KEGS MARKET, BY END USER, 2020-2029 (USD MILLION)
TABLE 102 ITALY KEGS MARKET, BY END USER, 2020-2029 (THOUSAND UNITS)
TABLE 103 ITALY ALCOHOLIC BEVERAGES IN KEGS MARKET, BY END USER, 2020-2029 (USD MILLION)
TABLE 104 ITALY ALCOHOLIC BEVERAGES IN KEGS MARKET, BY END USER, 2020-2029 (THOUSAND UNITS)
TABLE 105 ITALY NON-ALCOHOLIC BEVERAGES IN KEGS MARKET, BY END USER, 2020-2029 (USD MILLION)
TABLE 106 ITALY NON-ALCOHOLIC BEVERAGES IN KEGS MARKET, BY END USER, 2020-2029 (THOUSAND UNITS)
TABLE 107 ITALY KEGS MARKET, BY DISTRIBUTION CHANNEL, 2020-2029 (USD MILLION)
TABLE 108 ITALY KEGS MARKET, BY DISTRIBUTION CHANNEL, 2020-2029 (THOUSAND UNITS)
TABLE 109 FRANCE KEGS MARKET, BY MATERIAL, 2020-2029 (USD MILLION)
TABLE 110 FRANCE KEGS MARKET, BY MATERIAL, 2020-2029 (THOUSAND UNITS)
TABLE 111 FRANCE KEGS MARKET, BY CAPACITY, 2020-2029 (USD MILLION)
TABLE 112 FRANCE KEGS MARKET, BY CAPACITY, 2020-2029 (THOUSAND UNITS)
TABLE 113 FRANCE KEGS MARKET, BY END USER, 2020-2029 (USD MILLION)
TABLE 114 FRANCE KEGS MARKET, BY END USER, 2020-2029 (THOUSAND UNITS)
TABLE 115 FRANCE ALCOHOLIC BEVERAGES IN KEGS MARKET, BY END USER, 2020-2029 (USD MILLION)
TABLE 116 FRANCE ALCOHOLIC BEVERAGES IN KEGS MARKET, BY END USER, 2020-2029 (THOUSAND UNITS)
TABLE 117 FRANCE NON-ALCOHOLIC BEVERAGES IN KEGS MARKET, BY END USER, 2020-2029 (USD MILLION)
TABLE 118 FRANCE NON-ALCOHOLIC BEVERAGES IN KEGS MARKET, BY END USER, 2020-2029 (THOUSAND UNITS)
TABLE 119 FRANCE KEGS MARKET, BY DISTRIBUTION CHANNEL, 2020-2029 (USD MILLION)
TABLE 120 FRANCE KEGS MARKET, BY DISTRIBUTION CHANNEL, 2020-2029 (THOUSAND UNITS)
TABLE 121 NETHERLANDS KEGS MARKET, BY MATERIAL, 2020-2029 (USD MILLION)
TABLE 122 NETHERLANDS KEGS MARKET, BY MATERIAL, 2020-2029 (THOUSAND UNITS)
TABLE 123 NETHERLANDS KEGS MARKET, BY CAPACITY, 2020-2029 (USD MILLION)
TABLE 124 NETHERLANDS KEGS MARKET, BY CAPACITY, 2020-2029 (THOUSAND UNITS)
TABLE 125 NETHERLANDS KEGS MARKET, BY END USER, 2020-2029 (USD MILLION)
TABLE 126 NETHERLANDS KEGS MARKET, BY END USER, 2020-2029 (THOUSAND UNITS)
TABLE 127 NETHERLANDS ALCOHOLIC BEVERAGES IN KEGS MARKET, BY END USER, 2020-2029 (USD MILLION)
TABLE 128 NETHERLANDS ALCOHOLIC BEVERAGES IN KEGS MARKET, BY END USER, 2020-2029 (THOUSAND UNITS)
TABLE 129 NETHERLANDS NON-ALCOHOLIC BEVERAGES IN KEGS MARKET, BY END USER, 2020-2029 (USD MILLION)
TABLE 130 NETHERLANDS NON-ALCOHOLIC BEVERAGES IN KEGS MARKET, BY END USER, 2020-2029 (THOUSAND UNITS)
TABLE 131 NETHERLANDS KEGS MARKET, BY DISTRIBUTION CHANNEL, 2020-2029 (USD MILLION)
TABLE 132 NETHERLANDS KEGS MARKET, BY DISTRIBUTION CHANNEL, 2020-2029 (THOUSAND UNITS)
TABLE 133 BELGIUM KEGS MARKET, BY MATERIAL, 2020-2029 (USD MILLION)
TABLE 134 BELGIUM KEGS MARKET, BY MATERIAL, 2020-2029 (THOUSAND UNITS)
TABLE 135 BELGIUM KEGS MARKET, BY CAPACITY, 2020-2029 (USD MILLION)
TABLE 136 BELGIUM KEGS MARKET, BY CAPACITY, 2020-2029 (THOUSAND UNITS)
TABLE 137 BELGIUM KEGS MARKET, BY END USER, 2020-2029 (USD MILLION)
TABLE 138 BELGIUM KEGS MARKET, BY END USER, 2020-2029 (THOUSAND UNITS)
TABLE 139 BELGIUM ALCOHOLIC BEVERAGES IN KEGS MARKET, BY END USER, 2020-2029 (USD MILLION)
TABLE 140 BELGIUM ALCOHOLIC BEVERAGES IN KEGS MARKET, BY END USER, 2020-2029 (THOUSAND UNITS)
TABLE 141 BELGIUM NON-ALCOHOLIC BEVERAGES IN KEGS MARKET, BY END USER, 2020-2029 (USD MILLION)
TABLE 142 BELGIUM NON-ALCOHOLIC BEVERAGES IN KEGS MARKET, BY END USER, 2020-2029 (THOUSAND UNITS)
TABLE 143 BELGIUM KEGS MARKET, BY DISTRIBUTION CHANNEL, 2020-2029 (USD MILLION)
TABLE 144 BELGIUM KEGS MARKET, BY DISTRIBUTION CHANNEL, 2020-2029 (THOUSAND UNITS)
TABLE 145 SWITZERLAND KEGS MARKET, BY MATERIAL, 2020-2029 (USD MILLION)
TABLE 146 SWITZERLAND KEGS MARKET, BY MATERIAL, 2020-2029 (THOUSAND UNITS)
TABLE 147 SWITZERLAND KEGS MARKET, BY CAPACITY, 2020-2029 (USD MILLION)
TABLE 148 SWITZERLAND KEGS MARKET, BY CAPACITY, 2020-2029 (THOUSAND UNITS)
TABLE 149 SWITZERLAND KEGS MARKET, BY END USER, 2020-2029 (USD MILLION)
TABLE 150 SWITZERLAND KEGS MARKET, BY END USER, 2020-2029 (THOUSAND UNITS)
TABLE 151 SWITZERLAND ALCOHOLIC BEVERAGES IN KEGS MARKET, BY END USER, 2020-2029 (USD MILLION)
TABLE 152 SWITZERLAND ALCOHOLIC BEVERAGES IN KEGS MARKET, BY END USER, 2020-2029 (THOUSAND UNITS)
TABLE 153 SWITZERLAND NON-ALCOHOLIC BEVERAGES IN KEGS MARKET, BY END USER, 2020-2029 (USD MILLION)
TABLE 154 SWITZERLAND NON-ALCOHOLIC BEVERAGES IN KEGS MARKET, BY END USER, 2020-2029 (THOUSAND UNITS)
TABLE 155 SWITZERLAND KEGS MARKET, BY DISTRIBUTION CHANNEL, 2020-2029 (USD MILLION)
TABLE 156 SWITZERLAND KEGS MARKET, BY DISTRIBUTION CHANNEL, 2020-2029 (THOUSAND UNITS)
TABLE 157 RUSSIA KEGS MARKET, BY MATERIAL, 2020-2029 (USD MILLION)
TABLE 158 RUSSIA KEGS MARKET, BY MATERIAL, 2020-2029 (THOUSAND UNITS)
TABLE 159 RUSSIA KEGS MARKET, BY CAPACITY, 2020-2029 (USD MILLION)
TABLE 160 RUSSIA KEGS MARKET, BY CAPACITY, 2020-2029 (THOUSAND UNITS)
TABLE 161 RUSSIA KEGS MARKET, BY END USER, 2020-2029 (USD MILLION)
TABLE 162 RUSSIA KEGS MARKET, BY END USER, 2020-2029 (THOUSAND UNITS)
TABLE 163 RUSSIA ALCOHOLIC BEVERAGES IN KEGS MARKET, BY END USER, 2020-2029 (USD MILLION)
TABLE 164 RUSSIA ALCOHOLIC BEVERAGES IN KEGS MARKET, BY END USER, 2020-2029 (THOUSAND UNITS)
TABLE 165 RUSSIA NON-ALCOHOLIC BEVERAGES IN KEGS MARKET, BY END USER, 2020-2029 (USD MILLION)
TABLE 166 RUSSIA NON-ALCOHOLIC BEVERAGES IN KEGS MARKET, BY END USER, 2020-2029 (THOUSAND UNITS)
TABLE 167 RUSSIA KEGS MARKET, BY DISTRIBUTION CHANNEL, 2020-2029 (USD MILLION)
TABLE 168 RUSSIA KEGS MARKET, BY DISTRIBUTION CHANNEL, 2020-2029 (THOUSAND UNITS)
TABLE 169 TURKEY KEGS MARKET, BY MATERIAL, 2020-2029 (USD MILLION)
TABLE 170 TURKEY KEGS MARKET, BY MATERIAL, 2020-2029 (THOUSAND UNITS)
TABLE 171 TURKEY KEGS MARKET, BY CAPACITY, 2020-2029 (USD MILLION)
TABLE 172 TURKEY KEGS MARKET, BY CAPACITY, 2020-2029 (THOUSAND UNITS)
TABLE 173 TURKEY KEGS MARKET, BY END USER, 2020-2029 (USD MILLION)
TABLE 174 TURKEY KEGS MARKET, BY END USER, 2020-2029 (THOUSAND UNITS)
TABLE 175 TURKEY ALCOHOLIC BEVERAGES IN KEGS MARKET, BY END USER, 2020-2029 (USD MILLION)
TABLE 176 TURKEY ALCOHOLIC BEVERAGES IN KEGS MARKET, BY END USER, 2020-2029 (THOUSAND UNITS)
TABLE 177 TURKEY NON-ALCOHOLIC BEVERAGES IN KEGS MARKET, BY END USER, 2020-2029 (USD MILLION)
TABLE 178 TURKEY NON-ALCOHOLIC BEVERAGES IN KEGS MARKET, BY END USER, 2020-2029 (THOUSAND UNITS)
TABLE 179 TURKEY KEGS MARKET, BY DISTRIBUTION CHANNEL, 2020-2029 (USD MILLION)
TABLE 180 TURKEY KEGS MARKET, BY DISTRIBUTION CHANNEL, 2020-2029 (THOUSAND UNITS)
TABLE 181 REST OF EUROPE KEGS MARKET, BY MATERIAL, 2020-2029 (USD MILLION)
TABLE 182 NORTH AMERICA KEGS MARKET, BY COUNTRY, 2020-2029 (USD MILLION)
TABLE 183 NORTH AMERICA KEGS MARKET, BY COUNTRY, 2020-2029 (THOUSAND UNITS)
TABLE 184 NORTH AMERICA KEGS MARKET, BY MATERIAL, 2020-2029 (USD MILLION)
TABLE 185 NORTH AMERICA KEGS MARKET, BY MATERIAL, 2020-2029 (THOUSAND UNITS)
TABLE 186 NORTH AMERICA KEGS MARKET, BY CAPACITY, 2020-2029 (USD MILLION)
TABLE 187 NORTH AMERICA KEGS MARKET, BY CAPACITY, 2020-2029 (THOUSAND UNITS)
TABLE 188 NORTH AMERICA KEGS MARKET, BY END USER, 2020-2029 (USD MILLION)
TABLE 189 NORTH AMERICA KEGS MARKET, BY END USER, 2020-2029 (THOUSAND UNITS)
TABLE 190 NORTH AMERICA ALCOHOLIC BEVERAGES IN KEGS MARKET, BY END USER, 2020-2029 (USD MILLION)
TABLE 191 NORTH AMERICA ALCOHOLIC BEVERAGES IN KEGS MARKET, BY END USER, 2020-2029 (THOUSAND UNITS)
TABLE 192 NORTH AMERICA NON-ALCOHOLIC BEVERAGES IN KEGS MARKET, BY END USER, 2020-2029 (USD MILLION)
TABLE 193 NORTH AMERICA NON-ALCOHOLIC BEVERAGES IN KEGS MARKET, BY END USER, 2020-2029 (THOUSAND UNITS)
TABLE 194 NORTH AMERICA KEGS MARKET, BY DISTRIBUTION CHANNEL, 2020-2029 (USD MILLION)
TABLE 195 NORTH AMERICA KEGS MARKET, BY DISTRIBUTION CHANNEL, 2020-2029 (THOUSAND UNITS)
TABLE 196 U.S. KEGS MARKET, BY MATERIAL, 2020-2029 (USD MILLION)
TABLE 197 U.S. KEGS MARKET, BY MATERIAL, 2020-2029 (THOUSAND UNITS)
TABLE 198 U.S. KEGS MARKET, BY CAPACITY, 2020-2029 (USD MILLION)
TABLE 199 U.S. KEGS MARKET, BY CAPACITY, 2020-2029 (THOUSAND UNITS)
TABLE 200 U.S. KEGS MARKET, BY END USER, 2020-2029 (USD MILLION)
TABLE 201 U.S. KEGS MARKET, BY END USER, 2020-2029 (THOUSAND UNITS)
TABLE 202 U.S. ALCOHOLIC BEVERAGES IN KEGS MARKET, BY END USER, 2020-2029 (USD MILLION)
TABLE 203 U.S. ALCOHOLIC BEVERAGES IN KEGS MARKET, BY END USER, 2020-2029 (THOUSAND UNITS)
TABLE 204 U.S. NON-ALCOHOLIC BEVERAGES IN KEGS MARKET, BY END USER, 2020-2029 (USD MILLION)
TABLE 205 U.S. NON-ALCOHOLIC BEVERAGES IN KEGS MARKET, BY END USER, 2020-2029 (THOUSAND UNITS)
TABLE 206 U.S. KEGS MARKET, BY DISTRIBUTION CHANNEL, 2020-2029 (USD MILLION)
TABLE 207 U.S. KEGS MARKET, BY DISTRIBUTION CHANNEL, 2020-2029 (THOUSAND UNITS)
TABLE 208 CANADA KEGS MARKET, BY MATERIAL, 2020-2029 (USD MILLION)
TABLE 209 CANADA KEGS MARKET, BY MATERIAL, 2020-2029 (THOUSAND UNITS)
TABLE 210 CANADA KEGS MARKET, BY CAPACITY, 2020-2029 (USD MILLION)
TABLE 211 CANADA KEGS MARKET, BY CAPACITY, 2020-2029 (THOUSAND UNITS)
TABLE 212 CANADA KEGS MARKET, BY END USER, 2020-2029 (USD MILLION)
TABLE 213 CANADA KEGS MARKET, BY END USER, 2020-2029 (THOUSAND UNITS)
TABLE 214 CANADA ALCOHOLIC BEVERAGES IN KEGS MARKET, BY END USER, 2020-2029 (USD MILLION)
TABLE 215 CANADA ALCOHOLIC BEVERAGES IN KEGS MARKET, BY END USER, 2020-2029 (THOUSAND UNITS)
TABLE 216 CANADA NON-ALCOHOLIC BEVERAGES IN KEGS MARKET, BY END USER, 2020-2029 (USD MILLION)
TABLE 217 CANADA NON-ALCOHOLIC BEVERAGES IN KEGS MARKET, BY END USER, 2020-2029 (THOUSAND UNITS)
TABLE 218 CANADA KEGS MARKET, BY DISTRIBUTION CHANNEL, 2020-2029 (USD MILLION)
TABLE 219 CANADA KEGS MARKET, BY DISTRIBUTION CHANNEL, 2020-2029 (THOUSAND UNITS)
TABLE 220 MEXICO KEGS MARKET, BY MATERIAL, 2020-2029 (USD MILLION)
TABLE 221 MEXICO KEGS MARKET, BY MATERIAL, 2020-2029 (THOUSAND UNITS)
TABLE 222 MEXICO KEGS MARKET, BY CAPACITY, 2020-2029 (USD MILLION)
TABLE 223 MEXICO KEGS MARKET, BY CAPACITY, 2020-2029 (THOUSAND UNITS)
TABLE 224 MEXICO KEGS MARKET, BY END USER, 2020-2029 (USD MILLION)
TABLE 225 MEXICO KEGS MARKET, BY END USER, 2020-2029 (THOUSAND UNITS)
TABLE 226 MEXICO ALCOHOLIC BEVERAGES IN KEGS MARKET, BY END USER, 2020-2029 (USD MILLION)
TABLE 227 MEXICO ALCOHOLIC BEVERAGES IN KEGS MARKET, BY END USER, 2020-2029 (THOUSAND UNITS)
TABLE 228 MEXICO NON-ALCOHOLIC BEVERAGES IN KEGS MARKET, BY END USER, 2020-2029 (USD MILLION)
TABLE 229 MEXICO NON-ALCOHOLIC BEVERAGES IN KEGS MARKET, BY END USER, 2020-2029 (THOUSAND UNITS)
TABLE 230 MEXICO KEGS MARKET, BY DISTRIBUTION CHANNEL, 2020-2029 (USD MILLION)
TABLE 231 MEXICO KEGS MARKET, BY DISTRIBUTION CHANNEL, 2020-2029 (THOUSAND UNITS)
TABLE 232 ASIA-PACIFIC KEGS MARKET, BY COUNTRY, 2020-2029 (USD MILLION)
TABLE 233 ASIA-PACIFIC KEGS MARKET, BY COUNTRY, 2020-2029 (THOUSAND UNITS)
TABLE 234 ASIA-PACIFIC KEGS MARKET, BY MATERIAL, 2020-2029 (USD MILLION)
TABLE 235 ASIA-PACIFIC KEGS MARKET, BY MATERIAL, 2020-2029 (THOUSAND UNITS)
TABLE 236 ASIA-PACIFIC KEGS MARKET, BY CAPACITY, 2020-2029 (USD MILLION)
TABLE 237 ASIA-PACIFIC KEGS MARKET, BY CAPACITY, 2020-2029 (THOUSAND UNITS)
TABLE 238 ASIA-PACIFIC KEGS MARKET, BY END USER, 2020-2029 (USD MILLION)
TABLE 239 ASIA-PACIFIC KEGS MARKET, BY END USER, 2020-2029 (THOUSAND UNITS)
TABLE 240 ASIA-PACIFIC ALCOHOLIC BEVERAGES IN KEGS MARKET, BY END USER, 2020-2029 (USD MILLION)
TABLE 241 ASIA-PACIFIC ALCOHOLIC BEVERAGES IN KEGS MARKET, BY END USER, 2020-2029 (THOUSAND UNITS)
TABLE 242 ASIA-PACIFIC NON-ALCOHOLIC BEVERAGES IN KEGS MARKET, BY END USER, 2020-2029 (USD MILLION)
TABLE 243 ASIA-PACIFIC NON-ALCOHOLIC BEVERAGES IN KEGS MARKET, BY END USER, 2020-2029 (THOUSAND UNITS)
TABLE 244 ASIA-PACIFIC KEGS MARKET, BY DISTRIBUTION CHANNEL, 2020-2029 (USD MILLION)
TABLE 245 ASIA-PACIFIC KEGS MARKET, BY DISTRIBUTION CHANNEL, 2020-2029 (THOUSAND UNITS)
TABLE 246 CHINA KEGS MARKET, BY MATERIAL, 2020-2029 (USD MILLION)
TABLE 247 CHINA KEGS MARKET, BY MATERIAL, 2020-2029 (THOUSAND UNITS)
TABLE 248 CHINA KEGS MARKET, BY CAPACITY, 2020-2029 (USD MILLION)
TABLE 249 CHINA KEGS MARKET, BY CAPACITY, 2020-2029 (THOUSAND UNITS)
TABLE 250 CHINA KEGS MARKET, BY END USER, 2020-2029 (USD MILLION)
TABLE 251 CHINA KEGS MARKET, BY END USER, 2020-2029 (THOUSAND UNITS)
TABLE 252 CHINA ALCOHOLIC BEVERAGES IN KEGS MARKET, BY END USER, 2020-2029 (USD MILLION)
TABLE 253 CHINA ALCOHOLIC BEVERAGES IN KEGS MARKET, BY END USER, 2020-2029 (THOUSAND UNITS)
TABLE 254 CHINA NON-ALCOHOLIC BEVERAGES IN KEGS MARKET, BY END USER, 2020-2029 (USD MILLION)
TABLE 255 CHINA NON-ALCOHOLIC BEVERAGES IN KEGS MARKET, BY END USER, 2020-2029 (THOUSAND UNITS)
TABLE 256 CHINA KEGS MARKET, BY DISTRIBUTION CHANNEL, 2020-2029 (USD MILLION)
TABLE 257 CHINA KEGS MARKET, BY DISTRIBUTION CHANNEL, 2020-2029 (THOUSAND UNITS)
TABLE 258 AUSTRALIA & NEW ZEALAND KEGS MARKET, BY MATERIAL, 2020-2029 (USD MILLION)
TABLE 259 AUSTRALIA & NEW ZEALAND KEGS MARKET, BY MATERIAL, 2020-2029 (THOUSAND UNITS)
TABLE 260 AUSTRALIA & NEW ZEALAND KEGS MARKET, BY CAPACITY, 2020-2029 (USD MILLION)
TABLE 261 AUSTRALIA & NEW ZEALAND KEGS MARKET, BY CAPACITY, 2020-2029 (THOUSAND UNITS)
TABLE 262 AUSTRALIA & NEW ZEALAND KEGS MARKET, BY END USER, 2020-2029 (USD MILLION)
TABLE 263 AUSTRALIA & NEW ZEALAND KEGS MARKET, BY END USER, 2020-2029 (THOUSAND UNITS)
TABLE 264 AUSTRALIA & NEW ZEALAND ALCOHOLIC BEVERAGES IN KEGS MARKET, BY END USER, 2020-2029 (USD MILLION)
TABLE 265 AUSTRALIA & NEW ZEALAND ALCOHOLIC BEVERAGES IN KEGS MARKET, BY END USER, 2020-2029 (THOUSAND UNITS)
TABLE 266 AUSTRALIA & NEW ZEALAND NON-ALCOHOLIC BEVERAGES IN KEGS MARKET, BY END USER, 2020-2029 (USD MILLION)
TABLE 267 AUSTRALIA & NEW ZEALAND NON-ALCOHOLIC BEVERAGES IN KEGS MARKET, BY END USER, 2020-2029 (THOUSAND UNITS)
TABLE 268 AUSTRALIA & NEW ZEALAND KEGS MARKET, BY DISTRIBUTION CHANNEL, 2020-2029 (USD MILLION)
TABLE 269 AUSTRALIA & NEW ZEALAND KEGS MARKET, BY DISTRIBUTION CHANNEL, 2020-2029 (THOUSAND UNITS)
TABLE 270 JAPAN KEGS MARKET, BY MATERIAL, 2020-2029 (USD MILLION)
TABLE 271 JAPAN KEGS MARKET, BY MATERIAL, 2020-2029 (THOUSAND UNITS)
TABLE 272 JAPAN KEGS MARKET, BY CAPACITY, 2020-2029 (USD MILLION)
TABLE 273 JAPAN KEGS MARKET, BY CAPACITY, 2020-2029 (THOUSAND UNITS)
TABLE 274 JAPAN KEGS MARKET, BY END USER, 2020-2029 (USD MILLION)
TABLE 275 JAPAN KEGS MARKET, BY END USER, 2020-2029 (THOUSAND UNITS)
TABLE 276 JAPAN ALCOHOLIC BEVERAGES IN KEGS MARKET, BY END USER, 2020-2029 (USD MILLION)
TABLE 277 JAPAN ALCOHOLIC BEVERAGES IN KEGS MARKET, BY END USER, 2020-2029 (THOUSAND UNITS)
TABLE 278 JAPAN NON-ALCOHOLIC BEVERAGES IN KEGS MARKET, BY END USER, 2020-2029 (USD MILLION)
TABLE 279 JAPAN NON-ALCOHOLIC BEVERAGES IN KEGS MARKET, BY END USER, 2020-2029 (THOUSAND UNITS)
TABLE 280 JAPAN KEGS MARKET, BY DISTRIBUTION CHANNEL, 2020-2029 (USD MILLION)
TABLE 281 JAPAN KEGS MARKET, BY DISTRIBUTION CHANNEL, 2020-2029 (THOUSAND UNITS)
TABLE 282 INDIA KEGS MARKET, BY MATERIAL, 2020-2029 (USD MILLION)
TABLE 283 INDIA KEGS MARKET, BY MATERIAL, 2020-2029 (THOUSAND UNITS)
TABLE 284 INDIA KEGS MARKET, BY CAPACITY, 2020-2029 (USD MILLION)
TABLE 285 INDIA KEGS MARKET, BY CAPACITY, 2020-2029 (THOUSAND UNITS)
TABLE 286 INDIA KEGS MARKET, BY END USER, 2020-2029 (USD MILLION)
TABLE 287 INDIA KEGS MARKET, BY END USER, 2020-2029 (THOUSAND UNITS)
TABLE 288 INDIA ALCOHOLIC BEVERAGES IN KEGS MARKET, BY END USER, 2020-2029 (USD MILLION)
TABLE 289 INDIA ALCOHOLIC BEVERAGES IN KEGS MARKET, BY END USER, 2020-2029 (THOUSAND UNITS)
TABLE 290 INDIA NON-ALCOHOLIC BEVERAGES IN KEGS MARKET, BY END USER, 2020-2029 (USD MILLION)
TABLE 291 INDIA NON-ALCOHOLIC BEVERAGES IN KEGS MARKET, BY END USER, 2020-2029 (THOUSAND UNITS)
TABLE 292 INDIA KEGS MARKET, BY DISTRIBUTION CHANNEL, 2020-2029 (USD MILLION)
TABLE 293 INDIA KEGS MARKET, BY DISTRIBUTION CHANNEL, 2020-2029 (THOUSAND UNITS)
TABLE 294 SOUTH KOREA KEGS MARKET, BY MATERIAL, 2020-2029 (USD MILLION)
TABLE 295 SOUTH KOREA KEGS MARKET, BY MATERIAL, 2020-2029 (THOUSAND UNITS)
TABLE 296 SOUTH KOREA KEGS MARKET, BY CAPACITY, 2020-2029 (USD MILLION)
TABLE 297 SOUTH KOREA KEGS MARKET, BY CAPACITY, 2020-2029 (THOUSAND UNITS)
TABLE 298 SOUTH KOREA KEGS MARKET, BY END USER, 2020-2029 (USD MILLION)
TABLE 299 SOUTH KOREA KEGS MARKET, BY END USER, 2020-2029 (THOUSAND UNITS)
TABLE 300 SOUTH KOREA ALCOHOLIC BEVERAGES IN KEGS MARKET, BY END USER, 2020-2029 (USD MILLION)
TABLE 301 SOUTH KOREA ALCOHOLIC BEVERAGES IN KEGS MARKET, BY END USER, 2020-2029 (THOUSAND UNITS)
TABLE 302 SOUTH KOREA NON-ALCOHOLIC BEVERAGES IN KEGS MARKET, BY END USER, 2020-2029 (USD MILLION)
TABLE 303 SOUTH KOREA NON-ALCOHOLIC BEVERAGES IN KEGS MARKET, BY END USER, 2020-2029 (THOUSAND UNITS)
TABLE 304 SOUTH KOREA KEGS MARKET, BY DISTRIBUTION CHANNEL, 2020-2029 (USD MILLION)
TABLE 305 SOUTH KOREA KEGS MARKET, BY DISTRIBUTION CHANNEL, 2020-2029 (THOUSAND UNITS)
TABLE 306 THAILAND KEGS MARKET, BY MATERIAL, 2020-2029 (USD MILLION)
TABLE 307 THAILAND KEGS MARKET, BY MATERIAL, 2020-2029 (THOUSAND UNITS)
TABLE 308 THAILAND KEGS MARKET, BY CAPACITY, 2020-2029 (USD MILLION)
TABLE 309 THAILAND KEGS MARKET, BY CAPACITY, 2020-2029 (THOUSAND UNITS)
TABLE 310 THAILAND KEGS MARKET, BY END USER, 2020-2029 (USD MILLION)
TABLE 311 THAILAND KEGS MARKET, BY END USER, 2020-2029 (THOUSAND UNITS)
TABLE 312 THAILAND ALCOHOLIC BEVERAGES IN KEGS MARKET, BY END USER, 2020-2029 (USD MILLION)
TABLE 313 THAILAND ALCOHOLIC BEVERAGES IN KEGS MARKET, BY END USER, 2020-2029 (THOUSAND UNITS)
TABLE 314 THAILAND NON-ALCOHOLIC BEVERAGES IN KEGS MARKET, BY END USER, 2020-2029 (USD MILLION)
TABLE 315 THAILAND NON-ALCOHOLIC BEVERAGES IN KEGS MARKET, BY END USER, 2020-2029 (THOUSAND UNITS)
TABLE 316 THAILAND KEGS MARKET, BY DISTRIBUTION CHANNEL, 2020-2029 (USD MILLION)
TABLE 317 THAILAND KEGS MARKET, BY DISTRIBUTION CHANNEL, 2020-2029 (THOUSAND UNITS)
TABLE 318 PHILIPPINES KEGS MARKET, BY MATERIAL, 2020-2029 (USD MILLION)
TABLE 319 PHILIPPINES KEGS MARKET, BY MATERIAL, 2020-2029 (THOUSAND UNITS)
TABLE 320 PHILIPPINES KEGS MARKET, BY CAPACITY, 2020-2029 (USD MILLION)
TABLE 321 PHILIPPINES KEGS MARKET, BY CAPACITY, 2020-2029 (THOUSAND UNITS)
TABLE 322 PHILIPPINES KEGS MARKET, BY END USER, 2020-2029 (USD MILLION)
TABLE 323 PHILIPPINES KEGS MARKET, BY END USER, 2020-2029 (THOUSAND UNITS)
TABLE 324 PHILIPPINES ALCOHOLIC BEVERAGES IN KEGS MARKET, BY END USER, 2020-2029 (USD MILLION)
TABLE 325 PHILIPPINES ALCOHOLIC BEVERAGES IN KEGS MARKET, BY END USER, 2020-2029 (THOUSAND UNITS)
TABLE 326 PHILIPPINES NON-ALCOHOLIC BEVERAGES IN KEGS MARKET, BY END USER, 2020-2029 (USD MILLION)
TABLE 327 PHILIPPINES NON-ALCOHOLIC BEVERAGES IN KEGS MARKET, BY END USER, 2020-2029 (THOUSAND UNITS)
TABLE 328 PHILIPPINES KEGS MARKET, BY DISTRIBUTION CHANNEL, 2020-2029 (USD MILLION)
TABLE 329 PHILIPPINES KEGS MARKET, BY DISTRIBUTION CHANNEL, 2020-2029 (THOUSAND UNITS)
TABLE 330 SINGAPORE KEGS MARKET, BY MATERIAL, 2020-2029 (USD MILLION)
TABLE 331 SINGAPORE KEGS MARKET, BY MATERIAL, 2020-2029 (THOUSAND UNITS)
TABLE 332 SINGAPORE KEGS MARKET, BY CAPACITY, 2020-2029 (USD MILLION)
TABLE 333 SINGAPORE KEGS MARKET, BY CAPACITY, 2020-2029 (THOUSAND UNITS)
TABLE 334 SINGAPORE KEGS MARKET, BY END USER, 2020-2029 (USD MILLION)
TABLE 335 SINGAPORE KEGS MARKET, BY END USER, 2020-2029 (THOUSAND UNITS)
TABLE 336 SINGAPORE ALCOHOLIC BEVERAGES IN KEGS MARKET, BY END USER, 2020-2029 (USD MILLION)
TABLE 337 SINGAPORE ALCOHOLIC BEVERAGES IN KEGS MARKET, BY END USER, 2020-2029 (THOUSAND UNITS)
TABLE 338 SINGAPORE NON-ALCOHOLIC BEVERAGES IN KEGS MARKET, BY END USER, 2020-2029 (USD MILLION)
TABLE 339 SINGAPORE NON-ALCOHOLIC BEVERAGES IN KEGS MARKET, BY END USER, 2020-2029 (THOUSAND UNITS)
TABLE 340 SINGAPORE KEGS MARKET, BY DISTRIBUTION CHANNEL, 2020-2029 (USD MILLION)
TABLE 341 SINGAPORE KEGS MARKET, BY DISTRIBUTION CHANNEL, 2020-2029 (THOUSAND UNITS)
TABLE 342 MALAYSIA KEGS MARKET, BY MATERIAL, 2020-2029 (USD MILLION)
TABLE 343 MALAYSIA KEGS MARKET, BY MATERIAL, 2020-2029 (THOUSAND UNITS)
TABLE 344 MALAYSIA KEGS MARKET, BY CAPACITY, 2020-2029 (USD MILLION)
TABLE 345 MALAYSIA KEGS MARKET, BY CAPACITY, 2020-2029 (THOUSAND UNITS)
TABLE 346 MALAYSIA KEGS MARKET, BY END USER, 2020-2029 (USD MILLION)
TABLE 347 MALAYSIA KEGS MARKET, BY END USER, 2020-2029 (THOUSAND UNITS)
TABLE 348 MALAYSIA ALCOHOLIC BEVERAGES IN KEGS MARKET, BY END USER, 2020-2029 (USD MILLION)
TABLE 349 MALAYSIA ALCOHOLIC BEVERAGES IN KEGS MARKET, BY END USER, 2020-2029 (THOUSAND UNITS)
TABLE 350 MALAYSIA NON-ALCOHOLIC BEVERAGES IN KEGS MARKET, BY END USER, 2020-2029 (USD MILLION)
TABLE 351 MALAYSIA NON-ALCOHOLIC BEVERAGES IN KEGS MARKET, BY END USER, 2020-2029 (THOUSAND UNITS)
TABLE 352 MALAYSIA KEGS MARKET, BY DISTRIBUTION CHANNEL, 2020-2029 (USD MILLION)
TABLE 353 MALAYSIA KEGS MARKET, BY DISTRIBUTION CHANNEL, 2020-2029 (THOUSAND UNITS)
TABLE 354 TAIWAN KEGS MARKET, BY MATERIAL, 2020-2029 (USD MILLION)
TABLE 355 TAIWAN KEGS MARKET, BY MATERIAL, 2020-2029 (THOUSAND UNITS)
TABLE 356 TAIWAN KEGS MARKET, BY CAPACITY, 2020-2029 (USD MILLION)
TABLE 357 TAIWAN KEGS MARKET, BY CAPACITY, 2020-2029 (THOUSAND UNITS)
TABLE 358 TAIWAN KEGS MARKET, BY END USER, 2020-2029 (USD MILLION)
TABLE 359 TAIWAN KEGS MARKET, BY END USER, 2020-2029 (THOUSAND UNITS)
TABLE 360 TAIWAN ALCOHOLIC BEVERAGES IN KEGS MARKET, BY END USER, 2020-2029 (USD MILLION)
TABLE 361 TAIWAN ALCOHOLIC BEVERAGES IN KEGS MARKET, BY END USER, 2020-2029 (THOUSAND UNITS)
TABLE 362 TAIWAN NON-ALCOHOLIC BEVERAGES IN KEGS MARKET, BY END USER, 2020-2029 (USD MILLION)
TABLE 363 TAIWAN NON-ALCOHOLIC BEVERAGES IN KEGS MARKET, BY END USER, 2020-2029 (THOUSAND UNITS)
TABLE 364 TAIWAN KEGS MARKET, BY DISTRIBUTION CHANNEL, 2020-2029 (USD MILLION)
TABLE 365 TAIWAN KEGS MARKET, BY DISTRIBUTION CHANNEL, 2020-2029 (THOUSAND UNITS)
TABLE 366 INDONESIA KEGS MARKET, BY MATERIAL, 2020-2029 (USD MILLION)
TABLE 367 INDONESIA KEGS MARKET, BY MATERIAL, 2020-2029 (THOUSAND UNITS)
TABLE 368 INDONESIA KEGS MARKET, BY CAPACITY, 2020-2029 (USD MILLION)
TABLE 369 INDONESIA KEGS MARKET, BY CAPACITY, 2020-2029 (THOUSAND UNITS)
TABLE 370 INDONESIA KEGS MARKET, BY END USER, 2020-2029 (USD MILLION)
TABLE 371 INDONESIA KEGS MARKET, BY END USER, 2020-2029 (THOUSAND UNITS)
TABLE 372 INDONESIA ALCOHOLIC BEVERAGES IN KEGS MARKET, BY END USER, 2020-2029 (USD MILLION)
TABLE 373 INDONESIA ALCOHOLIC BEVERAGES IN KEGS MARKET, BY END USER, 2020-2029 (THOUSAND UNITS)
TABLE 374 INDONESIA NON-ALCOHOLIC BEVERAGES IN KEGS MARKET, BY END USER, 2020-2029 (USD MILLION)
TABLE 375 INDONESIA NON-ALCOHOLIC BEVERAGES IN KEGS MARKET, BY END USER, 2020-2029 (THOUSAND UNITS)
TABLE 376 INDONESIA KEGS MARKET, BY DISTRIBUTION CHANNEL, 2020-2029 (USD MILLION)
TABLE 377 INDONESIA KEGS MARKET, BY DISTRIBUTION CHANNEL, 2020-2029 (THOUSAND UNITS)
TABLE 378 HONG KONG KEGS MARKET, BY MATERIAL, 2020-2029 (USD MILLION)
TABLE 379 HONG KONG KEGS MARKET, BY MATERIAL, 2020-2029 (THOUSAND UNITS)
TABLE 380 HONG KONG KEGS MARKET, BY CAPACITY, 2020-2029 (USD MILLION)
TABLE 381 HONG KONG KEGS MARKET, BY CAPACITY, 2020-2029 (THOUSAND UNITS)
TABLE 382 HONG KONG KEGS MARKET, BY END USER, 2020-2029 (USD MILLION)
TABLE 383 HONG KONG KEGS MARKET, BY END USER, 2020-2029 (THOUSAND UNITS)
TABLE 384 HONG KONG ALCOHOLIC BEVERAGES IN KEGS MARKET, BY END USER, 2020-2029 (USD MILLION)
TABLE 385 HONG KONG ALCOHOLIC BEVERAGES IN KEGS MARKET, BY END USER, 2020-2029 (THOUSAND UNITS)
TABLE 386 HONG KONG NON-ALCOHOLIC BEVERAGES IN KEGS MARKET, BY END USER, 2020-2029 (USD MILLION)
TABLE 387 HONG KONG NON-ALCOHOLIC BEVERAGES IN KEGS MARKET, BY END USER, 2020-2029 (THOUSAND UNITS)
TABLE 388 HONG KONG KEGS MARKET, BY DISTRIBUTION CHANNEL, 2020-2029 (USD MILLION)
TABLE 389 HONG KONG KEGS MARKET, BY DISTRIBUTION CHANNEL, 2020-2029 (THOUSAND UNITS)
TABLE 390 REST OF ASIA-PACIFIC KEGS MARKET, BY MATERIAL, 2020-2029 (USD MILLION)
TABLE 391 SOUTH AMERICA KEGS MARKET, BY COUNTRY, 2020-2029 (USD MILLION)
TABLE 392 SOUTH AMERICA KEGS MARKET, BY COUNTRY, 2020-2029 (THOUSAND UNITS)
TABLE 393 SOUTH AMERICA KEGS MARKET, BY MATERIAL, 2020-2029 (USD MILLION)
TABLE 394 SOUTH AMERICA KEGS MARKET, BY MATERIAL, 2020-2029 (THOUSAND UNITS)
TABLE 395 SOUTH AMERICA KEGS MARKET, BY CAPACITY, 2020-2029 (USD MILLION)
TABLE 396 SOUTH AMERICA KEGS MARKET, BY CAPACITY, 2020-2029 (THOUSAND UNITS)
TABLE 397 SOUTH AMERICA KEGS MARKET, BY END USER, 2020-2029 (USD MILLION)
TABLE 398 SOUTH AMERICA KEGS MARKET, BY END USER, 2020-2029 (THOUSAND UNITS)
TABLE 399 SOUTH AMERICA ALCOHOLIC BEVERAGES IN KEGS MARKET, BY END USER, 2020-2029 (USD MILLION)
TABLE 400 SOUTH AMERICA ALCOHOLIC BEVERAGES IN KEGS MARKET, BY END USER, 2020-2029 (THOUSAND UNITS)
TABLE 401 SOUTH AMERICA NON-ALCOHOLIC BEVERAGES IN KEGS MARKET, BY END USER, 2020-2029 (USD MILLION)
TABLE 402 SOUTH AMERICA NON-ALCOHOLIC BEVERAGES IN KEGS MARKET, BY END USER, 2020-2029 (THOUSAND UNITS)
TABLE 403 SOUTH AMERICA KEGS MARKET, BY DISTRIBUTION CHANNEL, 2020-2029 (USD MILLION)
TABLE 404 SOUTH AMERICA KEGS MARKET, BY DISTRIBUTION CHANNEL, 2020-2029 (THOUSAND UNITS)
TABLE 405 BRAZIL KEGS MARKET, BY MATERIAL, 2020-2029 (USD MILLION)
TABLE 406 BRAZIL KEGS MARKET, BY MATERIAL, 2020-2029 (THOUSAND UNITS)
TABLE 407 BRAZIL KEGS MARKET, BY CAPACITY, 2020-2029 (USD MILLION)
TABLE 408 BRAZIL KEGS MARKET, BY CAPACITY, 2020-2029 (THOUSAND UNITS)
TABLE 409 BRAZIL KEGS MARKET, BY END USER, 2020-2029 (USD MILLION)
TABLE 410 BRAZIL KEGS MARKET, BY END USER, 2020-2029 (THOUSAND UNITS)
TABLE 411 BRAZIL ALCOHOLIC BEVERAGES IN KEGS MARKET, BY END USER, 2020-2029 (USD MILLION)
TABLE 412 BRAZIL ALCOHOLIC BEVERAGES IN KEGS MARKET, BY END USER, 2020-2029 (THOUSAND UNITS)
TABLE 413 BRAZIL NON-ALCOHOLIC BEVERAGES IN KEGS MARKET, BY END USER, 2020-2029 (USD MILLION)
TABLE 414 BRAZIL NON-ALCOHOLIC BEVERAGES IN KEGS MARKET, BY END USER, 2020-2029 (THOUSAND UNITS)
TABLE 415 BRAZIL KEGS MARKET, BY DISTRIBUTION CHANNEL, 2020-2029 (USD MILLION)
TABLE 416 BRAZIL KEGS MARKET, BY DISTRIBUTION CHANNEL, 2020-2029 (THOUSAND UNITS)
TABLE 417 ARGENTINA KEGS MARKET, BY MATERIAL, 2020-2029 (USD MILLION)
TABLE 418 ARGENTINA KEGS MARKET, BY MATERIAL, 2020-2029 (THOUSAND UNITS)
TABLE 419 ARGENTINA KEGS MARKET, BY CAPACITY, 2020-2029 (USD MILLION)
TABLE 420 ARGENTINA KEGS MARKET, BY CAPACITY, 2020-2029 (THOUSAND UNITS)
TABLE 421 ARGENTINA KEGS MARKET, BY END USER, 2020-2029 (USD MILLION)
TABLE 422 ARGENTINA KEGS MARKET, BY END USER, 2020-2029 (THOUSAND UNITS)
TABLE 423 ARGENTINA ALCOHOLIC BEVERAGES IN KEGS MARKET, BY END USER, 2020-2029 (USD MILLION)
TABLE 424 ARGENTINA ALCOHOLIC BEVERAGES IN KEGS MARKET, BY END USER, 2020-2029 (THOUSAND UNITS)
TABLE 425 ARGENTINA NON-ALCOHOLIC BEVERAGES IN KEGS MARKET, BY END USER, 2020-2029 (USD MILLION)
TABLE 426 ARGENTINA NON-ALCOHOLIC BEVERAGES IN KEGS MARKET, BY END USER, 2020-2029 (THOUSAND UNITS)
TABLE 427 ARGENTINA KEGS MARKET, BY DISTRIBUTION CHANNEL, 2020-2029 (USD MILLION)
TABLE 428 ARGENTINA KEGS MARKET, BY DISTRIBUTION CHANNEL, 2020-2029 (THOUSAND UNITS)
TABLE 429 VENEZUELA KEGS MARKET, BY MATERIAL, 2020-2029 (USD MILLION)
TABLE 430 VENEZUELA KEGS MARKET, BY MATERIAL, 2020-2029 (THOUSAND UNITS)
TABLE 431 VENEZUELA KEGS MARKET, BY CAPACITY, 2020-2029 (USD MILLION)
TABLE 432 VENEZUELA KEGS MARKET, BY CAPACITY, 2020-2029 (THOUSAND UNITS)
TABLE 433 VENEZUELA KEGS MARKET, BY END USER, 2020-2029 (USD MILLION)
TABLE 434 VENEZUELA KEGS MARKET, BY END USER, 2020-2029 (THOUSAND UNITS)
TABLE 435 VENEZUELA ALCOHOLIC BEVERAGES IN KEGS MARKET, BY END USER, 2020-2029 (USD MILLION)
TABLE 436 VENEZUELA ALCOHOLIC BEVERAGES IN KEGS MARKET, BY END USER, 2020-2029 (THOUSAND UNITS)
TABLE 437 VENEZUELA NON-ALCOHOLIC BEVERAGES IN KEGS MARKET, BY END USER, 2020-2029 (USD MILLION)
TABLE 438 VENEZUELA NON-ALCOHOLIC BEVERAGES IN KEGS MARKET, BY END USER, 2020-2029 (THOUSAND UNITS)
TABLE 439 VENEZUELA KEGS MARKET, BY DISTRIBUTION CHANNEL, 2020-2029 (USD MILLION)
TABLE 440 VENEZUELA KEGS MARKET, BY DISTRIBUTION CHANNEL, 2020-2029 (THOUSAND UNITS)
TABLE 441 REST OF SOUTH AMERICA KEGS MARKET, BY MATERIAL, 2020-2029 (USD MILLION)
TABLE 442 REST OF SOUTH AMERICA KEGS MARKET, BY MATERIAL, 2020-2029 (THOUSAND UNITS)
TABLE 443 MIDDLE EAST & AFRICA KEGS MARKET, BY COUNTRY, 2020-2029 (USD MILLION)
TABLE 444 MIDDLE EAST & AFRICA KEGS MARKET, BY COUNTRY, 2020-2029 (THOUSAND UNITS)
TABLE 445 MIDDLE EAST & AFRICA KEGS MARKET, BY MATERIAL, 2020-2029 (USD MILLION)
TABLE 446 MIDDLE EAST & AFRICA KEGS MARKET, BY MATERIAL, 2020-2029 (THOUSAND UNITS)
TABLE 447 MIDDLE EAST & AFRICA KEGS MARKET, BY CAPACITY, 2020-2029 (USD MILLION)
TABLE 448 MIDDLE EAST & AFRICA KEGS MARKET, BY CAPACITY, 2020-2029 (THOUSAND UNITS)
TABLE 449 MIDDLE EAST & AFRICA KEGS MARKET, BY END USER, 2020-2029 (USD MILLION)
TABLE 450 MIDDLE EAST & AFRICA KEGS MARKET, BY END USER, 2020-2029 (THOUSAND UNITS)
TABLE 451 MIDDLE EAST & AFRICA ALCOHOLIC BEVERAGES IN KEGS MARKET, BY END USER, 2020-2029 (USD MILLION)
TABLE 452 MIDDLE EAST & AFRICA ALCOHOLIC BEVERAGES IN KEGS MARKET, BY END USER, 2020-2029 (THOUSAND UNITS)
TABLE 453 MIDDLE EAST & AFRICA NON-ALCOHOLIC BEVERAGES IN KEGS MARKET, BY END USER, 2020-2029 (USD MILLION)
TABLE 454 MIDDLE EAST & AFRICA NON-ALCOHOLIC BEVERAGES IN KEGS MARKET, BY END USER, 2020-2029 (THOUSAND UNITS)
TABLE 455 MIDDLE EAST & AFRICA KEGS MARKET, BY DISTRIBUTION CHANNEL, 2020-2029 (USD MILLION)
TABLE 456 MIDDLE EAST & AFRICA KEGS MARKET, BY DISTRIBUTION CHANNEL, 2020-2029 (THOUSAND UNITS)
TABLE 457 SOUTH AFRICA KEGS MARKET, BY MATERIAL, 2020-2029 (USD MILLION)
TABLE 458 SOUTH AFRICA KEGS MARKET, BY MATERIAL, 2020-2029 (THOUSAND UNITS)
TABLE 459 SOUTH AFRICA KEGS MARKET, BY CAPACITY, 2020-2029 (USD MILLION)
TABLE 460 SOUTH AFRICA KEGS MARKET, BY CAPACITY, 2020-2029 (THOUSAND UNITS)
TABLE 461 SOUTH AFRICA KEGS MARKET, BY END USER, 2020-2029 (USD MILLION)
TABLE 462 SOUTH AFRICA KEGS MARKET, BY END USER, 2020-2029 (THOUSAND UNITS)
TABLE 463 SOUTH AFRICA ALCOHOLIC BEVERAGES IN KEGS MARKET, BY END USER, 2020-2029 (USD MILLION)
TABLE 464 SOUTH AFRICA ALCOHOLIC BEVERAGES IN KEGS MARKET, BY END USER, 2020-2029 (THOUSAND UNITS)
TABLE 465 SOUTH AFRICA NON-ALCOHOLIC BEVERAGES IN KEGS MARKET, BY END USER, 2020-2029 (USD MILLION)
TABLE 466 SOUTH AFRICA NON-ALCOHOLIC BEVERAGES IN KEGS MARKET, BY END USER, 2020-2029 (THOUSAND UNITS)
TABLE 467 SOUTH AFRICA KEGS MARKET, BY DISTRIBUTION CHANNEL, 2020-2029 (USD MILLION)
TABLE 468 SOUTH AFRICA KEGS MARKET, BY DISTRIBUTION CHANNEL, 2020-2029 (THOUSAND UNITS)
TABLE 469 U.A.E KEGS MARKET, BY MATERIAL, 2020-2029 (USD MILLION)
TABLE 470 U.A.E KEGS MARKET, BY MATERIAL, 2020-2029 (THOUSAND UNITS)
TABLE 471 U.A.E KEGS MARKET, BY CAPACITY, 2020-2029 (USD MILLION)
TABLE 472 U.A.E KEGS MARKET, BY CAPACITY, 2020-2029 (THOUSAND UNITS)
TABLE 473 U.A.E KEGS MARKET, BY END USER, 2020-2029 (USD MILLION)
TABLE 474 U.A.E KEGS MARKET, BY END USER, 2020-2029 (THOUSAND UNITS)
TABLE 475 U.A.E ALCOHOLIC BEVERAGES IN KEGS MARKET, BY END USER, 2020-2029 (USD MILLION)
TABLE 476 U.A.E ALCOHOLIC BEVERAGES IN KEGS MARKET, BY END USER, 2020-2029 (THOUSAND UNITS)
TABLE 477 U.A.E NON-ALCOHOLIC BEVERAGES IN KEGS MARKET, BY END USER, 2020-2029 (USD MILLION)
TABLE 478 U.A.E NON-ALCOHOLIC BEVERAGES IN KEGS MARKET, BY END USER, 2020-2029 (THOUSAND UNITS)
TABLE 479 U.A.E KEGS MARKET, BY DISTRIBUTION CHANNEL, 2020-2029 (USD MILLION)
TABLE 480 U.A.E KEGS MARKET, BY DISTRIBUTION CHANNEL, 2020-2029 (THOUSAND UNITS)
TABLE 481 SAUDI ARABIA KEGS MARKET, BY MATERIAL, 2020-2029 (USD MILLION)
TABLE 482 SAUDI ARABIA KEGS MARKET, BY MATERIAL, 2020-2029 (THOUSAND UNITS)
TABLE 483 SAUDI ARABIA KEGS MARKET, BY CAPACITY, 2020-2029 (USD MILLION)
TABLE 484 SAUDI ARABIA KEGS MARKET, BY CAPACITY, 2020-2029 (THOUSAND UNITS)
TABLE 485 SAUDI ARABIA KEGS MARKET, BY END USER, 2020-2029 (USD MILLION)
TABLE 486 SAUDI ARABIA KEGS MARKET, BY END USER, 2020-2029 (THOUSAND UNITS)
TABLE 487 SAUDI ARABIA ALCOHOLIC BEVERAGES IN KEGS MARKET, BY END USER, 2020-2029 (USD MILLION)
TABLE 488 SAUDI ARABIA ALCOHOLIC BEVERAGES IN KEGS MARKET, BY END USER, 2020-2029 (THOUSAND UNITS)
TABLE 489 SAUDI ARABIA NON-ALCOHOLIC BEVERAGES IN KEGS MARKET, BY END USER, 2020-2029 (USD MILLION)
TABLE 490 SAUDI ARABIA NON-ALCOHOLIC BEVERAGES IN KEGS MARKET, BY END USER, 2020-2029 (THOUSAND UNITS)
TABLE 491 SAUDI ARABIA KEGS MARKET, BY DISTRIBUTION CHANNEL, 2020-2029 (USD MILLION)
TABLE 492 SAUDI ARABIA KEGS MARKET, BY DISTRIBUTION CHANNEL, 2020-2029 (THOUSAND UNITS)
TABLE 493 ISRAEL KEGS MARKET, BY MATERIAL, 2020-2029 (USD MILLION)
TABLE 494 ISRAEL KEGS MARKET, BY MATERIAL, 2020-2029 (THOUSAND UNITS)
TABLE 495 ISRAEL KEGS MARKET, BY CAPACITY, 2020-2029 (USD MILLION)
TABLE 496 ISRAEL KEGS MARKET, BY CAPACITY, 2020-2029 (THOUSAND UNITS)
TABLE 497 ISRAEL KEGS MARKET, BY END USER, 2020-2029 (USD MILLION)
TABLE 498 ISRAEL KEGS MARKET, BY END USER, 2020-2029 (THOUSAND UNITS)
TABLE 499 ISRAEL ALCOHOLIC BEVERAGES IN KEGS MARKET, BY END USER, 2020-2029 (USD MILLION)
TABLE 500 ISRAEL ALCOHOLIC BEVERAGES IN KEGS MARKET, BY END USER, 2020-2029 (THOUSAND UNITS)
TABLE 501 ISRAEL NON-ALCOHOLIC BEVERAGES IN KEGS MARKET, BY END USER, 2020-2029 (USD MILLION)
TABLE 502 ISRAEL NON-ALCOHOLIC BEVERAGES IN KEGS MARKET, BY END USER, 2020-2029 (THOUSAND UNITS)
TABLE 503 ISRAEL KEGS MARKET, BY DISTRIBUTION CHANNEL, 2020-2029 (USD MILLION)
TABLE 504 ISRAEL KEGS MARKET, BY DISTRIBUTION CHANNEL, 2020-2029 (THOUSAND UNITS)
TABLE 505 EGYPT KEGS MARKET, BY MATERIAL, 2020-2029 (USD MILLION)
TABLE 506 EGYPT KEGS MARKET, BY MATERIAL, 2020-2029 (THOUSAND UNITS)
TABLE 507 EGYPT KEGS MARKET, BY CAPACITY, 2020-2029 (USD MILLION)
TABLE 508 EGYPT KEGS MARKET, BY CAPACITY, 2020-2029 (THOUSAND UNITS)
TABLE 509 EGYPT KEGS MARKET, BY END USER, 2020-2029 (USD MILLION)
TABLE 510 EGYPT KEGS MARKET, BY END USER, 2020-2029 (THOUSAND UNITS)
TABLE 511 EGYPT ALCOHOLIC BEVERAGES IN KEGS MARKET, BY END USER, 2020-2029 (USD MILLION)
TABLE 512 EGYPT ALCOHOLIC BEVERAGES IN KEGS MARKET, BY END USER, 2020-2029 (THOUSAND UNITS)
TABLE 513 EGYPT NON-ALCOHOLIC BEVERAGES IN KEGS MARKET, BY END USER, 2020-2029 (USD MILLION)
TABLE 514 EGYPT NON-ALCOHOLIC BEVERAGES IN KEGS MARKET, BY END USER, 2020-2029 (THOUSAND UNITS)
TABLE 515 EGYPT KEGS MARKET, BY DISTRIBUTION CHANNEL, 2020-2029 (USD MILLION)
TABLE 516 EGYPT KEGS MARKET, BY DISTRIBUTION CHANNEL, 2020-2029 (THOUSAND UNITS)
TABLE 517 QATAR KEGS MARKET, BY MATERIAL, 2020-2029 (USD MILLION)
TABLE 518 QATAR KEGS MARKET, BY MATERIAL, 2020-2029 (THOUSAND UNITS)
TABLE 519 QATAR KEGS MARKET, BY CAPACITY, 2020-2029 (USD MILLION)
TABLE 520 QATAR KEGS MARKET, BY CAPACITY, 2020-2029 (THOUSAND UNITS)
TABLE 521 QATAR KEGS MARKET, BY END USER, 2020-2029 (USD MILLION)
TABLE 522 QATAR KEGS MARKET, BY END USER, 2020-2029 (THOUSAND UNITS)
TABLE 523 QATAR ALCOHOLIC BEVERAGES IN KEGS MARKET, BY END USER, 2020-2029 (USD MILLION)
TABLE 524 QATAR ALCOHOLIC BEVERAGES IN KEGS MARKET, BY END USER, 2020-2029 (THOUSAND UNITS)
TABLE 525 QATAR NON-ALCOHOLIC BEVERAGES IN KEGS MARKET, BY END USER, 2020-2029 (USD MILLION)
TABLE 526 QATAR NON-ALCOHOLIC BEVERAGES IN KEGS MARKET, BY END USER, 2020-2029 (THOUSAND UNITS)
TABLE 527 QATAR KEGS MARKET, BY DISTRIBUTION CHANNEL, 2020-2029 (USD MILLION)
TABLE 528 QATAR KEGS MARKET, BY DISTRIBUTION CHANNEL, 2020-2029 (THOUSAND UNITS)
TABLE 529 KUWAIT KEGS MARKET, BY MATERIAL, 2020-2029 (USD MILLION)
TABLE 530 KUWAIT KEGS MARKET, BY MATERIAL, 2020-2029 (THOUSAND UNITS)
TABLE 531 KUWAIT KEGS MARKET, BY CAPACITY, 2020-2029 (USD MILLION)
TABLE 532 KUWAIT KEGS MARKET, BY CAPACITY, 2020-2029 (THOUSAND UNITS)
TABLE 533 KUWAIT KEGS MARKET, BY END USER, 2020-2029 (USD MILLION)
TABLE 534 KUWAIT KEGS MARKET, BY END USER, 2020-2029 (THOUSAND UNITS)
TABLE 535 KUWAIT ALCOHOLIC BEVERAGES IN KEGS MARKET, BY END USER, 2020-2029 (USD MILLION)
TABLE 536 KUWAIT ALCOHOLIC BEVERAGES IN KEGS MARKET, BY END USER, 2020-2029 (THOUSAND UNITS)
TABLE 537 KUWAIT NON-ALCOHOLIC BEVERAGES IN KEGS MARKET, BY END USER, 2020-2029 (USD MILLION)
TABLE 538 KUWAIT NON-ALCOHOLIC BEVERAGES IN KEGS MARKET, BY END USER, 2020-2029 (THOUSAND UNITS)
TABLE 539 KUWAIT KEGS MARKET, BY DISTRIBUTION CHANNEL, 2020-2029 (USD MILLION)
TABLE 540 KUWAIT KEGS MARKET, BY DISTRIBUTION CHANNEL, 2020-2029 (THOUSAND UNITS)
TABLE 541 REST OF MIDDLE EAST & AFRICA KEGS MARKET, BY MATERIAL, 2020-2029 (USD MILLION)
TABLE 542 REST OF MIDDLE EAST & AFRICA KEGS MARKET, BY MATERIAL, 2020-2029 (USD MILLION)
Lista de figuras
FIGURE 1 GLOBAL KEGS MARKET: SEGMENTATION
FIGURE 2 GLOBAL KEGS MARKET: DATA TRIANGULATION
FIGURE 3 GLOBAL KEGS MARKET : DROC ANALYSIS
FIGURE 4 GLOBAL KEGS MARKET: GLOBAL VS REGIONAL ANALYSIS
FIGURE 5 GLOBAL KEGS MARKET: COMPANY RESEARCH ANALYSIS
FIGURE 6 GLOBAL KEGS MARKET: INTERVIEW DEMOGRAPHICS
FIGURE 7 GLOBAL KEGS MARKET: DBMR POSITION GRID
FIGURE 8 GLOBAL KEGS MARKET: VENDOR SHARE ANALYSIS
FIGURE 9 GLOBAL KEGS MARKET: SEGMENTATION
FIGURE 10 EUROPE REGION IS EXPECTED TO DOMINATE THE GLOBAL KEGS MARKET GROWING WITH THE HIGHEST CAGR IN THE FORECAST PERIOD OF 2022 TO 2029
FIGURE 11 RISING TREND OF LONG-TERM PAKAGING&PRESERVING SOLUTIONS IS EXPECTED TO DRIVE THE GLOBAL KEGS MARKET IN THE FORECAST PERIOD OF 2022 TO 2029
FIGURE 12 STAINLESS STEEL SEGMENT IS EXPECTED TO ACCOUNT FOR THE LARGEST SHARE OF THE GLOBAL KEGS MARKET IN THE FORECAST PERIOD OF 2022 TO 2029
FIGURE 13 EUROPE IS THE FASTEST-GROWING MARKET FOR KEGS MANUFACTURERS IN THE FORECAST PERIOD OF 2022 TO 2029
FIGURE 14 SUPPLY CHAIN OF GLOBAL KEGS MARKET
FIGURE 15 DRIVERS, RESTRAINTS, OPPORTUNITIES AND CHALLENGES OF GLOBAL KEGS MARKET
FIGURE 16 GLOBAL KEGS MARKET, BY MATERIAL, 2021
FIGURE 17 GLOBAL KEGS MARKET, BY CAPACITY, 2021
FIGURE 18 GLOBAL KEGS MARKET, BY END USER, 2021
FIGURE 19 GLOBAL KEGS MARKET, BY DISTRIBUTION CHANNEL, 2021
FIGURE 20 GLOBAL KEGS MARKET: SNAPSHOT (2021)
FIGURE 21 GLOBAL KEGS MARKET: BY REGION (2021)
FIGURE 22 GLOBAL KEGS MARKET: BY REGION (2022 & 2029)
FIGURE 23 GLOBAL KEGS MARKET: BY REGION (2021 & 2029)
FIGURE 24 GLOBAL KEGS MARKET: BY MATERIAL (2022-2029)
FIGURE 25 EUROPE KEGS MARKET: SNAPSHOT (2021)
FIGURE 26 EUROPE KEGS MARKET: BY COUNTRY (2021)
FIGURE 27 EUROPE KEGS MARKET: BY COUNTRY (2022 & 2029)
FIGURE 28 EUROPE KEGS MARKET: BY COUNTRY (2021 & 2029)
FIGURE 29 EUROPE KEGS MARKET: BY MATERIAL (2022-2029)
FIGURE 30 NORTH AMERICA KEGS MARKET: SNAPSHOT (2021)
FIGURE 31 NORTH AMERICA KEGS MARKET: BY COUNTRY (2021)
FIGURE 32 NORTH AMERICA KEGS MARKET: BY COUNTRY (2022 & 2029)
FIGURE 33 NORTH AMERICA KEGS MARKET: BY COUNTRY (2021 & 2029)
FIGURE 34 NORTH AMERICA KEGS MARKET: BY MATERIAL (2022-2029)
FIGURE 35 ASIA-PACIFIC KEGS MARKET: SNAPSHOT (2021)
FIGURE 36 ASIA-PACIFIC KEGS MARKET: BY COUNTRY (2021)
FIGURE 37 ASIA-PACIFIC KEGS MARKET: BY COUNTRY (2022 & 2029)
FIGURE 38 ASIA-PACIFIC KEGS MARKET: BY COUNTRY (2021 & 2029)
FIGURE 39 ASIA-PACIFIC KEGS MARKET: BY MATERIAL (2022-2029)
FIGURE 40 SOUTH AMERICA KEGS MARKET: SNAPSHOT (2021)
FIGURE 41 SOUTH AMERICA KEGS MARKET: BY COUNTRY (2021)
FIGURE 42 SOUTH AMERICA KEGS MARKET: BY COUNTRY (2022 & 2029)
FIGURE 43 SOUTH AMERICA KEGS MARKET: BY COUNTRY (2021 & 2029)
FIGURE 44 SOUTH AMERICA KEGS MARKET: BY MATERIAL (2022-2029)
FIGURE 45 MIDDLE EAST & AFRICA KEGS MARKET: SNAPSHOT (2021)
FIGURE 46 MIDDLE EAST & AFRICA KEGS MARKET: BY COUNTRY (2021)
FIGURE 47 MIDDLE EAST & AFRICA KEGS MARKET: BY COUNTRY (2022 & 2029)
FIGURE 48 MIDDLE EAST & AFRICA KEGS MARKET: BY COUNTRY (2021 & 2029)
FIGURE 49 MIDDLE EAST & AFRICA KEGS MARKET: BY MATERIAL (2022-2029)
FIGURE 50 GLOBAL KEGS MARKET: COMPANY SHARE 2021 (%)
FIGURE 51 NORTH AMERICA KEGS MARKET: COMPANY SHARE 2021 (%)
FIGURE 52 EUROPE KEGS MARKET: COMPANY SHARE 2021 (%)
FIGURE 53 ASIA-PACIFIC KEGS MARKET: COMPANY SHARE 2021 (%)
Metodología de investigación
La recopilación de datos y el análisis del año base se realizan utilizando módulos de recopilación de datos con muestras de gran tamaño. La etapa incluye la obtención de información de mercado o datos relacionados a través de varias fuentes y estrategias. Incluye el examen y la planificación de todos los datos adquiridos del pasado con antelación. Asimismo, abarca el examen de las inconsistencias de información observadas en diferentes fuentes de información. Los datos de mercado se analizan y estiman utilizando modelos estadísticos y coherentes de mercado. Además, el análisis de la participación de mercado y el análisis de tendencias clave son los principales factores de éxito en el informe de mercado. Para obtener más información, solicite una llamada de un analista o envíe su consulta.
La metodología de investigación clave utilizada por el equipo de investigación de DBMR es la triangulación de datos, que implica la extracción de datos, el análisis del impacto de las variables de datos en el mercado y la validación primaria (experto en la industria). Los modelos de datos incluyen cuadrícula de posicionamiento de proveedores, análisis de línea de tiempo de mercado, descripción general y guía del mercado, cuadrícula de posicionamiento de la empresa, análisis de patentes, análisis de precios, análisis de participación de mercado de la empresa, estándares de medición, análisis global versus regional y de participación de proveedores. Para obtener más información sobre la metodología de investigación, envíe una consulta para hablar con nuestros expertos de la industria.
Personalización disponible
Data Bridge Market Research es líder en investigación formativa avanzada. Nos enorgullecemos de brindar servicios a nuestros clientes existentes y nuevos con datos y análisis que coinciden y se adaptan a sus objetivos. El informe se puede personalizar para incluir análisis de tendencias de precios de marcas objetivo, comprensión del mercado de países adicionales (solicite la lista de países), datos de resultados de ensayos clínicos, revisión de literatura, análisis de mercado renovado y base de productos. El análisis de mercado de competidores objetivo se puede analizar desde análisis basados en tecnología hasta estrategias de cartera de mercado. Podemos agregar tantos competidores sobre los que necesite datos en el formato y estilo de datos que esté buscando. Nuestro equipo de analistas también puede proporcionarle datos en archivos de Excel sin procesar, tablas dinámicas (libro de datos) o puede ayudarlo a crear presentaciones a partir de los conjuntos de datos disponibles en el informe.

