

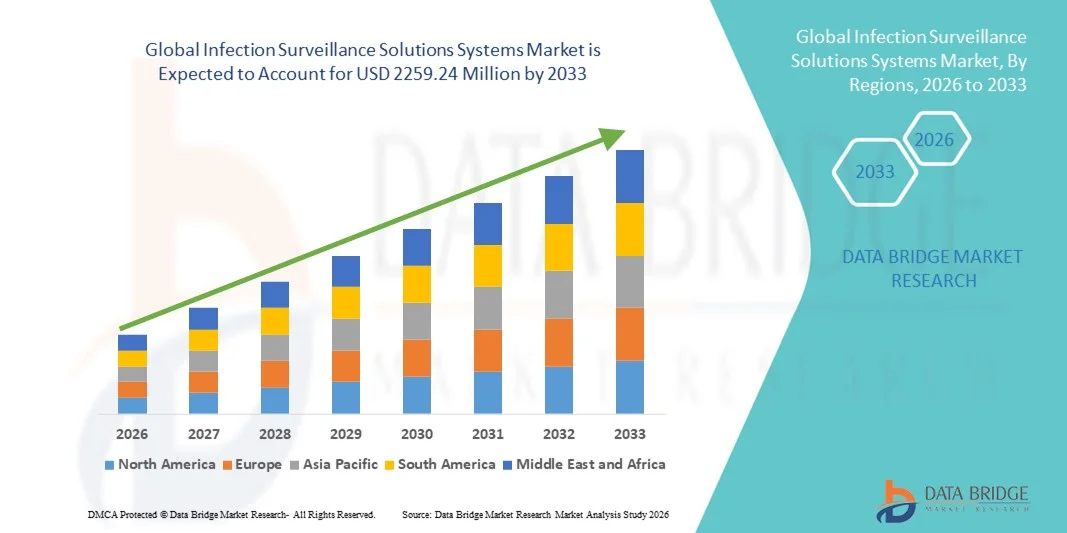
Global Infection Surveillance Solutions Systems Market
Tamaño del mercado en miles de millones de dólares
Tasa de crecimiento anual compuesta (CAGR) :
% 
 USD
832.00 Million
USD
2,259.24 Million
2025
2033
USD
832.00 Million
USD
2,259.24 Million
2025
2033
| 2026 –2033 | |
| USD 832.00 Million | |
| USD 2,259.24 Million | |
| % | |
|
Segmentación del mercado global de sistemas de soluciones para la vigilancia de infecciones, por productos (software y servicios), tipo de infección (infecciones del sitio quirúrgico (ISQ), infecciones del torrente sanguíneo (ITS), infecciones del tracto urinario (ITU), infecciones del torrente sanguíneo asociadas a catéteres centrales (ITSACC), infecciones del tracto urinario asociadas a catéteres (ITUAC) y otras), usuario final (hospitales, centros de atención a largo plazo, clínicas, centros quirúrgicos ambulatorios, instituciones académicas y otros) - Tendencias del sector y previsiones hasta 2033.
Tamaño del mercado de sistemas de soluciones de vigilancia de infecciones
- El tamaño del mercado mundial de sistemas de soluciones de vigilancia de infecciones se valoró en 832 millones de dólares en 2025 y se espera que alcance los 2259,24 millones de dólares en 2033 , con una tasa de crecimiento anual compuesta (TCAC) del 13,30 % durante el período de previsión.
- El crecimiento del mercado se debe en gran medida a la creciente adopción de tecnologías sanitarias digitales, sistemas de monitorización avanzados y protocolos de control de infecciones basados en datos en hospitales y centros sanitarios.
- Además, la creciente concienciación entre los profesionales sanitarios sobre las infecciones nosocomiales y los requisitos normativos para la seguridad del paciente está acelerando la adopción de sistemas de vigilancia de infecciones, impulsando así significativamente el crecimiento del sector.
Análisis del mercado de sistemas de soluciones de vigilancia de infecciones
- Los sistemas de vigilancia de infecciones, que ofrecen monitorización digital, análisis en tiempo real e informes automatizados sobre infecciones asociadas a la atención sanitaria, son componentes cada vez más vitales de los programas modernos de control de infecciones hospitalarias y clínicas debido a su capacidad para mejorar la seguridad del paciente, optimizar los flujos de trabajo y garantizar el cumplimiento normativo.
- La creciente demanda de soluciones de vigilancia de infecciones se debe principalmente a la mayor concienciación sobre las infecciones nosocomiales, los estrictos requisitos normativos y la creciente necesidad de estrategias de prevención de infecciones basadas en datos.
- América del Norte dominó el mercado de sistemas de vigilancia de infecciones con la mayor cuota de ingresos (45%) en 2025, gracias a una infraestructura sanitaria consolidada, la alta adopción de soluciones de salud digital y la presencia de empresas líderes en el mercado. Estados Unidos experimentó un crecimiento sustancial en la implementación de sistemas de vigilancia de infecciones, impulsado por los avances tecnológicos, el aumento de las iniciativas de seguridad del paciente y las fuertes inversiones en I+D.
- Se prevé que Asia-Pacífico sea la región de mayor crecimiento en el mercado de sistemas de soluciones de vigilancia de infecciones durante el período de pronóstico, con una cuota de mercado en 2025, impulsada por la creciente digitalización de la atención médica, la mayor concienciación sobre la prevención de infecciones y el aumento de las inversiones en hospitales y clínicas en países como China, India y Japón.
- El segmento de software dominó la mayor cuota de mercado en ingresos en 2025, con un 45,5%, impulsado por la creciente adopción por parte de hospitales y centros sanitarios de plataformas automatizadas de detección de infecciones para la monitorización en tiempo real y la elaboración de informes de cumplimiento.
Alcance del informe y segmentación del mercado de sistemas de soluciones de vigilancia de infecciones
|
Atributos |
Información clave del mercado de sistemas de soluciones de vigilancia de infecciones |
|
Segmentos cubiertos |
|
|
Países cubiertos |
América del norte
Europa
Asia-Pacífico
Oriente Medio y África
Sudamerica
|
|
Principales actores del mercado |
|
|
Oportunidades de mercado |
|
|
Conjuntos de datos de valor añadido |
Además de los datos sobre escenarios de mercado como el valor de mercado, la tasa de crecimiento, la segmentación, la cobertura geográfica y los principales actores, los informes de mercado elaborados por Data Bridge Market Research también incluyen análisis de expertos en profundidad, epidemiología de pacientes, análisis de proyectos en desarrollo, análisis de precios y marco regulatorio. |
Tendencias del mercado de sistemas de soluciones de vigilancia de infecciones
Mayor comodidad gracias a la integración basada en IA y datos
- Una tendencia significativa y en auge en el mercado global de sistemas de vigilancia de infecciones es la creciente integración de análisis avanzados, inteligencia artificial (IA) y plataformas en la nube en los flujos de trabajo de vigilancia de infecciones. Esto permite la monitorización en tiempo real, la detección predictiva de brotes y la generación de informes automatizados, lo que mejora la toma de decisiones en hospitales y en el ámbito de la salud pública.
- Por ejemplo, los sistemas de vigilancia de infecciones basados en IA pueden detectar automáticamente patrones en las infecciones nosocomiales (IN), señalar anomalías y generar alertas para los equipos de control de infecciones, lo que reduce el seguimiento manual y mejora el tiempo de respuesta.
- Los algoritmos de aprendizaje automático ayudan a predecir posibles brotes mediante el análisis de datos históricos de infecciones, datos demográficos de los pacientes y condiciones ambientales, lo que permite tomar medidas preventivas proactivas.
- Las plataformas basadas en la nube proporcionan paneles de control centralizados para las tendencias de infección en múltiples instalaciones, lo que permite a los administradores de atención médica monitorear el cumplimiento, generar informes de métricas y comparar el rendimiento de manera eficiente.
- La integración con los registros electrónicos de salud (EHR) y los sistemas de información de laboratorio (LIS) permite la ingesta automática de datos, lo que reduce los errores y garantiza la precisión de los informes para cumplir con los requisitos reglamentarios.
- Los análisis predictivos y prescriptivos facilitan las intervenciones dirigidas, ayudando a los proveedores de atención médica a asignar recursos de manera efectiva y a priorizar áreas o poblaciones de pacientes de alto riesgo.
- Las funciones de informes automatizados mejoran el cumplimiento de las normas y reglamentos locales, regionales e internacionales de control de infecciones.
- La adopción de herramientas móviles y de monitorización remota permite al personal recibir alertas instantáneas sobre posibles riesgos de infección, incluso fuera del recinto hospitalario, mejorando así la seguridad del paciente y la eficiencia operativa.
- Las plataformas habilitadas para la nube también apoyan la investigación colaborativa y la evaluación comparativa, lo que permite a los hospitales y clínicas compartir datos anonimizados para mejores estrategias de gestión de infecciones.
- Empresas como Cerner, Hillrom y BioMérieux están mejorando activamente sus soluciones con paneles de control impulsados por IA y capacidades de informes integradas.
- La tendencia hacia sistemas de vigilancia de infecciones conectados y basados en datos está transformando fundamentalmente los protocolos de prevención de infecciones y configurando nuevos estándares para la seguridad del paciente.
- Los hospitales y las agencias de salud pública están priorizando cada vez más las herramientas de vigilancia de infecciones mejoradas con IA para lograr una detección más rápida, tasas de infección reducidas y una mayor eficiencia operativa.
Dinámica del mercado de sistemas de soluciones de vigilancia de infecciones
Conductor
Creciente necesidad de monitorización de infecciones en tiempo real y cumplimiento normativo
- La creciente concienciación sobre las infecciones asociadas a la atención sanitaria (IAAS) y la necesidad crítica de una detección oportuna es un factor clave del crecimiento del mercado.
- Por ejemplo, en marzo de 2024, BioMérieux lanzó su solución EPISEQ® HAI, que combina la secuenciación de última generación y la notificación automatizada para la detección rápida de brotes de infección en centros sanitarios.
- El creciente escrutinio regulatorio y los requisitos de notificación obligatoria por parte de organizaciones como los CDC y la OMS están obligando a los centros sanitarios a adoptar sistemas de vigilancia avanzados.
- La integración de la IA y el análisis de datos en la vigilancia de infecciones ayuda a los centros sanitarios a detectar, rastrear y responder a las infecciones en tiempo real, reduciendo la propagación de las infecciones asociadas a la atención sanitaria y mejorando los resultados de los pacientes.
- Los hospitales están invirtiendo en sistemas automatizados de vigilancia de infecciones para minimizar la recopilación manual de datos, reducir errores y acelerar el cumplimiento de las normas reglamentarias.
- El creciente enfoque en la seguridad del paciente, junto con la mayor adopción de sistemas de historia clínica electrónica (HCE), está impulsando la demanda de soluciones integradas de vigilancia de infecciones.
- La aparición de soluciones basadas en la nube y compatibles con dispositivos móviles permite la monitorización remota y la toma de decisiones basada en datos, lo que mejora la eficiencia del flujo de trabajo.
- La creciente digitalización hospitalaria, incluyendo dispositivos médicos y sistemas de laboratorio conectados al IoT, apoya la adopción de soluciones integrales de vigilancia de infecciones.
- Los proveedores están ampliando sus carteras para incluir análisis predictivos, lo que permite a los centros sanitarios pronosticar brotes de infecciones y optimizar las intervenciones preventivas.
- En julio de 2023, Hillrom (BD) amplió su cartera de prevención de infecciones con el lanzamiento de una plataforma de análisis basada en la nube para realizar un seguimiento en tiempo real de las infecciones asociadas a la atención sanitaria (IAAS) en múltiples ubicaciones hospitalarias.
- La adopción se acelera aún más por el enfoque global en la preparación para pandemias y las estrategias proactivas de control de infecciones en todos los centros de atención médica.
- La integración de paneles de control, alertas y herramientas de informes automatizadas garantiza una toma de decisiones más rápida, lo que contribuye a mejores resultados clínicos y una mayor eficiencia operativa.
Restricción/Desafío
Privacidad de datos, elevados costes de implementación y complejidad de la integración
- Las preocupaciones relativas a la seguridad y la privacidad de los datos de los pacientes representan un importante obstáculo para una adopción más generalizada, ya que los sistemas de vigilancia de infecciones manejan información sanitaria sensible.
- Por ejemplo, en octubre de 2022 , un proveedor regional de atención médica experimentó problemas de acceso a los datos durante la integración de la historia clínica electrónica con un sistema de monitoreo de infecciones, lo que puso de manifiesto los posibles riesgos de ciberseguridad.
- La inversión inicial relativamente alta que requieren los sistemas avanzados de vigilancia de infecciones, incluidos el software, los módulos de IA y la capacitación del personal, puede dificultar su adopción, especialmente en las regiones en desarrollo.
- La integración con los sistemas de historia clínica electrónica (HCE), sistemas de información de laboratorio (LIS) y flujos de trabajo hospitalarios existentes puede ser compleja, y requiere recursos de TI dedicados y capacitación especializada para el personal para aprovechar al máximo las capacidades del sistema.
- Los centros sanitarios pueden enfrentarse a desafíos operativos durante la fase inicial de implementación, incluyendo tiempos de inactividad del sistema, interrupciones en el flujo de trabajo y adaptación del personal.
- Se requieren actualizaciones de software, mantenimiento y soporte técnico continuos para garantizar un rendimiento fiable, lo que aumenta los gastos operativos.
- Algunas clínicas y centros de atención ambulatoria más pequeños podrían retrasar la adopción debido al costo y a la falta de experiencia técnica interna.
- Garantizar la interoperabilidad entre los distintos departamentos y dispositivos hospitalarios es crucial para obtener el máximo provecho de las soluciones de vigilancia, pero puede resultar difícil de implementar.
- Las plataformas basadas en la nube requieren una infraestructura de red fiable, que puede ser limitada en ciertas regiones, lo que afecta a las capacidades de monitorización en tiempo real.
- Abordar estos desafíos mediante un cifrado robusto, el cumplimiento de las normativas de protección de datos (HIPAA, GDPR) y soluciones modulares y rentables será esencial para un crecimiento sostenido del mercado.
- Las colaboraciones con proveedores, los incentivos gubernamentales y los modelos de entrega escalables basados en suscripciones están surgiendo como posibles soluciones para superar las barreras de costes e integración.
- A medida que la tecnología evoluciona, se espera que el mercado se centre en soluciones seguras, rentables y altamente interoperables para impulsar una adopción más amplia en los entornos sanitarios.
Alcance del mercado de sistemas de soluciones de vigilancia de infecciones
El mercado está segmentado en función de los productos, el tipo de infección y el usuario final.
- Por productos
Según el tipo de producto, el mercado de sistemas de vigilancia de infecciones se divide en software y servicios. El segmento de software dominó la mayor cuota de mercado en 2025, con un 45,5%, impulsado por la creciente adopción de plataformas automatizadas de detección de infecciones por parte de hospitales y centros sanitarios para la monitorización en tiempo real y la elaboración de informes de cumplimiento. Las soluciones de software ofrecen análisis robustos, modelos predictivos e integración con historias clínicas electrónicas (HCE), lo que permite la identificación rápida de infecciones nosocomiales (IN). La demanda de software se ve impulsada además por los requisitos de cumplimiento normativo y la necesidad de paneles de control centralizados para monitorizar múltiples tipos de infecciones en todos los departamentos. Los análisis avanzados integrados en las soluciones de software permiten la detección de tendencias y las intervenciones proactivas, lo que reduce el riesgo para el paciente y mejora los resultados clínicos. Los hospitales e instituciones académicas prefieren las plataformas de software por su escalabilidad y rentabilidad a largo plazo en comparación con los sistemas de seguimiento manual. La creciente prevalencia de infecciones del sitio quirúrgico (ISQ), infecciones del torrente sanguíneo (ITS) e infecciones del tracto urinario (ITU) aumenta la dependencia de los sistemas de software automatizados. Las actualizaciones continuas, los análisis basados en inteligencia artificial y la interoperabilidad con la infraestructura de TI hospitalaria existente refuerzan el dominio de este segmento. Los líderes del mercado, como Cerner, Hillrom y BioMérieux, están mejorando sus soluciones de software con alertas predictivas, monitorización móvil e implementación en la nube. Además, la adopción de software facilita la monitorización de múltiples instalaciones, la evaluación comparativa y la presentación de documentación regulatoria, lo que aporta valor operativo y estratégico.
Se prevé que el segmento de Servicios experimente la tasa de crecimiento anual compuesto (TCAC) más rápida, del 20,8 %, entre 2026 y 2033, impulsada por la creciente necesidad de consultoría especializada en control de infecciones, gestión de datos, capacitación y apoyo a la implementación. Los hospitales, los centros de atención a largo plazo y las clínicas están externalizando cada vez más los servicios de vigilancia de infecciones para reducir la carga de trabajo interna y mejorar el cumplimiento de las normas. Estos servicios incluyen la configuración de protocolos de vigilancia, la capacitación del personal y el soporte para la monitorización remota. La creciente prevalencia de procedimientos complejos e infecciones multirresistentes impulsa la demanda de servicios especializados. Los servicios externalizados también permiten a los hospitales y clínicas más pequeños acceder a análisis avanzados sin grandes inversiones de capital. La continuidad del servicio garantiza la actualización oportuna de los sistemas y el cumplimiento de las normativas sanitarias en constante evolución. La integración de la IA y las soluciones en la nube en los paquetes de servicios mejora las capacidades predictivas y la detección de brotes en tiempo real. Además, las organizaciones de prevención de infecciones ofrecen servicios por suscripción con paquetes modulares que se adaptan a las necesidades y el tamaño de los centros. La creciente concienciación sobre la seguridad del paciente, los requisitos de acreditación hospitalaria y los objetivos de reducción de infecciones aceleran aún más la adopción de estos servicios. Se prevé que la tendencia hacia la vigilancia colaborativa y externalizada de infecciones se expanda a nivel mundial, con Norteamérica y Europa a la cabeza en la adopción del mercado.
- Por tipo de infección
Según el tipo de infección, el mercado se segmenta en infecciones del sitio quirúrgico (ISQ), infecciones del torrente sanguíneo (ITS), infecciones del tracto urinario (ITU), infecciones del torrente sanguíneo asociadas a catéteres centrales (ITSAC), infecciones del tracto urinario asociadas a catéteres (ITUAC) y otras. El segmento de infecciones del sitio quirúrgico (ISQ) representó la mayor cuota de mercado en 2025, con un 38,7%, debido a la alta prevalencia de complicaciones postoperatorias y la necesidad crítica de una detección temprana. La vigilancia de las ISQ es fundamental para que los hospitales cumplan con los requisitos normativos, eviten sanciones y mejoren los resultados para los pacientes. Los sistemas automatizados de monitorización de ISQ reducen los errores en los informes manuales y mejoran los tiempos de respuesta. La integración con los registros electrónicos de salud (RES) y los sistemas de laboratorio garantiza la captura de datos en tiempo real y un análisis más rápido. Los hospitales con un alto volumen de cirugías dependen en gran medida de módulos específicos para ISQ para una gestión proactiva de las infecciones. El dominio de este segmento se ve reforzado por el creciente número de cirugías electivas, el aumento de la población geriátrica y la mayor concienciación sobre los protocolos de prevención de infecciones. El análisis predictivo avanzado permite a los profesionales sanitarios identificar factores de riesgo e implementar medidas preventivas específicas. Además, las soluciones centradas en las infecciones del sitio quirúrgico (ISQ) facilitan la comparación con los estándares nacionales e internacionales de control de infecciones. La aparición de herramientas de detección de ISQ basadas en inteligencia artificial mejora la precisión predictiva, reduce la duración de las estancias hospitalarias y mitiga los costes del tratamiento. La monitorización de las ISQ también es fundamental para mantener la acreditación hospitalaria y mejorar los indicadores de información pública. Este segmento sigue atrayendo inversiones de proveedores líderes para el desarrollo de productos.
Se prevé que el segmento de infecciones del tracto urinario asociadas a catéteres (ITUAC) experimente la tasa de crecimiento anual compuesto (TCAC) más rápida, del 21,3 %, entre 2026 y 2033, impulsada por una mayor concienciación sobre los riesgos de infección relacionados con catéteres en centros de atención a largo plazo y hospitales. El aumento del uso de catéteres permanentes, el envejecimiento de la población de pacientes y la creciente incidencia de infecciones multirresistentes impulsan la adopción de la vigilancia de las ITUAC. Las herramientas de detección automatizadas con alertas en tiempo real reducen la cateterización innecesaria y previenen el uso prolongado de catéteres. La monitorización de las ITUAC mediante inteligencia artificial permite el análisis predictivo de riesgos y las intervenciones clínicas oportunas. Los usuarios finales implementan cada vez más protocolos centrados en las ITUAC para cumplir los objetivos de prevención de infecciones y mejorar la seguridad del paciente. La formación continua y los servicios de apoyo al personal fomentan la adopción, especialmente en centros de atención a largo plazo y ambulatorios. Los hospitales están integrando la detección de ITUAC con software de vigilancia de infecciones más amplio para una supervisión integral. Las directrices regulatorias y los indicadores de calidad que hacen hincapié en la reducción de las ITUAC impulsan aún más el crecimiento del mercado. La monitorización en tiempo real, el análisis de datos y las capacidades de generación de informes mejoran la toma de decisiones clínicas y optimizan los resultados para los pacientes. Las clínicas más pequeñas y los centros de atención a largo plazo recurren cada vez más a soluciones modulares para la vigilancia de las infecciones del tracto urinario asociadas a catéteres (ITUAC) debido a sus menores barreras de implementación. El crecimiento de este segmento se ve impulsado por iniciativas globales para reducir las infecciones asociadas a la atención sanitaria y mejorar la calidad asistencial.
- Por el usuario final
Según el usuario final, el mercado se segmenta en hospitales, centros de atención a largo plazo, clínicas, centros quirúrgicos ambulatorios, instituciones académicas y otros. El segmento de hospitales representó la mayor cuota de mercado en 2025, con un 49,1%, debido al elevado volumen de pacientes, la complejidad de los procedimientos y las exigencias de cumplimiento normativo. Los hospitales adoptan sistemas de vigilancia integrales para rastrear múltiples tipos de infecciones, mejorar la seguridad del paciente y optimizar los flujos de trabajo operativos. La integración con los registros electrónicos de salud (EHR) y los sistemas de laboratorio permite la generación de informes en tiempo real, el análisis predictivo y la evaluación comparativa. El elevado volumen de cirugías, las unidades de cuidados intensivos (UCI) y las operaciones multiespecialidad requieren plataformas robustas de vigilancia de infecciones. Los proveedores ofrecen soluciones de software y paquetes de servicios personalizados para satisfacer las necesidades de escala y complejidad de los hospitales. Los paneles de control automatizados proporcionan monitorización centralizada, registros de auditoría e informes de cumplimiento. Los administradores hospitalarios priorizan cada vez más la vigilancia de infecciones para reducir las infecciones asociadas a la atención sanitaria (IAAS), minimizar las sanciones y mejorar las calificaciones de acreditación. El dominio de este segmento se ve reforzado por las iniciativas de salud globales y el aumento de la financiación para la seguridad del paciente y el control de infecciones.
Se prevé que el segmento de residencias de larga estancia experimente la tasa de crecimiento anual compuesto (TCAC) más rápida, del 22,0 %, entre 2026 y 2033, impulsada por el envejecimiento de la población y la alta susceptibilidad de los residentes a las infecciones asociadas a la atención sanitaria (IAAS), incluidas las infecciones del tracto urinario (ITU), las infecciones del tracto urinario asociadas a catéteres (ITUAC) y las infecciones del torrente sanguíneo. La adopción de la vigilancia de infecciones en las residencias de larga estancia ayuda a prevenir brotes, controlar las enfermedades crónicas y reducir las tasas de hospitalización. Los análisis predictivos y los sistemas de alerta automatizados se implementan cada vez más para gestionar los riesgos de infección en los centros de atención a personas mayores. Las soluciones modulares basadas en la nube permiten que las residencias más pequeñas implementen una monitorización escalable sin grandes inversiones en infraestructura. Las presiones regulatorias y los requisitos de informes de calidad para la atención a personas mayores impulsan aún más la adopción de estas soluciones. Los servicios de formación y apoyo al personal mejoran el cumplimiento normativo y la eficiencia operativa. Las capacidades de monitorización remota permiten la supervisión en múltiples residencias, lo que mejora los resultados de la gestión de infecciones. Las alianzas con proveedores de software y de servicios facilitan la vigilancia continua y la intervención oportuna. El aumento de los programas financiados por el gobierno para mejorar la calidad de la atención a largo plazo respalda la rápida adopción de soluciones avanzadas de monitorización de infecciones.
Análisis regional del mercado de sistemas de soluciones de vigilancia de infecciones
- América del Norte dominó el mercado de sistemas de soluciones de vigilancia de infecciones con la mayor cuota de ingresos, un 45%, en 2025.
- Respaldado por una infraestructura sanitaria bien establecida, una fuerte adopción de soluciones de salud digital y la presencia de actores líderes del mercado
- El mercado está experimentando un crecimiento sustancial en la implementación de sistemas de vigilancia de infecciones debido a los avances tecnológicos, el aumento de las iniciativas de seguridad del paciente y las sólidas inversiones en I+D destinadas a mejorar los protocolos de control de infecciones hospitalarias.
Perspectivas del mercado de sistemas de vigilancia de infecciones en EE. UU.
En 2025, el mercado estadounidense de sistemas de vigilancia de infecciones obtuvo la mayor cuota de ingresos en Norteamérica. Este crecimiento se debe principalmente a la adopción generalizada de plataformas de monitorización de infecciones basadas en IA y análisis de datos, al aumento de las inversiones en infraestructura de TI hospitalaria y al enfoque en mejorar la seguridad del paciente y el cumplimiento de las normativas. La implementación de soluciones de monitorización en tiempo real y análisis predictivo impulsa aún más la expansión del mercado en hospitales, residencias de ancianos y clínicas.
Perspectivas del mercado europeo de sistemas de soluciones de vigilancia de infecciones
Se prevé que el mercado europeo de sistemas de vigilancia de infecciones experimente un crecimiento anual compuesto (CAGR) sustancial durante el período de pronóstico, impulsado por las estrictas normativas de control de infecciones y la creciente necesidad de una vigilancia digital avanzada en hospitales y clínicas. La adopción de estas soluciones se ve aún más favorecida por el aumento de las inversiones en TI para la salud y un mayor enfoque en la minimización de las infecciones nosocomiales tanto en el sector público como en el privado.
Perspectivas del mercado de sistemas de vigilancia de infecciones en el Reino Unido
Se prevé que el mercado de sistemas de soluciones de vigilancia de infecciones en el Reino Unido crezca a una tasa de crecimiento anual compuesta (TCAC) notable durante el período de pronóstico, impulsado por las iniciativas gubernamentales que promueven la adopción de la salud digital, la creciente demanda de soluciones para la prevención de infecciones y el enfoque en mejorar la seguridad del paciente en hospitales y centros de atención.
Perspectivas del mercado alemán de sistemas de soluciones de vigilancia de infecciones
Se prevé que el mercado alemán de sistemas de vigilancia de infecciones experimente un crecimiento anual compuesto considerable, impulsado por una sólida infraestructura sanitaria, una mayor concienciación sobre el control de infecciones y una alta adopción de sistemas avanzados de monitorización digital. El énfasis de Alemania en la innovación y la calidad de los servicios sanitarios estimula aún más el crecimiento del mercado en hospitales y centros de atención a largo plazo.
Perspectivas del mercado de sistemas de soluciones de vigilancia de infecciones en Asia-Pacífico
Se prevé que el mercado de sistemas de soluciones de vigilancia de infecciones de Asia-Pacífico crezca a la tasa de crecimiento anual compuesto (CAGR) más rápida durante el período de pronóstico, impulsado por la creciente digitalización de la atención médica, la mayor concienciación sobre la prevención de infecciones y el aumento de las inversiones en hospitales, clínicas y centros de atención a largo plazo en países como China, India y Japón.
Perspectivas del mercado de sistemas de vigilancia de infecciones en Japón
El mercado de sistemas de vigilancia de infecciones está experimentando un crecimiento constante debido a la rápida adopción de soluciones de salud digital, el envejecimiento de la población y el creciente enfoque en la seguridad del paciente. Los hospitales y clínicas están implementando sistemas avanzados de monitorización de infecciones para mejorar los resultados clínicos y cumplir con las estrictas normativas sanitarias.
Perspectivas del mercado de sistemas de vigilancia de infecciones en China
En 2025, el mercado chino de sistemas de vigilancia de infecciones representó la mayor cuota de ingresos en la región Asia-Pacífico, impulsado por la creciente digitalización de la atención médica, la expansión de las redes hospitalarias y la alta adopción de plataformas de vigilancia de infecciones basadas en inteligencia artificial y análisis de datos. Las iniciativas gubernamentales que promueven la prevención de infecciones y las inversiones en infraestructura hospitalaria impulsan aún más el crecimiento del mercado.
Cuota de mercado de sistemas de soluciones de vigilancia de infecciones
El sector de los sistemas de soluciones para la vigilancia de infecciones está liderado principalmente por empresas consolidadas, entre las que se incluyen:
• VigiLanz (EE. UU.)
• BD (EE. UU.) •
Sentinel Healthcare (EE
. UU.) • Streamline Health (EE. UU.)
• Spok, Inc.
(EE. UU.) • ICNet (EE. UU.)
• Mediware Information Systems (EE. UU.)
• Accuity, Inc. (EE. UU.) •
Cerner Corporation (EE. UU.)
• Epic Systems Corporation (EE. UU.)
• Oracle Health Sciences (EE. UU.)
• Allscripts Healthcare Solutions (EE. UU.)
• SAS Institute (EE. UU.)
Últimos avances en el mercado global de sistemas de soluciones de vigilancia de infecciones
- En febrero de 2023, la empresa estadounidense Becton, Dickinson and Company (BD) anunció un compromiso ampliado con la vigilancia de la resistencia antimicrobiana, comprometiéndose a mejorar los programas de prevención de infecciones e implementar nuevas herramientas de vigilancia digital en toda su red global de atención médica.
- En abril de 2023, las autoridades sanitarias nacionales de Bangladesh pusieron en marcha un sistema de vigilancia digital basado en reglas e impulsado por IA para la COVID-19, en colaboración con las agencias sanitarias locales. Este sistema permite la automatización de la clasificación de pacientes, el seguimiento de síntomas y la gestión de casos en entornos comunitarios y hospitalarios.
- En diciembre de 2024, un comunicado de prensa indicó que se prevé que el mercado mundial de soluciones de vigilancia de infecciones alcance los 2.010 millones de dólares en 2032, impulsado por la creciente demanda de soluciones para la monitorización de infecciones nosocomiales y el cumplimiento normativo.
- En enero de 2025, la Agencia de Seguridad Sanitaria del Reino Unido (UKHSA) puso en marcha un programa de vigilancia basado en metagenómica (VetCLIN-AMR) para monitorizar la resistencia a los antimicrobianos en animales de compañía y mapear el riesgo de transmisión zoonótica, extendiendo así las herramientas de vigilancia de infecciones más allá de los entornos de atención aguda humana.
SKU-
Obtenga acceso en línea al informe sobre la primera nube de inteligencia de mercado del mundo

- Panel de análisis de datos interactivo
- Panel de análisis de empresas para oportunidades con alto potencial de crecimiento
- Acceso de analista de investigación para personalización y consultas
- Análisis de la competencia con panel interactivo
- Últimas noticias, actualizaciones y análisis de tendencias
- Aproveche el poder del análisis de referencia para un seguimiento integral de la competencia
Metodología de investigación
La recopilación de datos y el análisis del año base se realizan utilizando módulos de recopilación de datos con muestras de gran tamaño. La etapa incluye la obtención de información de mercado o datos relacionados a través de varias fuentes y estrategias. Incluye el examen y la planificación de todos los datos adquiridos del pasado con antelación. Asimismo, abarca el examen de las inconsistencias de información observadas en diferentes fuentes de información. Los datos de mercado se analizan y estiman utilizando modelos estadísticos y coherentes de mercado. Además, el análisis de la participación de mercado y el análisis de tendencias clave son los principales factores de éxito en el informe de mercado. Para obtener más información, solicite una llamada de un analista o envíe su consulta.
La metodología de investigación clave utilizada por el equipo de investigación de DBMR es la triangulación de datos, que implica la extracción de datos, el análisis del impacto de las variables de datos en el mercado y la validación primaria (experto en la industria). Los modelos de datos incluyen cuadrícula de posicionamiento de proveedores, análisis de línea de tiempo de mercado, descripción general y guía del mercado, cuadrícula de posicionamiento de la empresa, análisis de patentes, análisis de precios, análisis de participación de mercado de la empresa, estándares de medición, análisis global versus regional y de participación de proveedores. Para obtener más información sobre la metodología de investigación, envíe una consulta para hablar con nuestros expertos de la industria.
Personalización disponible
Data Bridge Market Research es líder en investigación formativa avanzada. Nos enorgullecemos de brindar servicios a nuestros clientes existentes y nuevos con datos y análisis que coinciden y se adaptan a sus objetivos. El informe se puede personalizar para incluir análisis de tendencias de precios de marcas objetivo, comprensión del mercado de países adicionales (solicite la lista de países), datos de resultados de ensayos clínicos, revisión de literatura, análisis de mercado renovado y base de productos. El análisis de mercado de competidores objetivo se puede analizar desde análisis basados en tecnología hasta estrategias de cartera de mercado. Podemos agregar tantos competidores sobre los que necesite datos en el formato y estilo de datos que esté buscando. Nuestro equipo de analistas también puede proporcionarle datos en archivos de Excel sin procesar, tablas dinámicas (libro de datos) o puede ayudarlo a crear presentaciones a partir de los conjuntos de datos disponibles en el informe.

