
Mercado global de purificación de aire en interiores, por producto (colectores de polvo y aspiradoras, colectores de humo y humo, eliminadores de niebla , malos olores y gases nocivos, escape de incendios y emergencias y virus y hongos) Categoría (habitación pequeña, habitación mediana, habitación grande) Tecnología (HEPA, precipitadores electrostáticos, carbón activado, filtros iónicos y otros) Función (manual, sensor y otros) Material exterior (plástico y metal) Rango de precios (bajo, medio, premium) Canal de distribución (venta directa, comercio electrónico, supermercados / hipermercados, tiendas especializadas y otros) Aplicación (industrial, comercial y residencial) Tendencias de la industria y pronóstico hasta 2029.
Análisis y tamaño del mercado de purificación de aire en interiores
El uso cada vez mayor de purificadores de aire para contener contaminantes del aire y la llegada de purificadores de aire inteligentes están impulsando el mercado global de purificación de aire en interiores. Además, el crecimiento del sector del comercio electrónico ha permitido una mayor penetración de los purificadores de aire en todo el mundo y la mejora de la tecnología de sensores ha miniaturizado el purificador de aire. Sin embargo, se estima que el alto costo asociado con los purificadores de aire y varias preocupaciones con respecto a ellos actúan como una restricción para el mercado. Además, las fluctuaciones continuas en los precios de las materias primas y el alto consumo de electricidad que conducen a un alto costo de la electricidad debido a los purificadores de aire están desafiando el crecimiento del mercado. Además, la baja tasa de actualización en la tecnología de filtros de aire ha ralentizado el mercado. Sin embargo, se estima que el aumento de la demanda de filtros de aire debido a la conciencia de la salud entre los consumidores y el aumento de las iniciativas de los gobiernos para la adopción de filtros de aire brindan oportunidades para el crecimiento del mercado global de purificación de aire en interiores.

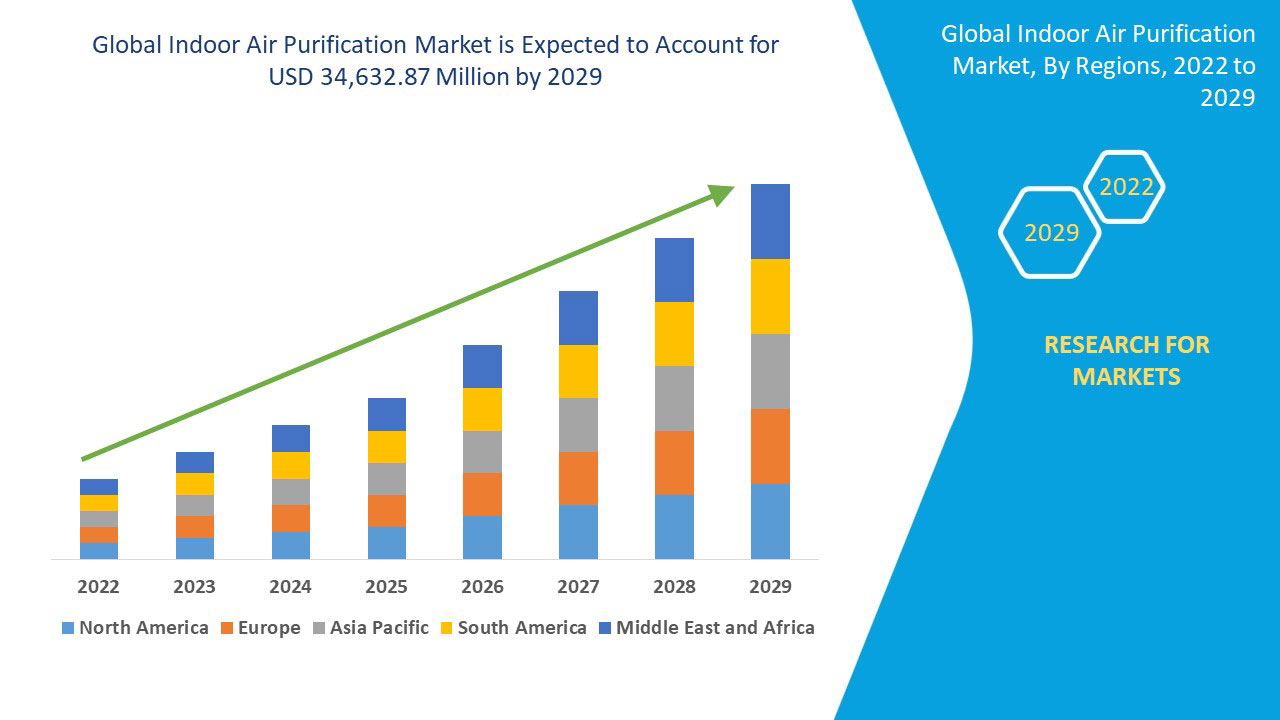
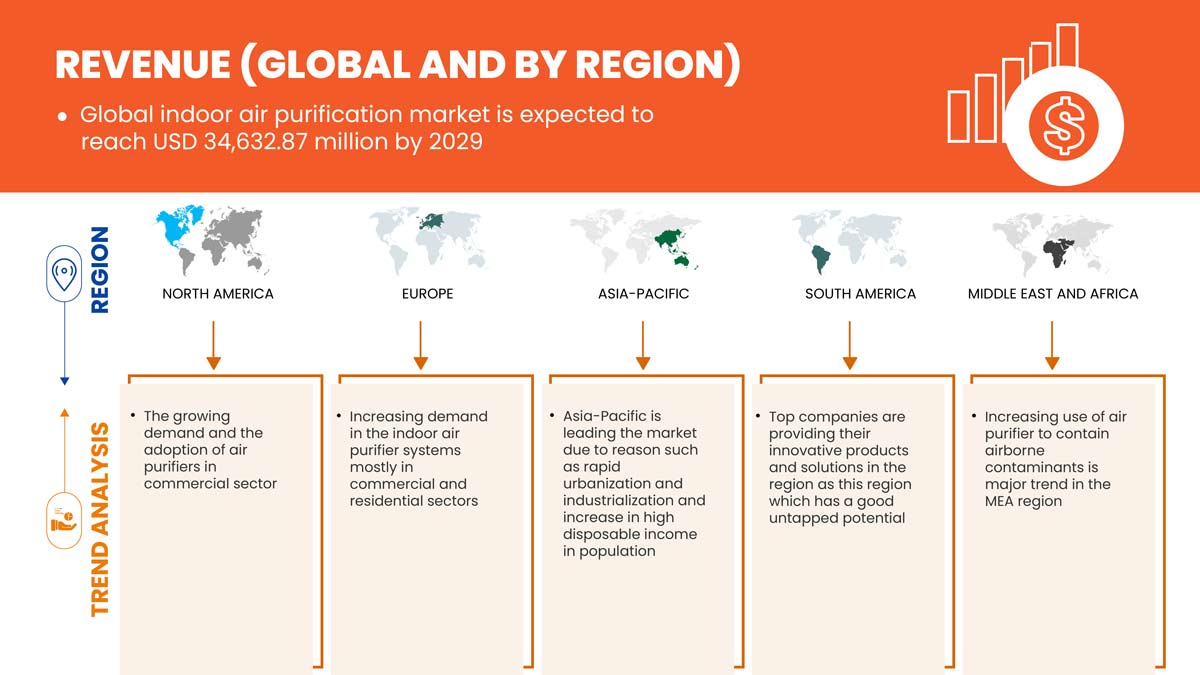
Data Bridge Market Research analiza que se espera que el mercado de purificación de aire en interiores alcance un valor de USD 34.632,87 millones para 2029, con una CAGR del 7,9 % durante el período de pronóstico. El segmento de soluciones representa el segmento de oferta más grande en el mercado de purificación de aire. El informe del mercado de purificación de aire en interiores también cubre análisis de precios, análisis de patentes y avances tecnológicos en profundidad.
|
Métrica del informe |
Detalles |
|
Período de pronóstico |
2022 a 2029 |
|
Año base |
2021 |
|
Años históricos |
2020 (Personalizable para 2019 - 2014) |
|
Unidades cuantitativas |
Ingresos en millones de USD, volúmenes en unidades, precios en USD |
|
Segmentos cubiertos |
Por producto (colectores de polvo y aspiradoras, colectores de humo y humo, eliminadores de niebla, malos olores y gases nocivos, extractores de humo y humo, virus y hongos) Categoría (sala pequeña, sala mediana, sala grande) Tecnología (HEPA, precipitadores electrostáticos, carbón activado, filtros iónicos y otros) Función (manual, sensor y otros) Material exterior (plástico y metal) Rango de precios (bajo, medio, premium) Canal de distribución (venta directa, comercio electrónico, supermercados/hipermercados, tiendas especializadas y otros) Aplicación (industrial, comercial y residencial), tendencias de la industria y pronóstico hasta 2029 |
|
Países cubiertos |
EE. UU., Canadá y México en América del Norte, Alemania, Francia, Reino Unido, Países Bajos, Suiza, Bélgica, Rusia, Italia, España, Turquía, Resto de Europa en Europa, China, Japón, India, Corea del Sur, Singapur, Malasia, Australia, Tailandia, Indonesia, Filipinas, Resto de Asia-Pacífico (APAC) en Asia-Pacífico (APAC), Arabia Saudita, Emiratos Árabes Unidos, Sudáfrica, Egipto, Israel, Resto de Medio Oriente y África (MEA) como parte de Medio Oriente y África (MEA), Brasil, Argentina y Resto de América del Sur como parte de América del Sur. |
|
Actores del mercado cubiertos |
Entre otros se encuentran: Koninklijke Philips NV, LG Electronics, Panasonic Corporation, DAIKIN INDUSTRIES ltd., Aerus LLC, Legend Brands, xpower, Abatement Technologies, Omnitech Design, B-AIR, Pulllman-Ermator, Envirco, AEROSPACE AMERICA, INC., Camfil, Carrier, Hamilton Beach Brands, Inc., Whirlpool, Lifa Air Ltd., NIKRO INDUSTRIES, INC. y COWAY CO. LTD. |
Definición de mercado
La purificación de interiores se lleva a cabo mediante productos como humidificadores, purificadores de aire y deshumidificadores en los sectores industrial, comercial y residencial. Estos productos se desarrollan y producen con el motivo de cambiar la calidad del aire interior, en una habitación individual o dentro de un área. Estos productos normalmente son pequeños para que se puedan mover de manera eficiente y no requieren instalaciones en caso de aplicación residencial. Los artículos de calidad del aire están ganando una gran tracción y demanda de la medicina complementaria y alternativa (MCA) de influencias orientales. La MCA es un espectro de terapias, tratamientos y sistemas de salud, tanto antiguos como nuevos, que normalmente se pueden identificar como prácticas de salud y bienestar que quedan fuera del espectro de la medicina occidental normal y los hábitos de consumo occidentales. Con el aumento del conocimiento del consumidor y el interés en una mejor calidad del aire, existe una gran oportunidad para que los fabricantes y las empresas posicionen los artículos de calidad del aire como productos imprescindibles para el hogar, la oficina y los espacios comerciales.
Dinámica del mercado de purificación de aire en interiores
En esta sección se aborda la comprensión de los factores impulsores, las oportunidades, las limitaciones y los desafíos del mercado. Todo esto se analiza en detalle a continuación:
Conductores
- Aumento del uso de purificadores de aire para contener los contaminantes transportados por el aire
Una enfermedad transmitida por el aire es causada por un microorganismo que se transmite a través del aire. Estos organismos pueden propagarse a través de estornudos, tos, rociado de líquidos, la propagación de polvo o cualquier actividad que resulte en la generación de partículas en aerosol. Hay muchas enfermedades transmitidas por el aire que son de importancia clínica e incluyen bacterias, virus y hongos. Los microorganismos pueden propagarse a través de estornudos, tos, rociado de líquidos, la propagación de polvo o cualquier actividad que resulte en la generación de partículas en aerosol. Los microorganismos transmitidos por el aire pueden propagarse a través de una niebla fina, polvo, aerosoles o líquidos. Además, las partículas en aerosol pueden generarse a partir de una fuente de infección, como las secreciones corporales de un paciente infectado o incluso un animal. Las partículas en aerosol infectadas a menudo permanecen suspendidas en las corrientes de aire y pueden viajar distancias considerables, aunque muchas partículas caerán en las proximidades. A medida que aumenta la distancia recorrida por la partícula de aerosol, aumenta el riesgo de infección. Las precauciones contra la transmisión aérea requieren la prevención de infecciones y el uso de las intervenciones disponibles en los centros de atención médica para prevenir la transmisión de partículas en el aire, como los filtros de aire. Cuando se utilizan correctamente, los purificadores de aire y los filtros de HVAC pueden ayudar a reducir los contaminantes transportados por el aire, incluidos los virus, en un edificio o espacio pequeño. Este uso de purificadores de aire para contener los contaminantes y las infecciones transportados por el aire es la razón de la creciente demanda de purificadores de aire a nivel mundial, que actúan como un impulsor del mercado mundial de purificación del aire en interiores.
- La llegada del purificador de aire inteligente
Los purificadores de aire se han utilizado desde el siglo XX, inicialmente con fines industriales, pero con el aumento de los niveles de contaminación en todo el mundo y la llegada de soluciones tecnológicas, su uso ha aumentado. El creciente nivel de contaminación del aire en las regiones urbanas es una de las principales preocupaciones para la salud de un gran sector de la sociedad. Al mismo tiempo, el uso de la tecnología para aumentar la eficiencia y facilitar el uso del filtro de aire ha dado lugar al desarrollo de purificadores de aire inteligentes. Los purificadores de aire inteligentes permiten al usuario supervisar y controlar la calidad del aire interior a través de una aplicación dedicada en el teléfono inteligente. El producto también ayuda a rastrear la calidad del aire interior durante un período de tiempo, lo que permite a los consumidores observar el momento del día con la mejor y la peor calidad del aire. Esto aumenta su impacto en el usuario, como resultado, la demanda de purificadores de aire inteligentes está aumentando en todas las naciones, lo que está impulsando el mercado.
- Crecimiento en el sector del comercio electrónico
El comercio electrónico (o e-commerce) es la compra y venta de bienes o servicios a través de Internet. Abarca una amplia variedad de datos, sistemas y herramientas para compradores y vendedores en línea, incluidas las compras móviles y el cifrado de pagos en línea. En la actualidad, la mayoría de las empresas con presencia en línea utilizan una tienda y/o plataforma en línea para realizar actividades de marketing y ventas de comercio electrónico y para supervisar la logística y el cumplimiento, lo que está dando como resultado el rápido crecimiento de los sectores del comercio electrónico. A medida que el sector del comercio electrónico está creciendo, la capacidad de comprar productos según los requisitos del cliente se está volviendo más fácil y las empresas también pueden enumerar los productos a un precio competitivo en múltiples plataformas de comercio electrónico para expandir la accesibilidad del mercado. La creciente demanda de purificadores de aire en la región urbana debido a sus ventajas; la función ha impulsado sus ventas en sitios de comercio electrónico como Amazon, Shopify, Flipkart. El crecimiento del sector del comercio electrónico está actuando positivamente para el mercado global de purificación de aire en interiores, ya que el cliente puede ver todos los purificadores de aire disponibles para un código PIN, compararlos y puede solicitar el que mejor se adapte a sus necesidades y presupuesto. Por lo tanto, el crecimiento del sector del comercio electrónico está actuando positivamente para el crecimiento del mercado global de purificación de aire en interiores.
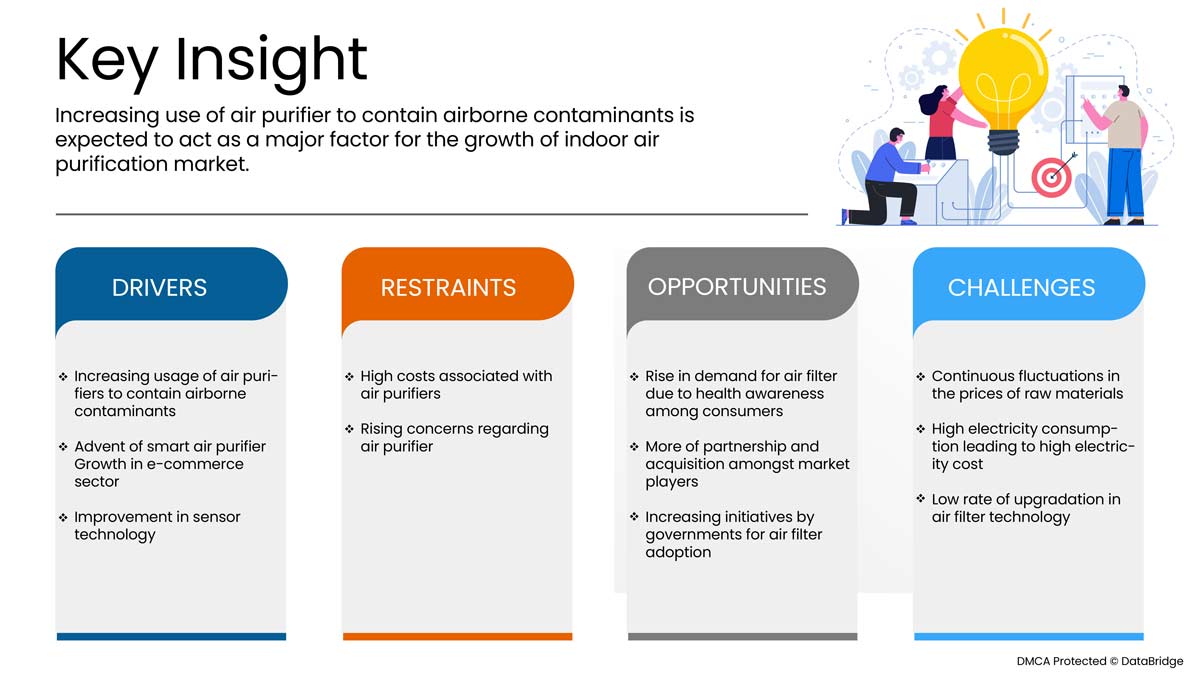
Oportunidades
-
Aumenta la demanda de filtros de aire debido a la concienciación sobre la salud entre los consumidores
En comparación con el aire exterior, los niveles de contaminación del aire interior pueden ser hasta cinco veces más altos. Ya sea en la comodidad de su hogar o en el lugar de trabajo, las personas pasan más del 90% de su tiempo en interiores. La calidad del aire interior (CAI), la salud y el bienestar están estrechamente relacionados. Respirar aire libre de contaminantes no solo mejora la calidad de vida, sino que también reduce el riesgo de infecciones respiratorias y minimiza el riesgo de desarrollar una variedad de enfermedades crónicas. Las organizaciones, en particular American Air Filter (AAF), tienen varias opciones para conectarse con el público objetivo e informarle sobre la CAI y su importancia. El aumento de la conciencia del consumidor sobre el impacto en la salud, como la irritación de ojos, nariz y garganta, dolores de cabeza, mareos y fatiga, enfermedades respiratorias, enfermedades cardíacas y cáncer, crea una perspectiva para el crecimiento del mercado mundial de purificadores de aire. Los filtros de aire son uno de los mercados en crecimiento en todo el mundo. A medida que las personas se vuelven más conscientes de la necesidad de respirar aire limpio que esté libre de alérgenos y microorganismos que causan enfermedades, la demanda de purificadores de aire ha aumentado significativamente en los últimos años.
Restricciones/Desafíos
- Altos costos asociados con los purificadores de aire
La importancia de los purificadores de aire está aumentando a medida que la calidad del aire exterior e interior se degrada debido a la rápida urbanización, lo que aumenta las infecciones y enfermedades transmitidas por el aire en todo el mundo. La contaminación del aire se está convirtiendo en un problema cada vez más grave para la salud, vinculada a alrededor de 7 millones de muertes en 2012 según un informe reciente de la Organización Mundial de la Salud (OMS). Los nuevos datos revelan además un vínculo más fuerte entre la exposición a la contaminación del aire interior y exterior y las enfermedades cardiovasculares, como los accidentes cerebrovasculares y la cardiopatía isquémica, así como entre la contaminación del aire y el cáncer. Como tanto la contaminación interior como la exterior afectan a la salud, los consumidores se inclinan por los purificadores de aire para obtener una buena calidad del aire interior. Esto permitió al fabricante aumentar el costo asociado con el purificador de aire al aumentar sus características tecnológicas; para satisfacer la demanda a nivel mundial. Este alto costo asociado con los purificadores de aire y los purificadores de aire inteligentes; limita su crecimiento de mercado ya que la clase media no puede permitirse gastar tanto en un equipo. Esto, en resultados, actúa como una restricción para el crecimiento del mercado global de purificación de aire interior.
Desarrollo reciente
- En agosto de 2022, Carrier anunció su plan de ofrecer un paquete básico de aire saludable a universidades, lugares de entretenimiento, escuelas y organizaciones inmobiliarias comerciales. Según este plan, la empresa proporcionará una forma sencilla, rápida y rentable de supervisar, visualizar y reaccionar ante los componentes invisibles de la calidad del aire interior (IAQ), lo que ayudará a respaldar el bienestar de los ocupantes. Con este paso, la empresa pretende aumentar su dominio del mercado mundial de purificación del aire interior.
- En junio de 2021, Hamilton Beach Brands, Inc. anunció su asociación con The Clorox Company. Según el acuerdo, Hamilton Beach Brands planea lanzar una línea de purificadores de aire de primera calidad con la marca Clorox que eliminarán el 99,97 % de los alérgenos y partículas del polen, el polvo y el humo. Se estima que esto permitirá a la empresa utilizar la licencia de Clorox Company para el producto que ofrece en el mercado de purificación del aire en interiores.
Alcance del mercado de purificación de aire en interiores
El mercado de purificación de aire en interiores está segmentado en función del producto, la categoría, la tecnología, la función, el material exterior, el rango de precios, el canal de distribución y la aplicación. El crecimiento entre estos segmentos le ayudará a analizar los segmentos de crecimiento reducidos en las industrias y brindará a los usuarios una valiosa descripción general del mercado y conocimientos del mercado para ayudarlos a tomar decisiones estratégicas para identificar las principales aplicaciones del mercado.
Por producto
- Colectores de polvo y aspiradoras
- Colectores de humo y humo
- Eliminadores de niebla
- Mal olor y gases nocivos
- Escape de incendios y emergencias
- Virus y hongos
Sobre la base del producto, el mercado de purificación de aire en interiores se segmenta en colectores de polvo y aspiradoras; colectores de humo y humo; eliminadores de niebla; malos olores y gases nocivos; extractores de incendios y de emergencia y virus y hongos.
Por categoría
- Habitación pequeña
- Habitación mediana
- Habitación grande
Según la categoría, el mercado de purificación de aire interior se segmenta en habitaciones pequeñas, habitaciones medianas y habitaciones grandes.
Por tecnología
- Filtro HEPA
- Precipitadores electrostáticos
- Carbón activado
- Filtros iónicos
- Otros
Sobre la base de la tecnología, el mercado de purificación de aire en interiores está segmentado en HEPA; precipitadores electrostáticos; carbón activado; filtros iónicos y otros.
Por función
- Manual
- Sensor
- Otros
Sobre la base de la función, el mercado de purificación de aire en interiores se segmenta en manual, sensor y otros.
Por material exterior
- Plástico
- Metal
Según el material exterior, el mercado de purificación del aire en interiores se segmenta en plástico y metal.
Por rango de precio
- Bajo
- Medio
- De primera calidad
Sobre la base del rango de precios, el mercado de purificación de aire en interiores se segmenta en bajo, medio y premium.
Por canal de distribución
- Venta directa
- Comercio electrónico
- Supermercados/Hipermercados
- Tiendas especializadas
- Otros
Sobre la base del canal de distribución, el mercado de purificación de aire en interiores se segmenta en venta directa, comercio electrónico, supermercados/hipermercados, tiendas especializadas y otros.
Por aplicación
- Industrial
- Comercial
- Residencial

Sobre la base de la aplicación, el mercado de purificación del aire en interiores se segmenta en industrial, comercial y residencial.
Análisis y perspectivas regionales del mercado de purificación de aire en interiores
Se analiza el mercado de purificación de aire en interiores y se proporcionan información y tendencias del tamaño del mercado por país, producto, categoría, tecnología, función, material exterior, rango de precios, canal de distribución y aplicación, como se mencionó anteriormente.
Los países cubiertos en el informe del mercado de purificación de aire en interiores son EE. UU., Canadá y México en América del Norte, Alemania, Francia, Reino Unido, Países Bajos, Suiza, Bélgica, Rusia, Italia, España, Turquía, Resto de Europa en Europa, China, Japón, India, Corea del Sur, Singapur, Malasia, Australia, Tailandia, Indonesia, Filipinas, Resto de Asia-Pacífico (APAC) en Asia-Pacífico (APAC), Arabia Saudita, Emiratos Árabes Unidos, Sudáfrica, Egipto, Israel, Resto de Medio Oriente y África (MEA) como parte de Medio Oriente y África (MEA), Brasil, Argentina y Resto de América del Sur como parte de América del Sur.
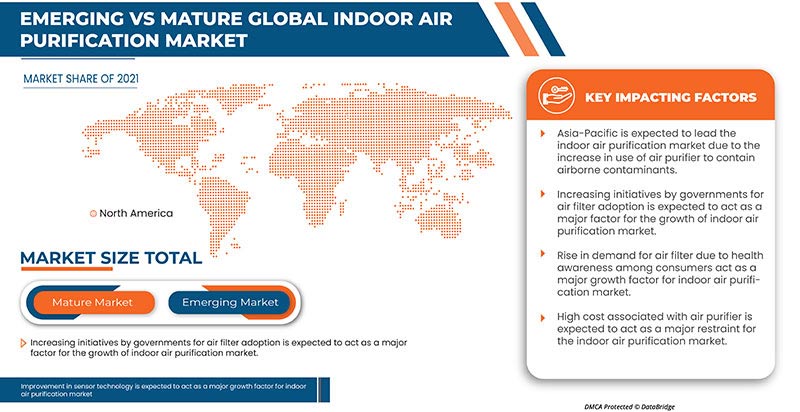
La región de Asia y el Pacífico está dominando el mercado debido a la creciente conciencia de los consumidores sobre los purificadores de aire y sus ventajas, como la capacidad de contener los contaminantes del aire. Además, la rápida urbanización en la región, especialmente en los países en desarrollo, ha aumentado la necesidad de los consumidores de contar con purificadores de aire.
La sección de países del informe también proporciona factores individuales que impactan en el mercado y cambios en la regulación del mercado que afectan las tendencias actuales y futuras del mercado. Los puntos de datos como el análisis de la cadena de valor aguas abajo y aguas arriba, el análisis de las cinco fuerzas de Porter de las tendencias técnicas y los estudios de casos son algunos de los indicadores utilizados para pronosticar el escenario del mercado para países individuales. Además, se consideran la presencia y disponibilidad de marcas globales y los desafíos que enfrentan debido a la competencia grande o escasa de las marcas locales y nacionales, el impacto de los aranceles nacionales y las rutas comerciales al proporcionar un análisis de pronóstico de los datos del país.
Análisis del panorama competitivo y de la cuota de mercado de purificación del aire en interiores
El panorama competitivo del mercado de purificación de aire en interiores proporciona detalles por competidor. Los detalles incluidos son una descripción general de la empresa, las finanzas de la empresa, los ingresos generados, el potencial de mercado, la inversión en investigación y desarrollo, las nuevas iniciativas de mercado, la presencia global, los sitios e instalaciones de producción, las capacidades de producción, las fortalezas y debilidades de la empresa, el lanzamiento de productos, la amplitud y variedad de productos y el dominio de la aplicación. Los puntos de datos anteriores proporcionados solo están relacionados con el enfoque de las empresas relacionado con el mercado de purificación de aire en interiores.
Algunos de los principales actores que operan en el mercado son Koninklijke Philips NV; LG Electronics, Panasonic Corporation, DAIKIN INDUSTRIES ltd., Aerus LLC, Legend Brands, xpower, Abatement Technologies, Omnitech Design, B-AIR, Pulllman-Ermator; Envirco, AEROSPACE AMERICA, INC.; Camfil; Carrier, Hamilton Beach Brands, Inc.; Whirlpool, Lifa Air Ltd., NIKRO INDUSTRIES, INC. y COWAY CO. LTD. entre otros.
SKU-
Obtenga acceso en línea al informe sobre la primera nube de inteligencia de mercado del mundo

- Panel de análisis de datos interactivo
- Panel de análisis de empresas para oportunidades con alto potencial de crecimiento
- Acceso de analista de investigación para personalización y consultas
- Análisis de la competencia con panel interactivo
- Últimas noticias, actualizaciones y análisis de tendencias
- Aproveche el poder del análisis de referencia para un seguimiento integral de la competencia
Tabla de contenido
1 INTRODUCTION
1.1 OBJECTIVES OF THE STUDY
1.2 MARKET DEFINITION
1.3 OVERVIEW OF THE GLOBAL INDOOR AIR PURIFICATION MARKET
1.4 CURRENCY AND PRICING
1.5 LIMITATIONS
1.6 MARKETS COVERED
2 MARKET SEGMENTATION
2.1 MARKETS COVERED
2.2 YEARS CONSIDERED FOR THE STUDY
2.3 GEOGRAPHIC SCOPE
2.4 DBMR TRIPOD DATA VALIDATION MODEL
2.5 PRIMARY INTERVIEWS WITH KEY OPINION LEADERS
2.6 DBMR MARKET POSITION GRID
2.7 VENDOR SHARE ANALYSIS
2.8 MARKET END-USER COVERAGE GRID
2.9 MULTIVARIATE MODELLING
2.1 PRODUCT CURVE
2.11 CHALLENGE MATRIX
2.12 SECONDARY SOURCES
2.13 ASSUMPTIONS
3 EXECUTIVE SUMMARY
4 PREMIUM INSIGHTS
4.1 PESTEL ANALYSIS
4.1.1 POLITICAL FACTORS
4.1.2 ECONOMIC FACTORS
4.1.3 SOCIAL FACTORS
4.1.4 TECHNOLOGICAL FACTORS
4.1.5 LEGAL FACTORS
4.1.6 ENVIRONMENTAL FACTORS
4.2 PORTERS MODEL
4.3 TECHNOLOGICAL ADVANCEMENT BY MANUFACTURERS
4.3.1 PHOTOELECTROCHEMICAL OXIDATION
4.3.2 HIGH-EFFICIENCY PARTICULATE AIR PURIFIERS
4.3.3 ACTIVATED CARBON
4.3.4 ELECTROSTATIC PRECIPITATOR
4.3.5 IONIC FILTERS
4.3.6 AUTOMATED AIR PURIFICATION SYSTEM
4.4 VENDOR SELECTION CRITERIA
4.5 REGULATORY STANDARD
5 SUPPLY CHAIN ANALYSIS
5.1 OVERVIEW
5.2 LOGISTIC COST SCENARIO
5.3 IMPORTANCE OF LOGISTIC SERVICE PROVIDERS
6 MARKET OVERVIEW
6.1 DRIVERS
6.1.1 INCREASING USAGE OF AIR PURIFIERS TO CONTAIN AIRBORNE CONTAMINANTS
6.1.2 ADVENT OF SMART AIR PURIFIER
6.1.3 GROWTH IN E- COMMERCE SECTOR
6.1.4 IMPROVEMENT IN SENSOR TECHNOLOGY
6.2 RESTRAINTS
6.2.1 HIGH COSTS ASSOCIATED WITH AIR PURIFIERS
6.2.2 RISING CONCERNS REGARDING AIR PURIFIER
6.3 OPPORTUNITIES
6.3.1 RISE IN DEMAND FOR AIR FILTER DUE TO HEALTH AWARENESS AMONG CONSUMERS
6.3.2 MORE OF PARTNERSHIP AND ACQUISITION AMONGST MARKET PLAYERS
6.3.3 INCREASING INITIATIVES BY GOVERNMENTS FOR AIR FILTER ADOPTION
6.4 CHALLENGES
6.4.1 CONTINUOUS FLUCTUATIONS IN THE PRICES OF RAW MATERIALS
6.4.2 HIGH ELECTRICITY CONSUMPTION LEADING TO HIGH ELECTRICITY COST
6.4.3 LOW RATE OF UPGRADATION IN AIR FILTER TECHNOLOGY
7 GLOBAL INDOOR AIR PURIFICATION MARKET, BY PRODUCT
7.1 OVERVIEW
7.2 DUST COLLECTORS & VACCUMS
7.3 FUME & SMOKE COLLECTORS
7.4 VIRUSES & FUNGUS
7.5 BAD ODOUR & HARMFUL GASES
7.6 MIST ELIMINATORS
7.7 FIRE & EMERGENCY EXHAUST
8 GLOBAL INDOOR AIR PURIFICATION MARKET, BY CATEGORY
8.1 OVERVIEW
8.2 LARGE ROOM
8.3 MEDIUM ROOM
8.4 SMALL ROOM
9 GLOBAL INDOOR AIR PURIFICATION MARKET, BY FUNCTION
9.1 OVERVIEW
9.2 SENSOR
9.3 MANUAL
9.4 OTHERS
10 GLOBAL INDOOR AIR PURIFICATION MARKET, BY TECHNOLOGY
10.1 OVERVIEW
10.2 HEPA
10.3 ACTIVATED CARBON
10.4 ELECTROSTATIC PRECIPITATORS
10.5 IONIC FILTERS
10.6 OTHERS
11 GLOBAL INDOOR AIR PURIFICATION MARKET, BY OUTER MATERIAL
11.1 OVERVIEW
11.2 PLASTIC
11.2.1 POLYCARBONATE (PC)
11.2.2 ABS
11.2.3 POLYVINYL CHLORIDE (PVC)
11.2.4 HIGH-DENSITY POLYETHYLENE (PE)
11.2.5 OTHERS
11.3 METAL
11.3.1 STAINLESS STEEL
11.3.2 ALUMINIUM
11.3.3 OTHERS
12 GLOBAL INDOOR AIR PURIFICATION MARKET, BY PRICE RANGE
12.1 OVERVIEW
12.2 MID
12.3 LOW
12.4 PREMIUM
13 GLOBAL INDOOR AIR PURIFICATION MARKET, BY DISTRIBUTION CHANNEL
13.1 OVERVIEW
13.2 E-COMMERCE
13.3 SPECIALTY STORES
13.4 DIRECT SELLING
13.5 SUPERMARKETS/HYPERMARKETS
13.6 OTHERS
14 GLOBAL INDOOR AIR PURIFICATION MARKET, BY APPLICATION
14.1 OVERVIEW
14.2 COMMERCIAL
14.3 RESIDENTIAL
14.4 INDUSTRIAL
15 GLOBAL INDOOR AIR PURIFICATION MARKET, BY REGION
15.1 OVERVIEW
15.2 ASIA-PACIFIC
15.2.1 CHINA
15.2.2 JAPAN
15.2.3 SOUTH KOREA
15.2.4 INDIA
15.2.5 AUSTRALIA & NEW ZEALAND
15.2.6 SINGAPORE
15.2.7 THAILAND
15.2.8 MALAYSIA
15.2.9 INDONESIA
15.2.10 PHILIPPINES
15.2.11 REST OF ASIA-PACIFIC
15.3 NORTH AMERICA
15.3.1 U.S.
15.3.2 CANADA
15.3.3 MEXICO
15.4 EUROPE
15.4.1 U.K.
15.4.2 GERMANY
15.4.3 FRANCE
15.4.4 ITALY
15.4.5 TURKEY
15.4.6 SPAIN
15.4.7 RUSSIA
15.4.8 SWITZERLAND
15.4.9 BELGIUM
15.4.10 NETHERLANDS
15.4.11 REST OF EUROPE
15.5 MIDDLE EAST AND AFRICA
15.5.1 SAUDI ARABIA
15.5.2 ISRAEL
15.5.3 U.A.E.
15.5.4 SOUTH AFRICA
15.5.5 EGYPT
15.5.6 REST OF MIDDLE EAST & AFRICA
15.6 SOUTH AMERICA
15.6.1 BRAZIL
15.6.2 ARGENTINA
15.6.3 REST OF SOUTH AMERICA
16 GLOBAL INDOOR AIR PURIFICATION MARKET: COMPANY LANDSCAPE
16.1 COMPANY SHARE ANALYSIS: GLOBAL
16.2 COMPANY SHARE ANALYSIS: EUROPE
16.3 COMPANY SHARE ANALYSIS: NORTH AMERICA
16.4 COMPANY SHARE ANALYSIS: ASIA-PACIFIC
17 SWOT ANALYSIS
18 COMPANY PROFILE
18.1 PANASONIC CORPORATION
18.1.1 COMPANY SNAPSHOT
18.1.2 REVENUE ANALYSIS
18.1.3 COMPANY SHARE ANALYSIS
18.1.4 PRODUCT PORTFOLIO
18.1.5 RECENT DEVELOPMENTS
18.2 DAIKIN INDUSTRIES, LTD.
18.2.1 COMPANY SNAPSHOT
18.2.2 REVENUE ANALYSIS
18.2.3 COMPANY SHARE ANALYSIS
18.2.4 PRODUCT PORTFOLIO
18.2.5 RECENT DEVELOPMENTS
18.3 LG ELECTRONICS
18.3.1 COMPANY SNAPSHOT
18.3.2 REVENUE ANALYSIS
18.3.3 COMPANY SHARE ANALYSIS
18.3.4 PRODUCT PORTFOLIO
18.3.5 RECENT DEVELOPMENTS
18.4 HONEYWELL INTERNATIONAL
18.4.1 COMPANY SNAPSHOT
18.4.2 REVENUE ANALYSIS
18.4.3 COMPANY SHARE ANALYSIS
18.4.4 PRODUCT PORTFOLIO
18.4.5 RECENT DEVELOPMENTS
18.5 KONINKLIJKE PHILIPS N.V
18.5.1 COMPANY SNAPSHOT
18.5.2 REVENUE ANALYSIS
18.5.3 COMPANY SHARE ANALYSIS
18.5.4 PRODUCT PORTFOLIO
18.5.5 RECENT DEVELOPMENTS
18.6 ABATEMENT TECHNOLOGIES
18.6.1 COMPANY SNAPSHOT
18.6.2 PRODUCT PORTFOLIO
18.6.3 RECENT DEVELOPMENT
18.7 AEROSPACE AMERICA, INC.
18.7.1 COMPANY SNAPSHOT
18.7.2 PRODUCT PORTFOLIO
18.7.3 RECENT DEVELOPMENTS
18.8 AERUS LLC
18.8.1 COMPANY SNAPSHOT
18.8.2 PRODUCT PORTFOLIO
18.8.3 RECENT DEVELOPMENTS
18.9 B-AIR
18.9.1 COMPANY SNAPSHOT
18.9.2 PRODUCT PORTFOLIO
18.9.3 RECENT DEVELOPMENT
18.1 CAMFIL
18.10.3 COMPANY SNAPSHOT
18.10.4 PRODUCT PORTFOLIO
18.10.5 RECENT DEVELOPMENTS
18.11 CARRIER (2021)
18.11.1 COMPANY SNAPSHOT
18.11.2 REVENUE ANALYSIS
18.11.3 PRODUCT PORTFOLIO
18.11.4 RECENT DEVELOPMENTS
18.12 COWAY CO. LTD. (2021)
18.12.1 COMPANY SNAPSHOT
18.12.2 REVENUE ANALYSIS
18.12.3 PRODUCT PORTFOLIO
18.12.4 RECENT DEVELOPMENTS
18.13 ENVIRCO
18.13.1 COMPANY SNAPSHOT
18.13.2 PRODUCT PORTFOLIO
18.13.3 RECENT DEVELOPMENT
18.14 HAMILTON BEACH BRANDS, INC. (2021)
18.14.1 COMPANY SNAPSHOT
18.14.2 REVENUE ANALYSIS
18.14.3 PRODUCT PORTFOLIO
18.14.4 RECENT DEVELOPMENTS
18.15 LEGEND BRANDS
18.15.1 COMPANY SNAPSHOT
18.15.2 PRODUCT PORTFOLIO
18.15.3 RECENT DEVELOPMENT
18.16 LIFA AIR LTD. (2021)
18.16.1 COMPANY SNAPSHOT
18.16.2 REVENUE ANALYSIS
18.16.3 PRODUCT PORTFOLIO
18.16.4 RECENT DEVELOPMENTS
18.17 NIKRO INDUSTRIES, INC.
18.17.1 COMPANY SNAPSHOT
18.17.2 PRODUCT PORTFOLIO
18.17.3 RECENT DEVELOPMENT
18.18 OMNITEC DESIGN
18.18.1 COMPANY SNAPSHOT
18.18.2 PRODUCT PORTFOLIO
18.18.3 RECENT DEVELOPMENT
18.19 PULLMAN-ERMATOR
18.19.1 COMPANY SNAPSHOT
18.19.2 PRODUCT PORTFOLIO
18.19.3 RECENT DEVELOPMENT
18.2 WHIRLPOOL (2021)
18.20.1 COMPANY SNAPSHOT
18.20.2 REVENUE ANALYSIS
18.20.3 PRODUCT PORTFOLIO
18.20.4 RECENT DEVELOPMENTS
18.21 XPOWER.COM
18.21.1 COMPANY SNAPSHOT
18.21.2 PRODUCT PORTFOLIO
18.21.3 RECENT DEVELOPMENT
19 QUESTIONNAIRE
20 RELATED REPORTS
Lista de Tablas
TABLE 1 AIR PURIFIER AND COST ASSOCIATED WITH THEM IN USD
TABLE 2 COMPARISON OF THE ENERGY CONSUMPTION OF HOME APPLIANCES AND ELECTRONICS
TABLE 3 GLOBAL INDOOR AIR PURIFICATION MARKET, BY PRODUCT, 2020-2029 (USD MILLION)
TABLE 4 GLOBAL DUST COLLECTORS & VACCUMS IN INDOOR AIR PURIFICATION MARKET, BY REGION, 2020-2029 (USD MILLION)
TABLE 5 GLOBAL FUME & SMOKE COLLECTORS IN INDOOR AIR PURIFICATION MARKET, BY REGION, 2020-2029 (USD MILLION)
TABLE 6 GLOBAL VIRUSES & FUNGUS IN INDOOR AIR PURIFICATION MARKET, BY REGION, 2020-2029 (USD MILLION)
TABLE 7 GLOBAL BAD ODOUR & HARMFUL GASES IN INDOOR AIR PURIFICATION MARKET, BY REGION, 2020-2029 (USD MILLION)
TABLE 8 GLOBAL MIST ELIMINATORS IN INDOOR AIR PURIFICATION MARKET, BY REGION, 2020-2029 (USD MILLION)
TABLE 9 GLOBAL FIRE & EMERGENCY EXHAUST IN INDOOR AIR PURIFICATION MARKET, BY REGION, 2020-2029 (USD MILLION)
TABLE 10 GLOBAL INDOOR AIR PURIFICATION MARKET, BY CATEGORY, 2020-2029 (USD MILLION)
TABLE 11 GLOBAL LARGE ROOM IN INDOOR AIR PURIFICATION MARKET, BY REGION, 2020-2029 (USD MILLION)
TABLE 12 GLOBAL MEDIUM ROOM IN INDOOR AIR PURIFICATION MARKET, BY REGION, 2020-2029 (USD MILLION)
TABLE 13 GLOBAL SMALL ROOM IN INDOOR AIR PURIFICATION MARKET, BY REGION, 2020-2029 (USD MILLION)
TABLE 14 GLOBAL INDOOR AIR PURIFICATION MARKET, BY FUNCTION, 2020-2029 (USD MILLION)
TABLE 15 GLOBAL SENSOR IN INDOOR AIR PURIFICATION MARKET, BY REGION, 2020-2029 (USD MILLION)
TABLE 16 GLOBAL MANUAL IN INDOOR AIR PURIFICATION MARKET, BY REGION, 2020-2029 (USD MILLION)
TABLE 17 GLOBAL OTHERS IN INDOOR AIR PURIFICATION MARKET, BY REGION, 2020-2029 (USD MILLION)
TABLE 18 GLOBAL INDOOR AIR PURIFICATION MARKET , BY TECHNOLOGY 2020-2029 (USD MILLION)
TABLE 19 GLOBAL HEPA IN INDOOR AIR PURIFICATION MARKET, BY REGION, 2020-2029 (USD MILLION)
TABLE 20 GLOBAL ACTIVATED CARBON IN INDOOR AIR PURIFICATION MARKET, BY REGION, 2020-2029 (USD MILLION)
TABLE 21 GLOBAL ELECTROSTATIC PRECIPITATORS IN INDOOR AIR PURIFICATION MARKET, BY REGION, 2020-2029 (USD MILLION)
TABLE 22 GLOBAL IONIC FILTERS IN INDOOR AIR PURIFICATION MARKET, BY REGION, 2020-2029 (USD MILLION)
TABLE 23 GLOBAL OTHERS IN INDOOR AIR PURIFICATION MARKET, BY REGION, 2020-2029 (USD MILLION)
TABLE 24 GLOBAL INDOOR AIR PURIFICATION MARKET, BY OUTER MATERIAL, 2020-2029 (USD MILLION)
TABLE 25 GLOBAL PLASTIC IN INDOOR AIR PURIFICATION MARKET, BY REGION, 2020-2029 (USD MILLION)
TABLE 26 GLOBAL PLASTIC IN INDOOR AIR PURIFICATION MARKET, BY TYPE, 2020-2029 (USD MILLION)
TABLE 27 GLOBAL METAL IN INDOOR AIR PURIFICATION MARKET, BY REGION, 2020-2029 (USD MILLION)
TABLE 28 GLOBAL METAL IN INDOOR AIR PURIFICATION MARKET, BY TYPE, 2020-2029 (USD MILLION)
TABLE 29 GLOBAL INDOOR AIR PURIFICATION MARKET, BY PRICE RANGE, 2020-2029 (USD MILLION)
TABLE 30 GLOBAL MID IN INDOOR AIR PURIFICATION MARKET, BY REGION, 2020-2029 (USD MILLION)
TABLE 31 GLOBAL LOW IN INDOOR AIR PURIFICATION MARKET, BY REGION, 2020-2029 (USD MILLION)
TABLE 32 GLOBAL PREMIUM IN INDOOR AIR PURIFICATION MARKET, BY REGION, 2020-2029 (USD MILLION)
TABLE 33 GLOBAL INDOOR AIR PURIFICATION MARKET, BY DISTRIBUTION CHANNEL, 2020-2029 (USD MILLION)
TABLE 34 GLOBAL E-COMMERCE IN INDOOR AIR PURIFICATION MARKET, BY REGION, 2020-2029 (USD MILLION)
TABLE 35 GLOBAL SPECIALTY STORES IN INDOOR AIR PURIFICATION MARKET, BY REGION, 2020-2029 (USD MILLION)
TABLE 36 GLOBAL DIRECT SELLING IN INDOOR AIR PURIFICATION MARKET, BY REGION, 2020-2029 (USD MILLION)
TABLE 37 GLOBAL SUPERMARKETS/HYPERMARKETS IN INDOOR AIR PURIFICATION MARKET, BY REGION, 2020-2029 (USD MILLION)
TABLE 38 GLOBAL OTHERS IN INDOOR AIR PURIFICATION MARKET, BY REGION, 2020-2029 (USD MILLION)
TABLE 39 GLOBAL INDOOR AIR PURIFICATION MARKET, BY APPLICATION, 2020-2029 (USD MILLION)
TABLE 40 GLOBAL COMMERCIAL IN INDOOR AIR PURIFICATION MARKET, BY REGION, 2020-2029 (USD MILLION)
TABLE 41 GLOBAL RESIDENTIAL IN INDOOR AIR PURIFICATION MARKET, BY REGION, 2020-2029 (USD MILLION)
TABLE 42 GLOBAL INDUSTRIAL IN INDOOR AIR PURIFICATION MARKET, BY REGION, 2020-2029 (USD MILLION)
TABLE 43 GLOBAL INDOOR AIR PURIFICATION MARKET, BY REGION, 2020-2029 (USD MILLION)
TABLE 44 ASIA-PACIFIC INDOOR AIR PURIFICATION MARKET, BY COUNTRY, 2020-2029 (USD MILLION)
TABLE 45 ASIA-PACIFIC INDOOR AIR PURIFICATION MARKET, BY PRODUCT, 2020-2029 (USD MILLION)
TABLE 46 ASIA-PACIFIC INDOOR AIR PURIFICATION MARKET, BY CATEGORY, 2020-2029 (USD MILLION)
TABLE 47 ASIA-PACIFIC INDOOR AIR PURIFICATION MARKET, BY TECHNOLOGY, 2020-2029 (USD MILLION)
TABLE 48 ASIA-PACIFIC INDOOR AIR PURIFICATION MARKET, BY FUNCTION, 2020-2029 (USD MILLION)
TABLE 49 ASIA-PACIFIC INDOOR AIR PURIFICATION MARKET, BY OUTER MATERIAL, 2020-2029 (USD MILLION)
TABLE 50 ASIA-PACIFIC PLASTIC IN INDOOR AIR PURIFICATION MARKET, BY TYPE, 2020-2029 (USD MILLION)
TABLE 51 ASIA-PACIFIC METAL IN INDOOR AIR PURIFICATION MARKET, BY TYPE, 2020-2029 (USD MILLION)
TABLE 52 ASIA-PACIFIC INDOOR AIR PURIFICATION MARKET, BY PRICE RANGE, 2020-2029 (USD MILLION)
TABLE 53 ASIA-PACIFIC INDOOR AIR PURIFICATION MARKET, BY DISTRIBUTION CHANNEL, 2020-2029 (USD MILLION)
TABLE 54 ASIA-PACIFIC INDOOR AIR PURIFICATION MARKET, BY APPLICATION, 2020-2029 (USD MILLION)
TABLE 55 CHINA INDOOR AIR PURIFICATION MARKET, BY PRODUCT, 2020-2029 (USD MILLION)
TABLE 56 CHINA INDOOR AIR PURIFICATION MARKET, BY CATEGORY, 2020-2029 (USD MILLION)
TABLE 57 CHINA INDOOR AIR PURIFICATION MARKET, BY TECHNOLOGY, 2020-2029 (USD MILLION)
TABLE 58 CHINA INDOOR AIR PURIFICATION MARKET, BY FUNCTION, 2020-2029 (USD MILLION)
TABLE 59 CHINA INDOOR AIR PURIFICATION MARKET, BY OUTER MATERIAL, 2020-2029 (USD MILLION)
TABLE 60 CHINA PLASTIC IN INDOOR AIR PURIFICATION MARKET, BY TYPE, 2020-2029 (USD MILLION)
TABLE 61 CHINA METAL IN INDOOR AIR PURIFICATION MARKET, BY TYPE, 2020-2029 (USD MILLION)
TABLE 62 CHINA INDOOR AIR PURIFICATION MARKET, BY PRICE RANGE, 2020-2029 (USD MILLION)
TABLE 63 CHINA INDOOR AIR PURIFICATION MARKET, BY DISTRIBUTION CHANNEL, 2020-2029 (USD MILLION)
TABLE 64 CHINA INDOOR AIR PURIFICATION MARKET, BY APPLICATION, 2020-2029 (USD MILLION)
TABLE 65 JAPAN INDOOR AIR PURIFICATION MARKET, BY PRODUCT, 2020-2029 (USD MILLION)
TABLE 66 JAPAN INDOOR AIR PURIFICATION MARKET, BY CATEGORY, 2020-2029 (USD MILLION)
TABLE 67 JAPAN INDOOR AIR PURIFICATION MARKET, BY TECHNOLOGY, 2020-2029 (USD MILLION)
TABLE 68 JAPAN INDOOR AIR PURIFICATION MARKET, BY FUNCTION, 2020-2029 (USD MILLION)
TABLE 69 JAPAN INDOOR AIR PURIFICATION MARKET, BY OUTER MATERIAL, 2020-2029 (USD MILLION)
TABLE 70 JAPAN PLASTIC IN INDOOR AIR PURIFICATION MARKET, BY TYPE, 2020-2029 (USD MILLION)
TABLE 71 JAPAN METAL IN INDOOR AIR PURIFICATION MARKET, BY TYPE, 2020-2029 (USD MILLION)
TABLE 72 JAPAN INDOOR AIR PURIFICATION MARKET, BY PRICE RANGE, 2020-2029 (USD MILLION)
TABLE 73 JAPAN INDOOR AIR PURIFICATION MARKET, BY DISTRIBUTION CHANNEL, 2020-2029 (USD MILLION)
TABLE 74 JAPAN INDOOR AIR PURIFICATION MARKET, BY APPLICATION, 2020-2029 (USD MILLION)
TABLE 75 SOUTH KOREA INDOOR AIR PURIFICATION MARKET, BY PRODUCT, 2020-2029 (USD MILLION)
TABLE 76 SOUTH KOREA INDOOR AIR PURIFICATION MARKET, BY CATEGORY, 2020-2029 (USD MILLION)
TABLE 77 SOUTH KOREA INDOOR AIR PURIFICATION MARKET, BY TECHNOLOGY, 2020-2029 (USD MILLION)
TABLE 78 SOUTH KOREA INDOOR AIR PURIFICATION MARKET, BY FUNCTION, 2020-2029 (USD MILLION)
TABLE 79 SOUTH KOREA INDOOR AIR PURIFICATION MARKET, BY OUTER MATERIAL, 2020-2029 (USD MILLION)
TABLE 80 SOUTH KOREA PLASTIC IN INDOOR AIR PURIFICATION MARKET, BY TYPE, 2020-2029 (USD MILLION)
TABLE 81 SOUTH KOREA METAL IN INDOOR AIR PURIFICATION MARKET, BY TYPE, 2020-2029 (USD MILLION)
TABLE 82 SOUTH KOREA INDOOR AIR PURIFICATION MARKET, BY PRICE RANGE, 2020-2029 (USD MILLION)
TABLE 83 SOUTH KOREA INDOOR AIR PURIFICATION MARKET, BY DISTRIBUTION CHANNEL, 2020-2029 (USD MILLION)
TABLE 84 SOUTH KOREA INDOOR AIR PURIFICATION MARKET, BY APPLICATION, 2020-2029 (USD MILLION)
TABLE 85 INDIA INDOOR AIR PURIFICATION MARKET, BY PRODUCT, 2020-2029 (USD MILLION)
TABLE 86 INDIA INDOOR AIR PURIFICATION MARKET, BY CATEGORY, 2020-2029 (USD MILLION)
TABLE 87 INDIA INDOOR AIR PURIFICATION MARKET, BY TECHNOLOGY, 2020-2029 (USD MILLION)
TABLE 88 INDIA INDOOR AIR PURIFICATION MARKET, BY FUNCTION, 2020-2029 (USD MILLION)
TABLE 89 INDIA INDOOR AIR PURIFICATION MARKET, BY OUTER MATERIAL, 2020-2029 (USD MILLION)
TABLE 90 INDIA PLASTIC IN INDOOR AIR PURIFICATION MARKET, BY TYPE, 2020-2029 (USD MILLION)
TABLE 91 INDIA METAL IN INDOOR AIR PURIFICATION MARKET, BY TYPE, 2020-2029 (USD MILLION)
TABLE 92 INDIA INDOOR AIR PURIFICATION MARKET, BY PRICE RANGE, 2020-2029 (USD MILLION)
TABLE 93 INDIA INDOOR AIR PURIFICATION MARKET, BY DISTRIBUTION CHANNEL, 2020-2029 (USD MILLION)
TABLE 94 INDIA INDOOR AIR PURIFICATION MARKET, BY APPLICATION, 2020-2029 (USD MILLION)
TABLE 95 AUSTRALIA & NEW ZEALAND INDOOR AIR PURIFICATION MARKET, BY PRODUCT, 2020-2029 (USD MILLION)
TABLE 96 AUSTRALIA & NEW ZEALAND INDOOR AIR PURIFICATION MARKET, BY CATEGORY, 2020-2029 (USD MILLION)
TABLE 97 AUSTRALIA & NEW ZEALAND INDOOR AIR PURIFICATION MARKET, BY TECHNOLOGY, 2020-2029 (USD MILLION)
TABLE 98 AUSTRALIA & NEW ZEALAND INDOOR AIR PURIFICATION MARKET, BY FUNCTION, 2020-2029 (USD MILLION)
TABLE 99 AUSTRALIA & NEW ZEALAND INDOOR AIR PURIFICATION MARKET, BY OUTER MATERIAL, 2020-2029 (USD MILLION)
TABLE 100 AUSTRALIA & NEW ZEALAND PLASTIC IN INDOOR AIR PURIFICATION MARKET, BY TYPE, 2020-2029 (USD MILLION)
TABLE 101 AUSTRALIA & NEW ZEALAND METAL IN INDOOR AIR PURIFICATION MARKET, BY TYPE, 2020-2029 (USD MILLION)
TABLE 102 AUSTRALIA & NEW ZEALAND INDOOR AIR PURIFICATION MARKET, BY PRICE RANGE, 2020-2029 (USD MILLION)
TABLE 103 AUSTRALIA & NEW ZEALAND INDOOR AIR PURIFICATION MARKET, BY DISTRIBUTION CHANNEL, 2020-2029 (USD MILLION)
TABLE 104 AUSTRALIA & NEW ZEALAND INDOOR AIR PURIFICATION MARKET, BY APPLICATION, 2020-2029 (USD MILLION)
TABLE 105 SINGAPORE INDOOR AIR PURIFICATION MARKET, BY PRODUCT, 2020-2029 (USD MILLION)
TABLE 106 SINGAPORE INDOOR AIR PURIFICATION MARKET, BY CATEGORY, 2020-2029 (USD MILLION)
TABLE 107 SINGAPORE INDOOR AIR PURIFICATION MARKET, BY TECHNOLOGY, 2020-2029 (USD MILLION)
TABLE 108 SINGAPORE INDOOR AIR PURIFICATION MARKET, BY FUNCTION, 2020-2029 (USD MILLION)
TABLE 109 SINGAPORE INDOOR AIR PURIFICATION MARKET, BY OUTER MATERIAL, 2020-2029 (USD MILLION)
TABLE 110 SINGAPORE PLASTIC IN INDOOR AIR PURIFICATION MARKET, BY TYPE, 2020-2029 (USD MILLION)
TABLE 111 SINGAPORE METAL IN INDOOR AIR PURIFICATION MARKET, BY TYPE, 2020-2029 (USD MILLION)
TABLE 112 SINGAPORE INDOOR AIR PURIFICATION MARKET, BY PRICE RANGE, 2020-2029 (USD MILLION)
TABLE 113 SINGAPORE INDOOR AIR PURIFICATION MARKET, BY DISTRIBUTION CHANNEL, 2020-2029 (USD MILLION)
TABLE 114 SINGAPORE INDOOR AIR PURIFICATION MARKET, BY APPLICATION, 2020-2029 (USD MILLION)
TABLE 115 THAILAND INDOOR AIR PURIFICATION MARKET, BY PRODUCT, 2020-2029 (USD MILLION)
TABLE 116 THAILAND INDOOR AIR PURIFICATION MARKET, BY CATEGORY, 2020-2029 (USD MILLION)
TABLE 117 THAILAND INDOOR AIR PURIFICATION MARKET, BY TECHNOLOGY, 2020-2029 (USD MILLION)
TABLE 118 THAILAND INDOOR AIR PURIFICATION MARKET, BY FUNCTION, 2020-2029 (USD MILLION)
TABLE 119 THAILAND INDOOR AIR PURIFICATION MARKET, BY OUTER MATERIAL, 2020-2029 (USD MILLION)
TABLE 120 THAILAND PLASTIC IN INDOOR AIR PURIFICATION MARKET, BY TYPE, 2020-2029 (USD MILLION)
TABLE 121 THAILAND METAL IN INDOOR AIR PURIFICATION MARKET, BY TYPE, 2020-2029 (USD MILLION)
TABLE 122 THAILAND INDOOR AIR PURIFICATION MARKET, BY PRICE RANGE, 2020-2029 (USD MILLION)
TABLE 123 THAILAND INDOOR AIR PURIFICATION MARKET, BY DISTRIBUTION CHANNEL, 2020-2029 (USD MILLION)
TABLE 124 THAILAND INDOOR AIR PURIFICATION MARKET, BY APPLICATION, 2020-2029 (USD MILLION)
TABLE 125 MALAYSIA INDOOR AIR PURIFICATION MARKET, BY PRODUCT, 2020-2029 (USD MILLION)
TABLE 126 MALAYSIA INDOOR AIR PURIFICATION MARKET, BY CATEGORY, 2020-2029 (USD MILLION)
TABLE 127 MALAYSIA INDOOR AIR PURIFICATION MARKET, BY TECHNOLOGY, 2020-2029 (USD MILLION)
TABLE 128 MALAYSIA INDOOR AIR PURIFICATION MARKET, BY FUNCTION, 2020-2029 (USD MILLION)
TABLE 129 MALAYSIA INDOOR AIR PURIFICATION MARKET, BY OUTER MATERIAL, 2020-2029 (USD MILLION)
TABLE 130 MALAYSIA PLASTIC IN INDOOR AIR PURIFICATION MARKET, BY TYPE, 2020-2029 (USD MILLION)
TABLE 131 MALAYSIA METAL IN INDOOR AIR PURIFICATION MARKET, BY TYPE, 2020-2029 (USD MILLION)
TABLE 132 MALAYSIA INDOOR AIR PURIFICATION MARKET, BY PRICE RANGE, 2020-2029 (USD MILLION)
TABLE 133 MALAYSIA INDOOR AIR PURIFICATION MARKET, BY DISTRIBUTION CHANNEL, 2020-2029 (USD MILLION)
TABLE 134 MALAYSIA INDOOR AIR PURIFICATION MARKET, BY APPLICATION, 2020-2029 (USD MILLION)
TABLE 135 INDONESIA INDOOR AIR PURIFICATION MARKET, BY PRODUCT, 2020-2029 (USD MILLION)
TABLE 136 INDONESIA INDOOR AIR PURIFICATION MARKET, BY CATEGORY, 2020-2029 (USD MILLION)
TABLE 137 INDONESIA INDOOR AIR PURIFICATION MARKET, BY TECHNOLOGY, 2020-2029 (USD MILLION)
TABLE 138 INDONESIA INDOOR AIR PURIFICATION MARKET, BY FUNCTION, 2020-2029 (USD MILLION)
TABLE 139 INDONESIA INDOOR AIR PURIFICATION MARKET, BY OUTER MATERIAL, 2020-2029 (USD MILLION)
TABLE 140 INDONESIA PLASTIC IN INDOOR AIR PURIFICATION MARKET, BY TYPE, 2020-2029 (USD MILLION)
TABLE 141 INDONESIA METAL IN INDOOR AIR PURIFICATION MARKET, BY TYPE, 2020-2029 (USD MILLION)
TABLE 142 INDONESIA INDOOR AIR PURIFICATION MARKET, BY PRICE RANGE, 2020-2029 (USD MILLION)
TABLE 143 INDONESIA INDOOR AIR PURIFICATION MARKET, BY DISTRIBUTION CHANNEL, 2020-2029 (USD MILLION)
TABLE 144 INDONESIA INDOOR AIR PURIFICATION MARKET, BY APPLICATION, 2020-2029 (USD MILLION)
TABLE 145 PHILIPPINES INDOOR AIR PURIFICATION MARKET, BY PRODUCT, 2020-2029 (USD MILLION)
TABLE 146 PHILIPPINES INDOOR AIR PURIFICATION MARKET, BY CATEGORY, 2020-2029 (USD MILLION)
TABLE 147 PHILIPPINES INDOOR AIR PURIFICATION MARKET, BY TECHNOLOGY, 2020-2029 (USD MILLION)
TABLE 148 PHILIPPINES INDOOR AIR PURIFICATION MARKET, BY FUNCTION, 2020-2029 (USD MILLION)
TABLE 149 PHILIPPINES INDOOR AIR PURIFICATION MARKET, BY OUTER MATERIAL, 2020-2029 (USD MILLION)
TABLE 150 PHILIPPINES PLASTIC IN INDOOR AIR PURIFICATION MARKET, BY TYPE, 2020-2029 (USD MILLION)
TABLE 151 PHILIPPINES METAL IN INDOOR AIR PURIFICATION MARKET, BY TYPE, 2020-2029 (USD MILLION)
TABLE 152 PHILIPPINES INDOOR AIR PURIFICATION MARKET, BY PRICE RANGE, 2020-2029 (USD MILLION)
TABLE 153 PHILIPPINES INDOOR AIR PURIFICATION MARKET, BY DISTRIBUTION CHANNEL, 2020-2029 (USD MILLION)
TABLE 154 PHILIPPINES INDOOR AIR PURIFICATION MARKET, BY APPLICATION, 2020-2029 (USD MILLION)
TABLE 155 REST OF ASIA-PACIFIC INDOOR AIR PURIFICATION MARKET, BY PRODUCT, 2020-2029 (USD MILLION)
TABLE 156 NORTH AMERICA INDOOR AIR PURIFICATION MARKET, BY COUNTRY, 2020-2029 (USD MILLION)
TABLE 157 NORTH AMERICA INDOOR AIR PURIFICATION MARKET, BY PRODUCT, 2020-2029 (USD MILLION)
TABLE 158 NORTH AMERICA INDOOR AIR PURIFICATION MARKET, BY CATEGORY, 2020-2029 (USD MILLION)
TABLE 159 NORTH AMERICA INDOOR AIR PURIFICATION MARKET, BY TECHNOLOGY, 2020-2029 (USD MILLION)
TABLE 160 NORTH AMERICA INDOOR AIR PURIFICATION MARKET, BY FUNCTION , 2020-2029 (USD MILLION)
TABLE 161 NORTH AMERICA INDOOR AIR PURIFICATION MARKET, BY OUTER MATERIAL, 2020-2029 (USD MILLION)
TABLE 162 NORTH AMERICA PLASTIC IN INDOOR AIR PURIFICATION MARKET, BY TYPE, 2020-2029 (USD MILLION)
TABLE 163 NORTH AMERICA METAL IN INDOOR AIR PURIFICATION MARKET, BY TYPE, 2020-2029 (USD MILLION)
TABLE 164 NORTH AMERICA INDOOR AIR PURIFICATION MARKET, BY PRICE RANGE, 2020-2029 (USD MILLION)
TABLE 165 NORTH AMERICA INDOOR AIR PURIFICATION MARKET, BY DISTRIBUTION CHANNEL, 2020-2029 (USD MILLION)
TABLE 166 NORTH AMERICA INDOOR AIR PURIFICATION MARKET, BY APPLICATION, 2020-2029 (USD MILLION)
TABLE 167 U.S. INDOOR AIR PURIFICATION MARKET, BY PRODUCT, 2020-2029 (USD MILLION)
TABLE 168 U.S. INDOOR AIR PURIFICATION MARKET, BY CATEGORY, 2020-2029 (USD MILLION)
TABLE 169 U.S. INDOOR AIR PURIFICATION MARKET, BY TECHNOLOGY, 2020-2029 (USD MILLION)
TABLE 170 U.S. INDOOR AIR PURIFICATION MARKET, BY FUNCTION , 2020-2029 (USD MILLION)
TABLE 171 U.S. INDOOR AIR PURIFICATION MARKET, BY OUTER MATERIAL, 2020-2029 (USD MILLION)
TABLE 172 U.S. PLASTIC IN INDOOR AIR PURIFICATION MARKET, BY TYPE, 2020-2029 (USD MILLION)
TABLE 173 U.S. METAL IN INDOOR AIR PURIFICATION MARKET, BY TYPE, 2020-2029 (USD MILLION)
TABLE 174 U.S. INDOOR AIR PURIFICATION MARKET, BY PRICE RANGE, 2020-2029 (USD MILLION)
TABLE 175 U.S. INDOOR AIR PURIFICATION MARKET, BY DISTRIBUTION CHANNEL, 2020-2029 (USD MILLION)
TABLE 176 U.S. INDOOR AIR PURIFICATION MARKET, BY APPLICATION, 2020-2029 (USD MILLION)
TABLE 177 CANADA INDOOR AIR PURIFICATION MARKET, BY PRODUCT, 2020-2029 (USD MILLION)
TABLE 178 CANADA INDOOR AIR PURIFICATION MARKET, BY CATEGORY, 2020-2029 (USD MILLION)
TABLE 179 CANADA INDOOR AIR PURIFICATION MARKET, BY TECHNOLOGY, 2020-2029 (USD MILLION)
TABLE 180 CANADA INDOOR AIR PURIFICATION MARKET, BY FUNCTION , 2020-2029 (USD MILLION)
TABLE 181 CANADA INDOOR AIR PURIFICATION MARKET, BY OUTER MATERIAL, 2020-2029 (USD MILLION)
TABLE 182 CANADA PLASTIC IN INDOOR AIR PURIFICATION MARKET, BY TYPE, 2020-2029 (USD MILLION)
TABLE 183 CANADA METAL IN INDOOR AIR PURIFICATION MARKET, BY TYPE, 2020-2029 (USD MILLION)
TABLE 184 CANADA INDOOR AIR PURIFICATION MARKET, BY PRICE RANGE, 2020-2029 (USD MILLION)
TABLE 185 CANADA INDOOR AIR PURIFICATION MARKET, BY DISTRIBUTION CHANNEL, 2020-2029 (USD MILLION)
TABLE 186 CANADA INDOOR AIR PURIFICATION MARKET, BY APPLICATION, 2020-2029 (USD MILLION)
TABLE 187 MEXICO INDOOR AIR PURIFICATION MARKET, BY PRODUCT, 2020-2029 (USD MILLION)
TABLE 188 MEXICO INDOOR AIR PURIFICATION MARKET, BY CATEGORY, 2020-2029 (USD MILLION)
TABLE 189 MEXICO INDOOR AIR PURIFICATION MARKET, BY TECHNOLOGY, 2020-2029 (USD MILLION)
TABLE 190 MEXICO INDOOR AIR PURIFICATION MARKET, BY FUNCTION , 2020-2029 (USD MILLION)
TABLE 191 MEXICO INDOOR AIR PURIFICATION MARKET, BY OUTER MATERIAL, 2020-2029 (USD MILLION)
TABLE 192 MEXICO PLASTIC IN INDOOR AIR PURIFICATION MARKET, BY TYPE, 2020-2029 (USD MILLION)
TABLE 193 MEXICO METAL IN INDOOR AIR PURIFICATION MARKET, BY TYPE, 2020-2029 (USD MILLION)
TABLE 194 MEXICO INDOOR AIR PURIFICATION MARKET, BY PRICE RANGE, 2020-2029 (USD MILLION)
TABLE 195 MEXICO INDOOR AIR PURIFICATION MARKET, BY DISTRIBUTION CHANNEL, 2020-2029 (USD MILLION)
TABLE 196 MEXICO INDOOR AIR PURIFICATION MARKET, BY APPLICATION, 2020-2029 (USD MILLION)
TABLE 197 EUROPE INDOOR AIR PURIFICATION MARKET, BY COUNTRY, 2020-2029 (USD MILLION)
TABLE 198 EUROPE INDOOR AIR PURIFICATION MARKET, BY PRODUCT, 2020-2029 (USD MILLION)
TABLE 199 EUROPE IN INDOOR AIR PURIFICATION MARKET, BY CATEGORY, 2020-2029 (USD MILLION)
TABLE 200 EUROPE INDOOR AIR PURIFICATION MARKET, BY TECHNOLOGY, 2020-2029 (USD MILLION)
TABLE 201 EUROPE INDOOR AIR PURIFICATION MARKET, BY FUNCTION , 2020-2029 (USD MILLION)
TABLE 202 EUROPE INDOOR AIR PURIFICATION MARKET, BY OUTER MATERIAL, 2020-2029 (USD MILLION)
TABLE 203 EUROPE PLASTIC IN INDOOR AIR PURIFICATION MARKET, BY TYPE, 2020-2029 (USD MILLION)
TABLE 204 EUROPE METAL IN INDOOR AIR PURIFICATION MARKET, BY TYPE, 2020-2029 (USD MILLION)
TABLE 205 EUROPE INDOOR AIR PURIFICATION MARKET, BY PRICE RANGE, 2020-2029 (USD MILLION)
TABLE 206 EUROPE INDOOR AIR PURIFICATION MARKET, BY DISTRIBUTION CHANNEL, 2020-2029 (USD MILLION)
TABLE 207 EUROPE INDOOR AIR PURIFICATION MARKET, BY APPLICATION, 2020-2029 (USD MILLION)
TABLE 208 U.K. INDOOR AIR PURIFICATION MARKET, BY PRODUCT, 2020-2029 (USD MILLION)
TABLE 209 U.K. INDOOR AIR PURIFICATION MARKET, BY CATEGORY, 2020-2029 (USD MILLION)
TABLE 210 U.K. INDOOR AIR PURIFICATION MARKET, BY TECHNOLOGY, 2020-2029 (USD MILLION)
TABLE 211 U.K. INDOOR AIR PURIFICATION MARKET, BY FUNCTION , 2020-2029 (USD MILLION)
TABLE 212 U.K. INDOOR AIR PURIFICATION MARKET, BY OUTER MATERIAL, 2020-2029 (USD MILLION)
TABLE 213 U.K. PLASTIC IN INDOOR AIR PURIFICATION MARKET, BY TYPE, 2020-2029 (USD MILLION)
TABLE 214 U.K. METAL IN INDOOR AIR PURIFICATION MARKET, BY TYPE, 2020-2029 (USD MILLION)
TABLE 215 U.K. INDOOR AIR PURIFICATION MARKET, BY PRICE RANGE, 2020-2029 (USD MILLION)
TABLE 216 U.K. INDOOR AIR PURIFICATION MARKET, BY DISTRIBUTION CHANNEL, 2020-2029 (USD MILLION)
TABLE 217 U.K. INDOOR AIR PURIFICATION MARKET, BY APPLICATION, 2020-2029 (USD MILLION)
TABLE 218 GERMANY INDOOR AIR PURIFICATION MARKET, BY PRODUCT, 2020-2029 (USD MILLION)
TABLE 219 GERMANY INDOOR AIR PURIFICATION MARKET, BY CATEGORY, 2020-2029 (USD MILLION)
TABLE 220 GERMANY INDOOR AIR PURIFICATION MARKET, BY TECHNOLOGY, 2020-2029 (USD MILLION)
TABLE 221 GERMANY INDOOR AIR PURIFICATION MARKET, BY FUNCTION , 2020-2029 (USD MILLION)
TABLE 222 GERMANY INDOOR AIR PURIFICATION MARKET, BY OUTER MATERIAL, 2020-2029 (USD MILLION)
TABLE 223 GERMANY PLASTIC IN INDOOR AIR PURIFICATION MARKET, BY TYPE, 2020-2029 (USD MILLION)
TABLE 224 GERMANY METAL IN INDOOR AIR PURIFICATION MARKET, BY TYPE, 2020-2029 (USD MILLION)
TABLE 225 GERMANY INDOOR AIR PURIFICATION MARKET, BY PRICE RANGE, 2020-2029 (USD MILLION)
TABLE 226 GERMANY INDOOR AIR PURIFICATION MARKET, BY DISTRIBUTION CHANNEL, 2020-2029 (USD MILLION)
TABLE 227 GERMANY INDOOR AIR PURIFICATION MARKET, BY APPLICATION, 2020-2029 (USD MILLION)
TABLE 228 FRANCE INDOOR AIR PURIFICATION MARKET, BY PRODUCT, 2020-2029 (USD MILLION)
TABLE 229 FRANCE INDOOR AIR PURIFICATION MARKET, BY CATEGORY, 2020-2029 (USD MILLION)
TABLE 230 FRANCE INDOOR AIR PURIFICATION MARKET, BY TECHNOLOGY, 2020-2029 (USD MILLION)
TABLE 231 FRANCE INDOOR AIR PURIFICATION MARKET, BY FUNCTION , 2020-2029 (USD MILLION)
TABLE 232 FRANCE INDOOR AIR PURIFICATION MARKET, BY OUTER MATERIAL, 2020-2029 (USD MILLION)
TABLE 233 FRANCE PLASTIC IN INDOOR AIR PURIFICATION MARKET, BY TYPE, 2020-2029 (USD MILLION)
TABLE 234 FRANCE METAL IN INDOOR AIR PURIFICATION MARKET, BY TYPE, 2020-2029 (USD MILLION)
TABLE 235 FRANCE INDOOR AIR PURIFICATION MARKET, BY PRICE RANGE, 2020-2029 (USD MILLION)
TABLE 236 FRANCE INDOOR AIR PURIFICATION MARKET, BY DISTRIBUTION CHANNEL, 2020-2029 (USD MILLION)
TABLE 237 FRANCE INDOOR AIR PURIFICATION MARKET, BY APPLICATION, 2020-2029 (USD MILLION)
TABLE 238 ITALY INDOOR AIR PURIFICATION MARKET, BY PRODUCT, 2020-2029 (USD MILLION)
TABLE 239 ITALY INDOOR AIR PURIFICATION MARKET, BY CATEGORY, 2020-2029 (USD MILLION)
TABLE 240 ITALY INDOOR AIR PURIFICATION MARKET, BY TECHNOLOGY, 2020-2029 (USD MILLION)
TABLE 241 ITALY INDOOR AIR PURIFICATION MARKET, BY FUNCTION , 2020-2029 (USD MILLION)
TABLE 242 ITALY INDOOR AIR PURIFICATION MARKET, BY OUTER MATERIAL, 2020-2029 (USD MILLION)
TABLE 243 ITALY PLASTIC IN INDOOR AIR PURIFICATION MARKET, BY TYPE, 2020-2029 (USD MILLION)
TABLE 244 ITALY METAL IN INDOOR AIR PURIFICATION MARKET, BY TYPE, 2020-2029 (USD MILLION)
TABLE 245 ITALY INDOOR AIR PURIFICATION MARKET, BY PRICE RANGE, 2020-2029 (USD MILLION)
TABLE 246 ITALY INDOOR AIR PURIFICATION MARKET, BY DISTRIBUTION CHANNEL, 2020-2029 (USD MILLION)
TABLE 247 ITALY INDOOR AIR PURIFICATION MARKET, BY APPLICATION, 2020-2029 (USD MILLION)
TABLE 248 TURKEY INDOOR AIR PURIFICATION MARKET, BY PRODUCT, 2020-2029 (USD MILLION)
TABLE 249 TURKEY INDOOR AIR PURIFICATION MARKET, BY CATEGORY, 2020-2029 (USD MILLION)
TABLE 250 TURKEY INDOOR AIR PURIFICATION MARKET, BY TECHNOLOGY, 2020-2029 (USD MILLION)
TABLE 251 TURKEY INDOOR AIR PURIFICATION MARKET, BY FUNCTION , 2020-2029 (USD MILLION)
TABLE 252 TURKEY INDOOR AIR PURIFICATION MARKET, BY OUTER MATERIAL, 2020-2029 (USD MILLION)
TABLE 253 TURKEY PLASTIC IN INDOOR AIR PURIFICATION MARKET, BY TYPE, 2020-2029 (USD MILLION)
TABLE 254 TURKEY METAL IN INDOOR AIR PURIFICATION MARKET, BY TYPE, 2020-2029 (USD MILLION)
TABLE 255 TURKEY INDOOR AIR PURIFICATION MARKET, BY PRICE RANGE, 2020-2029 (USD MILLION)
TABLE 256 TURKEY INDOOR AIR PURIFICATION MARKET, BY DISTRIBUTION CHANNEL, 2020-2029 (USD MILLION)
TABLE 257 TURKEY INDOOR AIR PURIFICATION MARKET, BY APPLICATION, 2020-2029 (USD MILLION)
TABLE 258 SPAIN INDOOR AIR PURIFICATION MARKET, BY PRODUCT, 2020-2029 (USD MILLION)
TABLE 259 SPAIN INDOOR AIR PURIFICATION MARKET, BY CATEGORY, 2020-2029 (USD MILLION)
TABLE 260 SPAIN INDOOR AIR PURIFICATION MARKET, BY TECHNOLOGY, 2020-2029 (USD MILLION)
TABLE 261 SPAIN INDOOR AIR PURIFICATION MARKET, BY FUNCTION , 2020-2029 (USD MILLION)
TABLE 262 SPAIN INDOOR AIR PURIFICATION MARKET, BY OUTER MATERIAL, 2020-2029 (USD MILLION)
TABLE 263 SPAIN PLASTIC IN INDOOR AIR PURIFICATION MARKET, BY TYPE, 2020-2029 (USD MILLION)
TABLE 264 SPAIN METAL IN INDOOR AIR PURIFICATION MARKET, BY TYPE, 2020-2029 (USD MILLION)
TABLE 265 SPAIN INDOOR AIR PURIFICATION MARKET, BY PRICE RANGE, 2020-2029 (USD MILLION)
TABLE 266 SPAIN INDOOR AIR PURIFICATION MARKET, BY DISTRIBUTION CHANNEL, 2020-2029 (USD MILLION)
TABLE 267 SPAIN INDOOR AIR PURIFICATION MARKET, BY APPLICATION, 2020-2029 (USD MILLION)
TABLE 268 RUSSIA INDOOR AIR PURIFICATION MARKET, BY PRODUCT, 2020-2029 (USD MILLION)
TABLE 269 RUSSIA INDOOR AIR PURIFICATION MARKET, BY CATEGORY, 2020-2029 (USD MILLION)
TABLE 270 RUSSIA INDOOR AIR PURIFICATION MARKET, BY TECHNOLOGY, 2020-2029 (USD MILLION)
TABLE 271 RUSSIA INDOOR AIR PURIFICATION MARKET, BY FUNCTION , 2020-2029 (USD MILLION)
TABLE 272 RUSSIA INDOOR AIR PURIFICATION MARKET, BY OUTER MATERIAL, 2020-2029 (USD MILLION)
TABLE 273 RUSSIA PLASTIC IN INDOOR AIR PURIFICATION MARKET, BY TYPE, 2020-2029 (USD MILLION)
TABLE 274 RUSSIA METAL IN INDOOR AIR PURIFICATION MARKET, BY TYPE, 2020-2029 (USD MILLION)
TABLE 275 RUSSIA INDOOR AIR PURIFICATION MARKET, BY PRICE RANGE, 2020-2029 (USD MILLION)
TABLE 276 RUSSIA INDOOR AIR PURIFICATION MARKET, BY DISTRIBUTION CHANNEL, 2020-2029 (USD MILLION)
TABLE 277 RUSSIA INDOOR AIR PURIFICATION MARKET, BY APPLICATION, 2020-2029 (USD MILLION)
TABLE 278 SWITZERLAND INDOOR AIR PURIFICATION MARKET, BY PRODUCT, 2020-2029 (USD MILLION)
TABLE 279 SWITZERLAND INDOOR AIR PURIFICATION MARKET, BY CATEGORY, 2020-2029 (USD MILLION)
TABLE 280 SWITZERLAND INDOOR AIR PURIFICATION MARKET, BY TECHNOLOGY, 2020-2029 (USD MILLION)
TABLE 281 SWITZERLAND INDOOR AIR PURIFICATION MARKET, BY FUNCTION , 2020-2029 (USD MILLION)
TABLE 282 SWITZERLAND INDOOR AIR PURIFICATION MARKET, BY OUTER MATERIAL, 2020-2029 (USD MILLION)
TABLE 283 SWITZERLAND PLASTIC IN INDOOR AIR PURIFICATION MARKET, BY TYPE, 2020-2029 (USD MILLION)
TABLE 284 SWITZERLAND METAL IN INDOOR AIR PURIFICATION MARKET, BY TYPE, 2020-2029 (USD MILLION)
TABLE 285 SWITZERLAND INDOOR AIR PURIFICATION MARKET, BY PRICE RANGE, 2020-2029 (USD MILLION)
TABLE 286 SWITZERLAND INDOOR AIR PURIFICATION MARKET, BY DISTRIBUTION CHANNEL, 2020-2029 (USD MILLION)
TABLE 287 SWITZERLAND INDOOR AIR PURIFICATION MARKET, BY APPLICATION, 2020-2029 (USD MILLION)
TABLE 288 BELGIUM INDOOR AIR PURIFICATION MARKET, BY PRODUCT, 2020-2029 (USD MILLION)
TABLE 289 BELGIUM INDOOR AIR PURIFICATION MARKET, BY CATEGORY, 2020-2029 (USD MILLION)
TABLE 290 BELGIUM INDOOR AIR PURIFICATION MARKET, BY TECHNOLOGY, 2020-2029 (USD MILLION)
TABLE 291 BELGIUM INDOOR AIR PURIFICATION MARKET, BY FUNCTION , 2020-2029 (USD MILLION)
TABLE 292 BELGIUM INDOOR AIR PURIFICATION MARKET, BY OUTER MATERIAL, 2020-2029 (USD MILLION)
TABLE 293 BELGIUM PLASTIC IN INDOOR AIR PURIFICATION MARKET, BY TYPE, 2020-2029 (USD MILLION)
TABLE 294 BELGIUM METAL IN INDOOR AIR PURIFICATION MARKET, BY TYPE, 2020-2029 (USD MILLION)
TABLE 295 BELGIUM INDOOR AIR PURIFICATION MARKET, BY PRICE RANGE, 2020-2029 (USD MILLION)
TABLE 296 BELGIUM INDOOR AIR PURIFICATION MARKET, BY DISTRIBUTION CHANNEL, 2020-2029 (USD MILLION)
TABLE 297 BELGIUM INDOOR AIR PURIFICATION MARKET, BY APPLICATION, 2020-2029 (USD MILLION)
TABLE 298 NETHERLANDS INDOOR AIR PURIFICATION MARKET, BY PRODUCT, 2020-2029 (USD MILLION)
TABLE 299 NETHERLANDS INDOOR AIR PURIFICATION MARKET, BY CATEGORY, 2020-2029 (USD MILLION)
TABLE 300 NETHERLANDS INDOOR AIR PURIFICATION MARKET, BY TECHNOLOGY, 2020-2029 (USD MILLION)
TABLE 301 NETHERLANDS INDOOR AIR PURIFICATION MARKET, BY FUNCTION , 2020-2029 (USD MILLION)
TABLE 302 NETHERLANDS INDOOR AIR PURIFICATION MARKET, BY OUTER MATERIAL, 2020-2029 (USD MILLION)
TABLE 303 NETHERLANDS PLASTIC IN INDOOR AIR PURIFICATION MARKET, BY TYPE, 2020-2029 (USD MILLION)
TABLE 304 NETHERLANDS METAL IN INDOOR AIR PURIFICATION MARKET, BY TYPE, 2020-2029 (USD MILLION)
TABLE 305 NETHERLANDS INDOOR AIR PURIFICATION MARKET, BY PRICE RANGE, 2020-2029 (USD MILLION)
TABLE 306 NETHERLANDS INDOOR AIR PURIFICATION MARKET, BY DISTRIBUTION CHANNEL, 2020-2029 (USD MILLION)
TABLE 307 NETHERLANDS INDOOR AIR PURIFICATION MARKET, BY APPLICATION, 2020-2029 (USD MILLION)
TABLE 308 REST OF EUROPE INDOOR AIR PURIFICATION MARKET, BY PRODUCT, 2020-2029 (USD MILLION)
TABLE 309 MIDDLE EAST & AFRICA INDOOR AIR PURIFICATION MARKET, BY COUNTRY, 2020-2029 (USD MILLION)
TABLE 310 MIDDLE EAST AND AFRICA INDOOR AIR PURIFICATION MARKET, BY PRODUCT, 2020-2029 (USD MILLION)
TABLE 311 MIDDLE EAST AND AFRICA INDOOR AIR PURIFICATION MARKET, BY CATEGORY, 2020-2029 (USD MILLION)
TABLE 312 MIDDLE EAST AND AFRICA INDOOR AIR PURIFICATION MARKET, BY TECHNOLOGY, 2020-2029 (USD MILLION)
TABLE 313 MIDDLE EAST AND AFRICA INDOOR AIR PURIFICATION MARKET, BY FUNCTION , 2020-2029 (USD MILLION)
TABLE 314 MIDDLE EAST AND AFRICA INDOOR AIR PURIFICATION MARKET, BY OUTER MATERIAL, 2020-2029 (USD MILLION)
TABLE 315 MIDDLE EAST AND AFRICA PLASTIC IN INDOOR AIR PURIFICATION MARKET, BY TYPE, 2020-2029 (USD MILLION)
TABLE 316 MIDDLE EAST AND AFRICA METAL IN INDOOR AIR PURIFICATION MARKET, BY TYPE, 2020-2029 (USD MILLION)
TABLE 317 MIDDLE EAST AND AFRICA INDOOR AIR PURIFICATION MARKET, BY PRICE RANGE, 2020-2029 (USD MILLION)
TABLE 318 MIDDLE EAST AND AFRICA INDOOR AIR PURIFICATION MARKET, BY DISTRIBUTION CHANNEL, 2020-2029 (USD MILLION)
TABLE 319 MIDDLE EAST AND AFRICA INDOOR AIR PURIFICATION MARKET, BY APPLICATION, 2020-2029 (USD MILLION)
TABLE 320 SAUDI ARABIA INDOOR AIR PURIFICATION MARKET, BY PRODUCT, 2020-2029 (USD MILLION)
TABLE 321 SAUDI ARABIA INDOOR AIR PURIFICATION MARKET, BY CATEGORY, 2020-2029 (USD MILLION)
TABLE 322 SAUDI ARABIA INDOOR AIR PURIFICATION MARKET, BY TECHNOLOGY, 2020-2029 (USD MILLION)
TABLE 323 SAUDI ARABIA INDOOR AIR PURIFICATION MARKET, BY FUNCTION , 2020-2029 (USD MILLION)
TABLE 324 SAUDI ARABIA INDOOR AIR PURIFICATION MARKET, BY OUTER MATERIAL, 2020-2029 (USD MILLION)
TABLE 325 SAUDI ARABIA PLASTIC IN INDOOR AIR PURIFICATION MARKET, BY TYPE, 2020-2029 (USD MILLION)
TABLE 326 SAUDI ARABIA METAL IN INDOOR AIR PURIFICATION MARKET, BY TYPE, 2020-2029 (USD MILLION)
TABLE 327 SAUDI ARABIA INDOOR AIR PURIFICATION MARKET, BY PRICE RANGE, 2020-2029 (USD MILLION)
TABLE 328 SAUDI ARABIA INDOOR AIR PURIFICATION MARKET, BY DISTRIBUTION CHANNEL, 2020-2029 (USD MILLION)
TABLE 329 SAUDI ARABIA INDOOR AIR PURIFICATION MARKET, BY APPLICATION, 2020-2029 (USD MILLION)
TABLE 330 ISRAEL INDOOR AIR PURIFICATION MARKET, BY PRODUCT, 2020-2029 (USD MILLION)
TABLE 331 ISRAEL INDOOR AIR PURIFICATION MARKET, BY CATEGORY, 2020-2029 (USD MILLION)
TABLE 332 ISRAEL INDOOR AIR PURIFICATION MARKET, BY TECHNOLOGY, 2020-2029 (USD MILLION)
TABLE 333 ISRAEL INDOOR AIR PURIFICATION MARKET, BY FUNCTION , 2020-2029 (USD MILLION)
TABLE 334 ISRAEL INDOOR AIR PURIFICATION MARKET, BY OUTER MATERIAL, 2020-2029 (USD MILLION)
TABLE 335 ISRAEL PLASTIC IN INDOOR AIR PURIFICATION MARKET, BY TYPE, 2020-2029 (USD MILLION)
TABLE 336 ISRAEL METAL IN INDOOR AIR PURIFICATION MARKET, BY TYPE, 2020-2029 (USD MILLION)
TABLE 337 ISRAEL INDOOR AIR PURIFICATION MARKET, BY PRICE RANGE, 2020-2029 (USD MILLION)
TABLE 338 ISRAEL INDOOR AIR PURIFICATION MARKET, BY DISTRIBUTION CHANNEL, 2020-2029 (USD MILLION)
TABLE 339 ISRAEL INDOOR AIR PURIFICATION MARKET, BY APPLICATION, 2020-2029 (USD MILLION)
TABLE 340 U.A.E. INDOOR AIR PURIFICATION MARKET, BY PRODUCT, 2020-2029 (USD MILLION)
TABLE 341 U.A.E. INDOOR AIR PURIFICATION MARKET, BY CATEGORY, 2020-2029 (USD MILLION)
TABLE 342 U.A.E. INDOOR AIR PURIFICATION MARKET, BY TECHNOLOGY, 2020-2029 (USD MILLION)
TABLE 343 U.A.E. INDOOR AIR PURIFICATION MARKET, BY FUNCTION , 2020-2029 (USD MILLION)
TABLE 344 U.A.E. INDOOR AIR PURIFICATION MARKET, BY OUTER MATERIAL, 2020-2029 (USD MILLION)
TABLE 345 U.A.E. PLASTIC IN INDOOR AIR PURIFICATION MARKET, BY TYPE, 2020-2029 (USD MILLION)
TABLE 346 U.A.E. METAL IN INDOOR AIR PURIFICATION MARKET, BY TYPE, 2020-2029 (USD MILLION)
TABLE 347 U.A.E. INDOOR AIR PURIFICATION MARKET, BY PRICE RANGE, 2020-2029 (USD MILLION)
TABLE 348 U.A.E. INDOOR AIR PURIFICATION MARKET, BY DISTRIBUTION CHANNEL, 2020-2029 (USD MILLION)
TABLE 349 U.A.E. INDOOR AIR PURIFICATION MARKET, BY APPLICATION, 2020-2029 (USD MILLION)
TABLE 350 SOUTH AFRICA INDOOR AIR PURIFICATION MARKET, BY PRODUCT, 2020-2029 (USD MILLION)
TABLE 351 SOUTH AFRICA INDOOR AIR PURIFICATION MARKET, BY CATEGORY, 2020-2029 (USD MILLION)
TABLE 352 SOUTH AFRICA INDOOR AIR PURIFICATION MARKET, BY TECHNOLOGY, 2020-2029 (USD MILLION)
TABLE 353 SOUTH AFRICA INDOOR AIR PURIFICATION MARKET, BY FUNCTION , 2020-2029 (USD MILLION)
TABLE 354 SOUTH AFRICA INDOOR AIR PURIFICATION MARKET, BY OUTER MATERIAL, 2020-2029 (USD MILLION)
TABLE 355 SOUTH AFRICA PLASTIC IN INDOOR AIR PURIFICATION MARKET, BY TYPE, 2020-2029 (USD MILLION)
TABLE 356 SOUTH AFRICA METAL IN INDOOR AIR PURIFICATION MARKET, BY TYPE, 2020-2029 (USD MILLION)
TABLE 357 SOUTH AFRICA INDOOR AIR PURIFICATION MARKET, BY PRICE RANGE, 2020-2029 (USD MILLION)
TABLE 358 SOUTH AFRICA INDOOR AIR PURIFICATION MARKET, BY DISTRIBUTION CHANNEL, 2020-2029 (USD MILLION)
TABLE 359 SOUTH AFRICA INDOOR AIR PURIFICATION MARKET, BY APPLICATION, 2020-2029 (USD MILLION)
TABLE 360 EGYPT INDOOR AIR PURIFICATION MARKET, BY PRODUCT, 2020-2029 (USD MILLION)
TABLE 361 EGYPT INDOOR AIR PURIFICATION MARKET, BY CATEGORY, 2020-2029 (USD MILLION)
TABLE 362 EGYPT INDOOR AIR PURIFICATION MARKET, BY TECHNOLOGY, 2020-2029 (USD MILLION)
TABLE 363 EGYPT INDOOR AIR PURIFICATION MARKET, BY FUNCTION , 2020-2029 (USD MILLION)
TABLE 364 EGYPT INDOOR AIR PURIFICATION MARKET, BY OUTER MATERIAL, 2020-2029 (USD MILLION)
TABLE 365 EGYPT PLASTIC IN INDOOR AIR PURIFICATION MARKET, BY TYPE, 2020-2029 (USD MILLION)
TABLE 366 EGYPT METAL IN INDOOR AIR PURIFICATION MARKET, BY TYPE, 2020-2029 (USD MILLION)
TABLE 367 EGYPT INDOOR AIR PURIFICATION MARKET, BY PRICE RANGE, 2020-2029 (USD MILLION)
TABLE 368 EGYPT INDOOR AIR PURIFICATION MARKET, BY DISTRIBUTION CHANNEL, 2020-2029 (USD MILLION)
TABLE 369 EGYPT INDOOR AIR PURIFICATION MARKET, BY APPLICATION, 2020-2029 (USD MILLION)
TABLE 370 REST OF MIDDLE EAST & AFRICA INDOOR AIR PURIFICATION MARKET, BY PRODUCT, 2020-2029 (USD MILLION)
TABLE 371 SOUTH AMERICA INDOOR AIR PURIFICATION MARKET, BY COUNTRY, 2020-2029 (USD MILLION)
TABLE 372 SOUTH AMERICA INDOOR AIR PURIFICATION MARKET, BY PRODUCT, 2020-2029 (USD MILLION)
TABLE 373 SOUTH AMERICA INDOOR AIR PURIFICATION MARKET, BY CATEGORY, 2020-2029 (USD MILLION)
TABLE 374 SOUTH AMERICA INDOOR AIR PURIFICATION MARKET, BY TECHNOLOGY, 2020-2029 (USD MILLION)
TABLE 375 SOUTH AMERICA INDOOR AIR PURIFICATION MARKET, BY FUNCTION , 2020-2029 (USD MILLION)
TABLE 376 SOUTH AMERICA INDOOR AIR PURIFICATION MARKET, BY OUTER MATERIAL, 2020-2029 (USD MILLION)
TABLE 377 SOUTH AMERICA PLASTIC IN INDOOR AIR PURIFICATION MARKET, BY TYPE, 2020-2029 (USD MILLION)
TABLE 378 SOUTH AMERICA METAL IN INDOOR AIR PURIFICATION MARKET, BY TYPE, 2020-2029 (USD MILLION)
TABLE 379 SOUTH AMERICA INDOOR AIR PURIFICATION MARKET, BY PRICE RANGE, 2020-2029 (USD MILLION)
TABLE 380 SOUTH AMERICA INDOOR AIR PURIFICATION MARKET, BY DISTRIBUTION CHANNEL, 2020-2029 (USD MILLION)
TABLE 381 SOUTH AMERICA INDOOR AIR PURIFICATION MARKET, BY APPLICATION, 2020-2029 (USD MILLION)
TABLE 382 BRAZIL INDOOR AIR PURIFICATION MARKET, BY PRODUCT, 2020-2029 (USD MILLION)
TABLE 383 BRAZIL INDOOR AIR PURIFICATION MARKET, BY CATEGORY, 2020-2029 (USD MILLION)
TABLE 384 BRAZIL INDOOR AIR PURIFICATION MARKET, BY TECHNOLOGY, 2020-2029 (USD MILLION)
TABLE 385 BRAZIL INDOOR AIR PURIFICATION MARKET, BY FUNCTION , 2020-2029 (USD MILLION)
TABLE 386 BRAZIL INDOOR AIR PURIFICATION MARKET, BY OUTER MATERIAL, 2020-2029 (USD MILLION)
TABLE 387 BRAZIL PLASTIC IN INDOOR AIR PURIFICATION MARKET, BY TYPE, 2020-2029 (USD MILLION)
TABLE 388 BRAZIL METAL IN INDOOR AIR PURIFICATION MARKET, BY TYPE, 2020-2029 (USD MILLION)
TABLE 389 BRAZIL INDOOR AIR PURIFICATION MARKET, BY PRICE RANGE, 2020-2029 (USD MILLION)
TABLE 390 BRAZIL INDOOR AIR PURIFICATION MARKET, BY DISTRIBUTION CHANNEL, 2020-2029 (USD MILLION)
TABLE 391 BRAZIL INDOOR AIR PURIFICATION MARKET, BY APPLICATION, 2020-2029 (USD MILLION)
TABLE 392 ARGENTINA INDOOR AIR PURIFICATION MARKET, BY PRODUCT, 2020-2029 (USD MILLION)
TABLE 393 ARGENTINA INDOOR AIR PURIFICATION MARKET, BY CATEGORY, 2020-2029 (USD MILLION)
TABLE 394 ARGENTINA INDOOR AIR PURIFICATION MARKET, BY TECHNOLOGY, 2020-2029 (USD MILLION)
TABLE 395 ARGENTINA INDOOR AIR PURIFICATION MARKET, BY FUNCTION , 2020-2029 (USD MILLION)
TABLE 396 ARGENTINA INDOOR AIR PURIFICATION MARKET, BY OUTER MATERIAL, 2020-2029 (USD MILLION)
TABLE 397 ARGENTINA PLASTIC IN INDOOR AIR PURIFICATION MARKET, BY TYPE, 2020-2029 (USD MILLION)
TABLE 398 ARGENTINA METAL IN INDOOR AIR PURIFICATION MARKET, BY TYPE, 2020-2029 (USD MILLION)
TABLE 399 ARGENTINA INDOOR AIR PURIFICATION MARKET, BY PRICE RANGE, 2020-2029 (USD MILLION)
TABLE 400 ARGENTINA INDOOR AIR PURIFICATION MARKET, BY DISTRIBUTION CHANNEL, 2020-2029 (USD MILLION)
TABLE 401 ARGENTINA INDOOR AIR PURIFICATION MARKET, BY APPLICATION, 2020-2029 (USD MILLION)
TABLE 402 REST OF SOUTH AMERICA INDOOR AIR PURIFICATION MARKET, BY PRODUCT, 2020-2029 (USD MILLION)
Lista de figuras
FIGURE 1 GLOBAL INDOOR AIR PURIFICATION MARKET: SEGMENTATION
FIGURE 2 GLOBAL INDOOR AIR PURIFICATION MARKET: DATA TRIANGULATION
FIGURE 3 GLOBAL INDOOR AIR PURIFICATION MARKET: DROC ANALYSIS
FIGURE 4 GLOBAL INDOOR AIR PURIFICATION MARKET: GLOBAL VS REGIONAL MARKET ANALYSIS
FIGURE 5 GLOBAL INDOOR AIR PURIFICATION MARKET: COMPANY RESEARCH ANALYSIS
FIGURE 6 GLOBAL INDOOR AIR PURIFICATION MARKET: INTERVIEW DEMOGRAPHICS
FIGURE 7 GLOBAL INDOOR AIR PURIFICATION MARKET: DBMR MARKET POSITION GRID
FIGURE 8 GLOBAL INDOOR AIR PURIFICATION MARKET: VENDOR SHARE ANALYSIS
FIGURE 9 GLOBAL INDOOR AIR PURIFICATION MARKET: MARKET END-USER COVERAGE GRID
FIGURE 10 GLOBAL INDOOR AIR PURIFICATION MARKET: SEGMENTATION
FIGURE 11 ASIA-PACIFIC IS EXPECTED TO DOMINATE WHEREAS NORTH AMERICA IS THE FASTEST-GROWING REGION IN GLOBAL INDOOR AIR PURIFICATION MARKET IN THE FORECAST PERIOD OF 2022 TO 2029
FIGURE 12 NORTH-AMERICA IS THE FASTEST GROWING MARKET FOR GLOBAL INDOOR AIR PURIFICATION MARKET MANUFACTURERS IN THE FORECAST PERIOD OF 2022 TO 2029
FIGURE 13 INCREASING USE OF AIR PURIFIER TO CONTAIN AIRBORNE CONTAMINANTS IS EXPECTED TO BE KEY DRIVERS FOR GLOBAL INDOOR AIR PURIFICATION MARKET IN THE FORECAST PERIOD OF 2022 TO 2029
FIGURE 14 DUST COLLECTORS & VACUUMS IS EXPECTED TO ACCOUNT FOR THE LARGEST SHARE OF GLOBAL INDOOR AIR PURIFICATION MARKET IN 2022 TO 2029
FIGURE 15 DRIVERS, RESTRAINTS, OPPORTUNITIES, AND CHALLENGES OF THE GLOBAL INDOOR AIR PURIFICATION MARKET
FIGURE 16 GLOBAL INDOOR AIR PURIFICATION MARKET: BY PRODUCT, 2021
FIGURE 17 GLOBAL INDOOR AIR PURIFICATION MARKET: BY CATEGORY, 2021
FIGURE 18 GLOBAL INDOOR AIR PURIFICATION MARKET: BY FUNCTION, 2021
FIGURE 19 GLOBAL INDOOR AIR PURIFICATION MARKET: BY TECHNOLOGY, 2021
FIGURE 20 GLOBAL INDOOR AIR PURIFICATION MARKET: BY OUTER MATERIAL, 2021
FIGURE 21 GLOBAL INDOOR AIR PURIFICATION MARKET: BY PRICE RANGE, 2021
FIGURE 22 GLOBAL INDOOR AIR PURIFICATION MARKET: BY DISTRIBUTION CHANNEL, 2021
FIGURE 23 GLOBAL INDOOR AIR PURIFICATION MARKET: BY APPLICATION, 2021
FIGURE 24 GLOBAL INDOOR AIR PURIFICATION MARKET: SNAPSHOT (2021)
FIGURE 25 GLOBAL INDOOR AIR PURIFICATION MARKET: BY REGION (2021)
FIGURE 26 GLOBAL INDOOR AIR PURIFICATION MARKET: BY REGION (2022 & 2029)
FIGURE 27 GLOBAL INDOOR AIR PURIFICATION MARKET: BY REGION (2021 & 2029)
FIGURE 28 GLOBAL INDOOR AIR PURIFICATION MARKET: BY PRODUCT (2022- 2029)
FIGURE 29 ASIA-PACIFIC INDOOR AIR PURIFICATION MARKET: SNAPSHOT (2021)
FIGURE 30 ASIA-PACIFIC INDOOR AIR PURIFICATION MARKET: BY COUNTRY (2021)
FIGURE 31 ASIA-PACIFIC INDOOR AIR PURIFICATION MARKET: BY COUNTRY (2022 & 2029)
FIGURE 32 ASIA-PACIFIC INDOOR AIR PURIFICATION MARKET: BY COUNTRY (2021 & 2029)
FIGURE 33 ASIA-PACIFIC INDOOR AIR PURIFICATION MARKET: BY PRODUCT (2022-2029)
FIGURE 34 NORTH AMERICA INDOOR AIR PURIFICATION MARKET: SNAPSHOT (2021)
FIGURE 35 NORTH AMERICA INDOOR AIR PURIFICATION MARKET: BY COUNTRY (2021)
FIGURE 36 NORTH AMERICA INDOOR AIR PURIFICATION MARKET: BY COUNTRY (2022 & 2029)
FIGURE 37 NORTH AMERICA INDOOR AIR PURIFICATION MARKET: BY COUNTRY (2021 & 2029)
FIGURE 38 NORTH AMERICA INDOOR AIR PURIFICATION MARKET: BY PRODUCT (2022-2029)
FIGURE 39 EUROPE INDOOR AIR PURIFICATION MARKET: SNAPSHOT (2021)
FIGURE 40 EUROPE INDOOR AIR PURIFICATION MARKET: BY COUNTRY (2021)
FIGURE 41 EUROPE INDOOR AIR PURIFICATION MARKET: BY COUNTRY (2022 & 2029)
FIGURE 42 EUROPE INDOOR AIR PURIFICATION MARKET: BY COUNTRY (2021 & 2029)
FIGURE 43 EUROPE INDOOR AIR PURIFICATION MARKET: BY PRODUCT (2022-2029)
FIGURE 44 MIDDLE EAST & AFRICA INDOOR AIR PURIFICATION MARKET: SNAPSHOT (2021)
FIGURE 45 MIDDLE EAST & AFRICA INDOOR AIR PURIFICATION MARKET: BY COUNTRY (2021)
FIGURE 46 MIDDLE EAST & AFRICA INDOOR AIR PURIFICATION MARKET: BY COUNTRY (2022 & 2029)
FIGURE 47 MIDDLE EAST & AFRICA INDOOR AIR PURIFICATION MARKET: BY COUNTRY (2021 & 2029)
FIGURE 48 MIDDLE EAST & AFRICA INDOOR AIR PURIFICATION MARKET: BY PRODUCT (2022-2029)
FIGURE 49 SOUTH AMERICA INDOOR AIR PURIFICATION MARKET: SNAPSHOT (2021)
FIGURE 50 SOUTH AMERICA INDOOR AIR PURIFICATION MARKET: BY COUNTRY (2021)
FIGURE 51 SOUTH AMERICA INDOOR AIR PURIFICATION MARKET: BY COUNTRY (2022 & 2029)
FIGURE 52 SOUTH AMERICA INDOOR AIR PURIFICATION MARKET: BY COUNTRY (2021 & 2029)
FIGURE 53 SOUTH AMERICA INDOOR AIR PURIFICATION MARKET: BY PRODUCT (2022- 2029)
FIGURE 54 GLOBAL INDOOR AIR PURIFICATION MARKET: COMPANY SHARE 2021 (%)
FIGURE 55 EUROPE INDOOR AIR PURIFICATION MARKET: COMPANY SHARE 2021 (%)
FIGURE 56 NORTH AMERICA INDOOR AIR PURIFICATION MARKET: COMPANY SHARE 2021 (%)
FIGURE 57 ASIA-PACIFIC INDOOR AIR PURIFICATION MARKET: COMPANY SHARE 2021 (%)
Metodología de investigación
La recopilación de datos y el análisis del año base se realizan utilizando módulos de recopilación de datos con muestras de gran tamaño. La etapa incluye la obtención de información de mercado o datos relacionados a través de varias fuentes y estrategias. Incluye el examen y la planificación de todos los datos adquiridos del pasado con antelación. Asimismo, abarca el examen de las inconsistencias de información observadas en diferentes fuentes de información. Los datos de mercado se analizan y estiman utilizando modelos estadísticos y coherentes de mercado. Además, el análisis de la participación de mercado y el análisis de tendencias clave son los principales factores de éxito en el informe de mercado. Para obtener más información, solicite una llamada de un analista o envíe su consulta.
La metodología de investigación clave utilizada por el equipo de investigación de DBMR es la triangulación de datos, que implica la extracción de datos, el análisis del impacto de las variables de datos en el mercado y la validación primaria (experto en la industria). Los modelos de datos incluyen cuadrícula de posicionamiento de proveedores, análisis de línea de tiempo de mercado, descripción general y guía del mercado, cuadrícula de posicionamiento de la empresa, análisis de patentes, análisis de precios, análisis de participación de mercado de la empresa, estándares de medición, análisis global versus regional y de participación de proveedores. Para obtener más información sobre la metodología de investigación, envíe una consulta para hablar con nuestros expertos de la industria.
Personalización disponible
Data Bridge Market Research es líder en investigación formativa avanzada. Nos enorgullecemos de brindar servicios a nuestros clientes existentes y nuevos con datos y análisis que coinciden y se adaptan a sus objetivos. El informe se puede personalizar para incluir análisis de tendencias de precios de marcas objetivo, comprensión del mercado de países adicionales (solicite la lista de países), datos de resultados de ensayos clínicos, revisión de literatura, análisis de mercado renovado y base de productos. El análisis de mercado de competidores objetivo se puede analizar desde análisis basados en tecnología hasta estrategias de cartera de mercado. Podemos agregar tantos competidores sobre los que necesite datos en el formato y estilo de datos que esté buscando. Nuestro equipo de analistas también puede proporcionarle datos en archivos de Excel sin procesar, tablas dinámicas (libro de datos) o puede ayudarlo a crear presentaciones a partir de los conjuntos de datos disponibles en el informe.

