Mercado global de sistemas de imágenes hiperespectrales: tendencias de la industria y pronóstico hasta 2031

Solicitud de índiceSolicitud de índice Hable con el analistaHable con el analista Comprar ahoraComprar ahora Consultar antes de comprarConsultar antes Informe de muestra gratuitoInforme de muestra gratuito

Mercado global de sistemas de imágenes hiperespectrales: tendencias de la industria y pronóstico hasta 2031

  • Semiconductors and Electronics
  • Upcoming Report
  • Feb 2024
  • Global
  • 350 Páginas
  • Número de tablas: 220
  • Número de figuras: 60

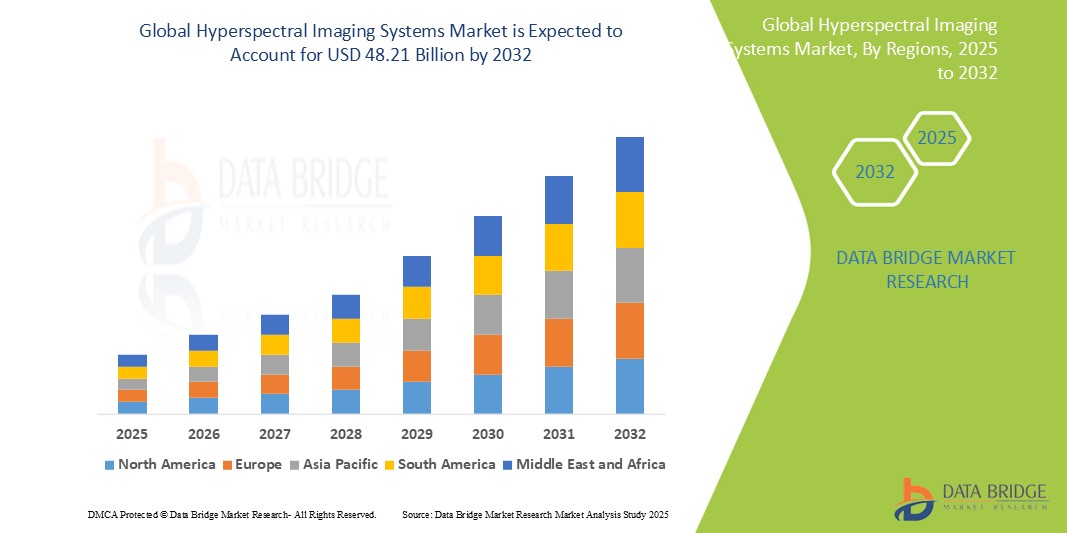
Global Hyperspectral Imaging Systems Market

Tamaño del mercado en miles de millones de dólares

Tasa de crecimiento anual compuesta (CAGR) :  % Diagram

Chart Image USD 6.90 Billion USD 32.68 Billion 2023 2030
Diagram Período de pronóstico
2024 –2030
Diagram Tamaño del mercado (año base)
USD 6.90 Billion
Diagram Tamaño del mercado (año de pronóstico)
USD 32.68 Billion
Diagram Tasa de crecimiento anual compuesta (CAGR)
%
Diagram Jugadoras de los principales mercados
  • Robert Bosch GmbH
  • Hanwha Group
  • Honeywell International
  • Schneider Electric
  • Axis Communications AB

>Mercado global de sistemas de imágenes hiperespectrales, por producto (cámaras, accesorios), técnicas de escaneo (escaneo espacial, escaneo espectral, sin escaneo, escaneo espacioespectral), tecnología (escoba de empuje, instantánea, software de gestión de video basado en analógico, software de gestión de video basado en IP, otros), rango (menos de 400 Nm, 400 Nm a 1700 Nm, más de 1700 Nm), aplicación (militar, detección remota, diagnóstico médico, visión artificial y clasificación óptica, otros): tendencias de la industria y pronóstico hasta 2031.

Hyperspectral Imaging Systems Market

Análisis y tamaño del mercado de sistemas de imágenes hiperespectrales

Los sistemas de imágenes hiperespectrales encuentran diversas aplicaciones en industrias como la agricultura, la atención médica y el monitoreo ambiental . Con capacidades avanzadas de análisis espectral, permiten la identificación precisa de materiales y sustancias, lo que ayuda en el control de calidad, la detección de enfermedades y la gestión de recursos. Su versatilidad ayuda al crecimiento del mercado de sistemas de imágenes hiperespectrales.

Data Bridge Market Research analiza que se espera que el mercado global de sistemas de imágenes hiperespectrales, que fue de USD 8.38 mil millones en 2023, alcance los USD 39.70 mil millones para 2031, creciendo a una CAGR del 21,46% durante el período de pronóstico de 2024 a 2031. Los segmentos de cámaras dominan con una creciente adopción de software como servicio entre los consumidores, asegurando la mayor participación de mercado. Además de los conocimientos sobre escenarios de mercado como valor de mercado, tasa de crecimiento, segmentación, cobertura geográfica y actores principales, los informes de mercado seleccionados por Data Bridge Market Research también incluyen un análisis experto en profundidad, producción y capacidad por empresa representada geográficamente, diseños de red de distribuidores y socios, análisis detallado y actualizado de tendencias de precios y análisis de déficit de la cadena de suministro y la demanda.

Alcance y segmentación del mercado de sistemas de imágenes hiperespectrales  

Métrica del informe

Detalles

Período de pronóstico

2024 a 2031

Año base

2023

Años históricos

2022 (Personalizable para 2016-2021)

Unidades cuantitativas

Ingresos en miles de millones de USD, volúmenes en unidades, precios en USD

Segmentos cubiertos

Producto (cámaras, accesorios), técnicas de escaneo (escaneo espacial, escaneo espectral, sin escaneo, escaneo espacioespectral), tecnología (escoba de empuje, instantánea, software de gestión de video basado en analógico, software de gestión de video basado en IP, otros), alcance (menos de 400 Nm, 400 Nm a 1700 Nm, más de 1700 Nm), aplicación (militar, detección remota, diagnóstico médico, visión artificial y clasificación óptica, otros)

Países cubiertos

EE. UU., Canadá y México en América del Norte, Alemania, Francia, Reino Unido, Países Bajos, Suiza, Bélgica, Rusia, Italia, España, Turquía, Resto de Europa en Europa, China, Japón, India, Corea del Sur, Singapur, Malasia, Australia, Tailandia, Indonesia, Filipinas, Resto de Asia-Pacífico (APAC) en Asia-Pacífico (APAC), Arabia Saudita, Emiratos Árabes Unidos, Sudáfrica, Egipto, Israel, Resto de Medio Oriente y África (MEA) como parte de Medio Oriente y África (MEA), Brasil, Argentina y Resto de América del Sur como parte de América del Sur

Actores del mercado cubiertos

Robert Bosch GmbH (Alemania), Hanwha Group (Corea del Sur), Honeywell International Inc. (EE. UU.), Schneider Electric (Francia), Axis Communications AB (Suecia), Johnson Controls (Irlanda), Hangzhou Hikvision Digital Technology Co., Ltd. (China), NetApp (EE. UU.), Dahua Technology USA Inc. (China), KEDACOM (China), Verint Systems Inc. (EE. UU.), LTIMindtree Limited (India), AxxonSoft (EE. UU.), eInfochips (EE. UU.), Avigilon Corporation (Canadá), Panasonic Corporation (Japón), Panopto (EE. UU.), Backstreet Surveillance (EE. UU.), Eagle Eye Solutions Group Plc. (EE. UU.), Arcules, Inc. (EE. UU.)

Oportunidades de mercado

  • Creciente adopción de tecnologías avanzadas para un análisis preciso
  • Crecimiento y expansión de la industria de servicios financieros

Definición de mercado

Los sistemas de imágenes hiperespectrales capturan y procesan imágenes en numerosas bandas espectrales, lo que permite el análisis detallado y la identificación de materiales. Se utilizan ampliamente en diversas industrias; mejoran el control de calidad, detectan contaminantes, ayudan en el procesamiento de alimentos y respaldan la exploración geológica, entre otras aplicaciones.

Dinámica del mercado global de sistemas de imágenes hiperespectrales

Conductores

  • Funciones de seguridad y vigilancia para detectar anomalías

Las crecientes preocupaciones en materia de seguridad impulsan la adopción de imágenes hiperespectrales en los ámbitos de vigilancia, control de fronteras y defensa. Su capacidad para detectar anomalías y discernir materiales fortalece el conocimiento de la situación, reforzando los esfuerzos para proteger la infraestructura vital y las fronteras nacionales, mejorando así las medidas de seguridad contra las amenazas emergentes y garantizando capacidades de vigilancia integrales.

  • Demanda creciente de diagnóstico temprano en la atención sanitaria

El sector sanitario ha experimentado un aumento de la demanda de sistemas de imágenes hiperespectrales, impulsado por su creciente papel en el diagnóstico médico. Estos sistemas, empleados para el análisis preciso de tejidos y la detección de enfermedades, ofrecen capacidades mejoradas para el diagnóstico temprano y la planificación del tratamiento, lo que contribuye significativamente a mejorar los resultados de los pacientes y a hacer avanzar el campo de la tecnología de imágenes médicas.

Oportunidades

  • Creciente adopción de tecnologías avanzadas para un análisis preciso

Los continuos avances tecnológicos, en particular la miniaturización y el procesamiento mejorado de datos, fortalecen la accesibilidad y la adopción de imágenes hiperespectrales. La integración con la inteligencia artificial y el aprendizaje automático amplifica aún más su eficacia, fomentando sinergias que permiten un análisis e interpretación precisos en diversas industrias, desde la atención médica hasta la agricultura y más allá, lo que impulsa su adopción generalizada y su utilidad.

  • Crecimiento y expansión de la industria de servicios financieros

El creciente sector bancario y de servicios financieros, en particular en las economías en desarrollo, ofrece amplias posibilidades de expansión del mercado. La tendencia actual hacia la digitalización amplifica las perspectivas de crecimiento y revela numerosas oportunidades dentro del mercado. A medida que los sectores financieros de todo el mundo adoptan la transformación digital, aumenta la demanda de soluciones innovadoras, lo que impulsa la evolución y la expansión de la industria.

Restricciones/Desafíos

  • Los altos costos conducen a menores tasas de adopción

La excesiva inversión inicial y los costos de mantenimiento continuo asociados con los sistemas de imágenes hiperespectrales actúan como importantes factores disuasorios, en particular para las pequeñas empresas. Esta carga financiera limita gravemente las tasas de adopción, lo que impide el crecimiento del mercado y la accesibilidad. En consecuencia, muchos usuarios potenciales no pueden permitirse el ingreso a este sector impulsado por la tecnología, lo que ahoga su potencial de mercado más amplio.

  • Complejidad en la comprensión de los sistemas de imágenes hiperespectrales

La complejidad de la interpretación de los datos hiperespectrales actúa como un importante factor disuasorio en el mercado. Sin la experiencia adecuada, los usuarios tienen dificultades para obtener información significativa, lo que limita la adopción de sistemas de imágenes hiperespectrales en diversas industrias. Este obstáculo obstaculiza el crecimiento del mercado, ya que los usuarios potenciales dudan en invertir en maquinaria que no pueden utilizar o comprender por completo.

Este informe sobre el mercado global de sistemas de imágenes hiperespectrales proporciona detalles de los nuevos desarrollos recientes, regulaciones comerciales, análisis de importación y exportación, análisis de producción, optimización de la cadena de valor, participación de mercado, impacto de los actores del mercado nacional y localizado, analiza las oportunidades en términos de bolsillos de ingresos emergentes, cambios en las regulaciones del mercado, análisis estratégico del crecimiento del mercado, tamaño del mercado, crecimientos del mercado de categorías, nichos de aplicación y dominio, aprobaciones de productos, lanzamientos de productos, expansiones geográficas, innovaciones tecnológicas en el mercado. Para obtener más información sobre la investigación de mercado global de sistemas de imágenes hiperespectrales para un informe de analista, nuestro equipo lo ayudará a tomar una decisión de mercado informada para lograr el crecimiento del mercado.

Impacto y situación actual del mercado ante la escasez de materias primas y retrasos en los envíos

Data Bridge Market Research ofrece un análisis de alto nivel del mercado y brinda información teniendo en cuenta el impacto y el entorno actual del mercado en relación con la escasez de materias primas y los retrasos en los envíos. Esto se traduce en la evaluación de posibilidades estratégicas, la creación de planes de acción efectivos y la asistencia a las empresas para tomar decisiones importantes.

Además del informe estándar, también ofrecemos un análisis en profundidad del nivel de adquisiciones a partir de retrasos de envío previstos, mapeo de distribuidores por región, análisis de productos básicos, análisis de producción, tendencias de mapeo de precios, abastecimiento, análisis del desempeño de categorías, soluciones de gestión de riesgos de la cadena de suministro, evaluación comparativa avanzada y otros servicios para adquisiciones y soporte estratégico.

Impacto esperado de la desaceleración económica en los precios y la disponibilidad de los productos

Cuando la actividad económica se desacelera, las industrias comienzan a sufrir. Los efectos previstos de la crisis económica sobre los precios y la accesibilidad de los productos se tienen en cuenta en los informes de conocimiento del mercado y los servicios de inteligencia que ofrece DBMR. Con esto, nuestros clientes pueden normalmente mantenerse un paso por delante de sus competidores, proyectar sus ventas e ingresos y estimar sus gastos de ganancias y pérdidas.

Acontecimientos recientes

  • En diciembre de 2023, SPECIM lanzó la cámara hiperespectral infrarroja de onda media FX50, que cubre el rango espectral de 2,7 a 5,3 μm. Con una resolución espacial de 640 píxeles, una resolución espectral de 35 nm, un tamaño de píxel de 30 μm y una velocidad de cuadro máxima de 377 fps, ofrece capacidades avanzadas para diversas aplicaciones.
  • En octubre de 2023, Axis Communications finalizó la venta de su subsidiaria Citilog a TagMaster, lo que fomenta las asociaciones entre Axis, Citilog y TagMaster en soluciones ferroviarias y de tráfico después de la adquisición y fortalece los esfuerzos de colaboración en el sector de la tecnología del transporte.
  • En mayo de 2021, Diaspective Vision lanzó TIVITA 2.0, una cámara de imágenes hiperespectrales. Entre sus características se incluyen imágenes sin contacto, no invasivas, sin riesgo de contaminación, radiación ionizante o agentes de contraste, lo que garantiza soluciones de imágenes seguras y precisas para diversas aplicaciones.
  • En abril de 2021, Headwall Photonics se unió al Consejo Asesor de Profesionales Industriales para IoT4Ag financiado por la NSF. En colaboración con el Centro de Investigación de Ingeniería de la NSF, los sensores hiperespectrales de Headwall integrados en sistemas UAV permiten modelos basados ​​en datos para analizar la fisiología de las plantas, las propiedades del suelo y los factores ambientales, lo que mejora los avances en la tecnología agrícola.

Alcance del mercado global de sistemas de imágenes hiperespectrales

El mercado global de sistemas de imágenes hiperespectrales está segmentado en función del producto, las técnicas de escaneo, el alcance, la tecnología y la aplicación. El crecimiento entre estos segmentos le ayudará a analizar los segmentos de crecimiento reducidos en las industrias y brindará a los usuarios una valiosa descripción general del mercado y conocimientos del mercado para ayudarlos a tomar decisiones estratégicas para identificar las principales aplicaciones del mercado.

Producto

  • Cámaras
  • Accesorios

 Técnicas de escaneo

  • Escaneo espacial
  • Escaneo espectral
  • Sin escaneo
  • Escaneo espacioespectral

 Tecnología

  • Escoba de empuje
  • Instantánea
  • Software de gestión de vídeo basado en analógico
  • Software de gestión de vídeo basado en IP
  • Otros

 Rango

  • Menos de 400 Nm
  • 400 Nm a 1700 Nm
  • Más de 1700 Nm

 Solicitud

  • Militar
  • Detección remota
  • Agricultura
  • Ambiental
  • Diagnóstico médico
  • Visión artificial
  • Clasificación óptica
  • Otros

Análisis y perspectivas regionales del mercado global de sistemas de imágenes hiperespectrales

Se analiza el mercado global de sistemas de imágenes hiperespectrales y se proporcionan información y tendencias del tamaño del mercado por producto, técnicas de escaneo, rango, tecnología y aplicación como se menciona anteriormente.

Los países cubiertos en el informe de mercado global de sistemas de imágenes hiperespectrales son EE. UU., Canadá y México en América del Norte, Alemania, Francia, Reino Unido, Países Bajos, Suiza, Bélgica, Rusia, Italia, España, Turquía, Resto de Europa en Europa, China, Japón, India, Corea del Sur, Singapur, Malasia, Australia, Tailandia, Indonesia, Filipinas, Resto de Asia-Pacífico (APAC) en Asia-Pacífico (APAC), Arabia Saudita, Emiratos Árabes Unidos, Sudáfrica, Egipto, Israel, Resto de Medio Oriente y África (MEA) como parte de Medio Oriente y África (MEA), Brasil, Argentina y Resto de América del Sur como parte de América del Sur.

Se espera que América del Norte domine el mercado de sistemas de imágenes hiperespectrales, impulsada por una mayor conciencia y adopción de la teledetección aérea y la investigación. La presión regulatoria y una concentración de actores dominantes y locales en los EE. UU. están a punto de impulsar un crecimiento significativo del mercado.

Europa ocupa la posición del segundo mercado más grande en el mercado de sistemas de imágenes hiperespectrales, y Alemania lidera el crecimiento de la región debido a los avances significativos en la investigación y el desarrollo de imágenes espectroscópicas.

En Asia-Pacífico se ha producido un gran crecimiento del mercado de sistemas de imágenes hiperespectrales, especialmente en China, impulsado por una mayor inversión en proyectos de teledetección. Este aumento refleja el creciente reconocimiento de las capacidades de la tecnología hiperespectral y sus crecientes aplicaciones en diversos sectores de la región.

La sección de países del informe también proporciona factores de impacto de mercado individuales y cambios en la regulación en el mercado a nivel nacional que afectan las tendencias actuales y futuras del mercado. Los puntos de datos como el análisis de la cadena de valor aguas abajo y aguas arriba, las tendencias técnicas y el análisis de las cinco fuerzas de Porter, los estudios de casos son algunos de los indicadores utilizados para pronosticar el escenario del mercado para países individuales. Además, la presencia y disponibilidad de marcas globales y sus desafíos enfrentados debido a la competencia grande o escasa de las marcas locales y nacionales, el impacto de los aranceles nacionales y las rutas comerciales se consideran al proporcionar un análisis de pronóstico de los datos del país.

Análisis del panorama competitivo y de la cuota de mercado global de los sistemas de imágenes hiperespectrales

The global hyperspectral imaging systems market competitive landscape provides details by competitor. Details included are company overview, company financials, revenue generated, market potential, investment in research and development, new market initiatives, global presence, production sites and facilities, production capacities, company strengths and weaknesses, product launch, product width and breadth, application dominance. The above data points provided are only related to the companies' focus related to global hyperspectral imaging systems market.

Some of the major players operating in the global hyperspectral imaging systems market are:

  • Robert Bosch GmbH (Germany)
  • Hanwha Group. (South Korea)
  • Honeywell International Inc. (U.S.)
  • Schneider Electric (France)
  • Axis Communications AB (Sweden)
  • Johnson Controls (Ireland)
  • Hangzhou Hikvision Digital Technology Co., Ltd. (China)
  • NetApp (U.S.)
  • Dahua Technology USA Inc. (China)
  • KEDACOM (China)
  • Verint Systems Inc. (U.S.)
  • LTIMindtree Limited (India)
  • AxxonSoft. (U.S.)
  • eInfochips (U.S.)
  • Panasonic Corporation (Japan)
  • Panopto (U.S.)
  • Backstreet Surveillance (U.S.)
  • Eagle Eye Solutions Group Plc. (U.S.)
  • Arcules, Inc. (U.S.)

SKU-

Obtenga acceso en línea al informe sobre la primera nube de inteligencia de mercado del mundo

  • Panel de análisis de datos interactivo
  • Panel de análisis de empresas para oportunidades con alto potencial de crecimiento
  • Acceso de analista de investigación para personalización y consultas
  • Análisis de la competencia con panel interactivo
  • Últimas noticias, actualizaciones y análisis de tendencias
  • Aproveche el poder del análisis de referencia para un seguimiento integral de la competencia
Solicitud de demostración

Tabla de contenido

  1. introduction
    1. OBJECTIVES OF THE STUDY
    2. MARKET DEFINITION
    3. OVERVIEW OF GLOBAL HYPERSPECTRAL IMAGING SYSTEMS MARKET
    4. Currency and Pricing
    5. LIMITATIONS
    6. MARKETS COVERED
  2. MARKET SEGMENTATION
    1. MARKETS COVERED
    2. geographicAL scope
    3. years considered for the study
    4. DBMR TRIPOD DATA VALIDATION MODEL
    5. primary interviews with key opinion leaders
    6. DBMR MARKET POSITION GRID
    7. vendor share analysis
    8. Multivariate Modeling
    9. product timeline curve
    10. MARKET APPLICATION COVERAGE GRID
    11. secondary sourcEs
    12. assumptions
  3. EXECUTIVE SUMMARY
  4. premium insights
  5. market overview
    1. drivers
      1. Increasing investments in satellites incorporated with HIS
      2. SurgE IN utilization of airborne hyperspectral imaging solutions
      3. RisE IN use of hyperspectral imaging for agriculture sector
      4. Surge in applications of HSI for environmental monitoring
      5. Grow IN industrial applications of hyperspectral imaging
    2. RESTRAINTS
      1. High complexity and data storage issues
      2. High cost associated with the use of hyperspectral imaging
    3. opportunities
      1. Surging advancements of hyperspectral imaging for remote sensing
      2. RisE IN developments toward the adoption of portable hyperspectral cameras
      3. Increasing medical applications of hSI
      4. Leveraging AI in hyperspectral imaging for technological developments
    4. challenges
      1. Lack of skilled professionals
      2. Lack of labelled data for HSI incorporating AI and Ml algorithms
  6. COVID-19 IMPACT ON HYPERSPECTRAL IMAGING SYSTEMS MARKET
    1. ANALYSIS ON IMPACT OF COVID-19 ON THE MARKET
    2. AFTERMATH OF COVID-19 AND GOVERNMENT INITIATIVES TO BOOST THE MARKET
    3. STRATEGIC DECISIONS FOR MANUFACTURERS AFTER COVID-19 TO GAIN COMPETITIVE MARKET SHARE
    4. IMPACT ON PRICE
    5. IMPACT ON DEMAND
    6. IMPACT ON SUPPLY CHAIN
    7. CONCLUSION
  7. GLOBAL HYPERSPECTRAL IMAGING SYSTEMS Market, BY PRODUCT
    1. overview
    2. cameras
    3. accessories
  8. global HYPERSPECTRAL IMAGING SYSTEMS MARKET, BY SCANNING TECHNIQUES
    1. overview
    2. spatial scanning
    3. spectral scanning
    4. spatio-spectral scanning
    5. non-scanning
  9. global HYPERSPECTRAL IMAGING SYSTEMS MARKET, BY range
    1. overview
    2. 400 nm to 1700 nm
    3. more than 1,700 nm
    4. less than 400 nm
  10. global HYPERSPECTRAL IMAGING SYSTEMS MARKET, BY technology
    1. overview
    2. pushbroom (line scanning)
    3. whiskbroom (point scanning)
    4. snapshot (single shot)
    5. others
  11. global HYPERSPECTRAL IMAGING SYSTEMS MARKET, BY application
    1. overview
    2. remote sensing
      1. cameras
      2. accessories
    3. military surveillance
      1. cameras
      2. accessories
    4. machine vision & optical sorting
      1. cameras
      2. accessories
    5. life sciences & medical diagnostics
      1. cameras
      2. accessories
    6. agriculture
      1. cameras
      2. accessories
    7. food processing
      1. cameras
      2. accessories
    8. environmental monitoring
      1. cameras
      2. accessories
    9. mining/mineral mapping
      1. cameras
      2. accessories
    10. minerology
      1. cameras
      2. accessories
    11. civil engineering
      1. cameras
      2. accessories
    12. Other Applications
      1. cameras
      2. accessories
  12. global HYPERSPECTRAL IMAGING SYSTEMS MARKET, BY speed
    1. overview
    2. UP TO 20 MHz
    3. 20 to 40 MHz
    4. MORE THAN 40 MHz
  13. global HYPERSPECTRAL IMAGING SYSTEMS MARKET, BY number of taps
    1. overview
    2. one tap
    3. two tap
  14. Global hyperspectral imaging systems market, by region
    1. overview
    2. North america
      1. u.S.
      2. canada
      3. mexico
    3. Europe
      1. Germany
      2. U.K.
      3. France
      4. Italy
      5. Russia
      6. Spain
      7. Turkey
      8. Belgium
      9. Netherlands
      10. Switzerland
      11. Rest of Europe
    4. Asia Pacific
      1. China
      2. JAPAN
      3. India
      4. South Korea
      5. Australia
      6. Indonesia
      7. Singapore
      8. Malaysia
      9. Thailand
      10. Philippines
      11. Rest of Asia-Pacific
    5. MIDDLE EAST & aFRICA
      1. U.A.E.
      2. SAUDI ARABIA
      3. ISRAEL
      4. EGYPT
      5. SOUTH AFRICA
      6. REST OF MIDDLE EAST & AFRICA
    6. SOUTH AMERICA
      1. BRAZIL
      2. ARGENTINA
      3. COLOMBIA
      4. CHILE
      5. PERU
      6. ECUADOR
      7. VENEZUELA
      8. REST OF SOUTH AMERICA
  15. GLOBAL Hyperspectral imaging systems market: COMPANY landscape
    1. company share analysis: GLOBAL
    2. company share analysis: NORTH AMERICA
    3. company share analysis: EUROPE
    4. company share analysis: Asia-pacific
  16. swot analysis
  17. COMPANY PROFILE
    1. Imec
      1. COMPANY SNAPSHOT
      2. company share analysis
      3. PRODUCT PORTFOLIO
      4. RECENT DEVELOPMENTS
    2. CORNING INCORPORATED
      1. COMPANY SNAPSHOT
      2. REVENUE ANALYSIS
      3. company share analysis
      4. PRODUCT PORTFOLIO
      5. RECENT DEVELOPMENTS
    3. HORIBA, LTD
      1. COMPANY SNAPSHOT
      2. REVENUE ANALYSIS
      3. company share analysis
      4. PRODUCT PORTFOLIO
      5. RECENT DEVELOPMENTS
    4. HAMAMATSU PHOTONICS K.K.
      1. COMPANY SNAPSHOT
      2. REVENUE ANALYSIS
      3. company share analysis
      4. PRODUCT PORTFOLIO
      5. RECENT DEVELOPMENT
    5. THORLABS, INC.
      1. COMPANY SNAPSHOT
      2. company share analysis
      3. PRODUCT PORTFOLIO
      4. RECENT DEVELOPMENTS
    6. BAYSPEC, INC.
      1. COMPANY SNAPSHOT
      2. PRODUCT PORTFOLIO
      3. RECCENT DEVELOPMENTS
    7. Brandywine Photonics LLc
      1. COMPANY snapshot
      2. Product PORTFOLIO
      3. recent DEVELOPMENT
    8. CHEMIMAGE CORPORATION
      1. COMPANY SNAPSHOT
      2. PRODUCT PORTFOLIO
      3. RECENT DEVELOPMENTS
    9. CUBERT GMBH
      1. COMPANY SNAPSHOT
      2. PRODUCT PORTFOLIO
      3. RECENT DEVELOPMENTS
    10. CYTOVIVA, INC.
      1. COMPANY SNAPSHOT
      2. PRODUCT PORTFOLIO
      3. RECENT DEVELOPMENTS
    11. DIASPECTIVE VISION
      1. COMPANY SNAPSHOT
      2. PRODUCT PORTFOLIO
      3. RECENT DEVELOPMENTS
    12. HEADWALL PHOTONICS, INC.
      1. COMPANY SNAPSHOT
      2. PRODUCT PORTFOLIO
      3. RECENT DEVELOPMENTS
    13. hinalea imaging
      1. COMPANY snapshot
      2. product PORTFOLIO
      3. recent DEVELOPMENT
    14. hypermed imaging, inc.
      1. COMPANY snapshot
      2. product PORTFOLIO
      3. recent DEVELOPMENTS
    15. INNO-SPEC GMBH
      1. COMPANY SNAPSHOT
      2. PRODUCT PORTFOLIO
      3. RECENT DEVELOPMENT
    16. lla instruments Gmbh & Co. kg
      1. COMPANY snapshot
      2. product PORTFOLIO
      3. recent DEVELOPMENTS
    17. NORSK ELECTRO OPTIK AS
      1. COMPANY SNAPSHOT
      2. PRODUCT PORTFOLIO
      3. RECENT DEVELOPMENTS
    18. PHOTON ETC. INC
      1. COMPANY SNAPSHOT
      2. PRODUCT PORTFOLIO
      3. RECENT DEVELOPMENTS
    19. PHYSICAL SCIENCES INC.
      1. COMPANY SNAPSHOT
      2. PRODUCT PORTFOLIO
      3. RECENT DEVELOPMENT
    20. RAPTOR PHOTONICS
      1. COMPANY SNAPSHOT
      2. PRODUCT PORTFOLIO
      3. RECENT DEVELOPMENTS
    21. RESONON INC.
      1. COMPANY SNAPSHOT
      2. PRODUCT PORTFOLIO
      3. RECENT DEVELOPMENTS
    22. SPECIM, SPECTRAL IMAGING LTD.
      1. COMPANY SNAPSHOT
      2. PRODUCT PORTFOLIO
      3. RECENT DEVELOPMENTS
    23. STEMMER IMAGING AG
      1. COMPANY SNAPSHOT
      2. REVENUE ANALYSIS
      3. PRODUCT PORTFOLIO
      4. RECENT DEVELOPMENT
    24. Surface Optics Corporation
      1. company snapshot
      2. Product PORTFOLIO
      3. recent DEVELOPMENTS
    25. TELEDYNE DIGITAL IMAGING INC. (A SUBSIDIARY OF TELEDYNE TECHNOLOGIES INCORPORATED)
      1. COMPANY SNAPSHOT
      2. REVENUE ANALYSIS
      3. PRODUCT PORTFOLIO
      4. RECENT DEVELOPMENTS
    26. TELOPS
      1. COMPANY snapshot
      2. Product PORTFOLIO
      3. recent DEVELOPMENTS
    27. XIMEA GROUP
      1. COMPANY SNAPSHOT
      2. PRODUCT PORTFOLIO
      3. RECENT DEVELOPMENTS
  18. questionnaire
  19. related reports

Lista de Tablas

TABLE 1 Global HYPERSPECTRAL IMAGING SYSTEMS Market, By product, 2019-2028 (USD Million)

TABLE 2 Global cameras in HYPERSPECTRAL IMAGING SYSTEMS Market, By Region, 2019-2028 (USD Million)

TABLE 3 Global accessories in HYPERSPECTRAL IMAGING SYSTEMS Market, By Region, 2019-2028 (USD Million)

TABLE 4 Global HYPERSPECTRAL IMAGING SYSTEMS Market, By sanning Techniques, 2019-2028 (USD Million)

TABLE 5 Global spatial scanning in HYPERSPECTRAL IMAGING SYSTEMS Market, By Region ,2019-2028 (USD Million)

TABLE 6 Global spectral scanning in HYPERSPECTRAL IMAGING SYSTEMS Market, By Region, 2019-2028 (USD Million)

TABLE 7 Global spatiospectral scanning in HYPERSPECTRAL IMAGING SYSTEMS Market, By Region, 2019-2028 (USD Million)

TABLE 8 Global non-scanning in HYPERSPECTRAL IMAGING SYSTEMS Market, By Region, 2019-2028, (USD Million)

TABLE 9 Global HYPERSPECTRAL IMAGING SYSTEMS Market, By range, 2019-2028 (USD Million)

TABLE 10 Global 400 nm to 1700 nm in HYPERSPECTRAL IMAGING SYSTEMS Market, By Region, 2019-2028 (USD Million)

TABLE 11 Global more than 1,700 nm in HYPERSPECTRAL IMAGING SYSTEMS Market, By Region, 2019-2028 (USD Million)

TABLE 12 Global Less than 400 nm in HYPERSPECTRAL IMAGING SYSTEMS Market, By Region, 2019-2028 (USD Million)

TABLE 13 Global HYPERSPECTRAL IMAGING SYSTEMS Market, By technology, 2019-2028 (USD Million)

TABLE 14 Global pushbroom (line scanning) in HYPERSPECTRAL IMAGING SYSTEMS Market, By Region, 2019-2028 (USD Million)

TABLE 15 Global whiskbroom (point scanning) in HYPERSPECTRAL IMAGING SYSTEMS Market, By Region, 2019-2028 (USD Million)

TABLE 16 Global snapshot (single shot) in HYPERSPECTRAL IMAGING SYSTEMS Market, By Region, 2019-2028 (USD Million)

TABLE 17 Global Others in HYPERSPECTRAL IMAGING SYSTEMS Market, By Region, 2019-2028 (USD Million)

TABLE 18 Global HYPERSPECTRAL IMAGING SYSTEMS Market, By application, 2019-2028 (USD Million)

TABLE 19 Global remote sensing in HYPERSPECTRAL IMAGING SYSTEMS Market, By Region, 2019-2028 (USD Million)

TABLE 20 Global remote sensing in HYPERSPECTRAL IMAGING SYSTEMS Market, By product, 2019-2028 (USD Million)

TABLE 21 Global military surveillance in HYPERSPECTRAL IMAGING SYSTEMS Market, By Region, 2019-2028 (USD Million)

TABLE 22 Global Military surveillance in HYPERSPECTRAL IMAGING SYSTEMS Market, By product, 2019-2028 (USD Million)

TABLE 23 Global machine vision & optical sorting in HYPERSPECTRAL IMAGING SYSTEMS Market, By Region, 2019-2028 (USD Million)

TABLE 24 Global Machine vision & optical sorting in HYPERSPECTRAL IMAGING SYSTEMS Market, By product, 2019-2028 (USD Million)

TABLE 25 Global life sciences & medical diagnostics in HYPERSPECTRAL IMAGING SYSTEMS Market, By Region, 2019-2028 (USD Million)

TABLE 26 Global Life sciences & medical diagnostics in HYPERSPECTRAL IMAGING SYSTEMS Market, By product, 2019-2028 (USD Million)

TABLE 27 Global agriculture in HYPERSPECTRAL IMAGING SYSTEMS Market, By Region, 2019-2028 (USD Million)

TABLE 28 Global Agriculture in HYPERSPECTRAL IMAGING SYSTEMS Market, By product, 2019-2028 (USD Million)

TABLE 29 Global food processing in HYPERSPECTRAL IMAGING SYSTEMS Market, By Region, 2019-2028 (USD Million)

TABLE 30 Global Food processing in HYPERSPECTRAL IMAGING SYSTEMS Market, By product, 2019-2028 (USD Million)

TABLE 31 Global environmental monitoring in HYPERSPECTRAL IMAGING SYSTEMS Market, By Region, 2019-202 (USD Million)

TABLE 32 Global Environmental monitoring in HYPERSPECTRAL IMAGING SYSTEMS Market, By product, 2019-2028 (USD Million)

TABLE 33 Global mining/mineral mapping in HYPERSPECTRAL IMAGING SYSTEMS Market, By Region, 2019-2028 (USD Million)

TABLE 34 Global Mining/mineral mapping in HYPERSPECTRAL IMAGING SYSTEMS Market, By product, 2019-2028 (USD Million)

TABLE 35 Global Minerology in HYPERSPECTRAL IMAGING SYSTEMS Market, By Region, 2019-2028 (USD Million)

TABLE 36 Global Minerology in HYPERSPECTRAL IMAGING SYSTEMS Market, By product, 2019-2028 (USD Million)

TABLE 37 Global civil engineering in HYPERSPECTRAL IMAGING SYSTEMS Market, By Region, 2019-2028 (USD Million)

TABLE 38 Global Civil engineering in HYPERSPECTRAL IMAGING SYSTEMS Market, By product, 2019-2028 (USD Million)

TABLE 39 Global Other Applications in HYPERSPECTRAL IMAGING SYSTEMS Market, By Region, 2019-2028 (USD Million)

TABLE 40 Global Other Applications in HYPERSPECTRAL IMAGING SYSTEMS Market, By product, 2019-2028 (USD Million)

TABLE 41 Global Hyperspectral imaging systems market, By rEGION, 2019-2028 (USD Million)

TABLE 42 NORTH AMERICA HYPERSPECTRAL IMAGING SYSTEMS MARKET, By Country, 2019-2028 (USD Million)

TABLE 43 North america Hyperspectral imaging systems market, By product, 2019-2028 (USD Million)

TABLE 44 North america Hyperspectral imaging systems market, By scanning techniques, 2019-2028 (USD Million)

TABLE 45 North america Hyperspectral imaging systems market, By range, 2019-2028 (USD Million)

TABLE 46 North america Hyperspectral imaging systems market, By technology, 2019-2028 (USD Million)

TABLE 47 North america Hyperspectral imaging systems market, By application, 2019-2028 (USD Million)

TABLE 48 North america remote sensing in Hyperspectral imaging systems market, By product, 2019-2028 (USD Million)

TABLE 49 North america Military Surveillance in Hyperspectral imaging systems market, By product, 2019-2028 (USD Million)

TABLE 50 North america Machine Vision & Optical Sorting in Hyperspectral imaging systems market, By product, 2019-2028 (USD Million)

TABLE 51 North america Life Sciences & Medical Diagnostics in Hyperspectral imaging systems market, By product, 2019-2028 (USD Million)

TABLE 52 North america Agriculture in Hyperspectral imaging systems market, By product, 2019-2028 (USD Million)

TABLE 53 North america Food Processing in Hyperspectral imaging systems market, By product, 2019-2028 (USD Million)

TABLE 54 North america Environmental Monitoring in Hyperspectral imaging systems market, By product, 2019-2028 (USD Million)

TABLE 55 North america Mining/Mineral Mapping in Hyperspectral imaging systems market, By product, 2019-2028 (USD Million)

TABLE 56 North america Minerology in Hyperspectral imaging systems market, By product, 2019-2028 (USD Million)

TABLE 57 North america Civil Engineering in Hyperspectral imaging systems market, By product, 2019-2028 (USD Million)

TABLE 58 North america other applications in Hyperspectral imaging systems market, By product, 2019-2028 (USD Million)

TABLE 59 U.S. Hyperspectral imaging systems market, By product, 2019-2028 (USD Million)

TABLE 60 U.S. Hyperspectral imaging systems market, By scanning techniques, 2019-2028 (USD Million)

TABLE 61 U.S. Hyperspectral imaging systems market, By range, 2019-2028 (USD Million)

TABLE 62 U.S. Hyperspectral imaging systems market, By technology, 2019-2028 (USD Million)

TABLE 63 U.S. Hyperspectral imaging systems market, By application, 2019-2028 (USD Million)

TABLE 64 U.S. remote sensing in Hyperspectral imaging systems market, By product, 2019-2028 (USD Million)

TABLE 65 U.S. Military Surveillance in Hyperspectral imaging systems market, By product, 2019-2028 (USD Million)

TABLE 66 U.S. Machine Vision & Optical Sorting in Hyperspectral imaging systems market, By product, 2019-2028 (USD Million)

TABLE 67 U.S. Life Sciences & Medical Diagnostics in Hyperspectral imaging systems market, By product, 2019-2028 (USD Million)

TABLE 68 U.S. Agriculture in Hyperspectral imaging systems market, By product, 2019-2028 (USD Million)

TABLE 69 U.S. Food Processing in Hyperspectral imaging systems market, By product, 2019-2028 (USD Million)

TABLE 70 U.S. Environmental Monitoring in Hyperspectral imaging systems market, By product, 2019-2028 (USD Million)

TABLE 71 U.S. Mining/Mineral Mapping in Hyperspectral imaging systems market, By product, 2019-2028 (USD Million)

TABLE 72 U.S. Minerology in Hyperspectral imaging systems market, By product, 2019-2028 (USD Million)

TABLE 73 U.S. Civil Engineering in Hyperspectral imaging systems market, By product, 2019-2028 (USD Million)

TABLE 74 U.S. other applications in Hyperspectral imaging systems market, By product, 2019-2028 (USD Million)

TABLE 75 CANADA Hyperspectral imaging systems market, By product, 2019-2028 (USD Million)

TABLE 76 CANADA Hyperspectral imaging systems market, By scanning techniques, 2019-2028 (USD Million)

TABLE 77 CANADA Hyperspectral imaging systems market, By range, 2019-2028 (USD Million)

TABLE 78 CANADA Hyperspectral imaging systems market, By technology, 2019-2028 (USD Million)

TABLE 79 CANADA Hyperspectral imaging systems market, By application, 2019-2028 (USD Million)

TABLE 80 CANADA remote sensing in Hyperspectral imaging systems market, By product, 2019-2028 (USD Million)

TABLE 81 CANADA Military Surveillance in Hyperspectral imaging systems market, By product, 2019-2028 (USD Million)

TABLE 82 CANADA Machine Vision & Optical Sorting in Hyperspectral imaging systems market, By product, 2019-2028 (USD Million)

TABLE 83 CANADA Life Sciences & Medical Diagnostics in Hyperspectral imaging systems market, By product, 2019-2028 (USD Million)

TABLE 84 CANADA Agriculture in Hyperspectral imaging systems market, By product, 2019-2028 (USD Million)

TABLE 85 CANADA Food Processing in Hyperspectral imaging systems market, By product, 2019-2028 (USD Million)

TABLE 86 CANADA Environmental Monitoring in Hyperspectral imaging systems market, By product, 2019-2028 (USD Million)

TABLE 87 CANADA Mining/Mineral Mapping in Hyperspectral imaging systems market, By product, 2019-2028 (USD Million)

TABLE 88 CANADA Minerology in Hyperspectral imaging systems market, By product, 2019-2028 (USD Million)

TABLE 89 CANADA Civil Engineering in Hyperspectral imaging systems market, By product, 2019-2028 (USD Million)

TABLE 90 CANADA other applications in Hyperspectral imaging systems market, By product, 2019-2028 (USD Million)

TABLE 91 MEXICO Hyperspectral imaging systems market, By product, 2019-2028 (USD Million)

TABLE 92 MEXICO Hyperspectral imaging systems market, By scanning techniques, 2019-2028 (USD Million)

TABLE 93 MEXICO Hyperspectral imaging systems market, By range, 2019-2028 (USD Million)

TABLE 94 MEXICO Hyperspectral imaging systems market, By technology, 2019-2028 (USD Million)

TABLE 95 MEXICO Hyperspectral imaging systems market, By application, 2019-2028 (USD Million)

TABLE 96 MEXICO remote sensing in Hyperspectral imaging systems market, By product, 2019-2028 (USD Million)

TABLE 97 MEXICO Military Surveillance in Hyperspectral imaging systems market, By product, 2019-2028 (USD Million)

TABLE 98 MEXICO Machine Vision & Optical Sorting in Hyperspectral imaging systems market, By product, 2019-2028 (USD Million)

TABLE 99 MEXICO Life Sciences & Medical Diagnostics in Hyperspectral imaging systems market, By product, 2019-2028 (USD Million)

TABLE 100 MEXICO Agriculture in Hyperspectral imaging systems market, By product, 2019-2028 (USD Million)

TABLE 101 MEXICO Food Processing in Hyperspectral imaging systems market, By product, 2019-2028 (USD Million)

TABLE 102 MEXICO Environmental Monitoring in Hyperspectral imaging systems market, By product, 2019-2028 (USD Million)

TABLE 103 MEXICO Mining/Mineral Mapping in Hyperspectral imaging systems market, By product, 2019-2028 (USD Million)

TABLE 104 MEXICO Minerology in Hyperspectral imaging systems market, By product, 2019-2028 (USD Million)

TABLE 105 MEXICO Civil Engineering in Hyperspectral imaging systems market, By product, 2019-2028 (USD Million)

TABLE 106 MEXICO other applications in Hyperspectral imaging systems market, By product, 2019-2028 (USD Million)

TABLE 107 EUROPE HYPERSPECTRAL IMAGING SYSTEMS MARKET, By Country, 2019-2028 (USD Million)

TABLE 108 Europe Hyperspectral imaging systems Market, By product, 2019-2028 (USD Million)

TABLE 109 Europe Hyperspectral imaging systems Market, By scanning techniques, 2019-2028 (USD Million)

TABLE 110 Europe Hyperspectral imaging systems Market, By range, 2019-2028 (USD Million)

TABLE 111 Europe Hyperspectral imaging systems Market, By technology, 2019-2028 (USD Million)

TABLE 112 Europe Hyperspectral imaging systems Market, By application, 2019-2028 (USD Million)

TABLE 113 Europe remote sensing in Hyperspectral imaging systems Market, By product, 2019-2028 (USD Million)

TABLE 114 Europe Military Surveillance in Hyperspectral imaging systems Market, By Product, 2019-2028 (USD Million)

TABLE 115 Europe Machine Vision & Optical Sorting in Hyperspectral imaging systems Market, By Product, 2019-2028 (USD Million)

TABLE 116 Europe Life Sciences & Medical Diagnostics in Hyperspectral imaging systems Market, By Product, 2019-2028 (USD Million)

TABLE 117 Europe Food Processing in Hyperspectral imaging systems Market, By Product, 2019-2028 (USD Million)

TABLE 118 Europe Agriculture in Hyperspectral imaging systems Market, By Product, 2019-2028 (USD Million)

TABLE 119 Europe Environmental Monitoring in Hyperspectral imaging systems Market, By Product, 2019-2028 (USD Million)

TABLE 120 Europe Mining/Mineral Mapping in Hyperspectral imaging systems Market, By Product, 2019-2028 (USD Million)

TABLE 121 Europe Mineralogy in Hyperspectral imaging systems Market, By Product, 2019-2028 (USD Million)

TABLE 122 Europe Civil Engineering in Hyperspectral imaging systems Market, By Product, 2019-2028 (USD Million)

TABLE 123 Europe Others in Hyperspectral imaging systems Market, By Product, 2019-2028 (USD Million)

TABLE 124 Germany Hyperspectral imaging systems Market, By product, 2019-2028 (USD Million)

TABLE 125 Germany Hyperspectral imaging systems Market, By scanning techniques, 2019-2028 (USD Million)

TABLE 126 Germany Hyperspectral imaging systems Market, By range, 2019-2028 (USD Million)

TABLE 127 Germany Hyperspectral imaging systems Market, By technology, 2019-2028 (USD Million)

TABLE 128 Germany Hyperspectral imaging systems Market, By application, 2019-2028 (USD Million)

TABLE 129 Germany remote sensing in Hyperspectral imaging systems Market, By product, 2019-2028 (USD Million)

TABLE 130 Germany Military SURVEILLANCE IN Hyperspectral imaging systems Market, By Product, 2019-2028 (USD Million)

TABLE 131 Germany Machine Vision & Optical Sorting in Hyperspectral imaging systems Market, By Product, 2019-2028 (USD Million)

TABLE 132 Germany Life Sciences & Medical Diagnostics in Hyperspectral imaging systems Market, By Product, 2019-2028 (USD Million)

TABLE 133 Germany Food Processing in Hyperspectral imaging systems Market, By Product, 2019-2028 (USD Million)

TABLE 134 Germany Agriculture in Hyperspectral imaging systems Market, By Product, 2019-2028 (USD Million)

TABLE 135 Germany Environmental Monitoring in Hyperspectral imaging systems Market, By Product, 2019-2028 (USD Million)

TABLE 136 Germany Mining/Mineral Mapping in Hyperspectral imaging systems Market, By Product, 2019-2028 (USD Million)

TABLE 137 Germany Mineralogy in Hyperspectral imaging systems Market, By Product, 2019-2028 (USD Million)

TABLE 138 Germany Civil Engineering in Hyperspectral imaging systems Market, By Product, 2019-2028 (USD Million)

TABLE 139 Germany Others in Hyperspectral imaging systems Market, By Product, 2019-2028 (USD Million)

TABLE 140 U.K. Hyperspectral imaging systems Market, By product, 2019-2028 (USD Million)

TABLE 141 U.K. Hyperspectral imaging systems Market, By scanning techniques, 2019-2028 (USD Million)

TABLE 142 U.K. Hyperspectral imaging systems Market, By range, 2019-2028 (USD Million)

TABLE 143 U.K. Hyperspectral imaging systems Market, By technology, 2019-2028 (USD Million)

TABLE 144 U.K. Hyperspectral imaging systems Market, By application, 2019-2028 (USD Million)

TABLE 145 U.K. remote sensing in Hyperspectral imaging systems Market, By product, 2019-2028 (USD Million)

TABLE 146 U.K. Military SURVEILLANCE IN Hyperspectral imaging systems Market, By Product, 2019-2028 (USD Million)

TABLE 147 U.K. Machine Vision & Optical Sorting in Hyperspectral imaging systems Market, By Product, 2019-2028 (USD Million)

TABLE 148 U.K. Life Sciences & Medical Diagnostics in Hyperspectral imaging systems Market, By Product, 2019-2028 (USD Million)

TABLE 149 U.K. Food Processing in Hyperspectral imaging systems Market, By Product, 2019-2028 (USD Million)

TABLE 150 U.K. Agriculture in Hyperspectral imaging systems Market, By Product, 2019-2028 (USD Million)

TABLE 151 U.K. Environmental Monitoring in Hyperspectral imaging systems Market, By Product, 2019-2028 (USD Million)

TABLE 152 U.K. Mining/Mineral Mapping in Hyperspectral imaging systems Market, By Product, 2019-2028 (USD Million)

TABLE 153 U.K. Mineralogy in Hyperspectral imaging systems Market, By Product, 2019-2028 (USD Million)

TABLE 154 U.K. Civil Engineering in Hyperspectral imaging systems Market, By Product, 2019-2028 (USD Million)

TABLE 155 U.K. Others in Hyperspectral imaging systems Market, By Product, 2019-2028 (USD Million)

TABLE 156 France Hyperspectral imaging systems Market, By product, 2019-2028 (USD Million)

TABLE 157 France Hyperspectral imaging systems Market, By scanning techniques, 2019-2028 (USD Million)

TABLE 158 France Hyperspectral imaging systems Market, By range, 2019-2028 (USD Million)

TABLE 159 France Hyperspectral imaging systems Market, By technology, 2019-2028 (USD Million)

TABLE 160 France Hyperspectral imaging systems Market, By application, 2019-2028 (USD Million)

TABLE 161 France remote sensing in Hyperspectral imaging systems Market, By product, 2019-2028 (USD Million)

TABLE 162 France Military SURVEILLANCE IN Hyperspectral imaging systems Market, By Product, 2019-2028 (USD Million)

TABLE 163 France Machine Vision & Optical Sorting in Hyperspectral imaging systems Market, By Product, 2019-2028 (USD Million)

TABLE 164 France Life Sciences & Medical Diagnostics in Hyperspectral imaging systems Market, By Product, 2019-2028 (USD Million)

TABLE 165 France Food Processing in Hyperspectral imaging systems Market, By Product, 2019-2028 (USD Million)

TABLE 166 France Agriculture in Hyperspectral imaging systems Market, By Product, 2019-2028 (USD Million)

TABLE 167 France Environmental Monitoring in Hyperspectral imaging systems Market, By Product, 2019-2028 (USD Million)

TABLE 168 France Mining/Mineral Mapping in Hyperspectral imaging systems Market, By Product, 2019-2028 (USD Million)

TABLE 169 France Mineralogy in Hyperspectral imaging systems Market, By Product, 2019-2028 (USD Million)

TABLE 170 France Civil Engineering in Hyperspectral imaging systems Market, By Product, 2019-2028 (USD Million)

TABLE 171 France Others in Hyperspectral imaging systems Market, By Product, 2019-2028 (USD Million)

TABLE 172 Italy Hyperspectral imaging systems Market, By product, 2019-2028 (USD Million)

TABLE 173 Italy Hyperspectral imaging systems Market, By scanning techniques, 2019-2028 (USD Million)

TABLE 174 Italy Hyperspectral imaging systems Market, By range, 2019-2028 (USD Million)

TABLE 175 Italy Hyperspectral imaging systems Market, By technology, 2019-2028 (USD Million)

TABLE 176 Italy Hyperspectral imaging systems Market, By application, 2019-2028 (USD Million)

TABLE 177 Italy remote sensing in Hyperspectral imaging systems Market, By product, 2019-2028 (USD Million)

TABLE 178 Italy Military SURVEILLANCE IN Hyperspectral imaging systems Market, By Product, 2019-2028 (USD Million)

TABLE 179 Italy Machine Vision & Optical Sorting in Hyperspectral imaging systems Market, By Product, 2019-2028 (USD Million)

TABLE 180 Italy Life Sciences & Medical Diagnostics in Hyperspectral imaging systems Market, By Product, 2019-2028 (USD Million)

TABLE 181 Italy Food Processing in Hyperspectral imaging systems Market, By Product, 2019-2028 (USD Million)

TABLE 182 Italy Agriculture in Hyperspectral imaging systems Market, By Product, 2019-2028 (USD Million)

TABLE 183 Italy Environmental Monitoring in Hyperspectral imaging systems Market, By Product, 2019-2028 (USD Million)

TABLE 184 Italy Mining/Mineral Mapping in Hyperspectral imaging systems Market, By Product, 2019-2028 (USD Million)

TABLE 185 Italy Mineralogy in Hyperspectral imaging systems Market, By Product, 2019-2028 (USD Million)

TABLE 186 Italy Civil Engineering in Hyperspectral imaging systems Market, By Product, 2019-2028 (USD Million)

TABLE 187 Italy Others in Hyperspectral imaging systems Market, By Product, 2019-2028 (USD Million)

TABLE 188 Russia Hyperspectral imaging systems Market, By product, 2019-2028 (USD Million)

TABLE 189 Russia Hyperspectral imaging systems Market, By scanning techniques, 2019-2028 (USD Million)

TABLE 190 Russia Hyperspectral imaging systems Market, By range, 2019-2028 (USD Million)

TABLE 191 Russia Hyperspectral imaging systems Market, By technology, 2019-2028 (USD Million)

TABLE 192 Russia Hyperspectral imaging systems Market, By application, 2019-2028 (USD Million)

TABLE 193 Russia remote sensing in Hyperspectral imaging systems Market, By product, 2019-2028 (USD Million)

TABLE 194 Russia Military SURVEILLANCE IN Hyperspectral imaging systems Market, By Product, 2019-2028 (USD Million)

TABLE 195 Russia Machine Vision & Optical Sorting in Hyperspectral imaging systems Market, By Product, 2019-2028 (USD Million)

TABLE 196 Russia Life Sciences & Medical Diagnostics in Hyperspectral imaging systems Market, By Product, 2019-2028 (USD Million)

TABLE 197 Russia Food Processing in Hyperspectral imaging systems Market, By Product, 2019-2028 (USD Million)

TABLE 198 Russia Agriculture in Hyperspectral imaging systems Market, By Product, 2019-2028 (USD Million)

TABLE 199 Russia Environmental Monitoring in Hyperspectral imaging systems Market, By Product, 2019-2028 (USD Million)

TABLE 200 Russia Mining/Mineral Mapping in Hyperspectral imaging systems Market, By Product, 2019-2028 (USD Million)

TABLE 201 Russia Mineralogy in Hyperspectral imaging systems Market, By Product, 2019-2028 (USD Million)

TABLE 202 Russia Civil Engineering in Hyperspectral imaging systems Market, By Product, 2019-2028 (USD Million)

TABLE 203 Russia Others in Hyperspectral imaging systems Market, By Product, 2019-2028 (USD Million)

TABLE 204 Spain Hyperspectral imaging systems Market, By product, 2019-2028 (USD Million)

TABLE 205 Spain Hyperspectral imaging systems Market, By scanning techniques, 2019-2028 (USD Million)

TABLE 206 Spain Hyperspectral imaging systems Market, By range, 2019-2028 (USD Million)

TABLE 207 Spain Hyperspectral imaging systems Market, By technology, 2019-2028 (USD Million)

TABLE 208 Spain Hyperspectral imaging systems Market, By application, 2019-2028 (USD Million)

TABLE 209 Spain remote sensing in Hyperspectral imaging systems Market, By product, 2019-2028 (USD Million)

TABLE 210 Spain Military SURVEILLANCE IN Hyperspectral imaging systems Market, By Product, 2019-2028 (USD Million)

TABLE 211 Spain Machine Vision & Optical Sorting in Hyperspectral imaging systems Market, By Product, 2019-2028 (USD Million)

TABLE 212 Spain Life Sciences & Medical Diagnostics in Hyperspectral imaging systems Market, By Product, 2019-2028 (USD Million)

TABLE 213 Spain Food Processing in Hyperspectral imaging systems Market, By Product, 2019-2028 (USD Million)

TABLE 214 Spain Agriculture in Hyperspectral imaging systems Market, By Product, 2019-2028 (USD Million)

TABLE 215 Spain Environmental Monitoring in Hyperspectral imaging systems Market, By Product, 2019-2028 (USD Million)

TABLE 216 Spain Mining/Mineral Mapping in Hyperspectral imaging systems Market, By Product, 2019-2028 (USD Million)

TABLE 217 Spain Mineralogy in Hyperspectral imaging systems Market, By Product, 2019-2028 (USD Million)

TABLE 218 Spain Civil Engineering in Hyperspectral imaging systems Market, By Product, 2019-2028 (USD Million)

TABLE 219 Spain Others in Hyperspectral imaging systems Market, By Product, 2019-2028 (USD Million)

TABLE 220 Turkey Hyperspectral imaging systems Market, By product, 2019-2028 (USD Million)

TABLE 221 Turkey Hyperspectral imaging systems Market, By scanning techniques, 2019-2028 (USD Million)

TABLE 222 Turkey Hyperspectral imaging systems Market, By range, 2019-2028 (USD Million)

TABLE 223 Turkey Hyperspectral imaging systems Market, By technology, 2019-2028 (USD Million)

TABLE 224 Turkey Hyperspectral imaging systems Market, By application, 2019-2028 (USD Million)

TABLE 225 Turkey remote sensing in Hyperspectral imaging systems Market, By product, 2019-2028 (USD Million)

TABLE 226 Turkey Military SURVEILLANCE IN Hyperspectral imaging systems Market, By Product, 2019-2028 (USD Million)

TABLE 227 Turkey Machine Vision & Optical Sorting in Hyperspectral imaging systems Market, By Product, 2019-2028 (USD Million)

TABLE 228 Turkey Life Sciences & Medical Diagnostics in Hyperspectral imaging systems Market, By Product, 2019-2028 (USD Million)

TABLE 229 Turkey Food Processing in Hyperspectral imaging systems Market, By Product, 2019-2028 (USD Million)

TABLE 230 Turkey Agriculture in Hyperspectral imaging systems Market, By Product, 2019-2028 (USD Million)

TABLE 231 Turkey Environmental Monitoring in Hyperspectral imaging systems Market, By Product, 2019-2028 (USD Million)

TABLE 232 Turkey Mining/Mineral Mapping in Hyperspectral imaging systems Market, By Product, 2019-2028 (USD Million)

TABLE 233 Turkey Mineralogy in Hyperspectral imaging systems Market, By Product, 2019-2028 (USD Million)

TABLE 234 Turkey Civil Engineering in Hyperspectral imaging systems Market, By Product, 2019-2028 (USD Million)

TABLE 235 Turkey Others in Hyperspectral imaging systems Market, By Product, 2019-2028 (USD Million)

TABLE 236 Belgium Hyperspectral imaging systems Market, By product, 2019-2028 (USD Million)

TABLE 237 Belgium Hyperspectral imaging systems Market, By scanning techniques, 2019-2028 (USD Million)

TABLE 238 Belgium Hyperspectral imaging systems Market, By range, 2019-2028 (USD Million)

TABLE 239 Belgium Hyperspectral imaging systems Market, By technology, 2019-2028 (USD Million)

TABLE 240 Belgium Hyperspectral imaging systems Market, By application, 2019-2028 (USD Million)

TABLE 241 Belgium remote sensing in Hyperspectral imaging systems Market, By product, 2019-2028 (USD Million)

TABLE 242 Belgium Military SURVEILLANCE IN Hyperspectral imaging systems Market, By Product, 2019-2028 (USD Million)

TABLE 243 Belgium Machine Vision & Optical Sorting in Hyperspectral imaging systems Market, By Product, 2019-2028 (USD Million)

TABLE 244 Belgium Life Sciences & Medical Diagnostics in Hyperspectral imaging systems Market, By Product, 2019-2028 (USD Million)

TABLE 245 Belgium Food Processing in Hyperspectral imaging systems Market, By Product, 2019-2028 (USD Million)

TABLE 246 Belgium Agriculture in Hyperspectral imaging systems Market, By Product, 2019-2028 (USD Million)

TABLE 247 Belgium Environmental Monitoring in Hyperspectral imaging systems Market, By Product, 2019-2028 (USD Million)

TABLE 248 Belgium Mining/Mineral Mapping in Hyperspectral imaging systems Market, By Product, 2019-2028 (USD Million)

TABLE 249 Belgium Mineralogy in Hyperspectral imaging systems Market, By Product, 2019-2028 (USD Million)

TABLE 250 Belgium Civil Engineering in Hyperspectral imaging systems Market, By Product, 2019-2028 (USD Million)

TABLE 251 Belgium Others in Hyperspectral imaging systems Market, By Product, 2019-2028 (USD Million)

TABLE 252 Netherlands Hyperspectral imaging systems Market, By product, 2019-2028 (USD Million)

TABLE 253 Netherlands Hyperspectral imaging systems Market, By scanning techniques, 2019-2028 (USD Million)

TABLE 254 Netherlands Hyperspectral imaging systems Market, By range, 2019-2028 (USD Million)

TABLE 255 Netherlands Hyperspectral imaging systems Market, By technology, 2019-2028 (USD Million)

TABLE 256 Netherlands Hyperspectral imaging systems Market, By application, 2019-2028 (USD Million)

TABLE 257 Netherlands remote sensing in Hyperspectral imaging systems Market, By product, 2019-2028 (USD Million)

TABLE 258 Netherlands Military SURVEILLANCE IN Hyperspectral imaging systems Market, By Product, 2019-2028 (USD Million)

TABLE 259 Netherlands Machine Vision & Optical Sorting in Hyperspectral imaging systems Market, By Product, 2019-2028 (USD Million)

TABLE 260 Netherlands Life Sciences & Medical Diagnostics in Hyperspectral imaging systems Market, By Product, 2019-2028 (USD Million)

TABLE 261 Netherlands Food Processing in Hyperspectral imaging systems Market, By Product, 2019-2028 (USD Million)

TABLE 262 Netherlands Agriculture in Hyperspectral imaging systems Market, By Product, 2019-2028 (USD Million)

TABLE 263 Netherlands Environmental Monitoring in Hyperspectral imaging systems Market, By Product, 2019-2028 (USD Million)

TABLE 264 Netherlands Mining/Mineral Mapping in Hyperspectral imaging systems Market, By Product, 2019-2028 (USD Million)

TABLE 265 Netherlands Mineralogy in Hyperspectral imaging systems Market, By Product, 2019-2028 (USD Million)

TABLE 266 Netherlands Civil Engineering in Hyperspectral imaging systems Market, By Product, 2019-2028 (USD Million)

TABLE 267 Netherlands Others in Hyperspectral imaging systems Market, By Product, 2019-2028 (USD Million)

TABLE 268 Switzerland Hyperspectral imaging systems Market, By product, 2019-2028 (USD Million)

TABLE 269 Switzerland Hyperspectral imaging systems Market, By scanning techniques, 2019-2028 (USD Million)

TABLE 270 Switzerland Hyperspectral imaging systems Market, By range, 2019-2028 (USD Million)

TABLE 271 Switzerland Hyperspectral imaging systems Market, By technology, 2019-2028 (USD Million)

TABLE 272 Switzerland Hyperspectral imaging systems Market, By application, 2019-2028 (USD Million)

TABLE 273 Switzerland remote sensing in Hyperspectral imaging systems Market, By product, 2019-2028 (USD Million)

TABLE 274 Switzerland Military SURVEILLANCE IN Hyperspectral imaging systems Market, By Product, 2019-2028 (USD Million)

TABLE 275 Switzerland Machine Vision & Optical Sorting in Hyperspectral imaging systems Market, By Product, 2019-2028 (USD Million)

TABLE 276 Switzerland Life Sciences & Medical Diagnostics in Hyperspectral imaging systems Market, By Product, 2019-2028 (USD Million)

TABLE 277 Switzerland Food Processing in Hyperspectral imaging systems Market, By Product, 2019-2028 (USD Million)

TABLE 278 Switzerland Agriculture in Hyperspectral imaging systems Market, By Product, 2019-2028 (USD Million)

TABLE 279 Switzerland Environmental Monitoring in Hyperspectral imaging systems Market, By Product, 2019-2028 (USD Million)

TABLE 280 Switzerland Mining/Mineral Mapping in Hyperspectral imaging systems Market, By Product, 2019-2028 (USD Million)

TABLE 281 Switzerland Mineralogy in Hyperspectral imaging systems Market, By Product, 2019-2028 (USD Million)

TABLE 282 Switzerland Civil Engineering in Hyperspectral imaging systems Market, By Product, 2019-2028 (USD Million)

TABLE 283 Switzerland Others in Hyperspectral imaging systems Market, By Product, 2019-2028 (USD Million)

TABLE 284 Rest of Europe Hyperspectral imaging systems Market, By product, 2019-2028 (USD Million)

TABLE 285 ASIA-PACIFIC HYPERSPECTRAL IMAGING SYSTEMS MARKET, By Country, 2019-2028 (USD Million)

TABLE 286 Asia PacificHyperspectral imaging systems market, By product, 2019-2028 (USD Million)

TABLE 287 Asia PacificHyperspectral imaging systems market, By scanning techniques, 2019-2028 (USD Million)

TABLE 288 Asia PacificHyperspectral imaging systems market, By range, 2019-2028 (USD Million)

TABLE 289 ASIA-PACIFIC Hyperspectral imaging systems market, By technology, 2019-2028 (USD Million)

TABLE 290 ASIA-PACIFIC Hyperspectral imaging systems market, By application, 2019-2028 (USD Million)

TABLE 291 ASIA-PACIFIC remote sensing in Hyperspectral imaging systems market, By product, 2019-2028 (USD Million)

TABLE 292 Asia PacificMilitary Surveillance in Hyperspectral imaging systems market, By product, 2019-2028 (USD Million)

TABLE 293 Asia PacificMachine Vision & Optical Sorting in Hyperspectral imaging systems market, By product, 2019-2028 (USD Million)

TABLE 294 Asia PacificLife Sciences & Medical Diagnosticsin Hyperspectral imaging systems market, By product, 2019-2028 (USD Million)

TABLE 295 ASIA-PACIFIC Agriculturein Hyperspectral imaging systems market, By product, 2019-2028 (USD Million)

TABLE 296 ASIA-PACIFIC Food Processing in Hyperspectral imaging systems market, By product, 2019-2028 (USD Million)

TABLE 297 Asia PacificEnvironmental Monitoringin Hyperspectral imaging systems market, By product, 2019-2028 (USD Million)

TABLE 298 Asia PacificMining/Mineral Mappingin Hyperspectral imaging systems market, By product, 2019-2028 (USD Million)

TABLE 299 Asia PacificMineralogy in Hyperspectral imaging systems market, By product, 2019-2028 (USD Million)

TABLE 300 Asia PacificCivil Engineering in Hyperspectral imaging systems market, By product, 2019-2028 (USD Million)

TABLE 301 ASIA-PACIFIC other applications in Hyperspectral imaging systems market, By product, 2019-2028 (USD Million)

TABLE 302 CHINA Hyperspectral imaging systems market, By product, 2019-2028 (USD Million)

TABLE 303 CHINA Hyperspectral imaging systems market, By scanning techniques, 2019-2028 (USD Million)

TABLE 304 China Hyperspectral imaging systems market, By range, 2019-2028 (USD Million)

TABLE 305 China Hyperspectral imaging systems market, By technology, 2019-2028 (USD Million)

TABLE 306 China Hyperspectral imaging systems market, By application, 2019-2028 (USD Million)

TABLE 307 CHINA remote sensing in Hyperspectral imaging systems market, By product, 2019-2028 (USD Million)

TABLE 308 CHINA Military Surveillance in Hyperspectral imaging systems market, By product, 2019-2028 (USD Million)

TABLE 309 CHINA Machine Vision & Optical Sorting in Hyperspectral imaging systems market, By product, 2019-2028 (USD Million)

TABLE 310 CHINA Life Sciences & Medical Diagnostics in Hyperspectral imaging systems market, By product, 2019-2028 (USD Million)

TABLE 311 CHINA Agriculture in Hyperspectral imaging systems market, By product, 2019-2028 (USD Million)

TABLE 312 CHINA Food Processing in Hyperspectral imaging systems market, By product, 2019-2028 (USD Million)

TABLE 313 CHINA Environmental Monitoring in Hyperspectral imaging systems market, By product, 2019-2028 (USD Million)

TABLE 314 CHINA Mining/Mineral Mapping in Hyperspectral imaging systems market, By product, 2019-2028 (USD Million)

TABLE 315 CHINA Mineralogy in Hyperspectral imaging systems market, By product, 2019-2028 (USD Million)

TABLE 316 CHINA Civil Engineering in Hyperspectral imaging systems market, By product, 2019-2028 (USD Million)

TABLE 317 CHINA other applications in Hyperspectral imaging systems market, By product, 2019-2028 (USD Million)

TABLE 318 JAPAN Hyperspectral imaging systems market, By product, 2019-2028 (USD Million)

TABLE 319 JAPAN Hyperspectral imaging systems market, By scanning techniques, 2019-2028 (USD Million)

TABLE 320 Japan Hyperspectral imaging systems market, By range, 2019-2028 (USD Million)

TABLE 321 Japan Hyperspectral imaging systems market, By technology, 2019-2028 (USD Million)

TABLE 322 Japan Hyperspectral imaging systems market, By application, 2019-2028 (USD Million)

TABLE 323 JAPAN remote sensing in Hyperspectral imaging systems market, By product, 2019-2028 (USD Million)

TABLE 324 JAPAN Military Surveillance in Hyperspectral imaging systems market, By product, 2019-2028 (USD Million)

TABLE 325 JAPAN Machine Vision & Optical Sorting in Hyperspectral imaging systems market, By product, 2019-2028 (USD Million)

TABLE 326 JAPAN Life Sciences & Medical Diagnostics in Hyperspectral imaging systems market, By product, 2019-2028 (USD Million)

TABLE 327 JAPAN Agriculture in Hyperspectral imaging systems market, By product, 2019-2028 (USD Million)

TABLE 328 JAPAN Food Processing in Hyperspectral imaging systems market, By product, 2019-2028 (USD Million)

TABLE 329 JAPAN Environmental Monitoring in Hyperspectral imaging systems market, By product, 2019-2028 (USD Million)

TABLE 330 JAPAN Mining/Mineral Mapping in Hyperspectral imaging systems market, By product, 2019-2028 (USD Million)

TABLE 331 JAPAN Mineralogy in Hyperspectral imaging systems market, By product, 2019-2028 (USD Million)

TABLE 332 JAPAN Civil Engineering in Hyperspectral imaging systems market, By product, 2019-2028 (USD Million)

TABLE 333 JAPAN other applications in Hyperspectral imaging systems market, By product, 2019-2028 (USD Million)

TABLE 334 INDIA Hyperspectral imaging systems market, By product, 2019-2028 (USD Million)

TABLE 335 INDIA Hyperspectral imaging systems market, By scanning techniques, 2019-2028 (USD Million)

TABLE 336 India Hyperspectral imaging systems market, By range, 2019-2028 (USD Million)

TABLE 337 India Hyperspectral imaging systems market, By technology, 2019-2028 (USD Million)

TABLE 338 India Hyperspectral imaging systems market, By application, 2019-2028 (USD Million)

TABLE 339 INDIA remote sensing in Hyperspectral imaging systems market, By product, 2019-2028 (USD Million)

TABLE 340 INDIA Military Surveillance in Hyperspectral imaging systems market, By product, 2019-2028 (USD Million)

TABLE 341 INDIA Machine Vision & Optical Sorting in Hyperspectral imaging systems market, By product, 2019-2028 (USD Million)

TABLE 342 INDIA Life Sciences & Medical Diagnostics in Hyperspectral imaging systems market, By product, 2019-2028 (USD Million)

TABLE 343 INDIA Agriculture in Hyperspectral imaging systems market, By product, 2019-2028 (USD Million)

TABLE 344 INDIA Food Processing in Hyperspectral imaging systems market, By product, 2019-2028 (USD Million)

TABLE 345 INDIA Environmental Monitoring in Hyperspectral imaging systems market, By product, 2019-2028 (USD Million)

TABLE 346 INDIA Mining/Mineral Mapping in Hyperspectral imaging systems market, By product, 2019-2028 (USD Million)

TABLE 347 INDIA Mineralogy in Hyperspectral imaging systems market, By product, 2019-2028 (USD Million)

TABLE 348 INDIA Civil Engineering in Hyperspectral imaging systems market, By product, 2019-2028 (USD Million)

TABLE 349 INDIA other applications in Hyperspectral imaging systems market, By product, 2019-2028 (USD Million)

TABLE 350 SOUTH KOREA Hyperspectral imaging systems market, By product, 2019-2028 (USD Million)

TABLE 351 SOUTH KOREA Hyperspectral imaging systems market, By scanning techniques, 2019-2028 (USD Million)

TABLE 352 South Korea Hyperspectral imaging systems market, By range, 2019-2028 (USD Million)

TABLE 353 South Korea Hyperspectral imaging systems market, By technology, 2019-2028 (USD Million)

TABLE 354 South Korea Hyperspectral imaging systems market, By application, 2019-2028 (USD Million)

TABLE 355 SOUTH KOREA remote sensing in Hyperspectral imaging systems market, By product, 2019-2028 (USD Million)

TABLE 356 SOUTH KOREA Military Surveillance in Hyperspectral imaging systems market, By product, 2019-2028 (USD Million)

TABLE 357 SOUTH KOREA Machine Vision & Optical Sorting in Hyperspectral imaging systems market, By product, 2019-2028 (USD Million)

TABLE 358 SOUTH KOREA Life Sciences & Medical Diagnostics in Hyperspectral imaging systems market, By product, 2019-2028 (USD Million)

TABLE 359 SOUTH KOREA Agriculture in Hyperspectral imaging systems market, By product, 2019-2028 (USD Million)

TABLE 360 SOUTH KOREA Food Processing in Hyperspectral imaging systems market, By product, 2019-2028 (USD Million)

TABLE 361 SOUTH KOREA Environmental Monitoring in Hyperspectral imaging systems market, By product, 2019-2028 (USD Million)

TABLE 362 SOUTH KOREA Mining/Mineral Mapping in Hyperspectral imaging systems market, By product, 2019-2028 (USD Million)

TABLE 363 SOUTH KOREA Mineralogy in Hyperspectral imaging systems market, By product, 2019-2028 (USD Million)

TABLE 364 SOUTH KOREA Civil Engineering in Hyperspectral imaging systems market, By product, 2019-2028 (USD Million)

TABLE 365 SOUTH KOREA other applications in Hyperspectral imaging systems market, By product, 2019-2028 (USD Million)

TABLE 366 AUSTRALIA Hyperspectral imaging systems market, By product, 2019-2028 (USD Million)

TABLE 367 AUSTRALIA Hyperspectral imaging systems market, By scanning techniques, 2019-2028 (USD Million)

TABLE 368 Australia Hyperspectral imaging systems market, By range, 2019-2028 (USD Million)

TABLE 369 Australia Hyperspectral imaging systems market, By technology, 2019-2028 (USD Million)

TABLE 370 Australia Hyperspectral imaging systems market, By application, 2019-2028 (USD Million)

TABLE 371 AUSTRALIA remote sensing in Hyperspectral imaging systems market, By product, 2019-2028 (USD Million)

TABLE 372 AUSTRALIA Military Surveillance in Hyperspectral imaging systems market, By product, 2019-2028 (USD Million)

TABLE 373 AUSTRALIA Machine Vision & Optical Sorting in Hyperspectral imaging systems market, By product, 2019-2028 (USD Million)

TABLE 374 AUSTRALIA Life Sciences & Medical Diagnostics in Hyperspectral imaging systems market, By product, 2019-2028 (USD Million)

TABLE 375 AUSTRALIA Agriculture in Hyperspectral imaging systems market, By product, 2019-2028 (USD Million)

TABLE 376 AUSTRALIA Food Processing in Hyperspectral imaging systems market, By product, 2019-2028 (USD Million)

TABLE 377 AUSTRALIA Environmental Monitoring in Hyperspectral imaging systems market, By product, 2019-2028 (USD Million)

TABLE 378 AUSTRALIA Mining/Mineral Mapping in Hyperspectral imaging systems market, By product, 2019-2028 (USD Million)

TABLE 379 AUSTRALIA MINERALOGY IN Hyperspectral imaging systems market, By product, 2019-2028 (USD Million)

TABLE 380 AUSTRALIA Civil Engineering in Hyperspectral imaging systems market, By product, 2019-2028 (USD Million)

TABLE 381 AUSTRALIA other applications in Hyperspectral imaging systems market, By product, 2019-2028 (USD Million)

TABLE 382 INDONESIA Hyperspectral imaging systems market, By product, 2019-2028 (USD Million)

TABLE 383 INDONESIA Hyperspectral imaging systems market, By scanning techniques, 2019-2028 (USD Million)

TABLE 384 Indonesia Hyperspectral imaging systems market, By range, 2019-2028 (USD Million)

TABLE 385 Indonesia Hyperspectral imaging systems market, By technology, 2019-2028 (USD Million)

TABLE 386 Indonesia Hyperspectral imaging systems market, By application, 2019-2028 (USD Million)

TABLE 387 INDONESIA remote sensing in Hyperspectral imaging systems market, By product, 2019-2028 (USD Million)

TABLE 388 INDONESIA Military Surveillance in Hyperspectral imaging systems market, By product, 2019-2028 (USD Million)

TABLE 389 INDONESIA Machine Vision & Optical Sorting in Hyperspectral imaging systems market, By product, 2019-2028 (USD Million)

TABLE 390 INDONESIA Life Sciences & Medical Diagnostics in Hyperspectral imaging systems market, By product, 2019-2028 (USD Million)

TABLE 391 INDONESIA Agriculture in Hyperspectral imaging systems market, By product, 2019-2028 (USD Million)

TABLE 392 INDONESIA Food Processing in Hyperspectral imaging systems market, By product, 2019-2028 (USD Million)

TABLE 393 INDONESIA Environmental Monitoring in Hyperspectral imaging systems market, By product, 2019-2028 (USD Million)

TABLE 394 INDONESIA Mining/Mineral Mapping in Hyperspectral imaging systems market, By product, 2019-2028 (USD Million)

TABLE 395 INDONESIA Mineralogy in Hyperspectral imaging systems market, By product, 2019-2028 (USD Million)

TABLE 396 INDONESIA Civil Engineering in Hyperspectral imaging systems market, By product, 2019-2028 (USD Million)

TABLE 397 INDONESIA other applications in Hyperspectral imaging systems market, By product, 2019-2028 (USD Million)

TABLE 398 SINGAPORE Hyperspectral imaging systems market, By product, 2019-2028 (USD Million)

TABLE 399 SINGAPORE Hyperspectral imaging systems market, By scanning techniques, 2019-2028 (USD Million)

TABLE 400 Singapore Hyperspectral imaging systems market, By range, 2019-2028 (USD Million)

TABLE 401 Singapore Hyperspectral imaging systems market, By technology, 2019-2028 (USD Million)

TABLE 402 Singapore Hyperspectral imaging systems market, By application, 2019-2028 (USD Million)

TABLE 403 SINGAPORE remote sensing in Hyperspectral imaging systems market, By product, 2019-2028 (USD Million)

TABLE 404 SINGAPORE Military Surveillance in Hyperspectral imaging systems market, By product, 2019-2028 (USD Million)

TABLE 405 SINGAPORE Machine Vision & Optical Sorting in Hyperspectral imaging systems market, By product, 2019-2028 (USD Million)

TABLE 406 SINGAPORE Life Sciences & Medical Diagnostics in Hyperspectral imaging systems market, By product, 2019-2028 (USD Million)

TABLE 407 SINGAPORE Agriculture in Hyperspectral imaging systems market, By product, 2019-2028 (USD Million)

TABLE 408 SINGAPORE Food Processing in Hyperspectral imaging systems market, By product, 2019-2028 (USD Million)

TABLE 409 SINGAPORE Environmental Monitoring in Hyperspectral imaging systems market, By product, 2019-2028 (USD Million)

TABLE 410 SINGAPORE Mining/Mineral Mapping in Hyperspectral imaging systems market, By product, 2019-2028 (USD Million)

TABLE 411 SINGAPORE Mineralogy in Hyperspectral imaging systems market, By product, 2019-2028 (USD Million)

TABLE 412 SINGAPORE Civil Engineering in Hyperspectral imaging systems market, By product, 2019-2028 (USD Million)

TABLE 413 SINGAPORE other applications in Hyperspectral imaging systems market, By product, 2019-2028 (USD Million)

TABLE 414 MALAYSIA Hyperspectral imaging systems market, By product, 2019-2028 (USD Million)

TABLE 415 MALAYSIA Hyperspectral imaging systems market, By scanning techniques, 2019-2028 (USD Million)

TABLE 416 Malaysia Hyperspectral imaging systems market, By range, 2019-2028 (USD Million)

TABLE 417 Malaysia Hyperspectral imaging systems market, By technology, 2019-2028 (USD Million)

TABLE 418 Malaysia Hyperspectral imaging systems market, By application, 2019-2028 (USD Million)

TABLE 419 MALAYSIA remote sensing in Hyperspectral imaging systems market, By product, 2019-2028 (USD Million)

TABLE 420 MALAYSIA Military Surveillance in Hyperspectral imaging systems market, By product, 2019-2028 (USD Million)

TABLE 421 MALAYSIA Machine Vision & Optical Sorting in Hyperspectral imaging systems market, By product, 2019-2028 (USD Million)

TABLE 422 MALAYSIA Life Sciences & Medical Diagnostics in Hyperspectral imaging systems market, By product, 2019-2028 (USD Million)

TABLE 423 MALAYSIA Agriculture in Hyperspectral imaging systems market, By product, 2019-2028 (USD Million)

TABLE 424 MALAYSIA Food Processing in Hyperspectral imaging systems market, By product, 2019-2028 (USD Million)

TABLE 425 MALAYSIA Environmental Monitoring in Hyperspectral imaging systems market, By product, 2019-2028 (USD Million)

TABLE 426 MALAYSIA Mining/Mineral Mapping in Hyperspectral imaging systems market, By product, 2019-2028 (USD Million)

TABLE 427 MALAYSIA Mineralogy in Hyperspectral imaging systems market, By product, 2019-2028 (USD Million)

TABLE 428 MALAYSIA Civil Engineering in Hyperspectral imaging systems market, By product, 2019-2028 (USD Million)

TABLE 429 MALAYSIA other applications in Hyperspectral imaging systems market, By product, 2019-2028 (USD Million)

TABLE 430 THAILAND Hyperspectral imaging systems market, By product, 2019-2028 (USD Million)

TABLE 431 THAILAND Hyperspectral imaging systems market, By scanning techniques, 2019-2028 (USD Million)

TABLE 432 Thailand Hyperspectral imaging systems market, By range, 2019-2028 (USD Million)

TABLE 433 Thailand Hyperspectral imaging systems market, By technology, 2019-2028 (USD Million)

TABLE 434 Thailand Hyperspectral imaging systems market, By application, 2019-2028 (USD Million)

TABLE 435 THAILAND remote sensing in Hyperspectral imaging systems market, By product, 2019-2028 (USD Million)

TABLE 436 THAILAND Military Surveillance in Hyperspectral imaging systems market, By product, 2019-2028 (USD Million)

TABLE 437 THAILAND Machine Vision & Optical Sorting in Hyperspectral imaging systems market, By product, 2019-2028 (USD Million)

TABLE 438 THAILAND Life Sciences & Medical Diagnostics in Hyperspectral imaging systems market, By product, 2019-2028 (USD Million)

TABLE 439 THAILAND Agriculture in Hyperspectral imaging systems market, By product, 2019-2028 (USD Million)

TABLE 440 THAILAND Food Processing in Hyperspectral imaging systems market, By product, 2019-2028 (USD Million)

TABLE 441 THAILAND Environmental Monitoring in Hyperspectral imaging systems market, By product, 2019-2028 (USD Million)

TABLE 442 THAILAND Mining/Mineral Mapping in Hyperspectral imaging systems market, By product, 2019-2028 (USD Million)

TABLE 443 THAILAND Mineralogy in Hyperspectral imaging systems market, By product, 2019-2028 (USD Million)

TABLE 444 THAILAND Civil Engineering in Hyperspectral imaging systems market, By product, 2019-2028 (USD Million)

TABLE 445 THAILAND other applications in Hyperspectral imaging systems market, By product, 2019-2028 (USD Million)

TABLE 446 PHILIPPINES Hyperspectral imaging systems market, By product, 2019-2028 (USD Million)

TABLE 447 PHILIPPINES Hyperspectral imaging systems market, By scanning techniques, 2019-2028 (USD Million)

TABLE 448 Philippines Hyperspectral imaging systems market, By range, 2019-2028 (USD Million)

TABLE 449 Philippines Hyperspectral imaging systems market, By technology, 2019-2028 (USD Million)

TABLE 450 Philippines Hyperspectral imaging systems market, By application, 2019-2028 (USD Million)

TABLE 451 PHILIPPINES remote sensing in Hyperspectral imaging systems market, By product, 2019-2028 (USD Million)

TABLE 452 PHILIPPINES Military Surveillance in Hyperspectral imaging systems market, By product, 2019-2028 (USD Million)

TABLE 453 PHILIPPINES Machine Vision & Optical Sorting in Hyperspectral imaging systems market, By product, 2019-2028 (USD Million)

TABLE 454 PHILIPPINES Life Sciences & Medical Diagnostics in Hyperspectral imaging systems market, By product, 2019-2028 (USD Million)

TABLE 455 PHILIPPINES Agriculture in Hyperspectral imaging systems market, By product, 2019-2028 (USD Million)

TABLE 456 PHILIPPINES Food Processing in Hyperspectral imaging systems market, By product, 2019-2028 (USD Million)

TABLE 457 PHILIPPINES Environmental Monitoring in Hyperspectral imaging systems market, By product, 2019-2028 (USD Million)

TABLE 458 PHILIPPINES Mining/Mineral Mapping in Hyperspectral imaging systems market, By product, 2019-2028 (USD Million)

TABLE 459 PHILIPPINES Mineralogy in Hyperspectral imaging systems market, By product, 2019-2028 (USD Million)

TABLE 460 PHILIPPINES Civil Engineering in Hyperspectral imaging systems market, By product, 2019-2028 (USD Million)

TABLE 461 PHILIPPINES other applications in Hyperspectral imaging systems market, By product, 2019-2028 (USD Million)

TABLE 462 REST OF ASIA-PACIFIC Hyperspectral imaging systems market, By product, 2019-2028 (USD Million)

TABLE 463 MIDDLE EAST & AFRICA HYPERSPECTRAL IMAGING SYSTEMS MARKET, By Country, 2019-2028 (USD Million)

TABLE 464 MIDDLE EAST & AFRICA Hyperspectral imaging systems market, By product, 2019-2028 (USD Million)

TABLE 465 MIDDLE EAST & AFRICA Hyperspectral imaging systems market, By scanning techniques, 2019-2028 (USD Million)

TABLE 466 MIDDLE EAST & AFRICA Hyperspectral imaging systems market, By range, 2019-2028 (USD Million)

TABLE 467 MIDDLE EAST & AFRICA Hyperspectral imaging systems market, By technology, 2019-2028 (USD Million)

TABLE 468 MIDDLE EAST & AFRICA Hyperspectral imaging systems market, By application, 2019-2028 (USD Million)

TABLE 469 MIDDLE EAST & AFRICA remote sensing in Hyperspectral imaging systems market, By product, 2019-2028 (USD Million)

TABLE 470 MIDDLE EAST & AFRICA Military Surveillance in Hyperspectral imaging systems market, By product, 2019-2028 (USD Million)

TABLE 471 MIDDLE EAST & AFRICA Machine Vision & Optical Sorting in Hyperspectral imaging systems market, By product, 2019-2028 (USD Million)

TABLE 472 MIDDLE EAST & AFRICA Life Sciences & Medical Diagnostics in Hyperspectral imaging systems market, By product, 2019-2028 (USD Million)

TABLE 473 MIDDLE EAST & AFRICA Food Processing in Hyperspectral imaging systems market, By product, 2019-2028 (USD Million)

TABLE 474 MIDDLE EAST & AFRICA Agriculture in Hyperspectral imaging systems market, By product, 2019-2028 (USD Million)

TABLE 475 MIDDLE EAST & AFRICA Environmental Monitoring in Hyperspectral imaging systems market, By product, 2019-2028 (USD Million)

TABLE 476 MIDDLE EAST & AFRICA Mining/Mineral Mapping in Hyperspectral imaging systems market, By product, 2019-2028 (USD Million)

TABLE 477 MIDDLE EAST & AFRICA Minerology in Hyperspectral imaging systems market, By product, 2019-2028 (USD Million)

TABLE 478 MIDDLE EAST & AFRICA Civil Engineering in Hyperspectral imaging systems market, By product, 2019-2028 (USD Million)

TABLE 479 MIDDLE EAST & AFRICA other applications in Hyperspectral imaging systems market, By product, 2019-2028 (USD Million)

TABLE 480 U.A.E. Hyperspectral imaging systems market, By product, 2019-2028 (USD Million)

TABLE 481 U.A.E. Hyperspectral imaging systems market, By scanning techniques, 2019-2028 (USD Million)

TABLE 482 U.A.E. Hyperspectral imaging systems market, By range, 2019-2028 (USD Million)

TABLE 483 U.A.E. Hyperspectral imaging systems market, By technology, 2019-2028 (USD Million)

TABLE 484 U.A.E. Hyperspectral imaging systems market, By application, 2019-2028 (USD Million)

TABLE 485 U.A.E. remote sensing in Hyperspectral imaging systems market, By product, 2019-2028 (USD Million)

TABLE 486 U.A.E. Military Surveillance in Hyperspectral imaging systems market, By product, 2019-2028 (USD Million)

TABLE 487 U.A.E. Machine Vision & Optical Sorting in Hyperspectral imaging systems market, By product, 2019-2028 (USD Million)

TABLE 488 U.A.E. Life Sciences & Medical Diagnostics in Hyperspectral imaging systems market, By product, 2019-2028 (USD Million)

TABLE 489 U.A.E. Food Processing in Hyperspectral imaging systems market, By product, 2019-2028 (USD Million)

TABLE 490 U.A.E. Agriculture in Hyperspectral imaging systems market, By product, 2019-2028 (USD Million)

TABLE 491 U.A.E. Environmental Monitoring in Hyperspectral imaging systems market, By product, 2019-2028 (USD Million)

TABLE 492 U.A.E. Mining/Mineral Mapping in Hyperspectral imaging systems market, By product, 2019-2028 (USD Million)

TABLE 493 U.A.E. Minerology in Hyperspectral imaging systems market, By product, 2019-2028 (USD Million)

TABLE 494 U.A.E. Civil Engineering in Hyperspectral imaging systems market, By product, 2019-2028 (USD Million)

TABLE 495 U.A.E. other applications in Hyperspectral imaging systems market, By product, 2019-2028 (USD Million)

TABLE 496 SAUDI ARABIA Hyperspectral imaging systems market, By product, 2019-2028 (USD Million)

TABLE 497 SAUDI ARABIA Hyperspectral imaging systems market, By scanning techniques, 2019-2028 (USD Million)

TABLE 498 SAUDI ARABIA Hyperspectral imaging systems market, By range, 2019-2028 (USD Million)

TABLE 499 SAUDI ARABIA Hyperspectral imaging systems market, By technology, 2019-2028 (USD Million)

TABLE 500 SAUDI ARABIA Hyperspectral imaging systems market, By application, 2019-2028 (USD Million)

TABLE 501 SAUDI ARABIA remote sensing in Hyperspectral imaging systems market, By product, 2019-2028 (USD Million)

TABLE 502 SAUDI ARABIA Military Surveillance in Hyperspectral imaging systems market, By product, 2019-2028 (USD Million)

TABLE 503 SAUDI ARABIA Machine Vision & Optical Sorting in Hyperspectral imaging systems market, By product, 2019-2028 (USD Million)

TABLE 504 SAUDI ARABIA Life Sciences & Medical Diagnostics in Hyperspectral imaging systems market, By product, 2019-2028 (USD Million)

TABLE 505 SAUDI ARABIA Food Processing in Hyperspectral imaging systems market, By product, 2019-2028 (USD Million)

TABLE 506 SAUDI ARABIA. Agriculture in Hyperspectral imaging systems market, By product, 2019-2028 (USD Million)

TABLE 507 SAUDI ARABIA Environmental Monitoring in Hyperspectral imaging systems market, By product, 2019-2028 (USD Million)

TABLE 508 SAUDI ARABIA Mining/Mineral Mapping in Hyperspectral imaging systems market, By product, 2019-2028 (USD Million)

TABLE 509 SAUDI ARABIA Minerology in Hyperspectral imaging systems market, By product, 2019-2028 (USD Million)

TABLE 510 SAUDI ARABIA Civil Engineering in Hyperspectral imaging systems market, By product, 2019-2028 (USD Million)

TABLE 511 SAUDI ARABIA other applications in Hyperspectral imaging systems market, By product, 2019-2028 (USD Million)

TABLE 512 ISRAEL Hyperspectral imaging systems market, By product, 2019-2028 (USD Million)

TABLE 513 ISRAEL Hyperspectral imaging systems market, By scanning techniques, 2019-2028 (USD Million)

TABLE 514 ISRAEL Hyperspectral imaging systems market, By range, 2019-2028 (USD Million)

TABLE 515 ISRAEL Hyperspectral imaging systems market, By technology, 2019-2028 (USD Million)

TABLE 516 ISRAEL Hyperspectral imaging systems market, By application, 2019-2028 (USD Million)

TABLE 517 ISRAEL remote sensing in Hyperspectral imaging systems market, By product, 2019-2028 (USD Million)

TABLE 518 ISRAEL Military Surveillance in Hyperspectral imaging systems market, By product, 2019-2028 (USD Million)

TABLE 519 ISRAEL Machine Vision & Optical Sorting in Hyperspectral imaging systems market, By product, 2019-2028 (USD Million)

TABLE 520 ISRAEL Life Sciences & Medical Diagnostics in Hyperspectral imaging systems market, By product, 2019-2028 (USD Million)

TABLE 521 ISRAEL Food Processing in Hyperspectral imaging systems market, By product, 2019-2028 (USD Million)

TABLE 522 ISRAEL Agriculture in Hyperspectral imaging systems market, By product, 2019-2028 (USD Million)

TABLE 523 ISRAEL Environmental Monitoring in Hyperspectral imaging systems market, By product, 2019-2028 (USD Million)

TABLE 524 ISRAEL Mining/Mineral Mapping in Hyperspectral imaging systems market, By product, 2019-2028 (USD Million)

TABLE 525 ISRAEL Minerology in Hyperspectral imaging systems market, By product, 2019-2028 (USD Million)

TABLE 526 ISRAEL Civil Engineering in Hyperspectral imaging systems market, By product, 2019-2028 (USD Million)

TABLE 527 ISRAEL other applications in Hyperspectral imaging systems market, By product, 2019-2028 (USD Million)

TABLE 528 EGYPT Hyperspectral imaging systems market, By product, 2019-2028 (USD Million)

TABLE 529 EGYPT Hyperspectral imaging systems market, By scanning techniques, 2019-2028 (USD Million)

TABLE 530 EGYPT Hyperspectral imaging systems market, By range, 2019-2028 (USD Million)

TABLE 531 EGYPT Hyperspectral imaging systems market, By technology, 2019-2028 (USD Million)

TABLE 532 EGYPT Hyperspectral imaging systems market, By application, 2019-2028 (USD Million)

TABLE 533 EGYPT remote sensing in Hyperspectral imaging systems market, By product, 2019-2028 (USD Million)

TABLE 534 EGYPT Military Surveillance in Hyperspectral imaging systems market, By product, 2019-2028 (USD Million)

TABLE 535 EGYPT Machine Vision & Optical Sorting in Hyperspectral imaging systems market, By product, 2019-2028 (USD Million)

TABLE 536 EGYPT Life Sciences & Medical Diagnostics in Hyperspectral imaging systems market, By product, 2019-2028 (USD Million)

TABLE 537 EGYPT Food Processing in Hyperspectral imaging systems market, By product, 2019-2028 (USD Million)

TABLE 538 EGYPT Agriculture in Hyperspectral imaging systems market, By product, 2019-2028 (USD Million)

TABLE 539 EGYPT Environmental Monitoring in Hyperspectral imaging systems market, By product, 2019-2028 (USD Million)

TABLE 540 EGYPT Mining/Mineral Mapping in Hyperspectral imaging systems market, By product, 2019-2028 (USD Million)

TABLE 541 EGYPT Minerology in Hyperspectral imaging systems market, By product, 2019-2028 (USD Million)

TABLE 542 EGYPT Civil Engineering in Hyperspectral imaging systems market, By product, 2019-2028 (USD Million)

TABLE 543 EGYPT other applications in Hyperspectral imaging systems market, By product, 2019-2028 (USD Million)

TABLE 544 SOUTH AFRICA Hyperspectral imaging systems market, By product, 2019-2028 (USD Million)

TABLE 545 SOUTH AFRICA Hyperspectral imaging systems market, By scanning techniques, 2019-2028 (USD Million)

TABLE 546 SOUTH AFRICA Hyperspectral imaging systems market, By range, 2019-2028 (USD Million)

TABLE 547 SOUTH AFRICA Hyperspectral imaging systems market, By technology, 2019-2028 (USD Million)

TABLE 548 SOUTH AFRICA Hyperspectral imaging systems market, By application, 2019-2028 (USD Million)

TABLE 549 SOUTH AFRICA remote sensing in Hyperspectral imaging systems market, By product, 2019-2028 (USD Million)

TABLE 550 SOUTH AFRICA Military Surveillance in Hyperspectral imaging systems market, By product, 2019-2028 (USD Million)

TABLE 551 SOUTH AFRICA Machine Vision & Optical Sorting in Hyperspectral imaging systems market, By product, 2019-2028 (USD Million)

TABLE 552 SOUTH AFRICA Life Sciences & Medical Diagnostics in Hyperspectral imaging systems market, By product, 2019-2028 (USD Million)

TABLE 553 SOUTH AFRICA Food Processing in Hyperspectral imaging systems market, By product, 2019-2028 (USD Million)

TABLE 554 SOUTH AFRICA Agriculture in Hyperspectral imaging systems market, By product, 2019-2028 (USD Million)

TABLE 555 SOUTH AFRICA Environmental Monitoring in Hyperspectral imaging systems market, By product, 2019-2028 (USD Million)

TABLE 556 SOUTH AFRICA Mining/Mineral Mapping in Hyperspectral imaging systems market, By product, 2019-2028 (USD Million)

TABLE 557 SOUTH AFRICA Minerology in Hyperspectral imaging systems market, By product, 2019-2028 (USD Million)

TABLE 558 SOUTH AFRICA Civil Engineering in Hyperspectral imaging systems market, By product, 2019-2028 (USD Million)

TABLE 559 SOUTH AFRICA other applications in Hyperspectral imaging systems market, By product, 2019-2028 (USD Million)

TABLE 560 REST OF MIDDLE EAST & AFRICA Hyperspectral imaging systems market, By product, 2019-2028 (USD Million)

TABLE 561 SOUTH AMERICA HYPERSPECTRAL IMAGING SYSTEMS MARKET, By Country, 2019-2028 (USD Million)

TABLE 562 SOUTH AMERICA Hyperspectral imaging systems market, By product, 2019-2028 (USD Million)

TABLE 563 SOUTH AMERICA Hyperspectral imaging systems market, By scanning techniques, 2019-2028 (USD Million)

TABLE 564 SOUTH AMERICA Hyperspectral imaging systems market, By range, 2019-2028 (USD Million)

TABLE 565 SOUTH AMERICA Hyperspectral imaging systems market, By technology, 2019-2028 (USD Million)

TABLE 566 SOUTH AMERICA Hyperspectral imaging systems market, By application, 2019-2028 (USD Million)

TABLE 567 SOUTH AMERICA remote sensing in Hyperspectral imaging systems market, By product, 2019-2028 (USD Million)

TABLE 568 SOUTH AMERICA Military Surveillance in Hyperspectral imaging systems market, By product, 2019-2028 (USD Million)

TABLE 569 SOUTH AMERICA Machine Vision & Optical Sorting in Hyperspectral imaging systems market, By product, 2019-2028 (USD Million)

TABLE 570 SOUTH AMERICA Life Sciences & Medical Diagnostics in Hyperspectral imaging systems market, By product, 2019-2028 (USD Million)

TABLE 571 SOUTH AMERICA Food Processing in Hyperspectral imaging systems market, By product, 2019-2028 (USD Million)

TABLE 572 SOUTH AMERICA Agriculture in Hyperspectral imaging systems market, By product, 2019-2028 (USD Million)

TABLE 573 SOUTH AMERICA Environmental Monitoring in Hyperspectral imaging systems market, By product, 2019-2028 (USD Million)

TABLE 574 SOUTH AMERICA Mining/Mineral Mapping in Hyperspectral imaging systems market, By product, 2019-2028 (USD Million)

TABLE 575 SOUTH AMERICA Minerology in Hyperspectral imaging systems market, By product, 2019-2028 (USD Million)

TABLE 576 SOUTH AMERICA Civil Engineering in Hyperspectral imaging systems market, By product, 2019-2028 (USD Million)

TABLE 577 SOUTH AMERICA other applications in Hyperspectral imaging systems market, By product, 2019-2028 (USD Million)

TABLE 578 BRAZIL Hyperspectral imaging systems market, By product, 2019-2028 (USD Million)

TABLE 579 BRAZIL Hyperspectral imaging systems market, By scanning techniques, 2019-2028 (USD Million)

TABLE 580 BRAZIL Hyperspectral imaging systems market, By range, 2019-2028 (USD Million)

TABLE 581 BRAZIL Hyperspectral imaging systems market, By technology, 2019-2028 (USD Million)

TABLE 582 BRAZIL Hyperspectral imaging systems market, By application, 2019-2028 (USD Million)

TABLE 583 BRAZIL remote sensing in Hyperspectral imaging systems market, By product, 2019-2028 (USD Million)

TABLE 584 BRAZIL Military Surveillance in Hyperspectral imaging systems market, By product, 2019-2028 (USD Million)

TABLE 585 BRAZIL Machine Vision & Optical Sorting in Hyperspectral imaging systems market, By product, 2019-2028 (USD Million)

TABLE 586 BRAZIL Life Sciences & Medical Diagnostics in Hyperspectral imaging systems market, By product, 2019-2028 (USD Million)

TABLE 587 BRAZIL Food Processing in Hyperspectral imaging systems market, By product, 2019-2028 (USD Million)

TABLE 588 BRAZIL Agriculture in Hyperspectral imaging systems market, By product, 2019-2028 (USD Million)

TABLE 589 BRAZIL Environmental Monitoring in Hyperspectral imaging systems market, By product, 2019-2028 (USD Million)

TABLE 590 BRAZIL Mining/Mineral Mapping in Hyperspectral imaging systems market, By product, 2019-2028 (USD Million)

TABLE 591 BRAZIL Minerology in Hyperspectral imaging systems market, By product, 2019-2028 (USD Million)

TABLE 592 BRAZIL Civil Engineering in Hyperspectral imaging systems market, By product, 2019-2028 (USD Million)

TABLE 593 BRAZIL other applications in Hyperspectral imaging systems market, By product, 2019-2028 (USD Million)

TABLE 594 ARGENTINA Hyperspectral imaging systems market, By product, 2019-2028 (USD Million)

TABLE 595 ARGENTINA Hyperspectral imaging systems market, By scanning techniques, 2019-2028 (USD Million)

TABLE 596 ARGENTINA Hyperspectral imaging systems market, By range, 2019-2028 (USD Million)

TABLE 597 ARGENTINA Hyperspectral imaging systems market, By technology, 2019-2028 (USD Million)

TABLE 598 ARGENTINA Hyperspectral imaging systems market, By application, 2019-2028 (USD Million)

TABLE 599 ARGENTINA remote sensing in Hyperspectral imaging systems market, By product, 2019-2028 (USD Million)

TABLE 600 ARGENTINA Military Surveillance in Hyperspectral imaging systems market, By product, 2019-2028 (USD Million)

TABLE 601 ARGENTINA Machine Vision & Optical Sorting in Hyperspectral imaging systems market, By product, 2019-2028 (USD Million)

TABLE 602 ARGENTINA Life Sciences & Medical Diagnostics in Hyperspectral imaging systems market, By product, 2019-2028 (USD Million)

TABLE 603 ARGENTINA Food Processing in Hyperspectral imaging systems market, By product, 2019-2028 (USD Million)

TABLE 604 ARGENTINA Agriculture in Hyperspectral imaging systems market, By product, 2019-2028 (USD Million)

TABLE 605 ARGENTINA Environmental Monitoring in Hyperspectral imaging systems market, By product, 2019-2028 (USD Million)

TABLE 606 ARGENTINA Mining/Mineral Mapping in Hyperspectral imaging systems market, By product, 2019-2028 (USD Million)

TABLE 607 ARGENTINA Minerology in Hyperspectral imaging systems market, By product, 2019-2028 (USD Million)

TABLE 608 ARGENTINA Civil Engineering in Hyperspectral imaging systems market, By product, 2019-2028 (USD Million)

TABLE 609 ARGENTINA other applications in Hyperspectral imaging systems market, By product, 2019-2028 (USD Million)

TABLE 610 COLOMBIA Hyperspectral imaging systems market, By product, 2019-2028 (USD Million)

TABLE 611 COLOMBIA Hyperspectral imaging systems market, By scanning techniques, 2019-2028 (USD Million)

TABLE 612 COLOMBIA Hyperspectral imaging systems market, By range, 2019-2028 (USD Million)

TABLE 613 COLOMBIA Hyperspectral imaging systems market, By technology, 2019-2028 (USD Million)

TABLE 614 COLOMBIA Hyperspectral imaging systems market, By application, 2019-2028 (USD Million)

TABLE 615 COLOMBIA remote sensing in Hyperspectral imaging systems market, By product, 2019-2028 (USD Million)

TABLE 616 COLOMBIA Military Surveillance in Hyperspectral imaging systems market, By product, 2019-2028 (USD Million)

TABLE 617 COLOMBIA Machine Vision & Optical Sorting in Hyperspectral imaging systems market, By product, 2019-2028 (USD Million)

TABLE 618 COLOMBIA Life Sciences & Medical Diagnostics in Hyperspectral imaging systems market, By product, 2019-2028 (USD Million)

TABLE 619 COLOMBIA Food Processing in Hyperspectral imaging systems market, By product, 2019-2028 (USD Million)

TABLE 620 COLOMBIA Agriculture in Hyperspectral imaging systems market, By product, 2019-2028 (USD Million)

TABLE 621 COLOMBIA Environmental Monitoring in Hyperspectral imaging systems market, By product, 2019-2028 (USD Million)

TABLE 622 COLOMBIA Mining/Mineral Mapping in Hyperspectral imaging systems market, By product, 2019-2028 (USD Million)

TABLE 623 COLOMBIA Minerology in Hyperspectral imaging systems market, By product, 2019-2028 (USD Million)

TABLE 624 COLOMBIA Civil Engineering in Hyperspectral imaging systems market, By product, 2019-2028 (USD Million)

TABLE 625 COLOMBIA other applications in Hyperspectral imaging systems market, By product, 2019-2028 (USD Million)

TABLE 626 CHILE Hyperspectral imaging systems market, By product, 2019-2028 (USD Million)

TABLE 627 CHILE Hyperspectral imaging systems market, By scanning techniques, 2019-2028 (USD Million)

TABLE 628 CHILE Hyperspectral imaging systems market, By range, 2019-2028 (USD Million)

TABLE 629 CHILE Hyperspectral imaging systems market, By technology, 2019-2028 (USD Million)

TABLE 630 CHILE Hyperspectral imaging systems market, By application, 2019-2028 (USD Million)

TABLE 631 CHILE remote sensing in Hyperspectral imaging systems market, By product, 2019-2028 (USD Million)

TABLE 632 CHILE Military Surveillance in Hyperspectral imaging systems market, By product, 2019-2028 (USD Million)

TABLE 633 CHILE Machine Vision & Optical Sorting in Hyperspectral imaging systems market, By product, 2019-2028 (USD Million)

TABLE 634 CHILE Life Sciences & Medical Diagnostics in Hyperspectral imaging systems market, By product, 2019-2028 (USD Million)

TABLE 635 CHILE Food Processing in Hyperspectral imaging systems market, By product, 2019-2028 (USD Million)

TABLE 636 CHILE Agriculture in Hyperspectral imaging systems market, By product, 2019-2028 (USD Million)

TABLE 637 CHILE Environmental Monitoring in Hyperspectral imaging systems market, By product, 2019-2028 (USD Million)

TABLE 638 CHILE Mining/Mineral Mapping in Hyperspectral imaging systems market, By product, 2019-2028 (USD Million)

TABLE 639 CHILE Minerology in Hyperspectral imaging systems market, By product, 2019-2028 (USD Million)

TABLE 640 CHILE Civil Engineering in Hyperspectral imaging systems market, By product, 2019-2028 (USD Million)

TABLE 641 CHILE other applications in Hyperspectral imaging systems market, By product, 2019-2028 (USD Million)

TABLE 642 PERU Hyperspectral imaging systems market, By product, 2019-2028 (USD Million)

TABLE 643 PERU Hyperspectral imaging systems market, By scanning techniques, 2019-2028 (USD Million)

TABLE 644 PERU Hyperspectral imaging systems market, By range, 2019-2028 (USD Million)

TABLE 645 PERU Hyperspectral imaging systems market, By technology, 2019-2028 (USD Million)

TABLE 646 PERU Hyperspectral imaging systems market, By application, 2019-2028 (USD Million)

TABLE 647 PERU remote sensing in Hyperspectral imaging systems market, By product, 2019-2028 (USD Million)

TABLE 648 PERU Military Surveillance in Hyperspectral imaging systems market, By product, 2019-2028 (USD Million)

TABLE 649 PERU Machine Vision & Optical Sorting in Hyperspectral imaging systems market, By product, 2019-2028 (USD Million)

TABLE 650 PERU Life Sciences & Medical Diagnostics in Hyperspectral imaging systems market, By product, 2019-2028 (USD Million)

TABLE 651 PERU Food Processing in Hyperspectral imaging systems market, By product, 2019-2028 (USD Million)

TABLE 652 PERU Agriculture in Hyperspectral imaging systems market, By product, 2019-2028 (USD Million)

TABLE 653 PERU Environmental Monitoring in Hyperspectral imaging systems market, By product, 2019-2028 (USD Million)

TABLE 654 PERU Mining/Mineral Mapping in Hyperspectral imaging systems market, By product, 2019-2028 (USD Million)

TABLE 655 PERU Minerology in Hyperspectral imaging systems market, By product, 2019-2028 (USD Million)

TABLE 656 PERU Civil Engineering in Hyperspectral imaging systems market, By product, 2019-2028 (USD Million)

TABLE 657 PERU other applications in Hyperspectral imaging systems market, By product, 2019-2028 (USD Million)

TABLE 658 ECUADOR Hyperspectral imaging systems market, By product, 2019-2028 (USD Million)

TABLE 659 ECUADOR Hyperspectral imaging systems market, By scanning techniques, 2019-2028 (USD Million)

TABLE 660 ECUADOR Hyperspectral imaging systems market, By range, 2019-2028 (USD Million)

TABLE 661 ECUADOR Hyperspectral imaging systems market, By technology, 2019-2028 (USD Million)

TABLE 662 ECUADOR Hyperspectral imaging systems market, By application, 2019-2028 (USD Million)

TABLE 663 ECUADOR remote sensing in Hyperspectral imaging systems market, By product, 2019-2028 (USD Million)

TABLE 664 ECUADOR Military Surveillance in Hyperspectral imaging systems market, By product, 2019-2028 (USD Million)

TABLE 665 ECUADOR Machine Vision & Optical Sorting in Hyperspectral imaging systems market, By product, 2019-2028 (USD Million)

TABLE 666 ECUADOR Life Sciences & Medical Diagnostics in Hyperspectral imaging systems market, By product, 2019-2028 (USD Million)

TABLE 667 ECUADOR Food Processing in Hyperspectral imaging systems market, By product, 2019-2028 (USD Million)

TABLE 668 ECUADOR Agriculture in Hyperspectral imaging systems market, By product, 2019-2028 (USD Million)

TABLE 669 ECUADOR Environmental Monitoring in Hyperspectral imaging systems market, By product, 2019-2028 (USD Million)

TABLE 670 ECUADOR Mining/Mineral Mapping in Hyperspectral imaging systems market, By product, 2019-2028 (USD Million)

TABLE 671 ECUADOR Minerology in Hyperspectral imaging systems market, By product, 2019-2028 (USD Million)

TABLE 672 ECUADOR Civil Engineering in Hyperspectral imaging systems market, By product, 2019-2028 (USD Million)

TABLE 673 ECUADOR other applications in Hyperspectral imaging systems market, By product, 2019-2028 (USD Million)

TABLE 674 VENEZUELA Hyperspectral imaging systems market, By product, 2019-2028 (USD Million)

TABLE 675 VENEZUELA Hyperspectral imaging systems market, By scanning techniques, 2019-2028 (USD Million)

TABLE 676 VENEZUELA Hyperspectral imaging systems market, By range, 2019-2028 (USD Million)

TABLE 677 VENEZUELA Hyperspectral imaging systems market, By technology, 2019-2028 (USD Million)

TABLE 678 VENEZUELA Hyperspectral imaging systems market, By application, 2019-2028 (USD Million)

TABLE 679 VENEZUELA remote sensing in Hyperspectral imaging systems market, By product, 2019-2028 (USD Million)

TABLE 680 VENEZUELA Military Surveillance in Hyperspectral imaging systems market, By product, 2019-2028 (USD Million)

TABLE 681 VENEZUELA Machine Vision & Optical Sorting in Hyperspectral imaging systems market, By product, 2019-2028 (USD Million)

TABLE 682 VENEZUELA Life Sciences & Medical Diagnostics in Hyperspectral imaging systems market, By product, 2019-2028 (USD Million)

TABLE 683 VENEZUELA Food Processing in Hyperspectral imaging systems market, By product, 2019-2028 (USD Million)

TABLE 684 VENEZUELA Agriculture in Hyperspectral imaging systems market, By product, 2019-2028 (USD Million)

TABLE 685 VENEZUELA Environmental Monitoring in Hyperspectral imaging systems market, By product, 2019-2028 (USD Million)

TABLE 686 VENEZUELA Mining/Mineral Mapping in Hyperspectral imaging systems market, By product, 2019-2028 (USD Million)

TABLE 687 VENEZUELA Minerology in Hyperspectral imaging systems market, By product, 2019-2028 (USD Million)

TABLE 688 VENEZUELA Civil Engineering in Hyperspectral imaging systems market, By product, 2019-2028 (USD Million)

TABLE 689 VENEZUELA other applications in Hyperspectral imaging systems market, By product, 2019-2028 (USD Million)

TABLE 690 REST OF SOUTH AMERICA Hyperspectral imaging systems market, By product, 2019-2028 (USD Million)

Lista de figuras

FIGURE 1 GLOBAL Hyperspectral imaging systems MARKET: segmentation

FIGURE 2 Global Hyperspectral imaging systems market: data triangulation

FIGURE 3 Global Hyperspectral imaging systems market: DROC ANALYSIS

FIGURE 4 Global Hyperspectral imaging systems market: GLOBAL VS REGIONAL ANALYSIS

FIGURE 5 Global Hyperspectral imaging systems market: COMPANY RESEARCH ANALYSIS

FIGURE 6 Global Hyperspectral imaging systems market: INTERVIEW DEMOGRAPHICS

FIGURE 7 Global Hyperspectral imaging systems market: DBMR MARKET POSITION GRID

FIGURE 8 Global Hyperspectral imaging systems market: vendor share analysis

FIGURE 9 GLOBAL Hyperspectral imaging systems Market: MARKET APPLICATION COVERAGE GRID

FIGURE 10 Global Hyperspectral imaging systems market: SEGMENTATION

FIGURE 11 Increasing government investments in hyperspectral satellite imaging TO DRIVE GLOBAL HYPERSPECTRAL IMAGING SYSTEMS MARKET IN THE FORECAST PERIOD OF 2021 TO 2028

FIGURE 12 THE cameras segment is expected to account for the largest share of THE Global Hyperspectral imaging systems market in 2021 & 2028

FIGURE 13 North America DOMINATES and is the fastest-growing region in THE global HYPERSPECTRAL IMAGING SYSTEMS MARKET IN the forecast period of 2021 to 2028

FIGURE 14 DRIVERS, RESTRAINTS, OPPORTUNITIES, AND CHALLENGES OF Global Hyperspectral imaging systems Market

FIGURE 15 Global HYPERSPECTRAL IMAGING SYSTEMS MARKET, BY product, 2020

FIGURE 16 Global HYPERSPECTRAL IMAGING SYSTEMS MARKET, BY scanning techniques, 2020

FIGURE 17 Global HYPERSPECTRAL IMAGING SYSTEMS MARKET, BY range, 2020

FIGURE 18 Global HYPERSPECTRAL IMAGING SYSTEMS MARKET, BY technology, 2020

FIGURE 19 Global HYPERSPECTRAL IMAGING SYSTEMS MARKET, BY application, 2020

FIGURE 20 Global Hyperspectral imaging systems market: SNAPSHOT (2020)

FIGURE 21 Global Hyperspectral imaging systems market: by region (2020)

FIGURE 22 Global Hyperspectral imaging systems market: by region (2021 & 2028)

FIGURE 23 Global Hyperspectral imaging systems market: by region (2020 & 2028)

FIGURE 24 Global Hyperspectral imaging systems market: by product (2021-2028)

FIGURE 25 NORTH AMERICA HYPERSPECTRAL IMAGING SYSTEMS MARKET: SNAPSHOT (2020)

FIGURE 26 NORTH AMERICA HYPERSPECTRAL IMAGING SYSTEMS MARKET: by Country (2020)

FIGURE 27 NORTH AMERICA HYPERSPECTRAL IMAGING SYSTEMS MARKET: by Country (2021 & 2028)

FIGURE 28 NORTH AMERICA HYPERSPECTRAL IMAGING SYSTEMS MARKET: by Country (2020 & 2028)

FIGURE 29 NORTH AMERICA HYPERSPECTRAL IMAGING SYSTEMS MARKET: by product (2021-2028)

FIGURE 30 EUROPE HYPERSPECTRAL IMAGING SYSTEMS MARKET: SNAPSHOT (2020)

FIGURE 31 EUROPE HYPERSPECTRAL IMAGING SYSTEMS MARKET: by Country (2020)

FIGURE 32 EUROPE HYPERSPECTRAL IMAGING SYSTEMS MARKET: by Country (2021 & 2028)

FIGURE 33 EUROPE HYPERSPECTRAL IMAGING SYSTEMS MARKET: by Country (2020 & 2028)

FIGURE 34 EUROPE HYPERSPECTRAL IMAGING SYSTEMS MARKET: by product (2021-2028)

FIGURE 35 ASIA-PACIFIC HYPERSPECTRAL IMAGING SYSTEMS MARKET: SNAPSHOT (2020)

FIGURE 36 ASIA-PACIFIC HYPERSPECTRAL IMAGING SYSTEMS MARKET: by Country (2020)

FIGURE 37 ASIA-PACIFIC HYPERSPECTRAL IMAGING SYSTEMS MARKET: by Country (2021 & 2028)

FIGURE 38 ASIA-PACIFIC HYPERSPECTRAL IMAGING SYSTEMS MARKET: by Country (2020 & 2028)

FIGURE 39 ASIA-PACIFIC HYPERSPECTRAL IMAGING SYSTEMS MARKET: by product (2021-2028)

FIGURE 40 middle east & africa HYPERSPECTRAL IMAGING SYSTEMS MARKET: SNAPSHOT (2020)

FIGURE 41 middle east & africa HYPERSPECTRAL IMAGING SYSTEMS MARKET: by Country (2020)

FIGURE 42 middle east & africa HYPERSPECTRAL IMAGING SYSTEMS MARKET: by Country (2021 & 2028)

FIGURE 43 middle east & africa HYPERSPECTRAL IMAGING SYSTEMS MARKET: by Country (2020 & 2028)

FIGURE 44 middle east & africa HYPERSPECTRAL IMAGING SYSTEMS MARKET: by product (2021-2028)

FIGURE 45 SOUTH AMERICA HYPERSPECTRAL IMAGING SYSTEMS MARKET: SNAPSHOT (2020)

FIGURE 46 SOUTH AMERICA HYPERSPECTRAL IMAGING SYSTEMS MARKET: by Country (2020)

FIGURE 47 SOUTH AMERICA HYPERSPECTRAL IMAGING SYSTEMS MARKET: by Country (2021 & 2028)

FIGURE 48 SOUTH AMERICA HYPERSPECTRAL IMAGING SYSTEMS MARKET: by Country (2020 & 2028)

FIGURE 49 SOUTH AMERICA HYPERSPECTRAL IMAGING SYSTEMS MARKET: by PRODUCT (2021-2028)

FIGURE 50 global Hyperspectral imaging systems Market: company share 2020 (%)

FIGURE 51 NORTH AMERICA Hyperspectral imaging systems Market: company share 2020 (%)

FIGURE 52 Europe Hyperspectral imaging systems Market: company share 2020 (%)

FIGURE 53 Asia-Pacific Hyperspectral imaging systems Market: company share 2020 (%)

Ver información detallada Right Arrow

Metodología de investigación

La recopilación de datos y el análisis del año base se realizan utilizando módulos de recopilación de datos con muestras de gran tamaño. La etapa incluye la obtención de información de mercado o datos relacionados a través de varias fuentes y estrategias. Incluye el examen y la planificación de todos los datos adquiridos del pasado con antelación. Asimismo, abarca el examen de las inconsistencias de información observadas en diferentes fuentes de información. Los datos de mercado se analizan y estiman utilizando modelos estadísticos y coherentes de mercado. Además, el análisis de la participación de mercado y el análisis de tendencias clave son los principales factores de éxito en el informe de mercado. Para obtener más información, solicite una llamada de un analista o envíe su consulta.

La metodología de investigación clave utilizada por el equipo de investigación de DBMR es la triangulación de datos, que implica la extracción de datos, el análisis del impacto de las variables de datos en el mercado y la validación primaria (experto en la industria). Los modelos de datos incluyen cuadrícula de posicionamiento de proveedores, análisis de línea de tiempo de mercado, descripción general y guía del mercado, cuadrícula de posicionamiento de la empresa, análisis de patentes, análisis de precios, análisis de participación de mercado de la empresa, estándares de medición, análisis global versus regional y de participación de proveedores. Para obtener más información sobre la metodología de investigación, envíe una consulta para hablar con nuestros expertos de la industria.

Personalización disponible

Data Bridge Market Research es líder en investigación formativa avanzada. Nos enorgullecemos de brindar servicios a nuestros clientes existentes y nuevos con datos y análisis que coinciden y se adaptan a sus objetivos. El informe se puede personalizar para incluir análisis de tendencias de precios de marcas objetivo, comprensión del mercado de países adicionales (solicite la lista de países), datos de resultados de ensayos clínicos, revisión de literatura, análisis de mercado renovado y base de productos. El análisis de mercado de competidores objetivo se puede analizar desde análisis basados ​​en tecnología hasta estrategias de cartera de mercado. Podemos agregar tantos competidores sobre los que necesite datos en el formato y estilo de datos que esté buscando. Nuestro equipo de analistas también puede proporcionarle datos en archivos de Excel sin procesar, tablas dinámicas (libro de datos) o puede ayudarlo a crear presentaciones a partir de los conjuntos de datos disponibles en el informe.

Preguntas frecuentes

El mercado se segmenta según Mercado global de sistemas de imágenes hiperespectrales, por producto (cámaras, accesorios), técnicas de escaneo (escaneo espacial, escaneo espectral, sin escaneo, escaneo espacioespectral), tecnología (escoba de empuje, instantánea, software de gestión de video basado en analógico, software de gestión de video basado en IP, otros), rango (menos de 400 Nm, 400 Nm a 1700 Nm, más de 1700 Nm), aplicación (militar, detección remota, diagnóstico médico, visión artificial y clasificación óptica, otros): tendencias de la industria y pronóstico hasta 2031. .
El tamaño del Mercado se valoró en 6.90 USD Billion USD en 2023.
Se prevé que el Mercado crezca a una CAGR de 21.46% durante el período de pronóstico de 2024 a 2030.
Los principales actores del mercado incluyen , Robert Bosch GmbH , Hanwha Group , Honeywell International , Schneider Electric , Axis Communications AB , Johnson Controls , Hangzhou Hikvision Digital Technology Co. , NetApp , Dahua Technology USA , KEDACOM , Verint Systems , LTIMindtree Limited , AxxonSoft , eInfochips , Panasonic Corporation , Panopto , Backstreet Surveillance , Eagle Eye Solutions Group Plc. , Arcules ,.
Testimonial