
Global Hoses Market
Tamaño del mercado en miles de millones de dólares
Tasa de crecimiento anual compuesta (CAGR) :
% 
 USD
25.23 Billion
USD
40.52 Billion
2024
2032
USD
25.23 Billion
USD
40.52 Billion
2024
2032
| 2025 –2032 | |
| USD 25.23 Billion | |
| USD 40.52 Billion | |
| % | |
|
Segmentación del mercado global de mangueras, por medio (hidráulico, mangueras de vapor, mangueras de aire y gas, mangueras de manipulación de materiales, mangueras para alimentos y otros), material (mangueras de plástico/polímeros, mangueras de caucho, mangueras de metal, mangueras compuestas, mangueras de silicona y otros), y usuario final (industrial, automotriz, comercial y residencial), canal de ventas (directo e indirecto) - Tendencias de la industria y pronóstico hasta 2032.
Tamaño del mercado de mangueras
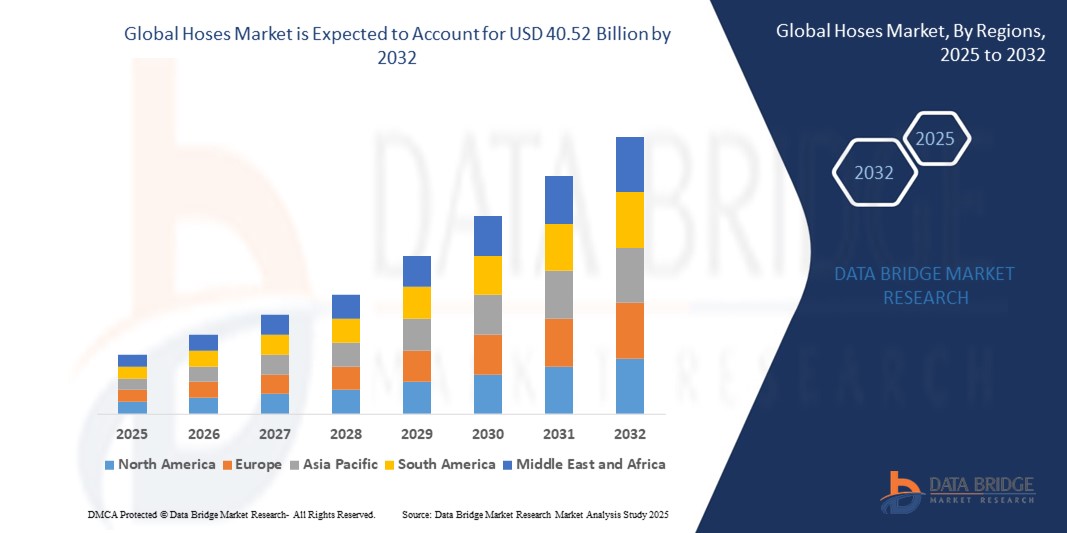
- El tamaño del mercado global de mangueras se valoró en USD 25,23 mil millones en 2024 y se espera que alcance los USD 40,52 mil millones para 2032 , con una CAGR de 6,10% durante el período de pronóstico.
- El crecimiento del mercado está impulsado principalmente por la creciente demanda de sistemas de transferencia de fluidos eficientes en las industrias, la creciente industrialización y la creciente necesidad de mangueras duraderas y de alto rendimiento en aplicaciones automotrices y de construcción.
- La creciente conciencia de los beneficios de las mangueras especializadas, como la resistencia química, la tolerancia a altas presiones y la flexibilidad, está impulsando aún más la demanda en los canales OEM y de posventa.
Análisis del mercado de mangueras
- El mercado de mangueras está experimentando un crecimiento constante debido a la creciente adopción de materiales y tecnologías avanzados que mejoran la durabilidad, la flexibilidad y el rendimiento de las mangueras en condiciones extremas.
- La creciente demanda de los sectores industrial y automotriz, junto con la necesidad de soluciones personalizadas para medios específicos, como fluidos hidráulicos y materiales de calidad alimentaria, está alentando a los fabricantes a innovar con soluciones de mangueras de alto rendimiento, ecológicas y duraderas.
- América del Norte domina el mercado de mangueras con la mayor participación en los ingresos del 39,2 % en 2024, impulsada por una base industrial bien establecida, una fabricación automotriz avanzada y una alta demanda de mangueras especializadas en los sectores de la construcción y la energía.
- Se espera que Asia-Pacífico sea la región de más rápido crecimiento durante el período de pronóstico, impulsada por la rápida industrialización, el aumento de la producción automotriz y el creciente desarrollo de infraestructura en países como China, India y las naciones del sudeste asiático.
- El segmento de mangueras hidráulicas dominó la mayor participación en ingresos del mercado con un 38,2 % en 2024, impulsado por el uso generalizado en las industrias automotriz, de construcción y de petróleo y gas para la transferencia de fluidos a alta presión.
Alcance del informe y segmentación del mercado de mangueras
|
Atributos |
Perspectivas clave del mercado de mangueras |
|
Segmentos cubiertos |
|
|
Países cubiertos |
América del norte
Europa
Asia-Pacífico
Oriente Medio y África
Sudamerica
|
|
Actores clave del mercado |
|
|
Oportunidades de mercado |
|
|
Conjuntos de información de datos de valor añadido |
Además de los conocimientos del mercado, como el valor de mercado, la tasa de crecimiento, los segmentos del mercado, la cobertura geográfica, los actores del mercado y el escenario del mercado, el informe de mercado elaborado por el equipo de investigación de mercado de Data Bridge incluye un análisis en profundidad de expertos, análisis de importación/exportación, análisis de precios, análisis de consumo de producción y análisis pestle. |
Tendencias del mercado de mangueras
Creciente demanda de mangueras compuestas ligeras y respetuosas con el medio ambiente
- El mercado mundial de mangueras está experimentando una tendencia notable hacia el desarrollo y la adopción de mangueras especializadas diseñadas para satisfacer requisitos específicos de la industria.
- Se están utilizando materiales avanzados como termoplásticos, silicona y mangueras compuestas para mejorar la durabilidad, la flexibilidad y la resistencia a condiciones extremas como alta presión, productos químicos corrosivos y temperaturas extremas.
- Las mangueras especializadas son cada vez más críticas en industrias como la del petróleo y el gas, la de alimentos y bebidas, la farmacéutica y la automotriz, donde las características de rendimiento precisas, como el cumplimiento de la FDA o la tolerancia a altas presiones, son esenciales.
- Por ejemplo, las empresas están innovando con mangueras de silicona para el procesamiento de alimentos que no tienen olor y son resistentes a los agentes de limpieza, mientras que se están diseñando mangueras hidráulicas para equipos de construcción para soportar cargas pesadas y entornos abrasivos.
- Esta tendencia está impulsando el crecimiento del mercado al ofrecer soluciones personalizadas que mejoran la eficiencia operativa, la seguridad y el cumplimiento de los estrictos estándares de la industria.
- La integración de tecnologías inteligentes, como sensores para el monitoreo en tiempo real del rendimiento y el desgaste de las mangueras, también está ganando terreno, lo que permite el mantenimiento predictivo y reduce el tiempo de inactividad en aplicaciones industriales.
Dinámica del mercado de mangueras
Conductor
Creciente demanda de desarrollo de infraestructura y aplicaciones industriales
- El creciente enfoque global en el desarrollo de infraestructura, incluidas carreteras, puentes y proyectos urbanos, es un impulsor importante del mercado de mangueras, en particular para las mangueras hidráulicas y de manejo de materiales.
- Las mangueras son fundamentales en los sectores de construcción, fabricación y automoción para transferir fluidos, gases y materiales, y respaldan aplicaciones como bombeo de hormigón, transferencia de combustible y sistemas hidráulicos.
- Las iniciativas gubernamentales, como la Iniciativa del Cinturón y la Ruta de China y la Misión de Ciudades Inteligentes de la India, están impulsando la demanda de mangueras duraderas y de alto rendimiento en proyectos a gran escala.
- El crecimiento de industrias como el petróleo y el gas, la agricultura y la automotriz, junto con la adopción de la automatización, está ampliando aún más la necesidad de soluciones avanzadas de mangueras.
- La proliferación de proyectos de energía renovable, como parques solares y turbinas eólicas, está impulsando la demanda de mangueras especializadas capaces de funcionar en ciclos de trabajo pesado y condiciones ambientales adversas.
Restricción/Desafío
Altos costos de materiales avanzados y cumplimiento normativo
- El desarrollo y la producción de mangueras especializadas que utilizan materiales avanzados como termoplásticos, silicona y compuestos implican costos significativos, lo que puede ser una barrera para los fabricantes y los usuarios finales, particularmente en mercados emergentes sensibles a los costos.
- La integración de tecnologías inteligentes o materiales de alto rendimiento en las mangueras aumenta la complejidad y los gastos de fabricación, lo que potencialmente limita su adopción en operaciones de menor escala.
- La seguridad de los datos y el cumplimiento normativo plantean desafíos, especialmente para las mangueras inteligentes equipadas con sensores habilitados para IoT, ya que recopilan y transmiten datos operativos, lo que genera inquietudes sobre infracciones y el cumplimiento de las regulaciones regionales.
- El panorama regulatorio fragmentado en los distintos países, con diferentes estándares ambientales y de seguridad, complica la fabricación y distribución para los actores globales.
- La volatilidad de los precios de las materias primas, como el caucho, el PVC y el acero, afecta aún más los costos de producción, creando desafíos para mantener la rentabilidad y la competitividad del mercado.
Alcance del mercado de mangueras
El mercado está segmentado en función del medio, el material, el usuario final y el canal de ventas.
- Por los medios de comunicación
Según los medios de comunicación, el mercado norteamericano de mangueras se segmenta en mangueras hidráulicas, de aire y gas, para manejo de materiales, para alimentos, de vapor, entre otras. El segmento de mangueras hidráulicas obtuvo la mayor cuota de mercado, con un 38,2%, en 2024, impulsado por su uso generalizado en las industrias automotriz, de construcción y de petróleo y gas para la transferencia de fluidos a alta presión. Estas mangueras son esenciales para los sistemas hidráulicos de maquinaria pesada, garantizando una transmisión de potencia eficiente y una fiabilidad operativa.
Se prevé que el segmento de mangueras para manejo de materiales experimente el mayor crecimiento entre 2025 y 2032, impulsado por la creciente demanda en la construcción, la minería y la agricultura para la transferencia de materiales abrasivos, lodos y carga seca a granel. Los avances en materiales duraderos y resistentes a la abrasión y el aumento de proyectos de infraestructura aceleran aún más su adopción.
- Por material
Según el material, el mercado norteamericano de mangueras se segmenta en mangueras de caucho, mangueras de plástico/polímero, mangueras metálicas, mangueras compuestas, mangueras de silicona, entre otras. El segmento de mangueras de caucho dominó el mercado con una participación en los ingresos del 50,3 % en 2024, gracias a su flexibilidad, durabilidad y amplio uso en aplicaciones automotrices, industriales y agrícolas. Las mangueras de caucho son preferidas por su capacidad para manejar diversos fluidos y soportar condiciones adversas.
Se prevé que el segmento de mangueras de plástico/polímero experimente la tasa de crecimiento más rápida, un 8,2 %, entre 2025 y 2032, gracias a su ligereza, resistencia a la corrosión y su creciente adopción en las industrias automotriz y de alimentos y bebidas. La creciente preocupación por el medio ambiente y los avances en materiales poliméricos ecológicos están impulsando la demanda de soluciones de mangueras sostenibles.
- Por el usuario final
En cuanto al usuario final, el mercado norteamericano de mangueras se segmenta en los sectores automotriz, industrial, comercial y residencial. El segmento industrial obtuvo la mayor participación en los ingresos del mercado, con un 42,7 % en 2024, impulsado por su amplio uso en los sectores de petróleo y gas, construcción y manufactura para la transferencia de fluidos y materiales. La sólida base industrial en EE. UU., sumada a las inversiones en infraestructura, consolida el dominio de este segmento.
Se prevé que el sector automotriz experimente un rápido crecimiento entre 2025 y 2032, con una tasa de crecimiento anual compuesta (TCAC) proyectada del 7,9 %, impulsada por la creciente demanda de mangueras para los sistemas de transferencia de combustible, refrigerante y aire en los vehículos. El aumento de la producción de vehículos eléctricos y la necesidad de mangueras ligeras y duraderas en el creciente sector automotriz canadiense son factores clave de este crecimiento.
- Por canal de venta
Según el canal de venta, el mercado norteamericano de mangueras se segmenta en indirecto y directo. El segmento del canal de venta directa representó la mayor cuota de mercado en ingresos, con un 60,8%, en 2024, impulsado por las colaboraciones directas de los fabricantes con fabricantes de equipos originales (OEM) y grandes clientes industriales, lo que garantiza soluciones personalizadas y cadenas de suministro optimizadas. Esto es especialmente notable en EE. UU., donde dominan fabricantes consolidados como Gates Corporation y Parker Hannifin.
Se prevé que el segmento de canales de venta indirectos crezca a un ritmo significativo entre 2025 y 2032, impulsado por la expansión de plataformas de comercio electrónico y distribuidores que atienden a pequeñas empresas y consumidores residenciales. La comodidad de las compras en línea y los precios competitivos están mejorando la accesibilidad, especialmente en el mercado canadiense, que experimenta un rápido crecimiento.
Análisis regional del mercado de mangueras
- América del Norte domina el mercado de mangueras con la mayor participación en los ingresos del 39,2 % en 2024, impulsada por una base industrial bien establecida, una fabricación automotriz avanzada y una alta demanda de mangueras especializadas en los sectores de la construcción y la energía.
- Los consumidores y las industrias priorizan las mangueras por su durabilidad, flexibilidad y capacidad para manejar diversos medios como fluidos hidráulicos, vapor y gases, particularmente en regiones con condiciones industriales y climáticas variadas.
- El crecimiento está respaldado por innovaciones en materiales para mangueras, incluidos polímeros y compuestos de alto rendimiento, junto con una creciente adopción en los sectores industrial, automotriz y residencial.
Perspectiva del mercado de mangueras de EE. UU.
El mercado estadounidense de mangueras capturó la mayor participación en los ingresos, con un 82,3 %, en 2024 en Norteamérica, impulsado por la demanda de mangueras de alto rendimiento en entornos industriales y comerciales. La mayor atención a la eficiencia operativa y los estándares de seguridad fomenta su adopción. Además, la evolución de las regulaciones sobre manipulación de materiales y cumplimiento ambiental influye en las decisiones de los consumidores, buscando un equilibrio entre el rendimiento y los requisitos regulatorios.
Perspectiva del mercado de mangueras en Europa
Se prevé un crecimiento significativo del mercado europeo de mangueras, impulsado por la prioridad regulatoria en la seguridad y la eficiencia industrial. Los consumidores y las industrias buscan mangueras que ofrezcan alta durabilidad y compatibilidad con diversos medios, como aplicaciones hidráulicas y de gas. El crecimiento es notable en los sectores industrial y automotriz, con países como Alemania y Francia mostrando una adopción sustancial debido al aumento de las regulaciones ambientales y la automatización industrial.
Perspectiva del mercado de mangueras del Reino Unido
Se prevé un rápido crecimiento del mercado de mangueras del Reino Unido, impulsado por la demanda de mangueras de alto rendimiento en entornos industriales y comerciales. La mayor atención a la eficiencia operativa y los estándares de seguridad fomenta su adopción. Además, la evolución de las normativas sobre manipulación de materiales y cumplimiento medioambiental influye en las decisiones de los consumidores, buscando un equilibrio entre el rendimiento y los requisitos normativos.
Análisis del mercado de mangueras en Alemania
Se prevé un rápido crecimiento en el mercado de mangueras en Alemania, gracias a su avanzado sector manufacturero y a su gran énfasis en la eficiencia y la sostenibilidad. Las industrias alemanas prefieren mangueras tecnológicamente avanzadas fabricadas con materiales como compuestos y silicio para optimizar el rendimiento y reducir los costes de mantenimiento. La integración de estas mangueras en equipos industriales de alta gama y soluciones de posventa impulsa el crecimiento sostenido del mercado.
Análisis del mercado de mangueras de Asia-Pacífico
Se prevé que la región Asia-Pacífico experimente la tasa de crecimiento más rápida, impulsada por la expansión de la producción industrial y automotriz, así como por el aumento de la renta disponible en países como China, India y Japón. La creciente concienciación sobre las soluciones de mangueras de alta calidad para la transferencia de medios y la seguridad está impulsando la demanda. Las iniciativas gubernamentales que promueven la eficiencia industrial y la sostenibilidad ambiental incentivan aún más la adopción de mangueras avanzadas.
Perspectiva del mercado de mangueras en Japón
Se prevé un rápido crecimiento del mercado japonés de mangueras debido a la fuerte preferencia de los consumidores y la industria por mangueras de alta calidad y tecnología avanzada que mejoran la eficiencia operativa y la seguridad. La presencia de importantes industrias manufactureras y la integración de mangueras en aplicaciones OEM aceleran la penetración en el mercado. El creciente interés en la personalización posventa también contribuye a este crecimiento.
Análisis del mercado de mangueras de China
China posee la mayor participación en el mercado de mangueras de Asia-Pacífico, impulsada por la rápida industrialización, el aumento de la propiedad de vehículos y la creciente demanda de soluciones eficientes para la transferencia de medios. La creciente base industrial del país y su enfoque en la fabricación rentable impulsan la adopción de mangueras avanzadas. La sólida capacidad de producción nacional y los precios competitivos mejoran el acceso al mercado.
Cuota de mercado de mangueras
La industria de las mangueras está liderada principalmente por empresas bien establecidas, entre las que se incluyen:
- Parker Hannifin Corp (EE. UU.)
- Continental AG (Alemania)
- Tricoflex SAS (Francia)
- Grupo Trelleborg (Suecia)
- Manuli Hydraulics (Italia)
- Danfoss (Dinamarca)
- Gates Corporation (EE. UU.)
- Grupo de tecnología de mangueras de Schauenburg (Alemania)
- Grupo Masterflex (Alemania)
- Copely Developments Ltd (Reino Unido)
- Transfer Oil SpA (Italia)
- MöllerGroup (Alemania)
- Gollmer & Hummel GmbH (Alemania)
- Colex International Limited, Reino Unido. (RU)
- Jakob Eschbach GmbH (Alemania)
- Artel Rubber Company (Países Bajos)
- Gummi Hansen GmbH (Alemania)
¿Cuáles son los desarrollos recientes en el mercado global de mangueras?
- En abril de 2025, Continental AG, líder mundial en soluciones automotrices e industriales, lanzó su última innovación en refrigeración para centros de datos: las mangueras premium DataGuard y FlexCool para refrigeración de datos. Estas mangueras especializadas están diseñadas para garantizar la estabilidad térmica y prevenir el sobrecalentamiento, los fallos de hardware y la pérdida de datos en sistemas electrónicos sensibles. Diseñadas para refrigeración monofásica directa al chip, cuentan con tubos de EPDM curados con peróxido, cubiertas resistentes al fuego UL 94 V-0 y una flexibilidad excepcional, lo que las hace ideales para los centros de datos modernos de alta densidad. Este lanzamiento refleja el compromiso de Continental de apoyar a los sectores emergentes de alta tecnología con soluciones sostenibles y eficientes.
- En mayo de 2024, Danfoss Power Solutions presentó su última innovación: las mangueras antiestáticas Boston by Danfoss EHP530 y EHP531, diseñadas específicamente para aplicaciones de transferencia de petróleo, combustible y gas. Estas mangueras cuentan con un tubo interior de compuesto de caucho antiestático especializado, refuerzo textil de alta resistencia y conexión a tierra de cable de cobre, lo que garantiza la protección contra la acumulación y descarga de electricidad estática. Con presiones nominales de 10,5 bar (EHP530) y 20,7 bar (EHP531), ofrecen durabilidad, flexibilidad y facilidad de manejo en entornos exigentes. Este lanzamiento subraya el compromiso de Danfoss con las aplicaciones críticas para la seguridad y el rendimiento fiable en la industria petrolera.
- En septiembre de 2023, Watson-Marlow Fluid Technology Solutions (WMFTS) amplió su gama de bombas de manguera Bredel con el lanzamiento de la manguera de transferencia Bredel NR, una manguera de caucho natural diseñada para aplicaciones generales de transferencia de fluidos. Diseñada para soportar presiones de hasta 12 bar (174 psi), la manguera es apta para la manipulación de lodos, residuos de alimentos y bebidas, lodos abrasivos y productos químicos ligeramente corrosivos. Complementa la manguera dosificadora NR existente y está optimizada para una larga vida útil, compatibilidad química y bajo mantenimiento, lo que la hace ideal para industrias como el tratamiento de aguas residuales, la construcción y la generación de energía.
- En julio de 2023, LifeGuard Technologies, fabricante líder de sistemas de mangueras de seguridad, presentó la primera manguera de seguridad con camisa de vacío LifeGuard, con patente en trámite, diseñada específicamente para la transferencia de hidrógeno líquido y helio. Esta manguera avanzada cuenta con aislamiento al vacío con capas de superaislamiento y un sistema de cierre interno de seguridad LifeGuard integrado, diseñado para evitar la pérdida de producto y garantizar la interrupción del flujo en caso de separación de emergencia. Desarrollada en colaboración con GPSS India y Shell-N-Tube, la manguera aborda los desafíos únicos de la transferencia de fluidos criogénicos, reforzando el compromiso de LifeGuard con la energía limpia y la seguridad de los gases industriales.
- En marzo de 2023, Continental AG presentó sus soluciones de mangueras hidráulicas de última generación en la feria comercial IFPE/CONEXPO de Las Vegas. La compañía presentó una solución de ensamblaje conectada con tecnología inteligente que revolucionó la fabricación de mangueras al mejorar la eficiencia, la precisión y el rendimiento del producto. Este sistema integra el software CrimpCloud® basado en la nube y la aplicación móvil C-IQ™, lo que permite acceder en tiempo real a las especificaciones de crimpado, la identificación de accesorios y las instrucciones de ensamblaje. Continental también destacó sus mangueras termoplásticas resistentes a la abrasión X-Life™, diseñadas para entornos extremos, y su concepto "Shop in a Box": una celda completa de ensamblaje de mangueras para operaciones in situ.
SKU-
Obtenga acceso en línea al informe sobre la primera nube de inteligencia de mercado del mundo

- Panel de análisis de datos interactivo
- Panel de análisis de empresas para oportunidades con alto potencial de crecimiento
- Acceso de analista de investigación para personalización y consultas
- Análisis de la competencia con panel interactivo
- Últimas noticias, actualizaciones y análisis de tendencias
- Aproveche el poder del análisis de referencia para un seguimiento integral de la competencia
Metodología de investigación
La recopilación de datos y el análisis del año base se realizan utilizando módulos de recopilación de datos con muestras de gran tamaño. La etapa incluye la obtención de información de mercado o datos relacionados a través de varias fuentes y estrategias. Incluye el examen y la planificación de todos los datos adquiridos del pasado con antelación. Asimismo, abarca el examen de las inconsistencias de información observadas en diferentes fuentes de información. Los datos de mercado se analizan y estiman utilizando modelos estadísticos y coherentes de mercado. Además, el análisis de la participación de mercado y el análisis de tendencias clave son los principales factores de éxito en el informe de mercado. Para obtener más información, solicite una llamada de un analista o envíe su consulta.
La metodología de investigación clave utilizada por el equipo de investigación de DBMR es la triangulación de datos, que implica la extracción de datos, el análisis del impacto de las variables de datos en el mercado y la validación primaria (experto en la industria). Los modelos de datos incluyen cuadrícula de posicionamiento de proveedores, análisis de línea de tiempo de mercado, descripción general y guía del mercado, cuadrícula de posicionamiento de la empresa, análisis de patentes, análisis de precios, análisis de participación de mercado de la empresa, estándares de medición, análisis global versus regional y de participación de proveedores. Para obtener más información sobre la metodología de investigación, envíe una consulta para hablar con nuestros expertos de la industria.
Personalización disponible
Data Bridge Market Research es líder en investigación formativa avanzada. Nos enorgullecemos de brindar servicios a nuestros clientes existentes y nuevos con datos y análisis que coinciden y se adaptan a sus objetivos. El informe se puede personalizar para incluir análisis de tendencias de precios de marcas objetivo, comprensión del mercado de países adicionales (solicite la lista de países), datos de resultados de ensayos clínicos, revisión de literatura, análisis de mercado renovado y base de productos. El análisis de mercado de competidores objetivo se puede analizar desde análisis basados en tecnología hasta estrategias de cartera de mercado. Podemos agregar tantos competidores sobre los que necesite datos en el formato y estilo de datos que esté buscando. Nuestro equipo de analistas también puede proporcionarle datos en archivos de Excel sin procesar, tablas dinámicas (libro de datos) o puede ayudarlo a crear presentaciones a partir de los conjuntos de datos disponibles en el informe.

