
Global Handheld Intraoral Dental 3d Scanners Market
Tamaño del mercado en miles de millones de dólares
Tasa de crecimiento anual compuesta (CAGR) :
% 
 USD
396,987.01 Thousand
USD
860,402.88 Thousand
2022
2030
USD
396,987.01 Thousand
USD
860,402.88 Thousand
2022
2030
| 2023 –2030 | |
| USD 396,987.01 Thousand | |
| USD 860,402.88 Thousand | |
| % | |
|
Global Handheld Intraoral Dental 3D Scanners Market, By Modality (Portable And Standalone), Type (Power-Free Intraoral Scanners And Power-Based Intraoral Scanners), Connectivity (Wired And Wireless), Technology (Optical Wand And Confocal Microscope Imaging), Application (Dental Restoration, Orthodontics, Periodontics, Endodontics, And Others), End User (Hospitals & Dental Clinics, Laboratories, Academics And Research Institutes, And Others), Distribution Channel (Direct Tender, Retail Sales, And Others) – Industry Trends and Forecast to 2030.
Handheld Intraoral Dental 3D Scanners Market Analysis and Insights
The application of intraoral scanners has emerged in everyday dental practices globally due to its convenient application among patients. They improve the dental hygiene process and also enhance the communication between dental professionals, clinical laboratories, and patients. 3D Digitalization technology’s incorporation in dental diagnostics has enabled easy data storage and transmission to laboratories in minutes, thereby being time-efficient. Dentists and laboratories widely prefer intraoral scanners to design esthetic dental impressions and restorations.
The rising dental problems and increasing geriatric population with tooth loss have also boosted the demand for intraoral scanners in dental hospitals and clinics. However, the high cost associated with products has hampered the growth of the market. Many key players are taking initiatives to improve their sales on the market.
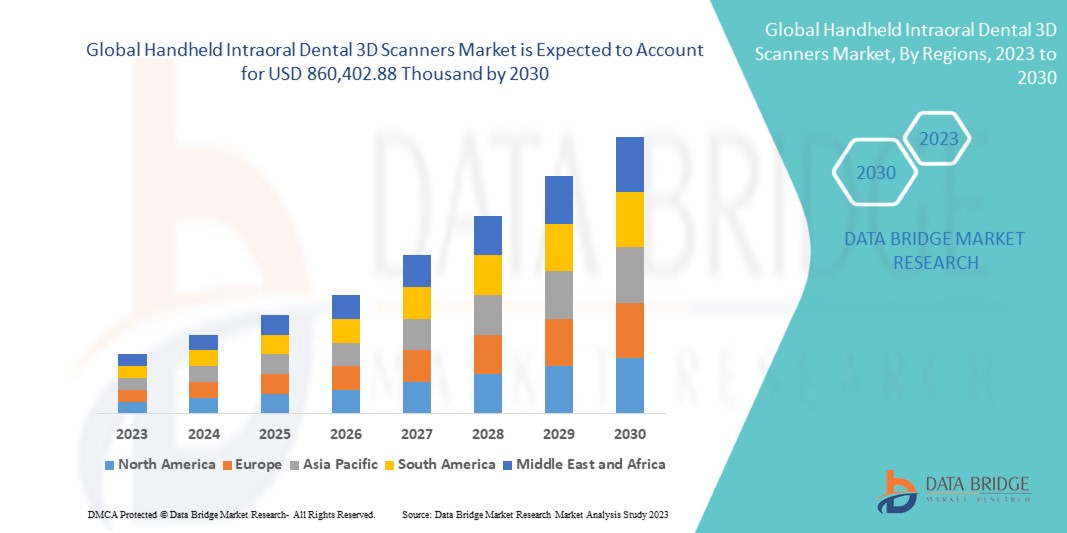
The global handheld intraoral dental 3D scanners market is expected to gain market growth in the forecast period of 2023 to 2030. Data Bridge Market Research analyses that the market is growing with a CAGR of 10.2% in the forecast period of 2023 to 2030 and is expected to reach USD 860,402.88 Thousand by 2030 from USD 396,987.01 Thousand in 2022.
Global handheld intraoral dental 3D scanners market report provides details of market share, new developments, and product pipeline analysis, the impact of domestic and localized market players, analyses opportunities in terms of emerging revenue pockets, changes in market regulations, product approvals, strategic decisions, product launches, geographic expansions, and technological innovations in the market. Contact us for an analyst brief to understand the analysis and the market scenario. Our team will help you create a revenue-impact solution to achieve your desired goal. The scalability and business expansion of the retail units in the developing countries of various regions and partnership with suppliers for the safe distribution of machine and drug products are the major drivers propelling the market demand in the forecast period.
|
Report Metric |
Details |
|
Forecast Period |
2023 to 2030 |
|
Base Year |
2022 |
|
Historic Years |
2021 (Customizable to 2015-2020) |
|
Quantitative Units |
Ingresos en miles de USD |
|
Segmentos cubiertos |
Modalidad (portátil y autónoma), tipo (escáneres intraorales sin alimentación y escáneres intraorales con alimentación), conectividad (con cable e inalámbrica), tecnología (obtención de imágenes con microscopio confocal y con varilla óptica), aplicación (restauración dental, ortodoncia, periodoncia, endodoncia y otras), usuario final (hospitales y clínicas dentales, laboratorios, instituciones académicas y de investigación y otras), canal de distribución (licitación directa, ventas minoristas y otras) |
|
Países cubiertos |
EE. UU., Canadá, México, Alemania, Reino Unido, Francia, Italia, Rusia, España, Países Bajos, Suiza, Bélgica, Turquía, Resto de Europa, China, Japón, India, Australia, Corea del Sur, Indonesia, Filipinas, Tailandia, Malasia, Singapur, Resto de Asia-Pacífico, Brasil, Argentina, Resto de Sudamérica, Arabia Saudita, Sudáfrica, Emiratos Árabes Unidos, Egipto, Israel y Resto de Medio Oriente y África. |
|
Actores del mercado cubiertos |
Dentsply Sirona (EE. UU.), Envista (EE. UU.), PLANMECA OY (Finlandia), Align Technology, Inc. (EE. UU.), Medit Corp. (Corea del Sur), 3Shape A/S. (Dinamarca), 3DISC (EE. UU.), Guangdong Launca Medical Device Technology Co., Ltd (China), Institut Straumann AG (Suiza), VATECH, entre otros. |
Definición de mercado
Los escáneres intraorales 3D portátiles son dispositivos dentales que se utilizan para capturar impresiones digitales directas en odontología. Funcionan de manera similar a otros dispositivos de escaneo donde proyectan una fuente láser sobre el sitio del diente que se debe observar. Los escáneres intraorales han superado muchos desafíos que enfrentan los escáneres tradicionales que utilizan placas y bandejas de impresión. Debido a esto, los pacientes prefieren impresiones digitalizadas en 3D que son más convenientes y cómodas. Debido a los avances tecnológicos, los escáneres intraorales recientes permiten escanear la arcada dental completa en menos de 3 minutos. Los escáneres intraorales también simplifican la carga del procedimiento para los profesionales dentales al simplificar la toma de impresiones en casos complejos. Los escáneres intraorales 3D portátiles se utilizan ampliamente para problemas dentales como placa, sarro, dientes desgastados o perdidos, dientes con formas anormales, caries, pulpitis, maloclusión y otros.
Dinámica del mercado global de escáneres intraorales 3D portátiles para odontología
Conductores
- Aumento del número de pacientes con edentulismo
El edentulismo es una afección en la que una persona ha perdido todos los dientes debido a la edad, una lesión o una enfermedad. Esta afección puede afectar gravemente la calidad de vida de una persona, dificultando la alimentación, el habla y la sonrisa. A medida que la población envejece, aumenta la cantidad de personas con edentulismo, lo que aumenta la demanda de escáneres dentales.
El creciente número de pacientes que sufren edentulismo es un factor importante que impulsa el crecimiento del mercado. Recientemente, el número de personas que padecen problemas dentales ha aumentado significativamente. Los problemas dentales como caries, enfermedades de las encías y cáncer bucal se han vuelto más comunes entre personas de todas las edades. Como resultado, la demanda de servicios y productos dentales ha crecido enormemente, y el mercado de escáneres intraorales 3D portátiles se ha beneficiado de esta tendencia.
Por lo tanto, se espera que el creciente volumen de pacientes que sufren edentulismo impulse el crecimiento del mercado .
- Aumentar la conciencia sobre la enfermedad periodontal
La enfermedad periodontal, también conocida como enfermedad de las encías, es un problema de salud dental grave y común que afecta a muchas personas en todo el mundo. La enfermedad es causada por bacterias que se acumulan en los espacios entre los dientes y las encías, causando inflamación y posible daño a las encías y las estructuras de soporte de los dientes.
Cada vez más personas son conscientes de la importancia de una buena higiene bucal y de las revisiones dentales periódicas, y también son más conscientes de los riesgos y las consecuencias de la periodontitis. Los escáneres intraorales pueden desempeñar un papel importante en el diagnóstico y el tratamiento de la periodontitis.
Por lo tanto, se espera que una mayor conciencia sobre la enfermedad objetivo impulse el crecimiento del mercado en el período previsto.
Restricción
- Alto costo asociado al uso del producto
El alto costo asociado con el uso de escáneres intraorales 3D portátiles es un gran obstáculo en el mercado de escáneres intraorales 3D portátiles. Si bien estos dispositivos ofrecen muchas ventajas, como mayor precisión, tiempos de tratamiento más rápidos y mejores resultados para los pacientes, su alto costo puede ponerlos fuera del alcance de muchos dentistas.
El costo de los procedimientos que utilizan escáneres intraorales depende directamente de numerosos factores, como la usabilidad, el tamaño y el material, entre otros. Como las cirugías dentales, como la cirugía oral y maxilofacial, son muy necesarias, los dentistas prefieren utilizar escáneres intraorales para muchas aplicaciones protésicas y de ortodoncia. Sin embargo, el costo del dispositivo y del tratamiento para cualquier impresión dental con escáneres intraorales es relativamente alto.

Oportunidad
- Aumento de nuevos avances tecnológicos
El surgimiento de nuevos avances tecnológicos sin duda creará oportunidades para el crecimiento del mercado. Los escáneres 3D intraorales dentales son dispositivos avanzados que utilizan los dentistas para capturar impresiones digitales de dientes y encías. Estos dispositivos se están volviendo cada vez más populares debido a su capacidad para proporcionar impresiones digitales precisas y eficientes, lo cual es esencial para crear prótesis dentales como coronas, puentes y dentaduras postizas.
Con nuevas tecnologías como el software CAD/CAM y la computación en la nube , los escáneres 3D intraorales portátiles son cada vez más avanzados y eficientes.
Los rápidos avances tecnológicos están mejorando la forma en que tratamos los trastornos dentales de una manera más cómoda y personalizada. Estas últimas impresiones digitales en el lugar mediante escáneres intraorales 3D portátiles han permitido a los odontólogos compartir los resultados con el laboratorio a través del correo electrónico en cuestión de minutos. Mejoran la atención al paciente con una sensación de comodidad elevada y una buena relación calidad-precio. Se espera que estos factores creen importantes oportunidades de crecimiento del mercado.
Desafío
Falta de profesionales cualificados debido al avance tecnológico
La falta de profesionales capacitados que dominen los escáneres intraorales 3D portátiles plantea un desafío para el crecimiento del mercado. Las prácticas odontológicas pueden enfrentar dificultades para implementar esta tecnología debido a la falta de personal capacitado. Además, la escasez de profesionales capacitados puede limitar la adopción y utilización de estos escáneres, lo que dificulta su posible impacto en la atención al paciente.
El manejo de estos sofisticados escáneres requiere conocimientos y formación especializados. Los dentistas y los técnicos dentales deben ser competentes en el manejo del escáner, la interpretación de las imágenes generadas y la integración de los datos en el proceso de planificación del tratamiento. Lamentablemente, el plan de estudios de la educación dental tradicional suele carecer de una formación integral en esta área, ya que la tecnología es relativamente nueva.
Además, la naturaleza acelerada de los avances tecnológicos significa que los profesionales de la odontología deben actualizar constantemente sus habilidades y conocimientos para mantenerse al día con los últimos avances. Este proceso de aprendizaje continuo puede llevar mucho tiempo y requiere una inversión significativa de recursos. Por lo tanto, es evidente que se espera que la disponibilidad de profesionales equipados con las habilidades adecuadas desafíe el crecimiento del mercado.
Acontecimientos recientes
- En mayo de 2021, Dentsply Sirona anunció que la empresa se asoció con la Federación Dental Internacional (FDI) para la sostenibilidad. Se prevé que esta asociación estratégica ayude a la empresa a mejorar la producción y distribución de sus productos dentales, manteniendo así su presencia en el mercado.
- En mayo de 2021, Align Technology, Inc. anunció que la empresa recibió el premio a la “Mejor plataforma de atención virtual” en el quinto programa anual de premios MedTech Breakthrough Awards realizado por MedTech Breakthrough, una organización independiente de inteligencia de mercado. Este premio mejoró el reconocimiento mundial de la empresa.
Alcance del mercado global de escáneres intraorales 3D portátiles para odontología
El mercado global de escáneres 3D intraorales portátiles para odontología se clasifica en siete segmentos notables: modalidad, tipo, conectividad, tecnología, aplicación, usuario final y canales de distribución. El crecimiento entre segmentos le ayuda a analizar nichos de crecimiento y estrategias para abordar el mercado y determinar sus áreas de aplicación principales y la diferencia en sus mercados objetivo.
Por modalidad
- Portátil
- Autónomo
Sobre la base de la modalidad, el mercado global de escáneres 3D intraorales portátiles para odontología se segmenta en portátiles y autónomos.
Por tipo
- Escáneres intraorales sin polvo
- Escáneres intraorales a base de polvo
Según el tipo, el mercado global de escáneres intraorales 3D portátiles para odontología se segmenta en escáneres intraorales sin polvo y escáneres intraorales a base de polvo.
Por conectividad
- Cableado
- Inalámbrico
Sobre la base de la conectividad, el mercado global de escáneres dentales 3D intraorales portátiles se segmenta en cableados e inalámbricos.
Por tecnología
- Imágenes microscópicas confocales
- Varita óptica
Sobre la base de la tecnología, el mercado global de escáneres 3D intraorales portátiles para odontología está segmentado en imágenes microscópicas confocales y con varita óptica.
Por aplicación
- Restauración dental
- Ortodoncia
- Periodoncia
- Endodoncia
- Otros
Sobre la base de la aplicación, el mercado global de escáneres 3D intraorales portátiles para odontología está segmentado en restauración dental, ortodoncia, periodoncia, endodoncia y otros.
Por el usuario final
- Hospitales
- Clínicas dentales
- Laboratorios
- Institutos académicos y de investigación
- Otros
Sobre la base del usuario final, el mercado global de escáneres 3D intraorales portátiles para odontología está segmentado en hospitales, clínicas dentales, laboratorios, institutos académicos y de investigación y otros.
Por canal de distribución
- Ventas al por menor
- Licitación directa
- Otros
Sobre la base del canal de distribución, el mercado global de escáneres 3D intraorales portátiles para odontología se segmenta en licitación directa, ventas minoristas y otros.

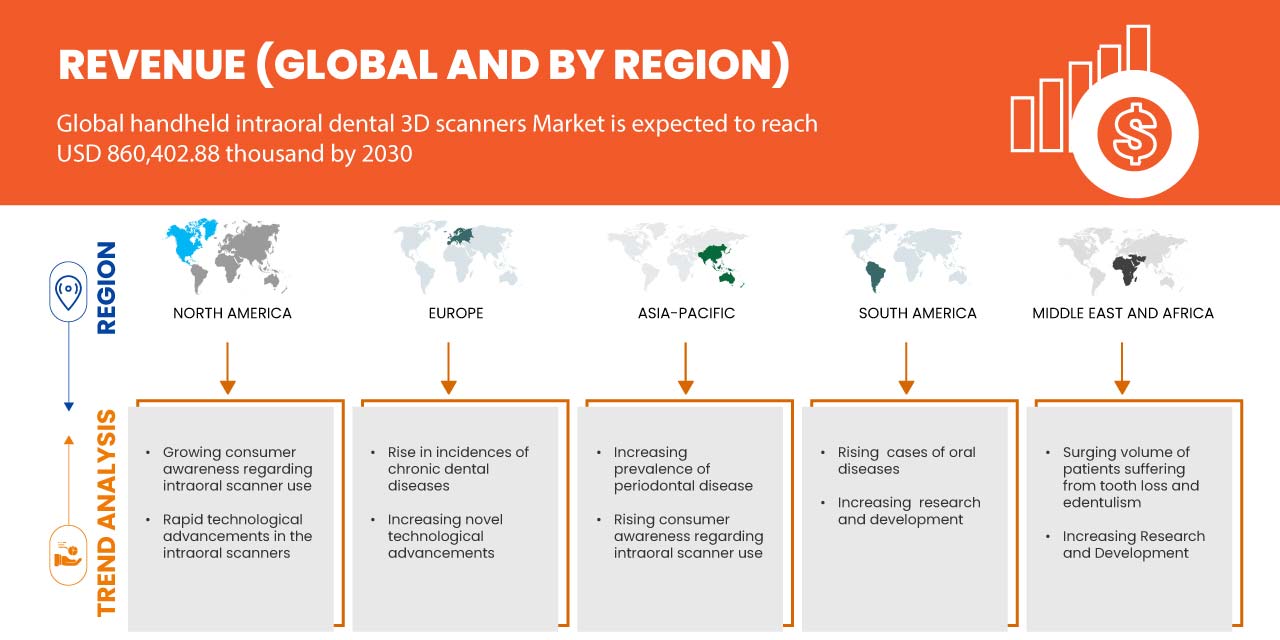
Análisis regional y perspectivas del mercado global de escáneres intraorales 3D portátiles para odontología
El mercado global de escáneres 3D intraorales portátiles para odontología se clasifica en siete segmentos notables que se basan en la modalidad, el tipo, la conectividad, la tecnología, la aplicación, el usuario final y el canal de distribución.
Los países cubiertos en este informe de mercado son EE. UU., Canadá, México, Alemania, Francia, Reino Unido, Italia, España, Rusia, Países Bajos, Suiza, Turquía, Bélgica, resto de Europa, Japón, China, Corea del Sur, India, Australia, Singapur, Tailandia, Malasia, Indonesia, Filipinas y resto de Asia-Pacífico, Brasil, Argentina, resto de Sudamérica, Sudáfrica, Emiratos Árabes Unidos, Arabia Saudita, Israel, Egipto y resto de Medio Oriente y África.
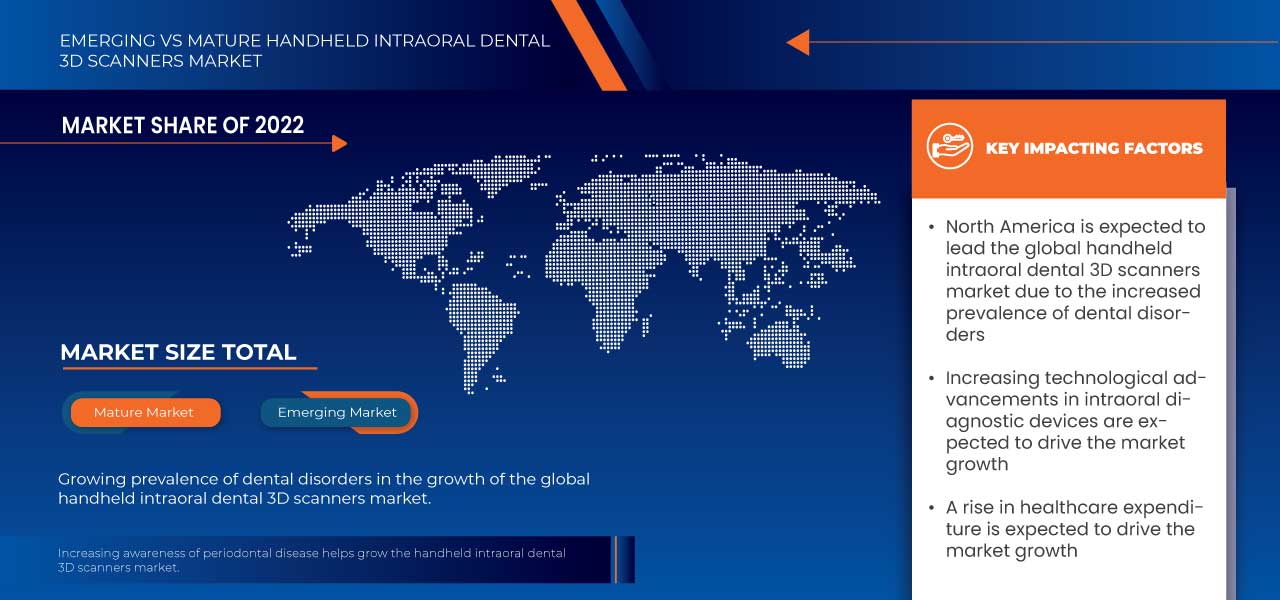
Norteamérica domina el mercado debido a que se espera que la creciente inversión en I+D impulse el crecimiento del mercado. Estados Unidos domina la región de Norteamérica debido a la fuerte presencia de actores clave como Dentsply Sirona, Envista y PLANMECA OY. Alemania domina Europa debido a la producción en masa de productos basados en escáneres 3D intraorales portátiles y a la creciente demanda de los mercados emergentes y la expansión. China domina la región de Asia-Pacífico debido al aumento de los procedimientos dentales que utilizan escáneres intraorales.
La sección de países del informe también proporciona factores de impacto individuales en el mercado y cambios en la regulación en el mercado a nivel nacional que afectan las tendencias actuales y futuras del mercado. Los puntos de datos como nuevas ventas, ventas de reemplazo, demografía del país, leyes regulatorias y aranceles de importación y exportación son algunos de los principales indicadores utilizados para pronosticar el escenario del mercado para países individuales. Además, la presencia y disponibilidad de marcas globales y sus desafíos enfrentados debido a la competencia grande o escasa de las marcas locales y nacionales, y el impacto de los canales de venta se consideran al proporcionar un análisis de pronóstico de los datos del país.
Análisis del panorama competitivo y de la cuota de mercado global de escáneres intraorales 3D portátiles para odontología
El panorama competitivo del mercado global de escáneres intraorales 3D portátiles para odontología proporciona detalles por competidor. Los detalles incluidos son una descripción general de la empresa, las finanzas de la empresa, los ingresos generados, el potencial de mercado, la inversión en I+D, las nuevas iniciativas de mercado, los sitios e instalaciones de producción, las fortalezas y debilidades de la empresa, el lanzamiento de productos, las aprobaciones de productos, la amplitud y la extensión de los productos, el dominio de las aplicaciones, la curva de vida del tipo de producto. Los puntos de datos anteriores proporcionados solo están relacionados con el enfoque de la empresa en el mercado global de escáneres intraorales 3D portátiles para odontología.
Algunos de los principales actores que operan en el mercado global de escáneres 3D intraorales portátiles para odontología son: Dentsply Sirona (EE. UU.), Envista (EE. UU.), PLANMECA OY (Finlandia), Align Technology, Inc. (EE. UU.), Medit Corp. (Corea del Sur), 3Shape A/S. (Dinamarca), 3DISC (EE. UU.), Guangdong Launca Medical Device Technology Co., Ltd (China), Denterprise International (EE. UU.), Institut Straumann AG (Suiza), VATECH (Corea del Sur), entre otros.
SKU-
Obtenga acceso en línea al informe sobre la primera nube de inteligencia de mercado del mundo

- Panel de análisis de datos interactivo
- Panel de análisis de empresas para oportunidades con alto potencial de crecimiento
- Acceso de analista de investigación para personalización y consultas
- Análisis de la competencia con panel interactivo
- Últimas noticias, actualizaciones y análisis de tendencias
- Aproveche el poder del análisis de referencia para un seguimiento integral de la competencia
Tabla de contenido
1 INTRODUCTION
1.1 OBJECTIVES OF THE STUDY
1.2 MARKET DEFINITION
1.3 OVERVIEW OF THE GLOBAL HANDHELD INTRAORAL DENTAL 3D SCANNERS MARKET
1.4 LIMITATIONS
1.5 MARKETS COVERED
2 MARKET SEGMENTATION
2.1 MARKETS COVERED
2.2 GEOGRAPHICAL SCOPE
2.3 YEARS CONSIDERED FOR THE STUDY
2.4 CURRENCY AND PRICING
2.5 DBMR TRIPOD DATA VALIDATION MODEL
2.6 MULTIVARIATE MODELLING
2.7 MODALITY LIFELINE CURVE
2.8 PRIMARY INTERVIEWS WITH KEY OPINION LEADERS
2.9 DBMR MARKET POSITION GRID
2.1 MARKET APPLICATION COVERAGE GRID
2.11 VENDOR SHARE ANALYSIS
2.12 SECONDARY SOURCES
2.13 ASSUMPTIONS
3 EXECUTIVE SUMMARY
4 PREMIUM INSIGHTS
4.1 PESTEL ANALYSIS
4.2 PORTER’S FIVE FORCES
4.3 KEY STRATEGIC INITIATIVES
5 GLOBAL HANDHELD INTRAORAL DENTAL 3D SCANNERS MARKET: REGULATIONS
6 MARKET OVERVIEW
6.1 DRIVERS
6.1.1 RISING VOLUME OF PATIENTS SUFFERING FROM EDENTULISM
6.1.2 RISING MEDICAL TOURISM FOR DENTAL PROCEDURES
6.1.3 ENHANCED PATIENT EXPERIENCE AND IMPROVED DIAGNOSTIC CAPABILITIES
6.1.4 INCREASING AWARENESS REGARDING PERIODONTAL DISEASE
6.2 RESTRAINTS
6.2.1 HIGH COST ASSOCIATED WITH THE USAGE OF PRODUCT
6.2.2 RISING COMPETITION AMONG MARKET PLAYERS
6.3 OPPORTUNITIES
6.3.1 RISING NOVEL TECHNOLOGICAL ADVANCEMENTS
6.3.2 INCREASING FUNDING AND RESEARCH & DEVELOPMENT ACTIVITIES
6.4 CHALLENGES
6.4.1 LACK OF SKILLED PROFESSIONALS DUE TO TECHNOLOGICAL ADVANCEMENTS
6.4.2 STRINGENT REGULATORY FRAMEWORK
7 GLOBAL HANDHELD INTRAORAL DENTAL 3D SCANNERS MARKET, BY MODALITY
7.1 OVERVIEW
7.2 PORTABLE
7.3 STANDALONE
8 GLOBAL HANDHELD INTRAORAL DENTAL 3D SCANNERS MARKET, BY TYPE
8.1 OVERVIEW
8.2 POWDER-FREE INTRAORAL SCANNERS
8.2.1 PORTABLE
8.2.2 STANDALONE
8.3 POWDER-BASED INTRAORAL SCANNERS
8.3.1 PORTABLE
8.3.2 STANDALONE
9 GLOBAL HANDHELD INTRAORAL DENTAL 3D SCANNERS MARKET, BY CONNECTIVITY
9.1 OVERVIEW
9.2 WIRED
9.3 WIRELESS
10 GLOBAL HANDHELD INTRAORAL DENTAL 3D SCANNERS MARKET, BY TECHNOLOGY
10.1 OVERVIEW
10.2 CONFOCAL MICROSCOPIC IMAGING
10.3 OPTICAL WAND
11 GLOBAL HANDHELD INTRAORAL DENTAL 3D SCANNERS MARKET, BY APPLICATION
11.1 OVERVIEW
11.2 ENDODONTICS
11.3 DENTAL RESTORATION
11.4 ORTHODONTICS
11.5 PERIODONTICS
11.6 OTHERS
12 GLOBAL HANDHELD INTRAORAL DENTAL 3D SCANNERS MARKET, BY END USERS
12.1 OVERVIEW
12.2 HOSPITALS
12.3 DENTAL CLINICS
12.4 LABORATORIES
12.5 ACADEMIC AND RESEARCH INSTITUTES
12.6 OTHERS
13 GLOBAL HANDHELD INTRAORAL DENTAL 3D SCANNERS MARKET, BY DISTRIBUTION CHANNEL
13.1 OVERVIEW
13.2 DIRECT TENDER
13.3 RETAIL SALES
13.4 OTHERS
14 GLOBAL HANDHELD INTRAORAL DENTAL 3D SCANNERS MARKET, BY REGION
14.1 OVERVIEW
14.2 NORTH AMERICA
14.2.1 U.S.
14.2.2 CANADA
14.2.3 MEXICO
14.3 EUROPE
14.3.1 GERMANY
14.3.2 U.K.
14.3.3 FRANCE
14.3.4 ITALY
14.3.5 RUSSIA
14.3.6 SPAIN
14.3.7 NETHERLANDS
14.3.8 SWITZERLAND
14.3.9 BELGIUM
14.3.10 TURKEY
14.3.11 REST OF EUROPE
14.4 ASIA-PACIFIC
14.4.1 CHINA
14.4.2 JAPAN
14.4.3 INDIA
14.4.4 AUSTRALIA & NEW ZEALAND
14.4.5 SOUTH KOREA
14.4.6 INDONESIA
14.4.7 PHILIPPINES
14.4.8 THAILAND
14.4.9 MALAYSIA
14.4.10 SINAGPORE
14.4.11 REST OF ASIA-PACIFIC
14.5 SOUTH AMERICA
14.5.1 BRAZIL
14.5.2 ARGENTINA
14.5.3 REST OF SOUTH AMERICA
14.6 MIDDLE EAST & AFRICA
14.6.1 SAUDI ARABIA
14.6.2 SOUTH AFRICA
14.6.3 UAE
14.6.4 EGYPT
14.6.5 ISRAEL
14.6.6 REST OF MIDDLE EAST & AFRICA
15 GLOBAL HANDHELD INTRAORAL DENTAL 3D SCANNERS MARKET: COMPANY LANDSCAPE
15.1 COMPANY SHARE ANALYSIS: GLOBAL
15.2 COMPANY SHARE ANALYSIS: NORTH AMERICA
15.3 COMPANY SHARE ANALYSIS: EUROPE
15.4 COMPANY SHARE ANALYSIS: ASIA-PACIFIC
16 SWOT ANALYSIS
17 COMPANY PROFILE
17.1 DENTSPLY SIRONA
17.1.1 COMPANY SNAPSHOT
17.1.2 REVENUE ANALYSIS
17.1.3 COMPANY SHARE ANALYSIS
17.1.4 PRODUCT PORTFOLIO
17.1.5 RECENT DEVELOPMENTS
17.2 ALIGN TECHNOLOGY, INC.
17.2.1 COMPANY SNAPSHOT
17.2.2 RECENT FINANCIALS
17.2.3 COMPANY SHARE ANALYSIS
17.2.4 PRODUCT PORTFOLIO
17.2.5 RECENT DEVELOPMENTS
17.3 3SHAPE A/S
17.3.1 COMPANY SNAPSHOT
17.3.2 COMPANY SHARE ANALYSIS
17.3.3 PRODUCT PORTFOLIO
17.3.4 RECENT DEVELOPMENTS
17.4 PLANMECA OY
17.4.1 COMPANY SNAPSHOT
17.4.2 COMPANY SHARE ANALYSIS
17.4.3 PRODUCT PORTFOLIO
17.4.4 RECENT DEVELOPMENT
17.5 ENVISTA
17.5.1 COMPANY SNAPSHOT
17.5.2 REVENUE ANALYSIS
17.5.3 COMPANY SHARE ANALYSIS
17.5.4 PRODUCT PORTFOLIO
17.5.5 RECENT DEVELOPMENT
17.6 3DISC
17.6.1 COMPANY SNAPSHOT
17.6.2 PRODUCT PORTFOLIO
17.6.3 RECENT DEVELOPMENT
17.7 BLZ DENTAL
17.7.1 COMPANY SNAPSHOT
17.7.2 PRODUCT PORTFOLIO
17.7.3 RECENT DEVELOPMENT
17.8 CONDOR TECHNOLOGIES NV
17.8.1 COMPANY SNAPSHOT
17.8.2 PRODUCT PORTFOLIO
17.8.3 RECENT DEVELOPMENT
17.9 DENSYS LTD
17.9.1 COMPANY SNAPSHOT
17.9.2 PRODUCT PORTFOLIO
17.9.3 RECENT DEVELOPMENT
17.1 DENTERPRISE INTERNATIONALS
17.10.1 COMPANY SNAPSHOT
17.10.2 PRODUCT PORTFOLIO
17.10.3 RECENT DEVELOPMENT
17.11 FUSSEN
17.11.1 COMPANY SNAPSHOT
17.11.2 PRODUCT PORTFOLIO
17.11.3 RECENT DEVELOPMENT
17.12 GC CORPORATION.
17.12.1 COMPANY SNAPSHOT
17.12.2 PRODUCT PORTFOLIO
17.12.3 RECENT DEVELOPMENT
17.13 GUANGDONG LAUNCA MEDICAL DEVICE TECHNOLOGY CO., LTD
17.13.1 COMPANY SNAPSHOT
17.13.2 PRODUCT PORTFOLIO
17.13.3 RECENT DEVELOPMENT
17.14 IMES-ICORE GMBH
17.14.1 COMPANY SNAPSHOT
17.14.2 PRODUCT PORTFOLIO
17.14.3 RECENT DEVELOPMENT
17.15 INSTITUT STRAUMANN AG
17.15.1 COMPANY SNAPSHOT
17.15.2 REVENUE ANALYSIS
17.15.3 PRODUCT PORTFOLIO
17.15.4 RECENT DEVELOPMENTS
17.16 JIANGSU DYNAMIC MEDICAL TECHNOLOGY CO., LTD.
17.16.1 COMPANY SNAPSHOT
17.16.2 PRODUCT PORTFOLIO
17.16.3 RECENT DEVELOPMENT
17.17 MEDIT CORP.
17.17.1 COMPANY SNAPSHOT
17.17.2 PRODUCT PORTFOLIO
17.17.3 RECENT DEVELOPMENT
17.18 MYRAY
17.18.1 COMPANY SNAPSHOT
17.18.2 PRODUCT PORTFOLIO
17.18.3 RECENT DEVELOPMENT
17.19 SHINING 3D
17.19.1 COMPANY SNAPSHOT
17.19.2 PRODUCT PORTFOLIO
17.19.3 RECENT DEVELOPMENTS
17.2 ZIRKONZAHN
17.20.1 COMPANY SNAPSHOT
17.20.2 PRODUCT PORTFOLIO
17.20.3 RECENT DEVELOPMENT
18 QUESTIONNAIRE
19 RELATED REPORTS
Lista de Tablas
TABLE 1 GLOBAL HANDHELD INTRAORAL DENTAL 3D SCANNERS MARKET, BY MODALITY, 2021-2030 (USD THOUSAND)
TABLE 2 GLOBAL PORTABLE IN HANDHELD INTRAORAL DENTAL 3D SCANNERS MARKET, BY REGION, 2021-2030 (USD THOUSAND)
TABLE 3 GLOBAL STANDALONE IN HANDHELD INTRAORAL DENTAL 3D SCANNERS MARKET, BY REGION, 2021-2030 (USD THOUSAND)
TABLE 4 GLOBAL HANDHELD INTRAORAL DENTAL 3D SCANNERS MARKET, BY TYPE, 2021-2030 (USD THOUSAND)
TABLE 5 GLOBAL POWDER-FREE INTRAORAL SCANNERS IN HANDHELD INTRAORAL DENTAL 3D SCANNERS MARKET, BY REGION, 2021-2030 (USD THOUSAND)
TABLE 6 GLOBAL POWDER-FREE INTRAORAL SCANNERS IN HANDHELD INTRAORAL DENTAL 3D SCANNERS MARKET, BY TYPE, 2021-2030 (USD THOUSAND)
TABLE 7 GLOBAL POWDER-BASED INTRAORAL SCANNERS IN HANDHELD INTRAORAL DENTAL 3D SCANNERS MARKET, BY REGION, 2021-2030 (USD THOUSAND)
TABLE 8 GLOBAL POWDER-BASED INTRAORAL SCANNERS IN HANDHELD INTRAORAL DENTAL 3D SCANNERS MARKET, BY TYPE, 2021-2030 (USD THOUSAND)
TABLE 9 GLOBAL HANDHELD INTRAORAL DENTAL 3D SCANNERS MARKET, BY CONNECTIVITY, 2021-2030 (USD THOUSAND)
TABLE 10 GLOBAL WIRED IN HANDHELD INTRAORAL DENTAL 3D SCANNERS MARKET, BY REGION, 2021-2030 (USD THOUSAND)
TABLE 11 GLOBAL WIRELESS IN HANDHELD INTRAORAL DENTAL 3D SCANNERS MARKET, BY REGION, 2021-2030 (USD THOUSAND)
TABLE 12 GLOBAL HANDHELD INTRAORAL DENTAL 3D SCANNERS MARKET, BY TECHNOLOGY, 2021-2030 (USD THOUSAND)
TABLE 13 GLOBAL CONFOCAL MICROSCOPIC IMAGING IN HANDHELD INTRAORAL DENTAL 3D SCANNERS MARKET, BY REGION, 2021-2030 (USD THOUSAND)
TABLE 14 GLOBAL OPTICAL WAND IN HANDHELD INTRAORAL DENTAL 3D SCANNERS MARKET, BY REGION, 2021-2030 (USD THOUSAND)
TABLE 15 GLOBAL HANDHELD INTRAORAL DENTAL 3D SCANNERS MARKET, BY APPLICATION, 2021-2030 (USD THOUSAND)
TABLE 16 GLOBAL ENDODONTICS IN HANDHELD INTRAORAL DENTAL 3D SCANNERS MARKET, BY REGION, 2021-2030 (USD THOUSAND)
TABLE 17 GLOBAL DENTAL RESTORATION IN HANDHELD INTRAORAL DENTAL 3D SCANNERS MARKET, BY REGION, 2021-2030 (USD THOUSAND)
TABLE 18 GLOBAL ORTHODONTICS IN HANDHELD INTRAORAL DENTAL 3D SCANNERS MARKET, BY REGION, 2021-2030 (USD THOUSAND)
TABLE 19 GLOBAL PERIODONTICS IN HANDHELD INTRAORAL DENTAL 3D SCANNERS MARKET, BY REGION, 2021-2030 (USD THOUSAND)
TABLE 20 GLOBAL OTHERS IN HANDHELD INTRAORAL DENTAL 3D SCANNERS MARKET, BY REGION, 2021-2030 (USD THOUSAND)
TABLE 21 GLOBAL HANDHELD INTRAORAL DENTAL 3D SCANNERS MARKET, BY END USERS, 2021-2030 (USD THOUSAND)
TABLE 22 GLOBAL HOSPITALS IN HANDHELD INTRAORAL DENTAL 3D SCANNERS MARKET, BY REGION, 2021-2030 (USD THOUSAND)
TABLE 23 GLOBAL DENTAL CLINICS IN HANDHELD INTRAORAL DENTAL 3D SCANNERS MARKET, BY REGION, 2021-2030 (USD THOUSAND)
TABLE 24 GLOBAL LABORATORIES IN HANDHELD INTRAORAL DENTAL 3D SCANNERS MARKET, BY REGION, 2021-2030 (USD THOUSAND)
TABLE 25 GLOBAL ACADEMIC AND RESEARCH INSTITUTES IN HANDHELD INTRAORAL DENTAL 3D SCANNERS MARKET, BY REGION, 2021-2030 (USD THOUSAND)
TABLE 26 GLOBAL OTHERS IN HANDHELD INTRAORAL DENTAL 3D SCANNERS MARKET, BY REGION, 2021-2030 (USD THOUSAND)
TABLE 27 GLOBAL HANDHELD INTRAORAL DENTAL 3D SCANNERS MARKET, BY DISTRIBUTION CHANNEL, 2021-2030 (USD THOUSAND)
TABLE 28 GLOBAL DIRECT TENDER IN HANDHELD INTRAORAL DENTAL 3D SCANNERS MARKET, BY REGION, 2021-2030 (USD THOUSAND)
TABLE 29 GLOBAL RETAIL SALES IN HANDHELD INTRAORAL DENTAL 3D SCANNERS MARKET, BY REGION, 2021-2030 (USD THOUSAND)
TABLE 30 GLOBAL OTHERS IN HANDHELD INTRAORAL DENTAL 3D SCANNERS MARKET, BY REGION, 2021-2030 (USD THOUSAND)
TABLE 31 GLOBAL HANDHELD INTRAORAL DENTAL 3D SCANNERS MARKET, BY REGION, 2021-2030 (USD THOUSAND)
TABLE 32 NORTH AMERICA HANDHELD INTRAORAL DENTAL 3D SCANNERS MARKET, BY COUNTRY, 2021-2030 (USD THOUSAND)
TABLE 33 NORTH AMERICA HANDHELD INTRAORAL DENTAL 3D SCANNERS MARKET, BY MODALITY, 2021-2030 (USD THOUSAND)
TABLE 34 NORTH AMERICA HANDHELD INTRAORAL DENTAL 3D SCANNERS MARKET, BY MODALITY, 2021-2030 (THOUSANDS UNITS)
TABLE 35 NORTH AMERICA HANDHELD INTRAORAL DENTAL 3D SCANNERS MARKET, BY TYPE, 2021-2030 (USD THOUSAND)
TABLE 36 NORTH AMERICA POWDER-FREE INTRAORAL SCANNERS IN HANDHELD INTRAORAL DENTAL 3D SCANNERS MARKET, BY TYPE, 2021-2030 (USD THOUSAND)
TABLE 37 NORTH AMERICA POWDER-BASED INTRAORAL SCANNERS IN HANDHELD INTRAORAL DENTAL 3D SCANNERS MARKET, BY TYPE, 2021-2030 (USD THOUSAND)
TABLE 38 NORTH AMERICA HANDHELD INTRAORAL DENTAL 3D SCANNERS MARKET, BY CONNECTIVITY, 2021-2030 (USD THOUSAND)
TABLE 39 NORTH AMERICA HANDHELD INTRAORAL DENTAL 3D SCANNERS MARKET, BY TECHNOLOGY, 2021-2030 (USD THOUSAND)
TABLE 40 NORTH AMERICA HANDHELD INTRAORAL DENTAL 3D SCANNERS MARKET, BY APPLICATION, 2021-2030 (USD THOUSAND)
TABLE 41 NORTH AMERICA HANDHELD INTRAORAL DENTAL 3D SCANNERS MARKET, BY END USERS, 2021-2030 (USD THOUSAND)
TABLE 42 NORTH AMERICA HANDHELD INTRAORAL DENTAL 3D SCANNERS MARKET, BY DISTRIBUTION CHANNEL, 2021-2030 (USD THOUSAND)
TABLE 43 U.S. HANDHELD INTRAORAL DENTAL 3D SCANNERS MARKET, BY MODALITY, 2021-2030 (USD THOUSAND)
TABLE 44 U.S. HANDHELD INTRAORAL DENTAL 3D SCANNERS MARKET, BY MODALITY, 2021-2030 (THOUSANDS UNITS)
TABLE 45 U.S. HANDHELD INTRAORAL DENTAL 3D SCANNERS MARKET, BY MODALITY, 2021-2030 (ASP)
TABLE 46 U.S. HANDHELD INTRAORAL DENTAL 3D SCANNERS MARKET, BY TYPE, 2021-2030 (USD THOUSAND)
TABLE 47 U.S. POWDER-FREE INTRAORAL SCANNERS IN HANDHELD INTRAORAL DENTAL 3D SCANNERS MARKET, BY TYPE, 2021-2030 (USD THOUSAND)
TABLE 48 U.S. POWDER-BASED INTRAORAL SCANNERS IN HANDHELD INTRAORAL DENTAL 3D SCANNERS MARKET, BY TYPE, 2021-2030 (USD THOUSAND)
TABLE 49 U.S. HANDHELD INTRAORAL DENTAL 3D SCANNERS MARKET, BY CONNECTIVITY, 2021-2030 (USD THOUSAND)
TABLE 50 U.S. HANDHELD INTRAORAL DENTAL 3D SCANNERS MARKET, BY TECHNOLOGY, 2021-2030 (USD THOUSAND)
TABLE 51 U.S. HANDHELD INTRAORAL DENTAL 3D SCANNERS MARKET, BY APPLICATION, 2021-2030 (USD THOUSAND)
TABLE 52 U.S. HANDHELD INTRAORAL DENTAL 3D SCANNERS MARKET, BY END USERS, 2021-2030 (USD THOUSAND)
TABLE 53 U.S. HANDHELD INTRAORAL DENTAL 3D SCANNERS MARKET, BY DISTRIBUTION CHANNEL, 2021-2030 (USD THOUSAND)
TABLE 54 CANADA HANDHELD INTRAORAL DENTAL 3D SCANNERS MARKET, BY MODALITY, 2021-2030 (USD THOUSAND)
TABLE 55 CANADA HANDHELD INTRAORAL DENTAL 3D SCANNERS MARKET, BY MODALITY, 2021-2030 (THOUSANDS UNITS)
TABLE 56 CANADA HANDHELD INTRAORAL DENTAL 3D SCANNERS MARKET, BY MODALITY, 2021-2030 (ASP)
TABLE 57 CANADA HANDHELD INTRAORAL DENTAL 3D SCANNERS MARKET, BY TYPE, 2021-2030 (USD THOUSAND)
TABLE 58 CANADA POWDER-FREE INTRAORAL SCANNERS IN HANDHELD INTRAORAL DENTAL 3D SCANNERS MARKET, BY TYPE, 2021-2030 (USD THOUSAND)
TABLE 59 CANADA POWDER-BASED INTRAORAL SCANNERS IN HANDHELD INTRAORAL DENTAL 3D SCANNERS MARKET, BY TYPE, 2021-2030 (USD THOUSAND)
TABLE 60 CANADA HANDHELD INTRAORAL DENTAL 3D SCANNERS MARKET, BY CONNECTIVITY, 2021-2030 (USD THOUSAND)
TABLE 61 CANADA HANDHELD INTRAORAL DENTAL 3D SCANNERS MARKET, BY TECHNOLOGY, 2021-2030 (USD THOUSAND)
TABLE 62 CANADA HANDHELD INTRAORAL DENTAL 3D SCANNERS MARKET, BY APPLICATION, 2021-2030 (USD THOUSAND)
TABLE 63 CANADA HANDHELD INTRAORAL DENTAL 3D SCANNERS MARKET, BY END USERS, 2021-2030 (USD THOUSAND)
TABLE 64 CANADA HANDHELD INTRAORAL DENTAL 3D SCANNERS MARKET, BY DISTRIBUTION CHANNEL, 2021-2030 (USD THOUSAND)
TABLE 65 MEXICO HANDHELD INTRAORAL DENTAL 3D SCANNERS MARKET, BY MODALITY, 2021-2030 (USD THOUSAND)
TABLE 66 MEXICO HANDHELD INTRAORAL DENTAL 3D SCANNERS MARKET, BY MODALITY, 2021-2030 (THOUSANDS UNITS)
TABLE 67 MEXICO HANDHELD INTRAORAL DENTAL 3D SCANNERS MARKET, BY MODALITY, 2021-2030 (ASP)
TABLE 68 MEXICO HANDHELD INTRAORAL DENTAL 3D SCANNERS MARKET, BY TYPE, 2021-2030 (USD THOUSAND)
TABLE 69 MEXICO POWDER-FREE INTRAORAL SCANNERS IN HANDHELD INTRAORAL DENTAL 3D SCANNERS MARKET, BY TYPE, 2021-2030 (USD THOUSAND)
TABLE 70 MEXICO POWDER-BASED INTRAORAL SCANNERS IN HANDHELD INTRAORAL DENTAL 3D SCANNERS MARKET, BY TYPE, 2021-2030 (USD THOUSAND)
TABLE 71 MEXICO HANDHELD INTRAORAL DENTAL 3D SCANNERS MARKET, BY CONNECTIVITY, 2021-2030 (USD THOUSAND)
TABLE 72 MEXICO HANDHELD INTRAORAL DENTAL 3D SCANNERS MARKET, BY TECHNOLOGY, 2021-2030 (USD THOUSAND)
TABLE 73 MEXICO HANDHELD INTRAORAL DENTAL 3D SCANNERS MARKET, BY APPLICATION, 2021-2030 (USD THOUSAND)
TABLE 74 MEXICO HANDHELD INTRAORAL DENTAL 3D SCANNERS MARKET, BY END USERS, 2021-2030 (USD THOUSAND)
TABLE 75 MEXICO HANDHELD INTRAORAL DENTAL 3D SCANNERS MARKET, BY DISTRIBUTION CHANNEL, 2021-2030 (USD THOUSAND)
TABLE 76 EUROPE HANDHELD INTRAORAL DENTAL 3D SCANNERS MARKET, BY COUNTRY, 2021-2030 (USD THOUSAND)
TABLE 77 EUROPE HANDHELD INTRAORAL DENTAL 3D SCANNERS MARKET, BY MODALITY, 2021-2030 (USD THOUSAND)
TABLE 78 EUROPE HANDHELD INTRAORAL DENTAL 3D SCANNERS MARKET, BY MODALITY, 2021-2030 (THOUSANDS UNITS)
TABLE 79 EUROPE HANDHELD INTRAORAL DENTAL 3D SCANNERS MARKET, BY TYPE, 2021-2030 (USD THOUSAND)
TABLE 80 EUROPE POWDER-FREE INTRAORAL SCANNERS IN HANDHELD INTRAORAL DENTAL 3D SCANNERS MARKET, BY TYPE, 2021-2030 (USD THOUSAND)
TABLE 81 EUROPE POWDER-FREE INTRAORAL SCANNERS IN HANDHELD INTRAORAL DENTAL 3D SCANNERS MARKET, BY TYPE, 2021-2030 (USD THOUSAND)
TABLE 82 EUROPE HANDHELD INTRAORAL DENTAL 3D SCANNERS MARKET, BY CONNECTIVITY, 2021-2030 (USD THOUSAND)
TABLE 83 EUROPE HANDHELD INTRAORAL DENTAL 3D SCANNERS MARKET, BY TECHNOLOGY, 2021-2030 (USD THOUSAND)
TABLE 84 EUROPE HANDHELD INTRAORAL DENTAL 3D SCANNERS MARKET, BY TECHNOLOGY, 2021-2030 (USD THOUSAND)
TABLE 85 EUROPE HANDHELD INTRAORAL DENTAL 3D SCANNERS MARKET, BY END USERS, 2021-2030 (USD THOUSAND)
TABLE 86 EUROPE HANDHELD INTRAORAL DENTAL 3D SCANNERS MARKET, BY END USERS, 2021-2030 (USD THOUSAND)
TABLE 87 GERMANY HANDHELD INTRAORAL DENTAL 3D SCANNERS MARKET, BY MODALITY, 2021-2030 (USD THOUSAND)
TABLE 88 GERMANY HANDHELD INTRAORAL DENTAL 3D SCANNERS MARKET, BY MODALITY, 2021-2030 (THOUSANDS UNITS)
TABLE 89 GERMANY HANDHELD INTRAORAL DENTAL 3D SCANNERS MARKET, BY MODALITY, 2021-2030 (ASP)
TABLE 90 GERMANY HANDHELD INTRAORAL DENTAL 3D SCANNERS MARKET, BY TYPE, 2021-2030 (USD THOUSAND)
TABLE 91 GERMANY POWDER-FREE INTRAORAL SCANNERS IN HANDHELD INTRAORAL DENTAL 3D SCANNERS MARKET, BY TYPE, 2021-2030 (USD THOUSAND)
TABLE 92 GERMANY POWDER-BASED INTRAORAL SCANNERS IN HANDHELD INTRAORAL DENTAL 3D SCANNERS MARKET, BY TYPE, 2021-2030 (USD THOUSAND)
TABLE 93 GERMANY HANDHELD INTRAORAL DENTAL 3D SCANNERS MARKET, BY CONNECTIVITY, 2021-2030 (USD THOUSAND)
TABLE 94 GERMANY HANDHELD INTRAORAL DENTAL 3D SCANNERS MARKET, BY TECHNOLOGY, 2021-2030 (USD THOUSAND)
TABLE 95 GERMANY HANDHELD INTRAORAL DENTAL 3D SCANNERS MARKET, BY APPLICATION, 2021-2030 (USD THOUSAND)
TABLE 96 GERMANY HANDHELD INTRAORAL DENTAL 3D SCANNERS MARKET, BY END USERS, 2021-2030 (USD THOUSAND)
TABLE 97 GERMANY HANDHELD INTRAORAL DENTAL 3D SCANNERS MARKET, BY DISTRIBUTION CHANNEL, 2021-2030 (USD THOUSAND)
TABLE 98 U.K. HANDHELD INTRAORAL DENTAL 3D SCANNERS MARKET, BY MODALITY, 2021-2030 (USD THOUSAND)
TABLE 99 U.K. HANDHELD INTRAORAL DENTAL 3D SCANNERS MARKET, BY MODALITY, 2021-2030 (THOUSANDS UNITS)
TABLE 100 U.K. HANDHELD INTRAORAL DENTAL 3D SCANNERS MARKET, BY MODALITY, 2021-2030 (ASP)
TABLE 101 U.K. HANDHELD INTRAORAL DENTAL 3D SCANNERS MARKET, BY TYPE, 2021-2030 (USD THOUSAND)
TABLE 102 U.K. POWDER-FREE INTRAORAL SCANNERS IN HANDHELD INTRAORAL DENTAL 3D SCANNERS MARKET, BY TYPE, 2021-2030 (USD THOUSAND)
TABLE 103 U.K. POWDER-BASED INTRAORAL SCANNERS IN HANDHELD INTRAORAL DENTAL 3D SCANNERS MARKET, BY TYPE, 2021-2030 (USD THOUSAND)
TABLE 104 U.K. HANDHELD INTRAORAL DENTAL 3D SCANNERS MARKET, BY CONNECTIVITY, 2021-2030 (USD THOUSAND)
TABLE 105 U.K. HANDHELD INTRAORAL DENTAL 3D SCANNERS MARKET, BY TECHNOLOGY, 2021-2030 (USD THOUSAND)
TABLE 106 U.K. HANDHELD INTRAORAL DENTAL 3D SCANNERS MARKET, BY APPLICATION, 2021-2030 (USD THOUSAND)
TABLE 107 U.K. HANDHELD INTRAORAL DENTAL 3D SCANNERS MARKET, BY END USERS, 2021-2030 (USD THOUSAND)
TABLE 108 U.K. HANDHELD INTRAORAL DENTAL 3D SCANNERS MARKET, BY DISTRIBUTION CHANNEL, 2021-2030 (USD THOUSAND)
TABLE 109 FRANCE HANDHELD INTRAORAL DENTAL 3D SCANNERS MARKET, BY MODALITY, 2021-2030 (USD THOUSAND)
TABLE 110 FRANCE HANDHELD INTRAORAL DENTAL 3D SCANNERS MARKET, BY MODALITY, 2021-2030 (THOUSANDS UNITS)
TABLE 111 FRANCE HANDHELD INTRAORAL DENTAL 3D SCANNERS MARKET, BY MODALITY, 2021-2030 (ASP)
TABLE 112 FRANCE HANDHELD INTRAORAL DENTAL 3D SCANNERS MARKET, BY TYPE, 2021-2030 (USD THOUSAND)
TABLE 113 FRANCE POWDER-FREE INTRAORAL SCANNERS IN HANDHELD INTRAORAL DENTAL 3D SCANNERS MARKET, BY TYPE, 2021-2030 (USD THOUSAND)
TABLE 114 FRANCE POWDER-BASED INTRAORAL SCANNERS IN HANDHELD INTRAORAL DENTAL 3D SCANNERS MARKET, BY TYPE, 2021-2030 (USD THOUSAND)
TABLE 115 FRANCE HANDHELD INTRAORAL DENTAL 3D SCANNERS MARKET, BY CONNECTIVITY, 2021-2030 (USD THOUSAND)
TABLE 116 FRANCE HANDHELD INTRAORAL DENTAL 3D SCANNERS MARKET, BY TECHNOLOGY, 2021-2030 (USD THOUSAND)
TABLE 117 FRANCE HANDHELD INTRAORAL DENTAL 3D SCANNERS MARKET, BY APPLICATION, 2021-2030 (USD THOUSAND)
TABLE 118 FRANCE HANDHELD INTRAORAL DENTAL 3D SCANNERS MARKET, BY END USERS, 2021-2030 (USD THOUSAND)
TABLE 119 FRANCE HANDHELD INTRAORAL DENTAL 3D SCANNERS MARKET, BY DISTRIBUTION CHANNEL, 2021-2030 (USD THOUSAND)
TABLE 120 ITALY HANDHELD INTRAORAL DENTAL 3D SCANNERS MARKET, BY MODALITY, 2021-2030 (USD THOUSAND)
TABLE 121 ITALY HANDHELD INTRAORAL DENTAL 3D SCANNERS MARKET, BY MODALITY, 2021-2030 (THOUSANDS UNITS)
TABLE 122 ITALY HANDHELD INTRAORAL DENTAL 3D SCANNERS MARKET, BY MODALITY, 2021-2030 (ASP)
TABLE 123 ITALY HANDHELD INTRAORAL DENTAL 3D SCANNERS MARKET, BY TYPE, 2021-2030 (USD THOUSAND)
TABLE 124 ITALY POWDER-FREE INTRAORAL SCANNERS IN HANDHELD INTRAORAL DENTAL 3D SCANNERS MARKET, BY TYPE, 2021-2030 (USD THOUSAND)
TABLE 125 ITALY POWDER-BASED INTRAORAL SCANNERS IN HANDHELD INTRAORAL DENTAL 3D SCANNERS MARKET, BY TYPE, 2021-2030 (USD THOUSAND)
TABLE 126 ITALY HANDHELD INTRAORAL DENTAL 3D SCANNERS MARKET, BY CONNECTIVITY, 2021-2030 (USD THOUSAND)
TABLE 127 ITALY HANDHELD INTRAORAL DENTAL 3D SCANNERS MARKET, BY TECHNOLOGY, 2021-2030 (USD THOUSAND)
TABLE 128 ITALY HANDHELD INTRAORAL DENTAL 3D SCANNERS MARKET, BY APPLICATION, 2021-2030 (USD THOUSAND)
TABLE 129 ITALY HANDHELD INTRAORAL DENTAL 3D SCANNERS MARKET, BY END USERS, 2021-2030 (USD THOUSAND)
TABLE 130 ITALY HANDHELD INTRAORAL DENTAL 3D SCANNERS MARKET, BY DISTRIBUTION CHANNEL, 2021-2030 (USD THOUSAND)
TABLE 131 RUSSIA HANDHELD INTRAORAL DENTAL 3D SCANNERS MARKET, BY MODALITY, 2021-2030 (USD THOUSAND)
TABLE 132 RUSSIA HANDHELD INTRAORAL DENTAL 3D SCANNERS MARKET, BY MODALITY, 2021-2030 (THOUSANDS UNITS)
TABLE 133 RUSSIA HANDHELD INTRAORAL DENTAL 3D SCANNERS MARKET, BY MODALITY, 2021-2030 (ASP)
TABLE 134 RUSSIA HANDHELD INTRAORAL DENTAL 3D SCANNERS MARKET, BY TYPE, 2021-2030 (USD THOUSAND)
TABLE 135 RUSSIA POWDER-FREE INTRAORAL SCANNERS IN HANDHELD INTRAORAL DENTAL 3D SCANNERS MARKET, BY TYPE, 2021-2030 (USD THOUSAND)
TABLE 136 RUSSIA POWDER-BASED INTRAORAL SCANNERS IN HANDHELD INTRAORAL DENTAL 3D SCANNERS MARKET, BY TYPE, 2021-2030 (USD THOUSAND)
TABLE 137 RUSSIA HANDHELD INTRAORAL DENTAL 3D SCANNERS MARKET, BY CONNECTIVITY, 2021-2030 (USD THOUSAND)
TABLE 138 RUSSIA HANDHELD INTRAORAL DENTAL 3D SCANNERS MARKET, BY TECHNOLOGY, 2021-2030 (USD THOUSAND)
TABLE 139 RUSSIA HANDHELD INTRAORAL DENTAL 3D SCANNERS MARKET, BY APPLICATION, 2021-2030 (USD THOUSAND)
TABLE 140 RUSSIA HANDHELD INTRAORAL DENTAL 3D SCANNERS MARKET, BY END USERS, 2021-2030 (USD THOUSAND)
TABLE 141 RUSSIA HANDHELD INTRAORAL DENTAL 3D SCANNERS MARKET, BY DISTRIBUTION CHANNEL, 2021-2030 (USD THOUSAND)
TABLE 142 SPAIN HANDHELD INTRAORAL DENTAL 3D SCANNERS MARKET, BY MODALITY, 2021-2030 (USD THOUSAND)
TABLE 143 SPAIN HANDHELD INTRAORAL DENTAL 3D SCANNERS MARKET, BY MODALITY, 2021-2030 (THOUSANDS UNITS)
TABLE 144 SPAIN HANDHELD INTRAORAL DENTAL 3D SCANNERS MARKET, BY MODALITY, 2021-2030 (ASP)
TABLE 145 SPAIN HANDHELD INTRAORAL DENTAL 3D SCANNERS MARKET, BY TYPE, 2021-2030 (USD THOUSAND)
TABLE 146 SPAIN POWDER-FREE INTRAORAL SCANNERS IN HANDHELD INTRAORAL DENTAL 3D SCANNERS MARKET, BY TYPE, 2021-2030 (USD THOUSAND)
TABLE 147 SPAIN POWDER-BASED INTRAORAL SCANNERS IN HANDHELD INTRAORAL DENTAL 3D SCANNERS MARKET, BY TYPE, 2021-2030 (USD THOUSAND)
TABLE 148 SPAIN HANDHELD INTRAORAL DENTAL 3D SCANNERS MARKET, BY CONNECTIVITY, 2021-2030 (USD THOUSAND)
TABLE 149 SPAIN HANDHELD INTRAORAL DENTAL 3D SCANNERS MARKET, BY TECHNOLOGY, 2021-2030 (USD THOUSAND)
TABLE 150 SPAIN HANDHELD INTRAORAL DENTAL 3D SCANNERS MARKET, BY APPLICATION, 2021-2030 (USD THOUSAND)
TABLE 151 SPAIN HANDHELD INTRAORAL DENTAL 3D SCANNERS MARKET, BY END USERS, 2021-2030 (USD THOUSAND)
TABLE 152 SPAIN HANDHELD INTRAORAL DENTAL 3D SCANNERS MARKET, BY DISTRIBUTION CHANNEL, 2021-2030 (USD THOUSAND)
TABLE 153 NETHERLANDS HANDHELD INTRAORAL DENTAL 3D SCANNERS MARKET, BY MODALITY, 2021-2030 (USD THOUSAND)
TABLE 154 NETHERLANDS HANDHELD INTRAORAL DENTAL 3D SCANNERS MARKET, BY MODALITY, 2021-2030 (THOUSANDS UNITS)
TABLE 155 NETHERLANDS HANDHELD INTRAORAL DENTAL 3D SCANNERS MARKET, BY MODALITY, 2021-2030 (ASP)
TABLE 156 NETHERLANDS HANDHELD INTRAORAL DENTAL 3D SCANNERS MARKET, BY TYPE, 2021-2030 (USD THOUSAND)
TABLE 157 NETHERLANDS POWDER-FREE INTRAORAL SCANNERS IN HANDHELD INTRAORAL DENTAL 3D SCANNERS MARKET, BY TYPE, 2021-2030 (USD THOUSAND)
TABLE 158 NETHERLANDS POWDER-BASED INTRAORAL SCANNERS IN HANDHELD INTRAORAL DENTAL 3D SCANNERS MARKET, BY TYPE, 2021-2030 (USD THOUSAND)
TABLE 159 NETHERLANDS HANDHELD INTRAORAL DENTAL 3D SCANNERS MARKET, BY CONNECTIVITY, 2021-2030 (USD THOUSAND)
TABLE 160 NETHERLANDS HANDHELD INTRAORAL DENTAL 3D SCANNERS MARKET, BY TECHNOLOGY, 2021-2030 (USD THOUSAND)
TABLE 161 NETHERLANDS HANDHELD INTRAORAL DENTAL 3D SCANNERS MARKET, BY APPLICATION, 2021-2030 (USD THOUSAND)
TABLE 162 NETHERLANDS HANDHELD INTRAORAL DENTAL 3D SCANNERS MARKET, BY END USERS, 2021-2030 (USD THOUSAND)
TABLE 163 NETHERLANDS HANDHELD INTRAORAL DENTAL 3D SCANNERS MARKET, BY DISTRIBUTION CHANNEL, 2021-2030 (USD THOUSAND)
TABLE 164 SWITZERLAND HANDHELD INTRAORAL DENTAL 3D SCANNERS MARKET, BY MODALITY, 2021-2030 (USD THOUSAND)
TABLE 165 SWITZERLAND HANDHELD INTRAORAL DENTAL 3D SCANNERS MARKET, BY MODALITY, 2021-2030 (THOUSANDS UNITS)
TABLE 166 SWITZERLAND HANDHELD INTRAORAL DENTAL 3D SCANNERS MARKET, BY MODALITY, 2021-2030 (ASP)
TABLE 167 SWITZERLAND HANDHELD INTRAORAL DENTAL 3D SCANNERS MARKET, BY TYPE, 2021-2030 (USD THOUSAND)
TABLE 168 SWITZERLAND POWDER-FREE INTRAORAL SCANNERS IN HANDHELD INTRAORAL DENTAL 3D SCANNERS MARKET, BY TYPE, 2021-2030 (USD THOUSAND)
TABLE 169 SWITZERLAND POWDER-BASED INTRAORAL SCANNERS IN HANDHELD INTRAORAL DENTAL 3D SCANNERS MARKET, BY TYPE, 2021-2030 (USD THOUSAND)
TABLE 170 SWITZERLAND HANDHELD INTRAORAL DENTAL 3D SCANNERS MARKET, BY CONNECTIVITY, 2021-2030 (USD THOUSAND)
TABLE 171 SWITZERLAND HANDHELD INTRAORAL DENTAL 3D SCANNERS MARKET, BY TECHNOLOGY, 2021-2030 (USD THOUSAND)
TABLE 172 SWITZERLAND HANDHELD INTRAORAL DENTAL 3D SCANNERS MARKET, BY APPLICATION, 2021-2030 (USD THOUSAND)
TABLE 173 SWITZERLAND HANDHELD INTRAORAL DENTAL 3D SCANNERS MARKET, BY END USERS, 2021-2030 (USD THOUSAND)
TABLE 174 SWITZERLAND HANDHELD INTRAORAL DENTAL 3D SCANNERS MARKET, BY DISTRIBUTION CHANNEL, 2021-2030 (USD THOUSAND)
TABLE 175 BELGIUM HANDHELD INTRAORAL DENTAL 3D SCANNERS MARKET, BY MODALITY, 2021-2030 (USD THOUSAND)
TABLE 176 BELGIUM HANDHELD INTRAORAL DENTAL 3D SCANNERS MARKET, BY MODALITY, 2021-2030 (THOUSANDS UNITS)
TABLE 177 BELGIUM HANDHELD INTRAORAL DENTAL 3D SCANNERS MARKET, BY MODALITY, 2021-2030 (ASP)
TABLE 178 BELGIUM HANDHELD INTRAORAL DENTAL 3D SCANNERS MARKET, BY TYPE, 2021-2030 (USD THOUSAND)
TABLE 179 BELGIUM POWDER-FREE INTRAORAL SCANNERS IN HANDHELD INTRAORAL DENTAL 3D SCANNERS MARKET, BY TYPE, 2021-2030 (USD THOUSAND)
TABLE 180 BELGIUM POWDER-BASED INTRAORAL SCANNERS IN HANDHELD INTRAORAL DENTAL 3D SCANNERS MARKET, BY TYPE, 2021-2030 (USD THOUSAND)
TABLE 181 BELGIUM HANDHELD INTRAORAL DENTAL 3D SCANNERS MARKET, BY CONNECTIVITY, 2021-2030 (USD THOUSAND)
TABLE 182 BELGIUM HANDHELD INTRAORAL DENTAL 3D SCANNERS MARKET, BY TECHNOLOGY, 2021-2030 (USD THOUSAND)
TABLE 183 BELGIUM HANDHELD INTRAORAL DENTAL 3D SCANNERS MARKET, BY APPLICATION, 2021-2030 (USD THOUSAND)
TABLE 184 BELGIUM HANDHELD INTRAORAL DENTAL 3D SCANNERS MARKET, BY END USERS, 2021-2030 (USD THOUSAND)
TABLE 185 BELGIUM HANDHELD INTRAORAL DENTAL 3D SCANNERS MARKET, BY DISTRIBUTION CHANNEL, 2021-2030 (USD THOUSAND)
TABLE 186 TURKEY HANDHELD INTRAORAL DENTAL 3D SCANNERS MARKET, BY MODALITY, 2021-2030 (USD THOUSAND)
TABLE 187 TURKEY HANDHELD INTRAORAL DENTAL 3D SCANNERS MARKET, BY MODALITY, 2021-2030 (THOUSANDS UNITS)
TABLE 188 TURKEY HANDHELD INTRAORAL DENTAL 3D SCANNERS MARKET, BY MODALITY, 2021-2030 (ASP)
TABLE 189 TURKEY HANDHELD INTRAORAL DENTAL 3D SCANNERS MARKET, BY TYPE, 2021-2030 (USD THOUSAND)
TABLE 190 TURKEY POWDER-FREE INTRAORAL SCANNERS IN HANDHELD INTRAORAL DENTAL 3D SCANNERS MARKET, BY TYPE, 2021-2030 (USD THOUSAND)
TABLE 191 TURKEY POWDER-BASED INTRAORAL SCANNERS IN HANDHELD INTRAORAL DENTAL 3D SCANNERS MARKET, BY TYPE, 2021-2030 (USD THOUSAND)
TABLE 192 TURKEY HANDHELD INTRAORAL DENTAL 3D SCANNERS MARKET, BY CONNECTIVITY, 2021-2030 (USD THOUSAND)
TABLE 193 TURKEY HANDHELD INTRAORAL DENTAL 3D SCANNERS MARKET, BY TECHNOLOGY, 2021-2030 (USD THOUSAND)
TABLE 194 TURKEY HANDHELD INTRAORAL DENTAL 3D SCANNERS MARKET, BY APPLICATION, 2021-2030 (USD THOUSAND)
TABLE 195 TURKEY HANDHELD INTRAORAL DENTAL 3D SCANNERS MARKET, BY END USERS, 2021-2030 (USD THOUSAND)
TABLE 196 TURKEY HANDHELD INTRAORAL DENTAL 3D SCANNERS MARKET, BY DISTRIBUTION CHANNEL, 2021-2030 (USD THOUSAND)
TABLE 197 REST OF EUROPE HANDHELD INTRAORAL DENTAL 3D SCANNERS MARKET, BY MODALITY, 2021-2030 (USD THOUSAND)
TABLE 198 ASIA-PACIFIC HANDHELD INTRAORAL DENTAL 3D SCANNERS MARKET, BY COUNTRY, 2021-2030 (USD THOUSAND)
TABLE 199 ASIA-PACIFIC HANDHELD INTRAORAL DENTAL 3D SCANNERS MARKET, BY MODALITY, 2021-2030 (USD THOUSAND)
TABLE 200 ASIA-PACIFIC HANDHELD INTRAORAL DENTAL 3D SCANNERS MARKET, BY MODALITY, 2021-2030 (THOUSANDS UNITS)
TABLE 201 ASIA-PACIFIC HANDHELD INTRAORAL DENTAL 3D SCANNERS MARKET, BY TYPE, 2021-2030 (USD THOUSAND)
TABLE 202 ASIA-PACIFIC POWDER-FREE INTRAORAL SCANNERS IN HANDHELD INTRAORAL DENTAL 3D SCANNERS MARKET, BY TYPE, 2021-2030 (USD THOUSAND)
TABLE 203 ASIA-PACIFIC POWDER-BASED INTRAORAL SCANNERS IN HANDHELD INTRAORAL DENTAL 3D SCANNERS MARKET, BY TYPE, 2021-2030 (USD THOUSAND)
TABLE 204 ASIA-PACIFIC HANDHELD INTRAORAL DENTAL 3D SCANNERS MARKET, BY CONNECTIVITY, 2021-2030 (USD THOUSAND)
TABLE 205 ASIA-PACIFIC HANDHELD INTRAORAL DENTAL 3D SCANNERS MARKET, BY TECHNOLOGY, 2021-2030 (USD THOUSAND)
TABLE 206 ASIA-PACIFIC HANDHELD INTRAORAL DENTAL 3D SCANNERS MARKET, BY APPLICATION, 2021-2030 (USD THOUSAND)
TABLE 207 ASIA-PACIFIC HANDHELD INTRAORAL DENTAL 3D SCANNERS MARKET, BY END USERS, 2021-2030 (USD THOUSAND)
TABLE 208 ASIA-PACIFIC HANDHELD INTRAORAL DENTAL 3D SCANNERS MARKET, BY DISTRIBUTION CHANNEL, 2021-2030 (USD THOUSAND)
TABLE 209 CHINA HANDHELD INTRAORAL DENTAL 3D SCANNERS MARKET, BY MODALITY, 2021-2030 (USD THOUSAND)
TABLE 210 CHINA HANDHELD INTRAORAL DENTAL 3D SCANNERS MARKET, BY MODALITY, 2021-2030 (THOUSANDS UNITS)
TABLE 211 CHINA HANDHELD INTRAORAL DENTAL 3D SCANNERS MARKET, BY MODALITY, 2021-2030 (ASP)
TABLE 212 CHINA HANDHELD INTRAORAL DENTAL 3D SCANNERS MARKET, BY TYPE, 2021-2030 (USD THOUSAND)
TABLE 213 CHINA POWDER-FREE INTRAORAL SCANNERS IN HANDHELD INTRAORAL DENTAL 3D SCANNERS MARKET, BY TYPE, 2021-2030 (USD THOUSAND)
TABLE 214 CHINA POWDER-BASED INTRAORAL SCANNERS IN HANDHELD INTRAORAL DENTAL 3D SCANNERS MARKET, BY TYPE, 2021-2030 (USD THOUSAND)
TABLE 215 CHINA HANDHELD INTRAORAL DENTAL 3D SCANNERS MARKET, BY CONNECTIVITY, 2021-2030 (USD THOUSAND)
TABLE 216 CHINA HANDHELD INTRAORAL DENTAL 3D SCANNERS MARKET, BY TECHNOLOGY, 2021-2030 (USD THOUSAND)
TABLE 217 CHINA HANDHELD INTRAORAL DENTAL 3D SCANNERS MARKET, BY APPLICATION, 2021-2030 (USD THOUSAND)
TABLE 218 CHINA HANDHELD INTRAORAL DENTAL 3D SCANNERS MARKET, BY END USERS, 2021-2030 (USD THOUSAND)
TABLE 219 CHINA HANDHELD INTRAORAL DENTAL 3D SCANNERS MARKET, BY DISTRIBUTION CHANNEL, 2021-2030 (USD THOUSAND)
TABLE 220 JAPAN HANDHELD INTRAORAL DENTAL 3D SCANNERS MARKET, BY MODALITY, 2021-2030 (USD THOUSAND)
TABLE 221 JAPAN HANDHELD INTRAORAL DENTAL 3D SCANNERS MARKET, BY MODALITY, 2021-2030 (THOUSANDS UNITS)
TABLE 222 JAPAN HANDHELD INTRAORAL DENTAL 3D SCANNERS MARKET, BY MODALITY, 2021-2030 (ASP)
TABLE 223 JAPAN HANDHELD INTRAORAL DENTAL 3D SCANNERS MARKET, BY TYPE, 2021-2030 (USD THOUSAND)
TABLE 224 JAPAN POWDER-FREE INTRAORAL SCANNERS IN HANDHELD INTRAORAL DENTAL 3D SCANNERS MARKET, BY TYPE, 2021-2030 (USD THOUSAND)
TABLE 225 JAPAN POWDER-BASED INTRAORAL SCANNERS IN HANDHELD INTRAORAL DENTAL 3D SCANNERS MARKET, BY TYPE, 2021-2030 (USD THOUSAND)
TABLE 226 JAPAN HANDHELD INTRAORAL DENTAL 3D SCANNERS MARKET, BY CONNECTIVITY, 2021-2030 (USD THOUSAND)
TABLE 227 JAPAN HANDHELD INTRAORAL DENTAL 3D SCANNERS MARKET, BY TECHNOLOGY, 2021-2030 (USD THOUSAND)
TABLE 228 JAPAN HANDHELD INTRAORAL DENTAL 3D SCANNERS MARKET, BY APPLICATION, 2021-2030 (USD THOUSAND)
TABLE 229 JAPAN HANDHELD INTRAORAL DENTAL 3D SCANNERS MARKET, BY END USERS, 2021-2030 (USD THOUSAND)
TABLE 230 JAPAN HANDHELD INTRAORAL DENTAL 3D SCANNERS MARKET, BY DISTRIBUTION CHANNEL, 2021-2030 (USD THOUSAND)
TABLE 231 INDIA HANDHELD INTRAORAL DENTAL 3D SCANNERS MARKET, BY MODALITY, 2021-2030 (USD THOUSAND)
TABLE 232 INDIA HANDHELD INTRAORAL DENTAL 3D SCANNERS MARKET, BY MODALITY, 2021-2030 (THOUSANDS UNITS)
TABLE 233 INDIA HANDHELD INTRAORAL DENTAL 3D SCANNERS MARKET, BY MODALITY, 2021-2030 (ASP)
TABLE 234 INDIA HANDHELD INTRAORAL DENTAL 3D SCANNERS MARKET, BY TYPE, 2021-2030 (USD THOUSAND)
TABLE 235 INDIA POWDER-FREE INTRAORAL SCANNERS IN HANDHELD INTRAORAL DENTAL 3D SCANNERS MARKET, BY TYPE, 2021-2030 (USD THOUSAND)
TABLE 236 INDIA POWDER-BASED INTRAORAL SCANNERS IN HANDHELD INTRAORAL DENTAL 3D SCANNERS MARKET, BY TYPE, 2021-2030 (USD THOUSAND)
TABLE 237 INDIA HANDHELD INTRAORAL DENTAL 3D SCANNERS MARKET, BY CONNECTIVITY, 2021-2030 (USD THOUSAND)
TABLE 238 INDIA HANDHELD INTRAORAL DENTAL 3D SCANNERS MARKET, BY TECHNOLOGY, 2021-2030 (USD THOUSAND)
TABLE 239 INDIA HANDHELD INTRAORAL DENTAL 3D SCANNERS MARKET, BY APPLICATION, 2021-2030 (USD THOUSAND)
TABLE 240 INDIA HANDHELD INTRAORAL DENTAL 3D SCANNERS MARKET, BY END USERS, 2021-2030 (USD THOUSAND)
TABLE 241 INDIA HANDHELD INTRAORAL DENTAL 3D SCANNERS MARKET, BY DISTRIBUTION CHANNEL, 2021-2030 (USD THOUSAND)
TABLE 242 AUSTRALIA & NEW ZEALAND HANDHELD INTRAORAL DENTAL 3D SCANNERS MARKET, BY MODALITY, 2021-2030 (USD THOUSAND)
TABLE 243 AUSTRALIA & NEW ZEALAND HANDHELD INTRAORAL DENTAL 3D SCANNERS MARKET, BY MODALITY, 2021-2030 (THOUSANDS UNITS)
TABLE 244 AUSTRALIA & NEW ZEALAND HANDHELD INTRAORAL DENTAL 3D SCANNERS MARKET, BY MODALITY, 2021-2030 (ASP)
TABLE 245 AUSTRALIA & NEW ZEALAND HANDHELD INTRAORAL DENTAL 3D SCANNERS MARKET, BY TYPE, 2021-2030 (USD THOUSAND)
TABLE 246 AUSTRALIA & NEW ZEALAND POWDER-FREE INTRAORAL SCANNERS IN HANDHELD INTRAORAL DENTAL 3D SCANNERS MARKET, BY TYPE, 2021-2030 (USD THOUSAND)
TABLE 247 AUSTRALIA & NEW ZEALAND POWDER-BASED INTRAORAL SCANNERS IN HANDHELD INTRAORAL DENTAL 3D SCANNERS MARKET, BY TYPE, 2021-2030 (USD THOUSAND)
TABLE 248 AUSTRALIA & NEW ZEALAND HANDHELD INTRAORAL DENTAL 3D SCANNERS MARKET, BY CONNECTIVITY, 2021-2030 (USD THOUSAND)
TABLE 249 AUSTRALIA & NEW ZEALAND HANDHELD INTRAORAL DENTAL 3D SCANNERS MARKET, BY TECHNOLOGY, 2021-2030 (USD THOUSAND)
TABLE 250 AUSTRALIA & NEW ZEALAND HANDHELD INTRAORAL DENTAL 3D SCANNERS MARKET, BY APPLICATION, 2021-2030 (USD THOUSAND)
TABLE 251 AUSTRALIA & NEW ZEALAND HANDHELD INTRAORAL DENTAL 3D SCANNERS MARKET, BY END USERS, 2021-2030 (USD THOUSAND)
TABLE 252 AUSTRALIA & NEW ZEALAND HANDHELD INTRAORAL DENTAL 3D SCANNERS MARKET, BY DISTRIBUTION CHANNEL, 2021-2030 (USD THOUSAND)
TABLE 253 SOUTH KOREA HANDHELD INTRAORAL DENTAL 3D SCANNERS MARKET, BY MODALITY, 2021-2030 (USD THOUSAND)
TABLE 254 SOUTH KOREA HANDHELD INTRAORAL DENTAL 3D SCANNERS MARKET, BY MODALITY, 2021-2030 (THOUSANDS UNITS)
TABLE 255 SOUTH KOREA HANDHELD INTRAORAL DENTAL 3D SCANNERS MARKET, BY MODALITY, 2021-2030 (ASP)
TABLE 256 SOUTH KOREA HANDHELD INTRAORAL DENTAL 3D SCANNERS MARKET, BY TYPE, 2021-2030 (USD THOUSAND)
TABLE 257 SOUTH KOREA POWDER-FREE INTRAORAL SCANNERS IN HANDHELD INTRAORAL DENTAL 3D SCANNERS MARKET, BY TYPE, 2021-2030 (USD THOUSAND)
TABLE 258 SOUTH KOREA POWDER-BASED INTRAORAL SCANNERS IN HANDHELD INTRAORAL DENTAL 3D SCANNERS MARKET, BY TYPE, 2021-2030 (USD THOUSAND)
TABLE 259 SOUTH KOREA HANDHELD INTRAORAL DENTAL 3D SCANNERS MARKET, BY CONNECTIVITY, 2021-2030 (USD THOUSAND)
TABLE 260 SOUTH KOREA HANDHELD INTRAORAL DENTAL 3D SCANNERS MARKET, BY TECHNOLOGY, 2021-2030 (USD THOUSAND)
TABLE 261 SOUTH KOREA HANDHELD INTRAORAL DENTAL 3D SCANNERS MARKET, BY APPLICATION, 2021-2030 (USD THOUSAND)
TABLE 262 SOUTH KOREA HANDHELD INTRAORAL DENTAL 3D SCANNERS MARKET, BY END USERS, 2021-2030 (USD THOUSAND)
TABLE 263 SOUTH KOREA HANDHELD INTRAORAL DENTAL 3D SCANNERS MARKET, BY DISTRIBUTION CHANNEL, 2021-2030 (USD THOUSAND)
TABLE 264 INDONESIA HANDHELD INTRAORAL DENTAL 3D SCANNERS MARKET, BY MODALITY, 2021-2030 (USD THOUSAND)
TABLE 265 INDONESIA HANDHELD INTRAORAL DENTAL 3D SCANNERS MARKET, BY MODALITY, 2021-2030 (THOUSANDS UNITS)
TABLE 266 INDONESIA HANDHELD INTRAORAL DENTAL 3D SCANNERS MARKET, BY MODALITY, 2021-2030 (ASP)
TABLE 267 INDONESIA HANDHELD INTRAORAL DENTAL 3D SCANNERS MARKET, BY TYPE, 2021-2030 (USD THOUSAND)
TABLE 268 INDONESIA POWDER-FREE INTRAORAL SCANNERS IN HANDHELD INTRAORAL DENTAL 3D SCANNERS MARKET, BY TYPE, 2021-2030 (USD THOUSAND)
TABLE 269 INDONESIA POWDER-BASED INTRAORAL SCANNERS IN HANDHELD INTRAORAL DENTAL 3D SCANNERS MARKET, BY TYPE, 2021-2030 (USD THOUSAND)
TABLE 270 INDONESIA HANDHELD INTRAORAL DENTAL 3D SCANNERS MARKET, BY CONNECTIVITY, 2021-2030 (USD THOUSAND)
TABLE 271 INDONESIA HANDHELD INTRAORAL DENTAL 3D SCANNERS MARKET, BY TECHNOLOGY, 2021-2030 (USD THOUSAND)
TABLE 272 INDONESIA HANDHELD INTRAORAL DENTAL 3D SCANNERS MARKET, BY APPLICATION, 2021-2030 (USD THOUSAND)
TABLE 273 INDONESIA HANDHELD INTRAORAL DENTAL 3D SCANNERS MARKET, BY END USERS, 2021-2030 (USD THOUSAND)
TABLE 274 INDONESIA HANDHELD INTRAORAL DENTAL 3D SCANNERS MARKET, BY DISTRIBUTION CHANNEL, 2021-2030 (USD THOUSAND)
TABLE 275 PHILIPPINES HANDHELD INTRAORAL DENTAL 3D SCANNERS MARKET, BY MODALITY, 2021-2030 (USD THOUSAND)
TABLE 276 PHILIPPINES HANDHELD INTRAORAL DENTAL 3D SCANNERS MARKET, BY MODALITY, 2021-2030 (THOUSANDS UNITS)
TABLE 277 PHILIPPINES HANDHELD INTRAORAL DENTAL 3D SCANNERS MARKET, BY MODALITY, 2021-2030 (ASP)
TABLE 278 PHILIPPINES HANDHELD INTRAORAL DENTAL 3D SCANNERS MARKET, BY TYPE, 2021-2030 (USD THOUSAND)
TABLE 279 PHILIPPINES POWDER-FREE INTRAORAL SCANNERS IN HANDHELD INTRAORAL DENTAL 3D SCANNERS MARKET, BY TYPE, 2021-2030 (USD THOUSAND)
TABLE 280 PHILIPPINES POWDER-BASED INTRAORAL SCANNERS IN HANDHELD INTRAORAL DENTAL 3D SCANNERS MARKET, BY TYPE, 2021-2030 (USD THOUSAND)
TABLE 281 PHILIPPINES HANDHELD INTRAORAL DENTAL 3D SCANNERS MARKET, BY CONNECTIVITY, 2021-2030 (USD THOUSAND)
TABLE 282 PHILIPPINES HANDHELD INTRAORAL DENTAL 3D SCANNERS MARKET, BY TECHNOLOGY, 2021-2030 (USD THOUSAND)
TABLE 283 PHILIPPINES HANDHELD INTRAORAL DENTAL 3D SCANNERS MARKET, BY APPLICATION, 2021-2030 (USD THOUSAND)
TABLE 284 PHILIPPINES HANDHELD INTRAORAL DENTAL 3D SCANNERS MARKET, BY END USERS, 2021-2030 (USD THOUSAND)
TABLE 285 PHILIPPINES HANDHELD INTRAORAL DENTAL 3D SCANNERS MARKET, BY DISTRIBUTION CHANNEL, 2021-2030 (USD THOUSAND)
TABLE 286 THAILAND HANDHELD INTRAORAL DENTAL 3D SCANNERS MARKET, BY MODALITY, 2021-2030 (USD THOUSAND)
TABLE 287 THAILAND HANDHELD INTRAORAL DENTAL 3D SCANNERS MARKET, BY MODALITY, 2021-2030 (THOUSANDS UNITS)
TABLE 288 THAILAND HANDHELD INTRAORAL DENTAL 3D SCANNERS MARKET, BY MODALITY, 2021-2030 (ASP)
TABLE 289 THAILAND HANDHELD INTRAORAL DENTAL 3D SCANNERS MARKET, BY TYPE, 2021-2030 (USD THOUSAND)
TABLE 290 THAILAND POWDER-FREE INTRAORAL SCANNERS IN HANDHELD INTRAORAL DENTAL 3D SCANNERS MARKET, BY TYPE, 2021-2030 (USD THOUSAND)
TABLE 291 THAILAND POWDER-BASED INTRAORAL SCANNERS IN HANDHELD INTRAORAL DENTAL 3D SCANNERS MARKET, BY TYPE, 2021-2030 (USD THOUSAND)
TABLE 292 THAILAND HANDHELD INTRAORAL DENTAL 3D SCANNERS MARKET, BY CONNECTIVITY, 2021-2030 (USD THOUSAND)
TABLE 293 THAILAND HANDHELD INTRAORAL DENTAL 3D SCANNERS MARKET, BY TECHNOLOGY, 2021-2030 (USD THOUSAND)
TABLE 294 THAILAND HANDHELD INTRAORAL DENTAL 3D SCANNERS MARKET, BY APPLICATION, 2021-2030 (USD THOUSAND)
TABLE 295 THAILAND HANDHELD INTRAORAL DENTAL 3D SCANNERS MARKET, BY END USERS, 2021-2030 (USD THOUSAND)
TABLE 296 THAILAND HANDHELD INTRAORAL DENTAL 3D SCANNERS MARKET, BY DISTRIBUTION CHANNEL, 2021-2030 (USD THOUSAND)
TABLE 297 MALAYSIA HANDHELD INTRAORAL DENTAL 3D SCANNERS MARKET, BY MODALITY, 2021-2030 (USD THOUSAND)
TABLE 298 MALAYSIA HANDHELD INTRAORAL DENTAL 3D SCANNERS MARKET, BY MODALITY, 2021-2030 (THOUSANDS UNITS)
TABLE 299 MALAYSIA HANDHELD INTRAORAL DENTAL 3D SCANNERS MARKET, BY MODALITY, 2021-2030 (ASP)
TABLE 300 MALAYSIA HANDHELD INTRAORAL DENTAL 3D SCANNERS MARKET, BY TYPE, 2021-2030 (USD THOUSAND)
TABLE 301 MALAYSIA POWDER-FREE INTRAORAL SCANNERS IN HANDHELD INTRAORAL DENTAL 3D SCANNERS MARKET, BY TYPE, 2021-2030 (USD THOUSAND)
TABLE 302 MALAYSIA POWDER-BASED INTRAORAL SCANNERS IN HANDHELD INTRAORAL DENTAL 3D SCANNERS MARKET, BY TYPE, 2021-2030 (USD THOUSAND)
TABLE 303 MALAYSIA HANDHELD INTRAORAL DENTAL 3D SCANNERS MARKET, BY CONNECTIVITY, 2021-2030 (USD THOUSAND)
TABLE 304 MALAYSIA HANDHELD INTRAORAL DENTAL 3D SCANNERS MARKET, BY TECHNOLOGY, 2021-2030 (USD THOUSAND)
TABLE 305 MALAYSIA HANDHELD INTRAORAL DENTAL 3D SCANNERS MARKET, BY APPLICATION, 2021-2030 (USD THOUSAND)
TABLE 306 MALAYSIA HANDHELD INTRAORAL DENTAL 3D SCANNERS MARKET, BY END USERS, 2021-2030 (USD THOUSAND)
TABLE 307 MALAYSIA HANDHELD INTRAORAL DENTAL 3D SCANNERS MARKET, BY DISTRIBUTION CHANNEL, 2021-2030 (USD THOUSAND)
TABLE 308 SINGAPORE HANDHELD INTRAORAL DENTAL 3D SCANNERS MARKET, BY MODALITY, 2021-2030 (USD THOUSAND)
TABLE 309 SINGAPORE HANDHELD INTRAORAL DENTAL 3D SCANNERS MARKET, BY MODALITY, 2021-2030 (THOUSANDS UNITS)
TABLE 310 SINGAPORE HANDHELD INTRAORAL DENTAL 3D SCANNERS MARKET, BY MODALITY, 2021-2030 (ASP)
TABLE 311 SINGAPORE HANDHELD INTRAORAL DENTAL 3D SCANNERS MARKET, BY TYPE, 2021-2030 (USD THOUSAND)
TABLE 312 SINGAPORE POWDER-FREE INTRAORAL SCANNERS IN HANDHELD INTRAORAL DENTAL 3D SCANNERS MARKET, BY TYPE, 2021-2030 (USD THOUSAND)
TABLE 313 SINGAPORE POWDER-BASED INTRAORAL SCANNERS IN HANDHELD INTRAORAL DENTAL 3D SCANNERS MARKET, BY TYPE, 2021-2030 (USD THOUSAND)
TABLE 314 SINGAPORE HANDHELD INTRAORAL DENTAL 3D SCANNERS MARKET, BY CONNECTIVITY, 2021-2030 (USD THOUSAND)
TABLE 315 SINGAPORE HANDHELD INTRAORAL DENTAL 3D SCANNERS MARKET, BY TECHNOLOGY, 2021-2030 (USD THOUSAND)
TABLE 316 SINGAPORE HANDHELD INTRAORAL DENTAL 3D SCANNERS MARKET, BY APPLICATION, 2021-2030 (USD THOUSAND)
TABLE 317 SINGAPORE HANDHELD INTRAORAL DENTAL 3D SCANNERS MARKET, BY END USERS, 2021-2030 (USD THOUSAND)
TABLE 318 SINGAPORE HANDHELD INTRAORAL DENTAL 3D SCANNERS MARKET, BY DISTRIBUTION CHANNEL, 2021-2030 (USD THOUSAND)
TABLE 319 REST OF ASIA-PACIFIC HANDHELD INTRAORAL DENTAL 3D SCANNERS MARKET, BY MODALITY, 2021-2030 (USD THOUSAND)
TABLE 320 SOUTH AMERICA HANDHELD INTRAORAL DENTAL 3D SCANNERS MARKET, BY COUNTRY, 2021-2030 (USD THOUSAND)
TABLE 321 SOUTH AMERICA HANDHELD INTRAORAL DENTAL 3D SCANNERS MARKET, BY MODALITY, 2021-2030 (USD THOUSAND)
TABLE 322 SOUTH AMERICA HANDHELD INTRAORAL DENTAL 3D SCANNERS MARKET, BY MODALITY, 2021-2030 (THOUSANDS UNITS)
TABLE 323 SOUTH AMERICA HANDHELD INTRAORAL DENTAL 3D SCANNERS MARKET, BY TYPE, 2021-2030 (USD THOUSAND)
TABLE 324 SOUTH AMERICA POWDER-FREE INTRAORAL SCANNERS IN HANDHELD INTRAORAL DENTAL 3D SCANNERS MARKET, BY TYPE, 2021-2030 (USD THOUSAND)
TABLE 325 SOUTH AMERICA POWDER-BASED INTRAORAL SCANNERS IN HANDHELD INTRAORAL DENTAL 3D SCANNERS MARKET, BY TYPE, 2021-2030 (USD THOUSAND)
TABLE 326 SOUTH AMERICA HANDHELD INTRAORAL DENTAL 3D SCANNERS MARKET, BY CONNECTIVITY, 2021-2030 (USD THOUSAND)
TABLE 327 SOUTH AMERICA HANDHELD INTRAORAL DENTAL 3D SCANNERS MARKET, BY TECHNOLOGY, 2021-2030 (USD THOUSAND)
TABLE 328 SOUTH AMERICA HANDHELD INTRAORAL DENTAL 3D SCANNERS MARKET, BY APPLICATION, 2021-2030 (USD THOUSAND)
TABLE 329 SOUTH AMERICA HANDHELD INTRAORAL DENTAL 3D SCANNERS MARKET, BY END USERS, 2021-2030 (USD THOUSAND)
TABLE 330 SOUTH AMERICA HANDHELD INTRAORAL DENTAL 3D SCANNERS MARKET, BY DISTRIBUTION CHANNEL, 2021-2030 (USD THOUSAND)
TABLE 331 BRAZIL HANDHELD INTRAORAL DENTAL 3D SCANNERS MARKET, BY MODALITY, 2021-2030 (USD THOUSAND)
TABLE 332 BRAZIL HANDHELD INTRAORAL DENTAL 3D SCANNERS MARKET, BY MODALITY, 2021-2030 (THOUSANDS UNITS)
TABLE 333 BRAZIL HANDHELD INTRAORAL DENTAL 3D SCANNERS MARKET, BY MODALITY, 2021-2030 (ASP)
TABLE 334 BRAZIL HANDHELD INTRAORAL DENTAL 3D SCANNERS MARKET, BY TYPE, 2021-2030 (USD THOUSAND)
TABLE 335 BRAZIL POWDER-FREE INTRAORAL SCANNERS IN HANDHELD INTRAORAL DENTAL 3D SCANNERS MARKET, BY TYPE, 2021-2030 (USD THOUSAND)
TABLE 336 BRAZIL POWDER-BASED INTRAORAL SCANNERS IN HANDHELD INTRAORAL DENTAL 3D SCANNERS MARKET, BY TYPE, 2021-2030 (USD THOUSAND)
TABLE 337 BRAZIL HANDHELD INTRAORAL DENTAL 3D SCANNERS MARKET, BY CONNECTIVITY, 2021-2030 (USD THOUSAND)
TABLE 338 BRAZIL HANDHELD INTRAORAL DENTAL 3D SCANNERS MARKET, BY TECHNOLOGY, 2021-2030 (USD THOUSAND)
TABLE 339 BRAZIL HANDHELD INTRAORAL DENTAL 3D SCANNERS MARKET, BY APPLICATION, 2021-2030 (USD THOUSAND)
TABLE 340 BRAZIL HANDHELD INTRAORAL DENTAL 3D SCANNERS MARKET, BY END USERS, 2021-2030 (USD THOUSAND)
TABLE 341 BRAZIL HANDHELD INTRAORAL DENTAL 3D SCANNERS MARKET, BY DISTRIBUTION CHANNEL, 2021-2030 (USD THOUSAND)
TABLE 342 ARGENTINA HANDHELD INTRAORAL DENTAL 3D SCANNERS MARKET, BY MODALITY, 2021-2030 (USD THOUSAND)
TABLE 343 ARGENTINA HANDHELD INTRAORAL DENTAL 3D SCANNERS MARKET, BY MODALITY, 2021-2030 (THOUSANDS UNITS)
TABLE 344 ARGENTINA HANDHELD INTRAORAL DENTAL 3D SCANNERS MARKET, BY MODALITY, 2021-2030 (ASP)
TABLE 345 ARGENTINA HANDHELD INTRAORAL DENTAL 3D SCANNERS MARKET, BY TYPE, 2021-2030 (USD THOUSAND)
TABLE 346 ARGENTINA POWDER-FREE INTRAORAL SCANNERS IN HANDHELD INTRAORAL DENTAL 3D SCANNERS MARKET, BY TYPE, 2021-2030 (USD THOUSAND)
TABLE 347 ARGENTINA POWDER-BASED INTRAORAL SCANNERS IN HANDHELD INTRAORAL DENTAL 3D SCANNERS MARKET, BY TYPE, 2021-2030 (USD THOUSAND)
TABLE 348 ARGENTINA HANDHELD INTRAORAL DENTAL 3D SCANNERS MARKET, BY CONNECTIVITY, 2021-2030 (USD THOUSAND)
TABLE 349 ARGENTINA HANDHELD INTRAORAL DENTAL 3D SCANNERS MARKET, BY TECHNOLOGY, 2021-2030 (USD THOUSAND)
TABLE 350 ARGENTINA HANDHELD INTRAORAL DENTAL 3D SCANNERS MARKET, BY APPLICATION, 2021-2030 (USD THOUSAND)
TABLE 351 ARGENTINA HANDHELD INTRAORAL DENTAL 3D SCANNERS MARKET, BY END USERS, 2021-2030 (USD THOUSAND)
TABLE 352 ARGENTINA HANDHELD INTRAORAL DENTAL 3D SCANNERS MARKET, BY DISTRIBUTION CHANNEL, 2021-2030 (USD THOUSAND)
TABLE 353 REST OF SOUTH AMERICA HANDHELD INTRAORAL DENTAL 3D SCANNERS MARKET, BY MODALITY, 2021-2030 (USD THOUSAND)
TABLE 354 MIDDLE EAST AND AFRICA HANDHELD INTRAORAL DENTAL 3D SCANNERS MARKET, BY COUNTRY, 2021-2030 (USD THOUSAND)
TABLE 355 MIDDLE EAST AND AFRICA HANDHELD INTRAORAL DENTAL 3D SCANNERS MARKET, BY MODALITY, 2021-2030 (USD THOUSAND)
TABLE 356 MIDDLE EAST AND AFRICA HANDHELD INTRAORAL DENTAL 3D SCANNERS MARKET, BY MODALITY, 2021-2030 (THOUSANDS UNITS)
TABLE 357 MIDDLE EAST AND AFRICA HANDHELD INTRAORAL DENTAL 3D SCANNERS MARKET, BY TYPE, 2021-2030 (USD THOUSAND)
TABLE 358 MIDDLE EAST AND AFRICA POWDER-FREE INTRAORAL SCANNERS IN HANDHELD INTRAORAL DENTAL 3D SCANNERS MARKET, BY TYPE, 2021-2030 (USD THOUSAND)
TABLE 359 MIDDLE EAST AND AFRICA POWDER-BASED INTRAORAL SCANNERS IN HANDHELD INTRAORAL DENTAL 3D SCANNERS MARKET, BY TYPE, 2021-2030 (USD THOUSAND)
TABLE 360 MIDDLE EAST AND AFRICA HANDHELD INTRAORAL DENTAL 3D SCANNERS MARKET, BY CONNECTIVITY, 2021-2030 (USD THOUSAND)
TABLE 361 MIDDLE EAST AND AFRICA HANDHELD INTRAORAL DENTAL 3D SCANNERS MARKET, BY TECHNOLOGY, 2021-2030 (USD THOUSAND)
TABLE 362 MIDDLE EAST AND AFRICA HANDHELD INTRAORAL DENTAL 3D SCANNERS MARKET, BY APPLICATION, 2021-2030 (USD THOUSAND)
TABLE 363 MIDDLE EAST AND AFRICA HANDHELD INTRAORAL DENTAL 3D SCANNERS MARKET, BY END USERS, 2021-2030 (USD THOUSAND)
TABLE 364 MIDDLE EAST AND AFRICA HANDHELD INTRAORAL DENTAL 3D SCANNERS MARKET, BY DISTRIBUTION CHANNEL, 2021-2030 (USD THOUSAND)
TABLE 365 SAUDI ARABIA HANDHELD INTRAORAL DENTAL 3D SCANNERS MARKET, BY MODALITY, 2021-2030 (USD THOUSAND)
TABLE 366 SAUDI ARABIA HANDHELD INTRAORAL DENTAL 3D SCANNERS MARKET, BY MODALITY, 2021-2030 (THOUSANDS UNITS)
TABLE 367 SAUDI ARABIA HANDHELD INTRAORAL DENTAL 3D SCANNERS MARKET, BY MODALITY, 2021-2030 (ASP)
TABLE 368 SAUDI ARABIA HANDHELD INTRAORAL DENTAL 3D SCANNERS MARKET, BY TYPE, 2021-2030 (USD THOUSAND)
TABLE 369 SAUDI ARABIA POWDER-FREE INTRAORAL SCANNERS IN HANDHELD INTRAORAL DENTAL 3D SCANNERS MARKET, BY TYPE, 2021-2030 (USD THOUSAND)
TABLE 370 SAUDI ARABIA POWDER-BASED INTRAORAL SCANNERS IN HANDHELD INTRAORAL DENTAL 3D SCANNERS MARKET, BY TYPE, 2021-2030 (USD THOUSAND)
TABLE 371 SAUDI ARABIA HANDHELD INTRAORAL DENTAL 3D SCANNERS MARKET, BY CONNECTIVITY, 2021-2030 (USD THOUSAND)
TABLE 372 SAUDI ARABIA HANDHELD INTRAORAL DENTAL 3D SCANNERS MARKET, BY TECHNOLOGY, 2021-2030 (USD THOUSAND)
TABLE 373 SAUDI ARABIA HANDHELD INTRAORAL DENTAL 3D SCANNERS MARKET, BY APPLICATION, 2021-2030 (USD THOUSAND)
TABLE 374 SAUDI ARABIA HANDHELD INTRAORAL DENTAL 3D SCANNERS MARKET, BY END USERS, 2021-2030 (USD THOUSAND)
TABLE 375 SAUDI ARABIA HANDHELD INTRAORAL DENTAL 3D SCANNERS MARKET, BY DISTRIBUTION CHANNEL, 2021-2030 (USD THOUSAND)
TABLE 376 SOUTH AFRICA HANDHELD INTRAORAL DENTAL 3D SCANNERS MARKET, BY MODALITY, 2021-2030 (USD THOUSAND)
TABLE 377 SOUTH AFRICA HANDHELD INTRAORAL DENTAL 3D SCANNERS MARKET, BY MODALITY, 2021-2030 (THOUSANDS UNITS)
TABLE 378 SOUTH AFRICA HANDHELD INTRAORAL DENTAL 3D SCANNERS MARKET, BY MODALITY, 2021-2030 (ASP)
TABLE 379 SOUTH AFRICA HANDHELD INTRAORAL DENTAL 3D SCANNERS MARKET, BY TYPE, 2021-2030 (USD THOUSAND)
TABLE 380 SOUTH AFRICA POWDER-FREE INTRAORAL SCANNERS IN HANDHELD INTRAORAL DENTAL 3D SCANNERS MARKET, BY TYPE, 2021-2030 (USD THOUSAND)
TABLE 381 SOUTH AFRICA POWDER-BASED INTRAORAL SCANNERS IN HANDHELD INTRAORAL DENTAL 3D SCANNERS MARKET, BY TYPE, 2021-2030 (USD THOUSAND)
TABLE 382 SOUTH AFRICA HANDHELD INTRAORAL DENTAL 3D SCANNERS MARKET, BY CONNECTIVITY, 2021-2030 (USD THOUSAND)
TABLE 383 SOUTH AFRICA HANDHELD INTRAORAL DENTAL 3D SCANNERS MARKET, BY TECHNOLOGY, 2021-2030 (USD THOUSAND)
TABLE 384 SOUTH AFRICA HANDHELD INTRAORAL DENTAL 3D SCANNERS MARKET, BY APPLICATION, 2021-2030 (USD THOUSAND)
TABLE 385 SOUTH AFRICA HANDHELD INTRAORAL DENTAL 3D SCANNERS MARKET, BY END USERS, 2021-2030 (USD THOUSAND)
TABLE 386 SOUTH AFRICA HANDHELD INTRAORAL DENTAL 3D SCANNERS MARKET, BY DISTRIBUTION CHANNEL, 2021-2030 (USD THOUSAND)
TABLE 387 U.A.E HANDHELD INTRAORAL DENTAL 3D SCANNERS MARKET, BY MODALITY, 2021-2030 (USD THOUSAND)
TABLE 388 U.A.E HANDHELD INTRAORAL DENTAL 3D SCANNERS MARKET, BY MODALITY, 2021-2030 (THOUSANDS UNITS)
TABLE 389 U.A.E HANDHELD INTRAORAL DENTAL 3D SCANNERS MARKET, BY MODALITY, 2021-2030 (ASP)
TABLE 390 U.A.E HANDHELD INTRAORAL DENTAL 3D SCANNERS MARKET, BY TYPE, 2021-2030 (USD THOUSAND)
TABLE 391 U.A.E POWDER-FREE INTRAORAL SCANNERS IN HANDHELD INTRAORAL DENTAL 3D SCANNERS MARKET, BY TYPE, 2021-2030 (USD THOUSAND)
TABLE 392 U.A.E POWDER-BASED INTRAORAL SCANNERS IN HANDHELD INTRAORAL DENTAL 3D SCANNERS MARKET, BY TYPE, 2021-2030 (USD THOUSAND)
TABLE 393 U.A.E HANDHELD INTRAORAL DENTAL 3D SCANNERS MARKET, BY CONNECTIVITY, 2021-2030 (USD THOUSAND)
TABLE 394 U.A.E HANDHELD INTRAORAL DENTAL 3D SCANNERS MARKET, BY TECHNOLOGY, 2021-2030 (USD THOUSAND)
TABLE 395 U.A.E HANDHELD INTRAORAL DENTAL 3D SCANNERS MARKET, BY APPLICATION, 2021-2030 (USD THOUSAND)
TABLE 396 U.A.E HANDHELD INTRAORAL DENTAL 3D SCANNERS MARKET, BY END USERS, 2021-2030 (USD THOUSAND)
TABLE 397 U.A.E HANDHELD INTRAORAL DENTAL 3D SCANNERS MARKET, BY DISTRIBUTION CHANNEL, 2021-2030 (USD THOUSAND)
TABLE 398 EGYPT HANDHELD INTRAORAL DENTAL 3D SCANNERS MARKET, BY MODALITY, 2021-2030 (USD THOUSAND)
TABLE 399 EGYPT HANDHELD INTRAORAL DENTAL 3D SCANNERS MARKET, BY MODALITY, 2021-2030 (THOUSANDS UNITS)
TABLE 400 EGYPT HANDHELD INTRAORAL DENTAL 3D SCANNERS MARKET, BY MODALITY, 2021-2030 (ASP)
TABLE 401 EGYPT HANDHELD INTRAORAL DENTAL 3D SCANNERS MARKET, BY TYPE, 2021-2030 (USD THOUSAND)
TABLE 402 EGYPT POWDER-FREE INTRAORAL SCANNERS IN HANDHELD INTRAORAL DENTAL 3D SCANNERS MARKET, BY TYPE, 2021-2030 (USD THOUSAND)
TABLE 403 EGYPT POWDER-BASED INTRAORAL SCANNERS IN HANDHELD INTRAORAL DENTAL 3D SCANNERS MARKET, BY TYPE, 2021-2030 (USD THOUSAND)
TABLE 404 EGYPT HANDHELD INTRAORAL DENTAL 3D SCANNERS MARKET, BY CONNECTIVITY, 2021-2030 (USD THOUSAND)
TABLE 405 EGYPT HANDHELD INTRAORAL DENTAL 3D SCANNERS MARKET, BY TECHNOLOGY, 2021-2030 (USD THOUSAND)
TABLE 406 EGYPT HANDHELD INTRAORAL DENTAL 3D SCANNERS MARKET, BY APPLICATION, 2021-2030 (USD THOUSAND)
TABLE 407 EGYPT HANDHELD INTRAORAL DENTAL 3D SCANNERS MARKET, BY END USERS, 2021-2030 (USD THOUSAND)
TABLE 408 EGYPT HANDHELD INTRAORAL DENTAL 3D SCANNERS MARKET, BY DISTRIBUTION CHANNEL, 2021-2030 (USD THOUSAND)
TABLE 409 ISRAEL HANDHELD INTRAORAL DENTAL 3D SCANNERS MARKET, BY MODALITY, 2021-2030 (USD THOUSAND)
TABLE 410 ISRAEL HANDHELD INTRAORAL DENTAL 3D SCANNERS MARKET, BY MODALITY, 2021-2030 (THOUSANDS UNITS)
TABLE 411 ISRAEL HANDHELD INTRAORAL DENTAL 3D SCANNERS MARKET, BY MODALITY, 2021-2030 (ASP)
TABLE 412 ISRAEL HANDHELD INTRAORAL DENTAL 3D SCANNERS MARKET, BY TYPE, 2021-2030 (USD THOUSAND)
TABLE 413 ISRAEL POWDER-FREE INTRAORAL SCANNERS IN HANDHELD INTRAORAL DENTAL 3D SCANNERS MARKET, BY TYPE, 2021-2030 (USD THOUSAND)
TABLE 414 ISRAEL POWDER-BASED INTRAORAL SCANNERS IN HANDHELD INTRAORAL DENTAL 3D SCANNERS MARKET, BY TYPE, 2021-2030 (USD THOUSAND)
TABLE 415 ISRAEL HANDHELD INTRAORAL DENTAL 3D SCANNERS MARKET, BY CONNECTIVITY, 2021-2030 (USD THOUSAND)
TABLE 416 ISRAEL HANDHELD INTRAORAL DENTAL 3D SCANNERS MARKET, BY TECHNOLOGY, 2021-2030 (USD THOUSAND)
TABLE 417 ISRAEL HANDHELD INTRAORAL DENTAL 3D SCANNERS MARKET, BY APPLICATION, 2021-2030 (USD THOUSAND)
TABLE 418 ISRAEL HANDHELD INTRAORAL DENTAL 3D SCANNERS MARKET, BY END USERS, 2021-2030 (USD THOUSAND)
TABLE 419 ISRAEL HANDHELD INTRAORAL DENTAL 3D SCANNERS MARKET, BY DISTRIBUTION CHANNEL, 2021-2030 (USD THOUSAND)
TABLE 420 REST OF MIDDLE EAST AND AFRICA HANDHELD INTRAORAL DENTAL 3D SCANNERS MARKET, BY MODALITY, 2021-2030 (USD THOUSAND)
Lista de figuras
FIGURE 1 GLOBAL HANDHELD INTRAORAL DENTAL 3D SCANNERS MARKET: SEGMENTATION
FIGURE 2 GLOBAL HANDHELD INTRAORAL DENTAL 3D SCANNERS MARKET: DATA TRIANGULATION
FIGURE 3 GLOBAL HANDHELD INTRAORAL DENTAL 3D SCANNERS MARKET: DROC ANALYSIS
FIGURE 4 GLOBAL HANDHELD INTRAORAL DENTAL 3D SCANNERS MARKET: GLOBAL VS REGIONAL MARKET ANALYSIS
FIGURE 5 GLOBAL HANDHELD INTRAORAL DENTAL 3D SCANNERS MARKET: COMPANY RESEARCH ANALYSIS
FIGURE 6 GLOBAL HANDHELD INTRAORAL DENTAL 3D SCANNERS MARKET: INTERVIEW DEMOGRAPHICS
FIGURE 7 GLOBAL HANDHELD INTRAORAL DENTAL 3D SCANNERS MARKET: DBMR MARKET POSITION GRID
FIGURE 8 GLOBAL HANDHELD INTRAORAL DENTAL 3D SCANNERS MARKET: MARKET APPLICATION COVERAGE GRID
FIGURE 9 GLOBAL HANDHELD INTRAORAL DENTAL 3D SCANNERS MARKET: VENDOR SHARE ANALYSIS
FIGURE 10 GLOBAL HANDHELD INTRAORAL DENTAL 3D SCANNERS MARKET: SEGMENTATION
FIGURE 11 THE SURGING VOLUME OF PATIENTS SUFFERING FROM EDENTULISM AND GROWING MEDICAL TOURISM FOR DENTAL PROCEDURES ARE EXPECTED TO DRIVE THE GROWTH OF THE GLOBAL HANDHELD INTRAORAL DENTAL 3D SCANNERS MARKET IN THE FORECAST PERIOD OF 2023 TO 2030
FIGURE 12 PORTABLE SCANNERS SEGMENT IS EXPECTED TO ACCOUNT FOR THE LARGEST SHARE OF THE GLOBAL HANDHELD INTRAORAL DENTAL 3D SCANNERS MARKET IN 2023 AND 2030
FIGURE 13 NORTH AMERICA IS EXPECTED TO DOMINATE THE GLOBAL HANDHELD INTRAORAL DENTAL 3D SCANNERS MARKET AND IS EXPECTED TO GROW WITH THE HIGHEST CAGR IN THE FORECAST PERIOD OF 2023 TO 2030
FIGURE 14 NORTH AMERICA IS THE FASTEST-GROWING MARKET FOR HANDHELD INTRAORAL DENTAL 3D SCANNERS MANUFACTURERS IN THE FORECAST PERIOD OF 2023 TO 2030
FIGURE 15 DRIVERS, RESTRAINTS, OPPORTUNITIES, AND CHALLENGES OF THE GLOBAL HANDHELD INTRAORAL DENTAL 3D SCANNERS MARKET
FIGURE 16 GLOBAL HANDHELD INTRAORAL DENTAL 3D SCANNERS MARKET: BY MODALITY, 2022
FIGURE 17 GLOBAL HANDHELD INTRAORAL DENTAL 3D SCANNERS MARKET: BY MODALITY, 2023-2030 (USD THOUSAND)
FIGURE 18 GLOBAL HANDHELD INTRAORAL DENTAL 3D SCANNERS MARKET: BY MODALITY, CAGR (2023-2030)
FIGURE 19 GLOBAL HANDHELD INTRAORAL DENTAL 3D SCANNERS MARKET: BY MODALITY, LIFELINE CURVE
FIGURE 20 GLOBAL HANDHELD INTRAORAL DENTAL 3D SCANNERS MARKET: BY TYPE, 2022
FIGURE 21 GLOBAL HANDHELD INTRAORAL DENTAL 3D SCANNERS MARKET: BY TYPE, 2023-2030 (USD THOUSAND)
FIGURE 22 GLOBAL HANDHELD INTRAORAL DENTAL 3D SCANNERS MARKET: BY TYPE, CAGR (2023-2030)
FIGURE 23 GLOBAL HANDHELD INTRAORAL DENTAL 3D SCANNERS MARKET: BY TYPE, LIFELINE CURVE
FIGURE 24 GLOBAL HANDHELD INTRAORAL DENTAL 3D SCANNERS MARKET: BY CONNECTIVITY, 2022
FIGURE 25 GLOBAL HANDHELD INTRAORAL DENTAL 3D SCANNERS MARKET: BY CONNECTIVITY, 2023-2030 (USD THOUSAND)
FIGURE 26 GLOBAL HANDHELD INTRAORAL DENTAL 3D SCANNERS MARKET: BY CONNECTIVITY, CAGR (2023-2030)
FIGURE 27 GLOBAL HANDHELD INTRAORAL DENTAL 3D SCANNERS MARKET: BY CONNECTIVITY, LIFELINE CURVE
FIGURE 28 GLOBAL HANDHELD INTRAORAL DENTAL 3D SCANNERS MARKET: BY TECHNOLOGY, 2022
FIGURE 29 GLOBAL HANDHELD INTRAORAL DENTAL 3D SCANNERS MARKET: BY TECHNOLOGY, 2023-2030 (USD THOUSAND)
FIGURE 30 GLOBAL HANDHELD INTRAORAL DENTAL 3D SCANNERS MARKET: BY TECHNOLOGY, CAGR (2023-2030)
FIGURE 31 GLOBAL HANDHELD INTRAORAL DENTAL 3D SCANNERS MARKET: BY TECHNOLOGY, LIFELINE CURVE
FIGURE 32 GLOBAL HANDHELD INTRAORAL DENTAL 3D SCANNERS MARKET: BY APPLICATION, 2022
FIGURE 33 GLOBAL HANDHELD INTRAORAL DENTAL 3D SCANNERS MARKET: BY APPLICATION, 2023-2030 (USD THOUSAND)
FIGURE 34 GLOBAL HANDHELD INTRAORAL DENTAL 3D SCANNERS MARKET: BY APPLICATION, CAGR (2023-2030)
FIGURE 35 GLOBAL HANDHELD INTRAORAL DENTAL 3D SCANNERS MARKET: BY APPLICATION, LIFELINE CURVE
FIGURE 36 GLOBAL HANDHELD INTRAORAL DENTAL 3D SCANNERS MARKET: BY END USERS, 2022
FIGURE 37 GLOBAL HANDHELD INTRAORAL DENTAL 3D SCANNERS MARKET: BY END USERS, 2023-2030 (USD THOUSAND)
FIGURE 38 GLOBAL HANDHELD INTRAORAL DENTAL 3D SCANNERS MARKET: BY END USERS, CAGR (2023-2030)
FIGURE 39 GLOBAL HANDHELD INTRAORAL DENTAL 3D SCANNERS MARKET: BY END USERS, LIFELINE CURVE
FIGURE 40 GLOBAL HANDHELD INTRAORAL DENTAL 3D SCANNERS MARKET: BY DISTRIBUTION CHANNEL, 2022
FIGURE 41 GLOBAL HANDHELD INTRAORAL DENTAL 3D SCANNERS MARKET: BY DISTRIBUTION CHANNEL, 2023-2030 (USD THOUSAND)
FIGURE 42 GLOBAL HANDHELD INTRAORAL DENTAL 3D SCANNERS MARKET: BY DISTRIBUTION CHANNEL, CAGR (2023-2030)
FIGURE 43 GLOBAL HANDHELD INTRAORAL DENTAL 3D SCANNERS MARKET: BY DISTRIBUTION CHANNEL, LIFELINE CURVE
FIGURE 44 GLOBAL HANDHELD INTRAORAL DENTAL 3D SCANNERS MARKET: SNAPSHOT (2022)
FIGURE 45 GLOBAL HANDHELD INTRAORAL DENTAL 3D SCANNERS MARKET: BY REGION (2022)
FIGURE 46 GLOBAL HANDHELD INTRAORAL DENTAL 3D SCANNERS MARKET: BY REGION (2023 & 2030)
FIGURE 47 GLOBAL HANDHELD INTRAORAL DENTAL 3D SCANNERS MARKET: BY REGION (2022 & 2030)
FIGURE 48 GLOBAL HANDHELD INTRAORAL DENTAL 3D SCANNERS MARKET: BY MODALITY (2023-2030)
FIGURE 49 NORTH AMERICA HANDHELD INTRAORAL DENTAL 3D SCANNERS MARKET: SNAPSHOT (2022)
FIGURE 50 NORTH AMERICA HANDHELD INTRAORAL DENTAL 3D SCANNERS MARKET: BY COUNTRY (2022)
FIGURE 51 NORTH AMERICA HANDHELD INTRAORAL DENTAL 3D SCANNERS MARKET: BY COUNTRY (2023 & 2030)
FIGURE 52 NORTH AMERICA HANDHELD INTRAORAL DENTAL 3D SCANNERS MARKET: BY COUNTRY (2022 & 2030)
FIGURE 53 NORTH AMERICA HANDHELD INTRAORAL DENTAL 3D SCANNERS MARKET: BY MODALITY (2023-2030)
FIGURE 54 EUROPE HANDHELD INTRAORAL DENTAL 3D SCANNERS MARKET: SNAPSHOT (2022)
FIGURE 55 EUROPE HANDHELD INTRAORAL DENTAL 3D SCANNERS MARKET: BY COUNTRY (2022)
FIGURE 56 EUROPE HANDHELD INTRAORAL DENTAL 3D SCANNERS MARKET: BY COUNTRY (2023 & 2030)
FIGURE 57 EUROPE HANDHELD INTRAORAL DENTAL 3D SCANNERS MARKET: BY COUNTRY (2022 & 2030)
FIGURE 58 EUROPE HANDHELD INTRAORAL DENTAL 3D SCANNERS MARKET: BY MODALITY (2023-2030)
FIGURE 59 ASIA-PACIFIC HANDHELD INTRAORAL DENTAL 3D SCANNERS MARKET: SNAPSHOT (2022)
FIGURE 60 ASIA-PACIFIC HANDHELD INTRAORAL DENTAL 3D SCANNERS MARKET: BY COUNTRY (2022)
FIGURE 61 ASIA-PACIFIC HANDHELD INTRAORAL DENTAL 3D SCANNERS MARKET: BY COUNTRY (2023 & 2030)
FIGURE 62 ASIA-PACIFIC HANDHELD INTRAORAL DENTAL 3D SCANNERS MARKET: BY COUNTRY (2022 & 2030)
FIGURE 63 ASIA-PACIFIC HANDHELD INTRAORAL DENTAL 3D SCANNERS MARKET: BY MODALITY (2023-2030)
FIGURE 64 SOUTH AMERICA HANDHELD INTRAORAL DENTAL 3D SCANNERS MARKET: SNAPSHOT (2022)
FIGURE 65 SOUTH AMERICA HANDHELD INTRAORAL DENTAL 3D SCANNERS MARKET: BY COUNTRY (2022)
FIGURE 66 SOUTH AMERICA HANDHELD INTRAORAL DENTAL 3D SCANNERS MARKET: BY COUNTRY (2023 & 2030)
FIGURE 67 SOUTH AMERICA HANDHELD INTRAORAL DENTAL 3D SCANNERS MARKET: BY COUNTRY (2022 & 2030)
FIGURE 68 SOUTH AMERICA HANDHELD INTRAORAL DENTAL 3D SCANNERS MARKET: BY MODALITY (2023-2030)
FIGURE 69 MIDDLE EAST & AFRICA HANDHELD INTRAORAL DENTAL 3D SCANNERS MARKET: SNAPSHOT (2022)
FIGURE 70 MIDDLE EAST & AFRICA HANDHELD INTRAORAL DENTAL 3D SCANNERS MARKET: BY COUNTRY (2022)
FIGURE 71 MIDDLE EAST & AFRICA HANDHELD INTRAORAL DENTAL 3D SCANNERS MARKET: BY COUNTRY (2023 & 2030)
FIGURE 72 MIDDLE EAST & AFRICA HANDHELD INTRAORAL DENTAL 3D SCANNERS MARKET: BY COUNTRY (2022 & 2030)
FIGURE 73 MIDDLE EAST & AFRICA HANDHELD INTRAORAL DENTAL 3D SCANNERS MARKET: BY MODALITY (2023-2030)
FIGURE 74 GLOBAL HANDHELD INTRAORAL DENTAL 3D SCANNERS MARKET: COMPANY SHARE 2022 (%)
FIGURE 75 NORTH AMERICA HANDHELD INTRAORAL DENTAL 3D SCANNERS MARKET: COMPANY SHARE 2022 (%)
FIGURE 76 EUROPE HANDHELD INTRAORAL DENTAL 3D SCANNERS MARKET: COMPANY SHARE 2022 (%)
FIGURE 77 ASIA-PACIFIC HANDHELD INTRAORAL DENTAL 3D SCANNERS MARKET: COMPANY SHARE 2022 (%)
Metodología de investigación
La recopilación de datos y el análisis del año base se realizan utilizando módulos de recopilación de datos con muestras de gran tamaño. La etapa incluye la obtención de información de mercado o datos relacionados a través de varias fuentes y estrategias. Incluye el examen y la planificación de todos los datos adquiridos del pasado con antelación. Asimismo, abarca el examen de las inconsistencias de información observadas en diferentes fuentes de información. Los datos de mercado se analizan y estiman utilizando modelos estadísticos y coherentes de mercado. Además, el análisis de la participación de mercado y el análisis de tendencias clave son los principales factores de éxito en el informe de mercado. Para obtener más información, solicite una llamada de un analista o envíe su consulta.
La metodología de investigación clave utilizada por el equipo de investigación de DBMR es la triangulación de datos, que implica la extracción de datos, el análisis del impacto de las variables de datos en el mercado y la validación primaria (experto en la industria). Los modelos de datos incluyen cuadrícula de posicionamiento de proveedores, análisis de línea de tiempo de mercado, descripción general y guía del mercado, cuadrícula de posicionamiento de la empresa, análisis de patentes, análisis de precios, análisis de participación de mercado de la empresa, estándares de medición, análisis global versus regional y de participación de proveedores. Para obtener más información sobre la metodología de investigación, envíe una consulta para hablar con nuestros expertos de la industria.
Personalización disponible
Data Bridge Market Research es líder en investigación formativa avanzada. Nos enorgullecemos de brindar servicios a nuestros clientes existentes y nuevos con datos y análisis que coinciden y se adaptan a sus objetivos. El informe se puede personalizar para incluir análisis de tendencias de precios de marcas objetivo, comprensión del mercado de países adicionales (solicite la lista de países), datos de resultados de ensayos clínicos, revisión de literatura, análisis de mercado renovado y base de productos. El análisis de mercado de competidores objetivo se puede analizar desde análisis basados en tecnología hasta estrategias de cartera de mercado. Podemos agregar tantos competidores sobre los que necesite datos en el formato y estilo de datos que esté buscando. Nuestro equipo de analistas también puede proporcionarle datos en archivos de Excel sin procesar, tablas dinámicas (libro de datos) o puede ayudarlo a crear presentaciones a partir de los conjuntos de datos disponibles en el informe.

