

Mercado mundial de grafito, por tipo de producto (sintético y natural), forma física (aditivos en escamas, polvo, escamas expandibles, pellets y películas y láminas), aplicación (electrónica de consumo, transporte, industrial, construcción, diagnóstico médico y defensa): tendencias de la industria y pronóstico hasta 2030.
Análisis y tamaño del mercado del grafito
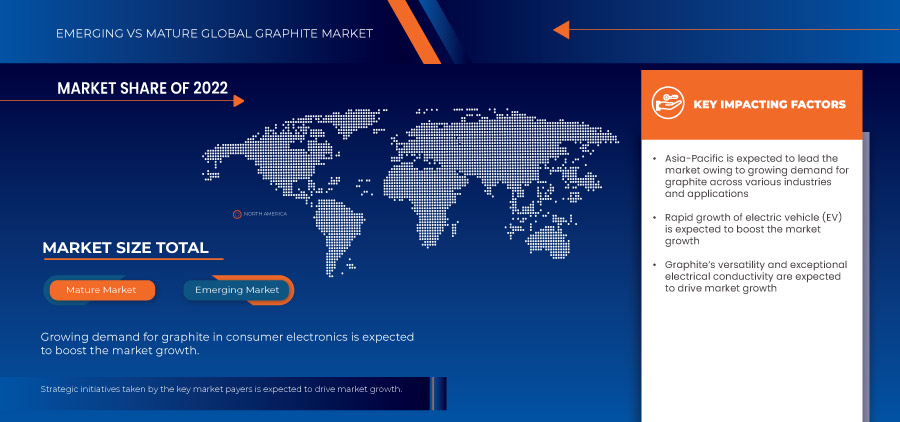
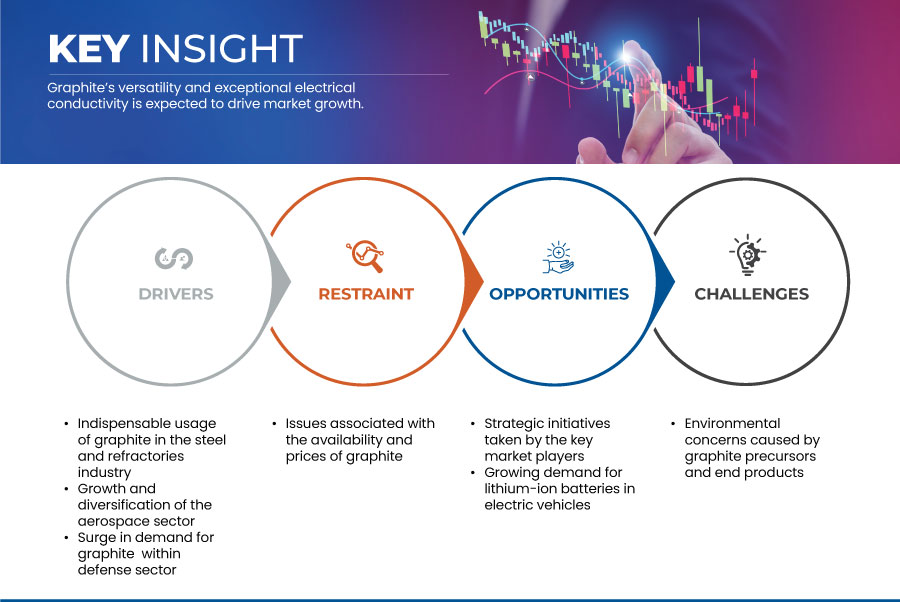
El uso indispensable del grafito en la industria del acero y los refractarios y la versatilidad del grafito y su excepcional conductividad eléctrica que lo convierten en un material fundamental en la industria de la electrónica de consumo son algunos de los factores que se espera que impulsen el crecimiento del mercado.
La principal limitación que puede afectar negativamente al crecimiento del mercado son los problemas asociados con la disponibilidad y los precios del grafito y sus precursores. Se espera que las iniciativas estratégicas adoptadas por los principales actores del mercado brinden oportunidades para el crecimiento del mercado. Sin embargo, se prevé que las preocupaciones ambientales causadas por los precursores de grafito y los productos finales supongan un desafío para el crecimiento del mercado.
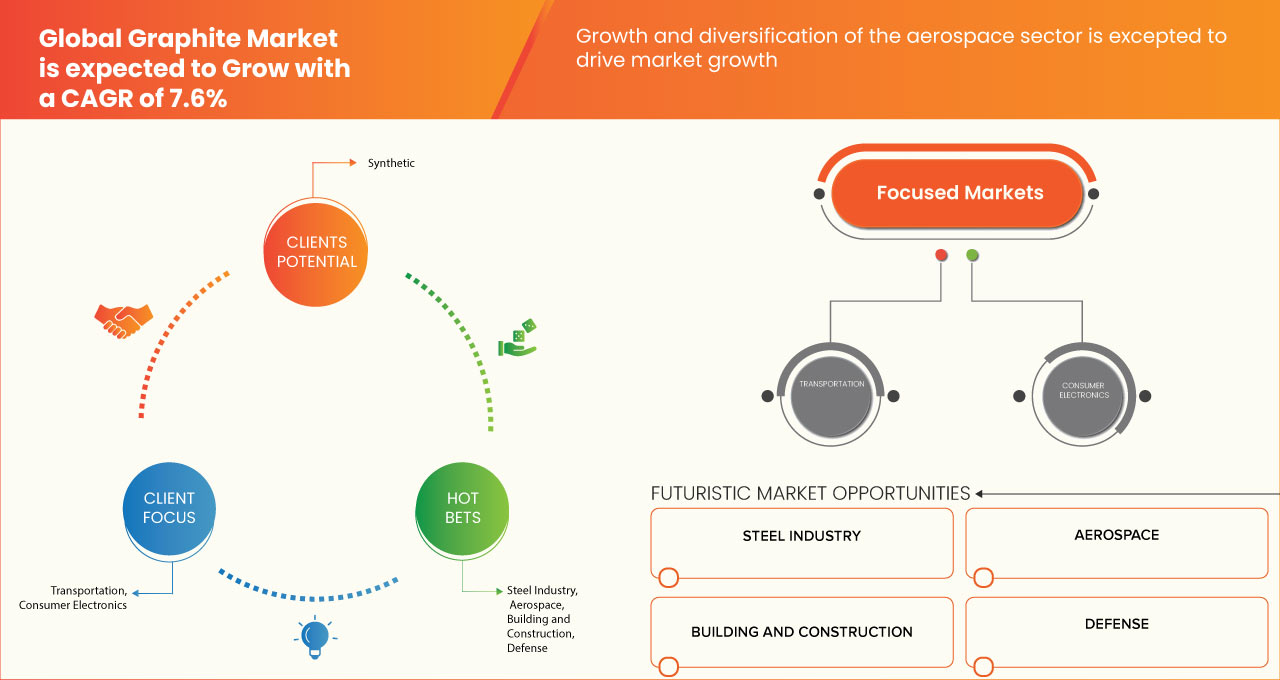
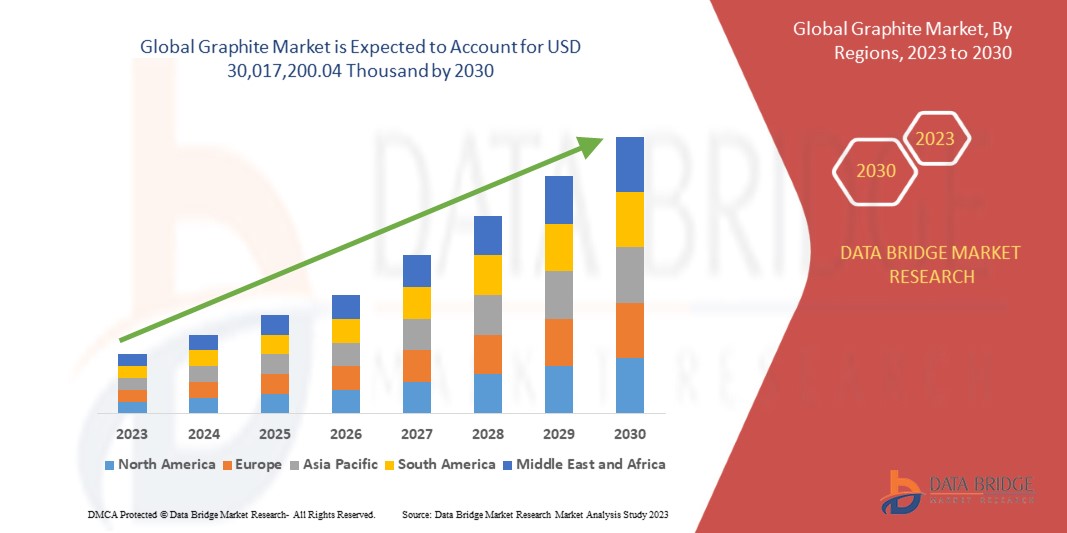
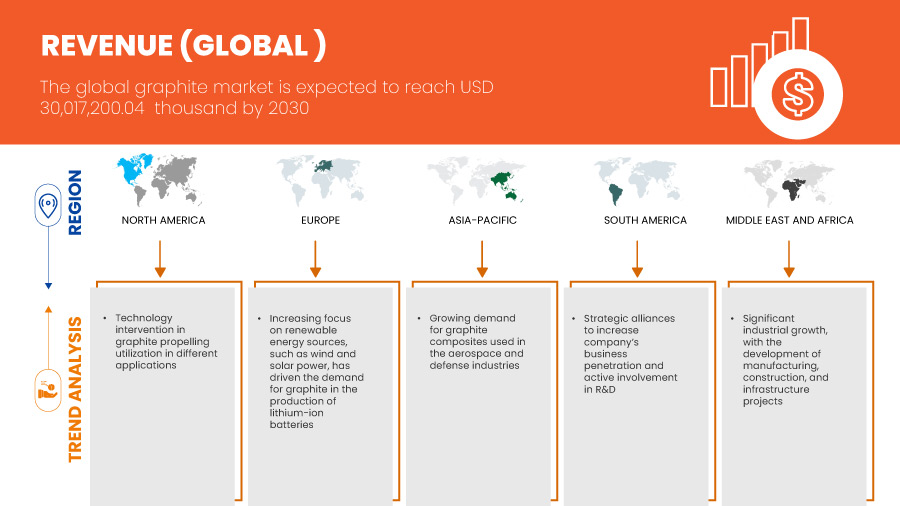
Data Bridge Market Research analiza que se espera que el mercado global de grafito alcance un valor de USD 30.017.200,04 miles para 2030, con una CAGR del 7,6% durante el período de pronóstico.
|
Período de pronóstico |
2023 a 2030 |
|
Año base |
2022 |
|
Año histórico |
2021 (Personalizable para 2015-2020) |
|
Unidades cuantitativas |
Ingresos en miles de USD |
|
Segmentos cubiertos |
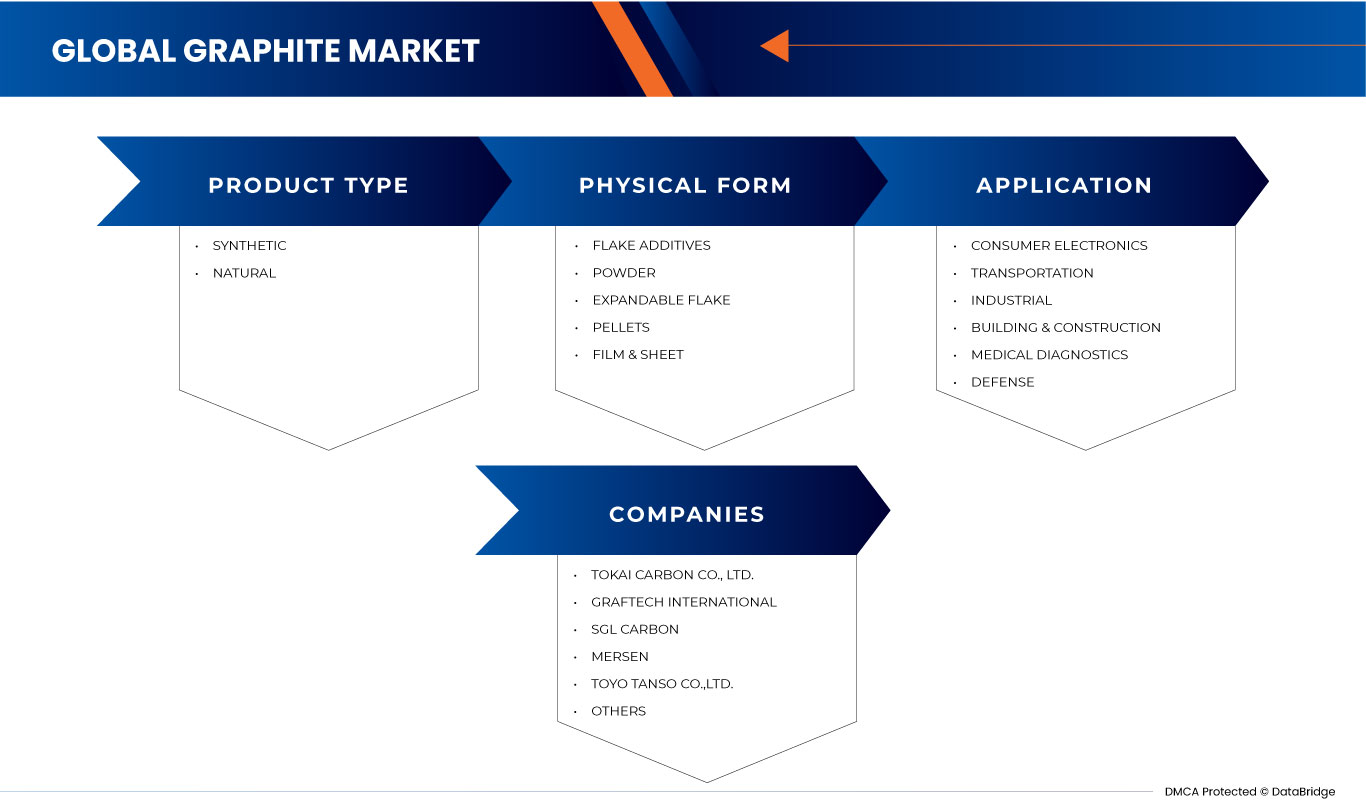
Tipo de producto (sintético y natural), forma física (aditivos en escamas, polvo, escamas expandibles, pellets y películas y láminas), aplicación ( electrónica de consumo , transporte, industria, construcción, diagnóstico médico y defensa) |
|
Países cubiertos |
EE. UU., Canadá, México, Brasil, Argentina, resto de Sudamérica, Alemania, España, Austria, Países Bajos, Rusia, Turquía, Francia, Italia, Bélgica, Reino Unido, Polonia, Hungría, Eslovaquia, Rumanía, Suecia, Suiza, Dinamarca, Eslovenia, Grecia, Finlandia, Irlanda, Bulgaria, Lituania, Croacia, Portugal, Luxemburgo, Malta, Chipre, Estonia, Letonia y resto de Europa, China, Japón, India, Corea del Sur, Australia, Tailandia, Singapur, Filipinas, Malasia, Indonesia y resto de Asia-Pacífico, Sudáfrica, Arabia Saudita, Emiratos Árabes Unidos, Egipto, Israel y resto de Oriente Medio y África |
|
Actores del mercado cubiertos |
Tokai Carbon Co., Ltd., GrafTech International, SGL Carbon, Mersen, Toyo Tanso Co., Ltd., HEG Limited, Nippon Carbon Co Ltd., Superior Graphite, Qingdao Tennry Carbon Co., Ltd., Resonac Holdings Corporation y entre otros. |
Definición de mercado
El grafito es una forma natural de carbono que es un material industrial clave que se utiliza para diversos fines. Está compuesto principalmente de átomos de carbono dispuestos en una estructura reticular hexagonal. En el contexto del mercado, el grafito se define normalmente como un mineral o material extraído y procesado por sus propiedades únicas, que incluyen una excelente conductividad, resistencia a altas temperaturas y cualidades de lubricación. El grafito se utiliza ampliamente como un componente esencial en varias industrias, como la metalurgia, la electrónica, la automoción, la aeroespacial y la energía, donde sirve como material crucial en aplicaciones como electrodos, lubricantes , refractarios y como material estructural en forma de compuestos.
Dinámica del mercado mundial del grafito
En esta sección se aborda la comprensión de los factores impulsores, las ventajas, las oportunidades, las limitaciones y los desafíos del mercado. Todos ellos se analizan en detalle a continuación:
Conductores
- Uso indispensable del Grafito en la Industria del Acero y Refractarios
La principal aplicación del grafito sintético es la fabricación de electrodos de grafito, que son capaces de soportar corrientes eléctricas extremadamente altas. Estos electrodos se forman moldeando el grafito sintético inmediatamente después de su producción. Los electrodos de grafito son fundamentales en la fabricación de acero en hornos de arco eléctrico (EAF). Sirven como materiales conductores que transfieren energía eléctrica al EAF, donde crean arcos de alta temperatura para fundir chatarra de acero y otras materias primas. Los electrodos de grafito deben soportar calor extremo y estrés mecánico durante este proceso. El grafito se utiliza para revestir cucharas y otros recipientes utilizados en el proceso de fabricación de acero. Proporciona una excelente resistencia térmica, lo que permite el transporte de acero fundido desde el horno hasta el área de fundición.
Los aditivos de grafito se utilizan para producir materiales refractarios para entornos de alta temperatura, como revestimientos para hornos, estufas, incineradores y reactores. Los refractarios son el segundo mercado más grande para el grafito después de los electrodos. El grafito se utiliza para aumentar la eficacia del producto refractario final al aumentar la conductividad térmica, disminuir el gradiente térmico entre las caras frías y calientes del producto, reduciendo así la expansión, repeliendo la escoria fundida, aumentando la vida útil del producto, aumentando la capacidad del producto para soportar choques térmicos/corrosión, mejorando así el rendimiento a temperaturas más altas y reduciendo la humectabilidad de los metales fundidos para que no afecten al producto final.
- La versatilidad y la conductividad eléctrica excepcional del grafito
El grafito se presenta como un componente crucial en diversos aspectos del diseño y la funcionalidad de los dispositivos electrónicos. Las extraordinarias propiedades del grafito han permitido la integración perfecta de tecnologías avanzadas en la vida cotidiana de las personas, desde su papel en las baterías que alimentan los teléfonos inteligentes y los ordenadores portátiles hasta su presencia en soluciones de gestión térmica e incluso como componente fundamental en las pantallas táctiles.
El grafito se utiliza como material de ánodo en baterías de iones de litio, que se utilizan ampliamente en teléfonos inteligentes , computadoras portátiles y otros dispositivos electrónicos portátiles. El ánodo de grafito ayuda a almacenar y liberar energía eléctrica de manera eficiente. También se utiliza en soluciones de gestión térmica, como disipadores de calor de grafito y materiales de interfaz térmica (TIM) para disipar el calor de los componentes electrónicos, lo que garantiza que funcionen a temperaturas óptimas. Los dispositivos electrónicos, especialmente aquellos con pantallas táctiles o teclados, utilizan grafito como lubricante o como componente en tintas conductoras para facilitar interacciones táctiles o de pulsación de teclas suaves y confiables.
Oportunidad
- Iniciativas estratégicas adoptadas por los principales actores del mercado
Las iniciativas estratégicas de los actores del mercado abarcan una amplia gama de acciones y enfoques destinados a lograr objetivos comerciales, mantener la competitividad e impulsar el crecimiento. Los acuerdos de colaboración con otras empresas, empresas emergentes o instituciones de investigación pueden fomentar la innovación, el intercambio de conocimientos y el desarrollo conjunto de productos.
Las fusiones y adquisiciones son movimientos estratégicos que emplean los líderes del mercado para fortalecer su posición en el mercado, adquirir activos valiosos o integrar negocios complementarios. Estas acciones pueden generar sinergias, eficiencias de costos y una mayor participación en el mercado. Los acuerdos de colaboración y las asociaciones con otros líderes de la industria, empresas emergentes o instituciones de investigación son una estrategia común. Estas asociaciones facilitan el intercambio de conocimientos, el desarrollo conjunto de productos y la exploración de nuevos mercados o tecnologías.
Restricciones/ Desafíos
- Cuestiones relacionadas con la disponibilidad y los precios del grafito
Los problemas asociados con la disponibilidad y los precios del grafito y sus precursores plantean desafíos importantes que pueden frenar el crecimiento del mercado. El grafito, un material industrial fundamental con diversas aplicaciones, se enfrenta a varios factores que afectan su disponibilidad y precio, lo que repercute en la dinámica general del mercado.
Un problema clave es la concentración geográfica de la producción de grafito. Una parte importante del grafito natural del mundo se obtiene de unos pocos países, principalmente China. Esta concentración crea vulnerabilidades en la cadena de suministro y expone al mercado global a riesgos geopolíticos y relacionados con el comercio. Las interrupciones en el suministro, como las restricciones a las exportaciones o las fluctuaciones en la producción, pueden provocar escasez de oferta y volatilidad de precios, lo que afecta a las industrias que dependen del grafito, incluidos los sectores automotriz, aeroespacial y de fabricación de baterías. Otro factor que afecta la disponibilidad de grafito es la dependencia de materiales precursores, principalmente grafito en escamas y grafito sintético, en varias industrias. El grafito en escamas natural se utiliza ampliamente en la fabricación de baterías para vehículos eléctricos (VE) y aplicaciones de almacenamiento de energía. Mientras tanto, el grafito sintético es crucial en la producción de electrodos para baterías de iones de litio. La demanda de estos precursores está aumentando debido al impulso mundial por la energía limpia y la adopción de VE. Esta mayor demanda puede tensar las cadenas de suministro de precursores, lo que afecta su disponibilidad y, a su vez, la producción de productos basados en grafito.
- Preocupaciones ambientales causadas por los precursores y productos finales del grafito
Las preocupaciones ambientales asociadas con los precursores y productos finales del grafito abarcan diversos aspectos de la producción, el uso y la eliminación del grafito, lo que contribuye a un panorama complejo de problemas ambientales.
Una preocupación importante gira en torno a la minería y extracción de materias primas de grafito. Los procesos tradicionales de extracción de grafito pueden tener impactos ambientales perjudiciales. La minería a cielo abierto, por ejemplo, provoca la alteración del hábitat, la erosión del suelo y la contaminación del agua debido a la liberación de sustancias químicas potencialmente dañinas. Además, la extracción de grafito puede alterar los ecosistemas y tener consecuencias a largo plazo para la biodiversidad local. Por otra parte, los procesos de fabricación involucrados en la transformación del grafito en bruto en diversos productos, como electrodos para baterías y materiales refractarios, también pueden generar desafíos ambientales. Los procesos de alto consumo de energía, como la grafitización a alta temperatura, contribuyen a las emisiones de gases de efecto invernadero y al consumo de energía. La liberación de compuestos orgánicos volátiles (COV) durante el procesamiento del grafito puede provocar contaminación del aire, lo que supone riesgos para la salud de los trabajadores y las comunidades cercanas.
Acontecimientos recientes
- En febrero de 2019, según Axios, la creciente demanda de grafito en baterías de iones de litio, impulsada por la expansión del mercado de vehículos eléctricos, ha suscitado preocupaciones medioambientales en China. Los procesos de extracción y producción de grafito generan partículas contaminantes del aire, lo que supone riesgos para la salud respiratoria. Además, los productos químicos agresivos utilizados en la producción suelen descargarse en el medio ambiente, lo que puede alterar los ecosistemas locales. Desde 2010, las inspecciones de control de la contaminación han pasado de las autoridades locales al gobierno central en un esfuerzo por abordar estos problemas medioambientales.
- En junio de 2023, el ejército griego seleccionó el SAFRAN Patroller para mejorar sus capacidades tácticas con drones, según anunció la NSPA. El Patroller, equipado con varios sensores, apoyó misiones de inteligencia para unidades militares y de seguridad nacional. Cabe destacar que contaba con la certificación de la OTAN para los estándares de aeronavegabilidad según STANAG 4671, que atiende a drones de ala fija de más de 150 kilogramos. Este desarrollo benefició a la empresa al aumentar la rentabilidad y mantener su imagen en el mercado de drones.
Alcance del mercado mundial del grafito
El mercado mundial del grafito se clasifica en tres segmentos según el tipo de producto, la forma física y la aplicación. El crecimiento entre estos segmentos le ayudará a analizar los principales segmentos de crecimiento en las industrias y brindará a los usuarios una valiosa descripción general del mercado y conocimientos del mercado para ayudarlos a tomar decisiones estratégicas para identificar las principales aplicaciones del mercado.
Tipo de producto
- Sintético
- Natural
Según el tipo de producto, el mercado se segmenta en sintético y natural.
Forma física
- Aditivos para escamas
- Polvo
- Copos expandibles
- Pellets
- Película y partituras
Sobre la base de la forma física, el mercado está segmentado en aditivos en escamas, polvo, expandibles, pellets y películas y láminas.
Solicitud
- Electrónica de consumo
- Transporte
- Industrial
- Construcción y edificación
- Diagnóstico médico
- Defensa
Sobre la base de la aplicación, el mercado está segmentado en electrónica de consumo, transporte, industria, construcción, diagnóstico médico y defensa.
Análisis y perspectivas regionales del mercado mundial del grafito
Se analiza el mercado global de grafito y se proporcionan información y tendencias del tamaño del mercado por tipo de producto, forma física y aplicación.
Los países cubiertos en el informe del mercado global de grafito son EE. UU., Canadá, México, Brasil, Argentina, resto de Sudamérica, Alemania, España, Austria, Países Bajos, Rusia, Turquía, Francia, Italia, Bélgica, Reino Unido, Polonia, Hungría, Eslovaquia, Rumania, Suecia, Suiza, Dinamarca, Eslovenia, Grecia, Finlandia, Irlanda, Bulgaria, Lituania, Croacia, Portugal, Luxemburgo, Malta, Chipre, Estonia, Letonia y resto de Europa, China, Japón, India, Corea del Sur, Australia, Tailandia, Singapur, Filipinas, Malasia, Indonesia y resto de Asia-Pacífico, Sudáfrica, Arabia Saudita, Emiratos Árabes Unidos, Egipto, Israel y resto de Medio Oriente y África.
Se espera que Asia-Pacífico domine el mercado debido a sus abundantes recursos de grafito, bajos costos de producción y alta demanda de grafito en aplicaciones industriales, como la producción de acero y baterías de iones de litio. China domina la región de Asia-Pacífico debido a la gran producción de vehículos eléctricos y baterías de iones de litio. Estados Unidos domina la región de América del Norte debido al uso extensivo de baterías de iones de litio para teléfonos inteligentes, computadoras portátiles y otros dispositivos portátiles, donde el grafito sirve como un componente crítico para el almacenamiento de energía y la conductividad. Alemania domina la región de Europa debido a su mayor demanda de productos electrónicos de consumo y dispositivos médicos.
La sección de países del informe también proporciona factores individuales que impactan en el mercado y cambios en la regulación del mercado que afectan las tendencias actuales y futuras del mercado. Los puntos de datos como el análisis de la cadena de valor aguas arriba y aguas abajo, las tendencias técnicas y el análisis de las cinco fuerzas de Porter, los estudios de caso son algunos de los indicadores utilizados para pronosticar el escenario del mercado para países individuales. Además, la presencia y disponibilidad de marcas globales y sus desafíos enfrentados debido a la competencia grande o escasa de las marcas locales y nacionales, el impacto de los aranceles nacionales y las rutas comerciales se consideran al proporcionar un análisis de pronóstico de los datos del país.
Análisis del panorama competitivo y de la cuota de mercado global del grafito
El panorama competitivo del mercado global de grafito proporciona detalles de los competidores. Los detalles incluidos son una descripción general de la empresa, las finanzas de la empresa, los ingresos generados, el potencial de mercado, la inversión en investigación y desarrollo, las nuevas iniciativas de mercado, la presencia global, los sitios e instalaciones de producción, las capacidades de producción, las fortalezas y debilidades de la empresa, el lanzamiento de productos, la amplitud y variedad de productos y el dominio de las aplicaciones. Los puntos de datos anteriores proporcionados solo están relacionados con el enfoque de las empresas en el mercado global de grafito.
Algunos de los principales actores que operan en el mercado global de grafito son Tokai Carbon Co., Ltd., GrafTech International, SGL Carbon, Mersen, Toyo Tanso Co., Ltd., HEG Limited, Nippon Carbon Co Ltd., Superior Graphite, Qingdao Tennry Carbon Co., Ltd., Resonac Holdings Corporation, entre otros.
SKU-
Obtenga acceso en línea al informe sobre la primera nube de inteligencia de mercado del mundo

- Panel de análisis de datos interactivo
- Panel de análisis de empresas para oportunidades con alto potencial de crecimiento
- Acceso de analista de investigación para personalización y consultas
- Análisis de la competencia con panel interactivo
- Últimas noticias, actualizaciones y análisis de tendencias
- Aproveche el poder del análisis de referencia para un seguimiento integral de la competencia
Tabla de contenido
1 INTRODUCTION
1.1 OBJECTIVES OF THE STUDY
1.2 MARKET DEFINITION
1.3 OVERVIEW OF GLOBAL GRAPHITE MARKET
1.4 LIMITATIONS
1.5 MARKETS COVERED
2 MARKET SEGMENTATION
2.1 MARKETS COVERED
2.2 GEOGRAPHICAL SCOPE
2.3 YEARS CONSIDERED FOR THE STUDY
2.4 CURRENCY AND PRICING
2.5 DBMR TRIPOD DATA VALIDATION MODEL
2.6 MULTIVARIATE MODELING
2.7 PRIMARY INTERVIEWS WITH KEY OPINION LEADERS
2.8 DBMR MARKET POSITION GRID
2.9 MARKET APPLICATION COVERAGE GRID
2.1 DBMR VENDOR SHARE ANALYSIS
2.11 SECONDARY SOURCES
2.12 ASSUMPTIONS
3 EXECUTIVE SUMMARY
4 PREMIUM INSIGHTS
5 MARKET OVERVIEW
5.1 DRIVERS
5.1.1 INDISPENSABLE USAGE OF GRAPHITE IN STEEL AND REFRACTORIES INDUSTRY
5.1.2 GRAPHITE'S VERSATILITY AND EXCEPTIONAL ELECTRICAL CONDUCTIVITY
5.1.3 GROWTH AND DIVERSIFICATION OF THE AEROSPACE SECTOR
5.1.4 SURGE IN DEMAND FOR GRAPHITE IN DEFENSE SECTOR
5.2 RESTRAINTS
5.2.1 ISSUES ASSOCIATED WITH THE AVAILABILITY AND PRICES OF GRAPHITE
5.3 OPPORTUNITIES
5.3.1 STRATEGIC INITIATIVES TAKEN BY THE KEY MARKET PLAYERS
5.3.2 GROWING DEMAND FOR LITHIUM-ION BATTERIES IN ELECTRIC VEHICLES
5.4 CHALLENGE
5.4.1 ENVIRONMENTAL CONCERNS CAUSED BY GRAPHITE PRECURSORS AND END PRODUCTS
6 GLOBAL GRAPHITE MARKET, BY PRODUCT TYPE
6.1 OVERVIEW
6.2 SYNTHETIC
6.3 NATURAL
7 GLOBAL GRAPHITE MARKET, BY PHYSICAL FORM
7.1 OVERVIEW
7.2 FLAKE ADDITIVES
7.3 POWDER
7.4 EXPANDABLE FLAKE
7.5 PELLETS
7.6 FILM & SHEET
8 GLOBAL GRAPHITE MARKET, BY APPLICATION
8.1 OVERVIEW
8.2 CONSUMER ELECTRONICS
8.2.1 CONSUMER ELECTRONICS, B Y APPLICATION
8.2.1.1 LAPTOP/TABLET
8.2.1.2 MOBILE
8.2.1.3 DISPLAY (OLED,LCD,LED)
8.2.1.4 POWER ELECTRONICS
8.2.1.5 LED LIGHTING
8.2.1.6 SET-TOP BOX ENCLOSURES
8.2.2 CONSUMER ELECTRONICS, B Y PHYSICAL FORM
8.2.2.1 FILM & SHEET
8.2.2.2 POWDER
8.2.2.3 FLAKE ADDITIVES
8.2.2.4 EXPANDABLE FLAKE
8.3 TRANSPORTATION
8.3.1 TRANSPORTATION, B Y APPLICATION
8.3.1.1 BATTERIES
8.3.1.1.1 EV
8.3.1.1.2 ELECTRIC GROUND TRANSPORTATION
8.3.1.1.3 AERO
8.3.1.1.4 MARINE
8.3.1.1.5 SPORT/SNOWMOBILES
8.3.1.1.6 CHARGERS
8.3.1.2 FUEL CELLS
8.3.1.2.1 AUTO & LIGHT TRUCK
8.3.1.2.2 GROUND TRANSPORTATION
8.3.1.2.3 AERO
8.3.1.2.4 MARINE
8.3.1.2.5 Portable AUXILIARY POWER UNITS
8.3.1.2.6 MATERIAL HANDLING
8.3.1.3 INTERNAL COMBUSTION ENGINES
8.3.1.4 INTERIOR
8.3.1.4.1 CLIMATE CONTROL
8.3.1.4.2 SEATING
8.3.1.5 EXTERIOR
8.3.2 TRANSPORTATION, BY PHYSICAL FORM
8.3.2.1 POWDER
8.3.2.2 FLAKE ADDITIVES
8.3.2.3 EXPANDABLE FLAKE
8.3.2.4 PELLETS
8.3.2.5 FILM & SHEET
8.4 INDUSTRIAL
8.4.1 INDUSTRIAL, B Y APPLICATION
8.4.2 FLUID SEALS
8.4.3 PIPE GASKETS
8.4.4 VALVE PACKING
8.4.5 INDUSTRIAL, B Y PHYSICAL FORM
8.4.5.1 FLAKE ADDITIVES
8.4.5.2 EXPANDABLE FLAKE
8.4.5.3 POWDER
8.4.5.4 FILM & SHEET
8.4.5.5 PELLETS
8.5 BUILDING & CONSTRUCTION
8.5.1 BUILDING & CONSTRUCTION, B Y APPLICATION
8.5.1.1 INSULATION FOAM
8.5.1.2 FIRESTOP (INTUMESCENT) COATINGS, PASTES AND PUTTIES
8.5.1.3 CONCRETE
8.5.1.4 COATINGS
8.5.1.5 ROOFING
8.5.1.6 WALL COVERINGS
8.5.1.7 ADHESIVES
8.5.1.8 EXPANSION JOINTS
8.5.2 BUILDING & CONSTRUCTION, B Y PHYSICAL FORM
8.5.2.1 EXPANDABLE FLAKE
8.5.2.2 FLAKE ADDITIVES
8.5.2.3 POWDER
8.5.2.4 FILM & SHEET
8.5.2.5 PELLETS
8.6 MEDICAL DIAGNOSTICS
8.6.1 MEDICAL DIAGNOSTICS, B Y PHYSICAL FORM
8.6.1.1 FLAKE ADDITIVES
8.6.1.2 POWDER
8.6.1.3 FILM & SHEET
8.6.1.4 EXPANDABLE FLAKE
8.6.1.5 PELLETS
8.7 DEFENSE
8.7.1 DEFENSE, B Y PHYSICAL FORM
8.7.1.1 FLAKE ADDITIVES
8.7.1.2 EXPANDABLE FLAKE
8.7.1.3 POWDER
8.7.1.4 PELLETS
8.7.1.5 FILM & SHEET
9 GLOBAL GRAPHITE MARKET, BY REGION
9.1 OVERVIEW
9.2 GLOBAL
9.3 ASIA PACIFIC
9.4 EUROPE
9.5 NORTH AMERICA
9.6 SOUTH AMERICA
9.7 MIDDLE EAST AND AFRICA
10 GLOBAL GRAPHITE MARKET: COMPANY LANDSCAPE
10.1 COMPANY SHARE ANALYSIS: GLOBAL
10.2 COMPANY SHARE ANALYSIS: EUROPE
10.3 COMPANY SHARE ANALYSIS: ASIA-PACIFIC
10.4 COMPANY SHARE ANALYSIS: NORTH AMERICA
11 SWOT ANALYSIS
12 COMPANY PROFILES
12.1 TOKAI CARBON CO., LTD.
12.1.1 COMPANY SNAPSHOT
12.1.2 REVENUE ANALYSIS
12.1.3 COMPANY SHARE ANALYSIS
12.1.4 PRODUCT PORTFOLIO
12.1.5 RECENT DEVELOPMENT
12.2 GRAFTECH INTERNATIONAL
12.2.1 COMPANY SNAPSHOT
12.2.2 REVENUE ANALYSIS
12.2.3 COMPANY SHARE ANALYSIS
12.2.4 PRODUCT PORTFOLIO
12.2.5 RECENT DEVELOPMENTS
12.3 SGL CARBON
12.3.1 COMPANY SNAPSHOT
12.3.2 REVENUE ANALYSIS
12.3.3 COMPANY SHARE ANALYSIS
12.3.4 PRODUCT PORTFOLIO
12.3.5 RECENT DEVELOPMENT
12.4 MERSEN
12.4.1 COMPANY SNAPSHOT
12.4.2 REVENUE ANALYSIS
12.4.3 COMPANY SHARE ANALYSIS
12.4.4 PRODUCT PORTFOLIO
12.4.5 RECENT DEVELOPMENT
12.5 TOYO TANSCO CO., LTD.
12.5.1 COMPANY SNAPSHOT
12.5.2 REVENUE ANALYSIS
12.5.3 COMPANY SHARE ANALYSIS
12.5.4 PRODUCT PORTFOLIO
12.5.5 RECENT DEVELOPMENT
12.6 HEG LIMITED
12.6.1 COMPANY SNAPSHOT
12.6.2 REVENUE ANALYSIS
12.6.3 PRODUCT PORTFOLIO
12.6.4 RECENT DEVELOPMENT
12.7 NIPPON CARBON CO LTD.
12.7.1 COMPANY SNAPSHOT
12.7.2 REVENUE ANALYSIS
12.7.2 RECENT DEVELOPMENT
12.8 QINGDAO TENNRY CARBON CO., LTD
12.8.1 COMPANY SNAPSHOT
12.8.2 PRODUCT PORTFOLIO
12.8.3 RECENT DEVELOPMENT
12.9 RESONAC HOLDINGS CORPORATION
12.9.1 COMPANY SNAPSHOT
12.9.2 REVENUE ANALYSIS
12.9.3 PRODUCT PORTFOLIO
12.9.4 RECENT DEVELOPMENTS
12.1 SUPERIOR GRAPHITE
12.10.1 COMPANY SNAPSHOT
12.10.2 PRODUCT PORTFOLIO
12.10.3 RECENT DEVELOPMENT
13 QUESTIONNAIRE
14 RELATED REPORTS
Lista de Tablas
TABLE 1 GLOBAL GRAPHITE MARKET, BY PRODUCT TYPE, 2021-2030 (USD THOUSAND)
TABLE 2 GLOBAL SYNTHETIC IN GRAPHITE MARKET, BY REGION, 2021-2030 (USD THOUSAND)
TABLE 3 GLOBAL NATURAL IN GRAPHITE MARKET, BY REGION, 2021-2030 (USD THOUSAND)
TABLE 4 GLOBAL GRAPHITE MARKET, BY PHYSICAL FORM, 2021-2030 (USD THOUSAND)
TABLE 5 GLOBAL FLAKE ADDITIVES IN GRAPHITE MARKET, BY REGION, 2021-2030 (USD THOUSAND)
TABLE 6 GLOBAL POWDER IN GRAPHITE MARKET, BY REGION, 2021-2030 (USD THOUSAND)
TABLE 7 GLOBAL EXPANDABLE FLAKE IN GRAPHITE MARKET, BY REGION, 2021-2030 (USD THOUSAND)
TABLE 8 GLOBAL PELLETS IN GRAPHITE MARKET, BY REGION, 2021-2030 (USD THOUSAND)
TABLE 9 GLOBAL FILM & SHEET IN GRAPHITE MARKET, BY REGION, 2021-2030 (USD THOUSAND)
TABLE 10 GLOBAL GRAPHITE MARKET, BY APPLICATION, 2021-2030 (USD THOUSAND)
TABLE 11 GLOBAL CONSUMER ELECTRONICS IN GRAPHITE MARKET, BY REGION, 2021-2030 (USD THOUSAND)
TABLE 12 GLOBAL CONSUMER ELECTRONICS IN GRAPHITE MARKET, BY APPLICATION, 2021-2030 (USD THOUSAND)
TABLE 13 GLOBAL CONSUMER ELECTRONICS IN GRAPHITE MARKET, BY PHYSICAL FORM, 2021-2030 (USD THOUSAND)
TABLE 14 GLOBAL TRANSPORTATION IN GRAPHITE MARKET, BY REGION, 2021-2030 (USD THOUSAND)
TABLE 15 GLOBAL TRANSPORTATION IN GRAPHITE MARKET, BY APPLICATION, 2021-2030 (USD THOUSAND)
TABLE 16 GLOBAL BATTERIES IN GRAPHITE MARKET, BY APPLICATION, 2021-2030 (USD THOUSAND)
TABLE 17 GLOBAL FUEL CELLS IN GRAPHITE MARKET, BY APPLICATION, 2021-2030 (USD THOUSAND)
TABLE 18 GLOBAL INTERIOR IN GRAPHITE MARKET, BY APPLICATION, 2021-2030 (USD THOUSAND)
TABLE 19 GLOBAL TRANSPORTATION IN GRAPHITE MARKET, BY PHYSICAL FORM, 2021-2030 (USD THOUSAND)
TABLE 20 GLOBAL INDUSTRIAL IN GRAPHITE MARKET, BY REGION, 2021-2030 (USD THOUSAND)
TABLE 21 GLOBAL INDUSTRIAL IN GRAPHITE MARKET, BY APPLICATION, 2021-2030 (USD THOUSAND)
TABLE 22 GLOBAL INDUSTRIAL ELECTRONICS IN GRAPHITE MARKET, BY PHYSICAL FORM, 2021-2030 (USD THOUSAND)
TABLE 23 GLOBAL BUILDING & CONSTRUCTION IN GRAPHITE MARKET, BY REGION, 2021-2030 (USD THOUSAND)
TABLE 24 GLOBAL BUILDING & CONSTRUCTION IN GRAPHITE MARKET, BY APPLICATION, 2021-2030 (USD THOUSAND)
TABLE 25 GLOBAL BUILDING & CONSTRUCTION IN GRAPHITE MARKET, BY PHYSICAL FORM, 2021-2030 (USD THOUSAND)
TABLE 26 GLOBAL MEDICAL DIAGNOSTICS IN GRAPHITE MARKET, BY REGION, 2021-2030 (USD THOUSAND)
TABLE 27 GLOBAL MEDICAL DIAGNOSTICS IN GRAPHITE MARKET, BY PHYSICAL FORM, 2021-2030 (USD THOUSAND)
TABLE 28 GLOBAL DEFENSE IN GRAPHITE MARKET, BY REGION, 2021-2030 (USD THOUSAND)
TABLE 29 GLOBAL DEFENSE IN GRAPHITE MARKET, BY PHYSICAL FORM, 2021-2030 (USD THOUSAND)
TABLE 30 GLOBAL GRAPHITE MARKET, BY REGION, 2021-2030 (USD THOUSAND)
TABLE 31 ASIA-PACIFIC GRAPHITE MARKET, BY REGION, 2021-2030 (USD THOUSAND)
TABLE 32 ASIA-PACIFIC GRAPHITE MARKET, BY PRODUCT TYPE 2021-2030 (USD THOUSAND)
TABLE 33 ASIA-PACIFIC GRAPHITE MARKET, BY PHYSICAL FORM, 2021-2030 (USD THOUSAND)
TABLE 34 ASIA-PACIFIC GRAPHITE MARKET, BY APPLICATION, 2021-2030 (USD THOUSAND)
TABLE 35 ASIA-PACIFIC CONSUMER ELECTRONICS IN GRAPHITE MARKET, BY APPLICATION, 2021-2030 (USD THOUSAND)
TABLE 36 ASIA-PACIFIC CONSUMER ELECTRONICS IN GRAPHITE MARKET, BY PHYSICAL FORM, 2021-2030 (USD THOUSAND)
TABLE 37 ASIA-PACIFIC TRANSPORTATION IN GRAPHITE MARKET, BY APPLICATION, 2021-2030 (USD THOUSAND)
TABLE 38 ASIA-PACIFIC BATTERIES IN GRAPHITE MARKET, BY APPLICATION, 2021-2030 (USD THOUSAND)
TABLE 39 ASIA-PACIFIC FUEL CELLS IN GRAPHITE MARKET, BY APPLICATION, 2021-2030 (USD THOUSAND)
TABLE 40 ASIA-PACIFIC INTERIOR IN GRAPHITE MARKET, BY APPLICATION, 2021-2030 (USD THOUSAND)
TABLE 41 ASIA-PACIFIC TRANSPORTATION IN GRAPHITE MARKET, BY PHYSICAL FORM, 2021-2030 (USD THOUSAND)
TABLE 42 ASIA-PACIFIC INDUSTRIAL IN GRAPHITE MARKET, BY APPLICATION, 2021-2030 (USD THOUSAND)
TABLE 43 ASIA-PACIFIC INDUSTRIAL IN GRAPHITE MARKET, BY PHYSICAL FORM, 2021-2030 (USD THOUSAND)
TABLE 44 ASIA-PACIFIC BUILDING & CONSTRUCTION IN GRAPHITE MARKET, BY APPLICATION, 2021-2030 (USD THOUSAND)
TABLE 45 ASIA-PACIFIC BUILDING & CONSTRUCTION IN GRAPHITE MARKET, BY PHYSICAL FORM, 2021-2030 (USD THOUSAND)
TABLE 46 ASIA-PACIFIC MEDICAL DIAGNOSTICS IN GRAPHITE MARKET, BY PHYSICAL FORM, 2021-2030 (USD THOUSAND)
TABLE 47 ASIA-PACIFIC DEFENSE IN GRAPHITE MARKET, BY PHYSICAL FORM, 2021-2030 (USD THOUSAND)
TABLE 48 CHINA GRAPHITE MARKET, BY PRODUCT TYPE 2021-2030 (USD THOUSAND)
TABLE 49 CHINA GRAPHITE MARKET, BY PHYSICAL FORM, 2021-2030 (USD THOUSAND)
TABLE 50 CHINA GRAPHITE MARKET, BY APPLICATION, 2021-2030 (USD THOUSAND)
TABLE 51 CHINA CONSUMER ELECTRONICS IN GRAPHITE MARKET, BY APPLICATION, 2021-2030 (USD THOUSAND)
TABLE 52 CHINA CONSUMER ELECTRONICS IN GRAPHITE MARKET, BY PHYSICAL FORM, 2021-2030 (USD THOUSAND)
TABLE 53 CHINA TRANSPORTATION IN GRAPHITE MARKET, BY APPLICATION, 2021-2030 (USD THOUSAND)
TABLE 54 CHINA BATTERIES IN GRAPHITE MARKET, BY APPLICATION, 2021-2030 (USD THOUSAND)
TABLE 55 CHINA FUEL CELLS IN GRAPHITE MARKET, BY APPLICATION, 2021-2030 (USD THOUSAND)
TABLE 56 CHINA INTERIOR IN GRAPHITE MARKET, BY APPLICATION, 2021-2030 (USD THOUSAND)
TABLE 57 CHINA TRANSPORTATION IN GRAPHITE MARKET, BY PHYSICAL FORM, 2021-2030 (USD THOUSAND)
TABLE 58 CHINA INDUSTRIAL IN GRAPHITE MARKET, BY APPLICATION, 2021-2030 (USD THOUSAND)
TABLE 59 CHINA INDUSTRIAL IN GRAPHITE MARKET, BY PHYSICAL FORM, 2021-2030 (USD THOUSAND)
TABLE 60 CHINA BUILDING & CONSTRUCTION IN GRAPHITE MARKET, BY APPLICATION, 2021-2030 (USD THOUSAND)
TABLE 61 CHINA BUILDING & CONSTRUCTION IN GRAPHITE MARKET, BY PHYSICAL FORM, 2021-2030 (USD THOUSAND)
TABLE 62 CHINA MEDICAL DIAGNOSTICS IN GRAPHITE MARKET, BY PHYSICAL FORM, 2021-2030 (USD THOUSAND)
TABLE 63 CHINA DEFENSE IN GRAPHITE MARKET, BY PHYSICAL FORM, 2021-2030 (USD THOUSAND)
TABLE 64 INDIA GRAPHITE MARKET, BY PRODUCT TYPE 2021-2030 (USD THOUSAND)
TABLE 65 INDIA GRAPHITE MARKET, BY PHYSICAL FORM, 2021-2030 (USD THOUSAND)
TABLE 66 INDIA GRAPHITE MARKET, BY APPLICATION, 2021-2030 (USD THOUSAND)
TABLE 67 INDIA CONSUMER ELECTRONICS IN GRAPHITE MARKET, BY APPLICATION, 2021-2030 (USD THOUSAND)
TABLE 68 INDIA CONSUMER ELECTRONICS IN GRAPHITE MARKET, BY PHYSICAL FORM, 2021-2030 (USD THOUSAND)
TABLE 69 INDIA TRANSPORTATION IN GRAPHITE MARKET, BY APPLICATION, 2021-2030 (USD THOUSAND)
TABLE 70 INDIA BATTERIES IN GRAPHITE MARKET, BY APPLICATION, 2021-2030 (USD THOUSAND)
TABLE 71 INDIA FUEL CELLS IN GRAPHITE MARKET, BY APPLICATION, 2021-2030 (USD THOUSAND)
TABLE 72 INDIA INTERIOR IN GRAPHITE MARKET, BY APPLICATION, 2021-2030 (USD THOUSAND)
TABLE 73 INDIA TRANSPORTATION IN GRAPHITE MARKET, BY PHYSICAL FORM, 2021-2030 (USD THOUSAND)
TABLE 74 INDIA INDUSTRIAL IN GRAPHITE MARKET, BY APPLICATION, 2021-2030 (USD THOUSAND)
TABLE 75 INDIA INDUSTRIAL IN GRAPHITE MARKET, BY PHYSICAL FORM, 2021-2030 (USD THOUSAND)
TABLE 76 INDIA BUILDING & CONSTRUCTION IN GRAPHITE MARKET, BY APPLICATION, 2021-2030 (USD THOUSAND)
TABLE 77 INDIA BUILDING & CONSTRUCTION IN GRAPHITE MARKET, BY PHYSICAL FORM, 2021-2030 (USD THOUSAND)
TABLE 78 INDIA MEDICAL DIAGNOSTICS IN GRAPHITE MARKET, BY PHYSICAL FORM, 2021-2030 (USD THOUSAND)
TABLE 79 INDIA DEFENSE IN GRAPHITE MARKET, BY PHYSICAL FORM, 2021-2030 (USD THOUSAND)
TABLE 80 SOUTH KOREA GRAPHITE MARKET, BY PRODUCT TYPE 2021-2030 (USD THOUSAND)
TABLE 81 SOUTH KOREA GRAPHITE MARKET, BY PHYSICAL FORM, 2021-2030 (USD THOUSAND)
TABLE 82 SOUTH KOREA GRAPHITE MARKET, BY APPLICATION, 2021-2030 (USD THOUSAND)
TABLE 83 SOUTH KOREA CONSUMER ELECTRONICS IN GRAPHITE MARKET, BY APPLICATION, 2021-2030 (USD THOUSAND)
TABLE 84 SOUTH KOREA CONSUMER ELECTRONICS IN GRAPHITE MARKET, BY PHYSICAL FORM, 2021-2030 (USD THOUSAND)
TABLE 85 SOUTH KOREA TRANSPORTATION IN GRAPHITE MARKET, BY APPLICATION, 2021-2030 (USD THOUSAND)
TABLE 86 SOUTH KOREA BATTERIES IN GRAPHITE MARKET, BY APPLICATION, 2021-2030 (USD THOUSAND)
TABLE 87 SOUTH KOREA FUEL CELLS IN GRAPHITE MARKET, BY APPLICATION, 2021-2030 (USD THOUSAND)
TABLE 88 SOUTH KOREA INTERIOR IN GRAPHITE MARKET, BY APPLICATION, 2021-2030 (USD THOUSAND)
TABLE 89 SOUTH KOREA TRANSPORTATION IN GRAPHITE MARKET, BY PHYSICAL FORM, 2021-2030 (USD THOUSAND)
TABLE 90 SOUTH KOREA INDUSTRIAL IN GRAPHITE MARKET, BY APPLICATION, 2021-2030 (USD THOUSAND)
TABLE 91 SOUTH KOREA INDUSTRIAL IN GRAPHITE MARKET, BY PHYSICAL FORM, 2021-2030 (USD THOUSAND)
TABLE 92 SOUTH KOREA BUILDING & CONSTRUCTION IN GRAPHITE MARKET, BY APPLICATION, 2021-2030 (USD THOUSAND)
TABLE 93 SOUTH KOREA BUILDING & CONSTRUCTION IN GRAPHITE MARKET, BY PHYSICAL FORM, 2021-2030 (USD THOUSAND)
TABLE 94 SOUTH KOREA MEDICAL DIAGNOSTICS IN GRAPHITE MARKET, BY PHYSICAL FORM, 2021-2030 (USD THOUSAND)
TABLE 95 SOUTH KOREA DEFENSE IN GRAPHITE MARKET, BY PHYSICAL FORM, 2021-2030 (USD THOUSAND)
TABLE 96 JAPAN GRAPHITE MARKET, BY PRODUCT TYPE 2021-2030 (USD THOUSAND)
TABLE 97 JAPAN GRAPHITE MARKET, BY PHYSICAL FORM, 2021-2030 (USD THOUSAND)
TABLE 98 JAPAN GRAPHITE MARKET, BY APPLICATION, 2021-2030 (USD THOUSAND)
TABLE 99 JAPAN CONSUMER ELECTRONICS IN GRAPHITE MARKET, BY APPLICATION, 2021-2030 (USD THOUSAND)
TABLE 100 JAPAN CONSUMER ELECTRONICS IN GRAPHITE MARKET, BY PHYSICAL FORM, 2021-2030 (USD THOUSAND)
TABLE 101 JAPAN TRANSPORTATION IN GRAPHITE MARKET, BY APPLICATION, 2021-2030 (USD THOUSAND)
TABLE 102 JAPAN BATTERIES IN GRAPHITE MARKET, BY APPLICATION, 2021-2030 (USD THOUSAND)
TABLE 103 JAPAN FUEL CELLS IN GRAPHITE MARKET, BY APPLICATION, 2021-2030 (USD THOUSAND)
TABLE 104 JAPAN INTERIOR IN GRAPHITE MARKET, BY APPLICATION, 2021-2030 (USD THOUSAND)
TABLE 105 JAPAN TRANSPORTATION IN GRAPHITE MARKET, BY PHYSICAL FORM, 2021-2030 (USD THOUSAND)
TABLE 106 JAPAN INDUSTRIAL IN GRAPHITE MARKET, BY APPLICATION, 2021-2030 (USD THOUSAND)
TABLE 107 JAPAN INDUSTRIAL IN GRAPHITE MARKET, BY PHYSICAL FORM, 2021-2030 (USD THOUSAND)
TABLE 108 JAPAN BUILDING & CONSTRUCTION IN GRAPHITE MARKET, BY APPLICATION, 2021-2030 (USD THOUSAND)
TABLE 109 JAPAN BUILDING & CONSTRUCTION IN GRAPHITE MARKET, BY PHYSICAL FORM, 2021-2030 (USD THOUSAND)
TABLE 110 JAPAN MEDICAL DIAGNOSTICS IN GRAPHITE MARKET, BY PHYSICAL FORM, 2021-2030 (USD THOUSAND)
TABLE 111 JAPAN DEFENSE IN GRAPHITE MARKET, BY PHYSICAL FORM, 2021-2030 (USD THOUSAND)
TABLE 112 THAILAND GRAPHITE MARKET, BY PRODUCT TYPE 2021-2030 (USD THOUSAND)
TABLE 113 THAILAND GRAPHITE MARKET, BY PHYSICAL FORM, 2021-2030 (USD THOUSAND)
TABLE 114 THAILAND GRAPHITE MARKET, BY APPLICATION, 2021-2030 (USD THOUSAND)
TABLE 115 THAILAND CONSUMER ELECTRONICS IN GRAPHITE MARKET, BY APPLICATION, 2021-2030 (USD THOUSAND)
TABLE 116 THAILAND CONSUMER ELECTRONICS IN GRAPHITE MARKET, BY PHYSICAL FORM, 2021-2030 (USD THOUSAND)
TABLE 117 THAILAND TRANSPORTATION IN GRAPHITE MARKET, BY APPLICATION, 2021-2030 (USD THOUSAND)
TABLE 118 THAILAND BATTERIES IN GRAPHITE MARKET, BY APPLICATION, 2021-2030 (USD THOUSAND)
TABLE 119 THAILAND FUEL CELLS IN GRAPHITE MARKET, BY APPLICATION, 2021-2030 (USD THOUSAND)
TABLE 120 THAILAND INTERIOR IN GRAPHITE MARKET, BY APPLICATION, 2021-2030 (USD THOUSAND)
TABLE 121 THAILAND TRANSPORTATION IN GRAPHITE MARKET, BY PHYSICAL FORM, 2021-2030 (USD THOUSAND)
TABLE 122 THAILAND INDUSTRIAL IN GRAPHITE MARKET, BY APPLICATION, 2021-2030 (USD THOUSAND)
TABLE 123 THAILAND INDUSTRIAL IN GRAPHITE MARKET, BY PHYSICAL FORM, 2021-2030 (USD THOUSAND)
TABLE 124 THAILAND BUILDING & CONSTRUCTION IN GRAPHITE MARKET, BY APPLICATION, 2021-2030 (USD THOUSAND)
TABLE 125 THAILAND BUILDING & CONSTRUCTION IN GRAPHITE MARKET, BY PHYSICAL FORM, 2021-2030 (USD THOUSAND)
TABLE 126 THAILAND MEDICAL DIAGNOSTICS IN GRAPHITE MARKET, BY PHYSICAL FORM, 2021-2030 (USD THOUSAND)
TABLE 127 THAILAND DEFENSE IN GRAPHITE MARKET, BY PHYSICAL FORM, 2021-2030 (USD THOUSAND)
TABLE 128 INDONESIA GRAPHITE MARKET, BY PRODUCT TYPE 2021-2030 (USD THOUSAND)
TABLE 129 INDONESIA GRAPHITE MARKET, BY PHYSICAL FORM, 2021-2030 (USD THOUSAND)
TABLE 130 INDONESIA GRAPHITE MARKET, BY APPLICATION, 2021-2030 (USD THOUSAND)
TABLE 131 INDONESIA CONSUMER ELECTRONICS IN GRAPHITE MARKET, BY APPLICATION, 2021-2030 (USD THOUSAND)
TABLE 132 INDONESIA CONSUMER ELECTRONICS IN GRAPHITE MARKET, BY PHYSICAL FORM, 2021-2030 (USD THOUSAND)
TABLE 133 INDONESIA TRANSPORTATION IN GRAPHITE MARKET, BY APPLICATION, 2021-2030 (USD THOUSAND)
TABLE 134 INDONESIA BATTERIES IN GRAPHITE MARKET, BY APPLICATION, 2021-2030 (USD THOUSAND)
TABLE 135 INDONESIA FUEL CELLS IN GRAPHITE MARKET, BY APPLICATION, 2021-2030 (USD THOUSAND)
TABLE 136 INDONESIA INTERIOR IN GRAPHITE MARKET, BY APPLICATION, 2021-2030 (USD THOUSAND)
TABLE 137 INDONESIA TRANSPORTATION IN GRAPHITE MARKET, BY PHYSICAL FORM, 2021-2030 (USD THOUSAND)
TABLE 138 INDONESIA INDUSTRIAL IN GRAPHITE MARKET, BY APPLICATION, 2021-2030 (USD THOUSAND)
TABLE 139 INDONESIA INDUSTRIAL IN GRAPHITE MARKET, BY PHYSICAL FORM, 2021-2030 (USD THOUSAND)
TABLE 140 INDONESIA BUILDING & CONSTRUCTION IN GRAPHITE MARKET, BY APPLICATION, 2021-2030 (USD THOUSAND)
TABLE 141 INDONESIA BUILDING & CONSTRUCTION IN GRAPHITE MARKET, BY PHYSICAL FORM, 2021-2030 (USD THOUSAND)
TABLE 142 INDONESIA MEDICAL DIAGNOSTICS IN GRAPHITE MARKET, BY PHYSICAL FORM, 2021-2030 (USD THOUSAND)
TABLE 143 INDONESIA DEFENSE IN GRAPHITE MARKET, BY PHYSICAL FORM, 2021-2030 (USD THOUSAND)
TABLE 144 SINGAPORE GRAPHITE MARKET, BY PRODUCT TYPE 2021-2030 (USD THOUSAND)
TABLE 145 SINGAPORE GRAPHITE MARKET, BY PHYSICAL FORM, 2021-2030 (USD THOUSAND)
TABLE 146 SINGAPORE GRAPHITE MARKET, BY APPLICATION, 2021-2030 (USD THOUSAND)
TABLE 147 SINGAPORE CONSUMER ELECTRONICS IN GRAPHITE MARKET, BY APPLICATION, 2021-2030 (USD THOUSAND)
TABLE 148 SINGAPORE CONSUMER ELECTRONICS IN GRAPHITE MARKET, BY PHYSICAL FORM, 2021-2030 (USD THOUSAND)
TABLE 149 SINGAPORE TRANSPORTATION IN GRAPHITE MARKET, BY APPLICATION, 2021-2030 (USD THOUSAND)
TABLE 150 SINGAPORE BATTERIES IN GRAPHITE MARKET, BY APPLICATION, 2021-2030 (USD THOUSAND)
TABLE 151 SINGAPORE FUEL CELLS IN GRAPHITE MARKET, BY APPLICATION, 2021-2030 (USD THOUSAND)
TABLE 152 SINGAPORE INTERIOR IN GRAPHITE MARKET, BY APPLICATION, 2021-2030 (USD THOUSAND)
TABLE 153 SINGAPORE TRANSPORTATION IN GRAPHITE MARKET, BY PHYSICAL FORM, 2021-2030 (USD THOUSAND)
TABLE 154 SINGAPORE INDUSTRIAL IN GRAPHITE MARKET, BY APPLICATION, 2021-2030 (USD THOUSAND)
TABLE 155 SINGAPORE INDUSTRIAL IN GRAPHITE MARKET, BY PHYSICAL FORM, 2021-2030 (USD THOUSAND)
TABLE 156 SINGAPORE BUILDING & CONSTRUCTION IN GRAPHITE MARKET, BY APPLICATION, 2021-2030 (USD THOUSAND)
TABLE 157 SINGAPORE BUILDING & CONSTRUCTION IN GRAPHITE MARKET, BY PHYSICAL FORM, 2021-2030 (USD THOUSAND)
TABLE 158 SINGAPORE MEDICAL DIAGNOSTICS IN GRAPHITE MARKET, BY PHYSICAL FORM, 2021-2030 (USD THOUSAND)
TABLE 159 SINGAPORE DEFENSE IN GRAPHITE MARKET, BY PHYSICAL FORM, 2021-2030 (USD THOUSAND)
TABLE 160 MALAYSIA GRAPHITE MARKET, BY PRODUCT TYPE 2021-2030 (USD THOUSAND)
TABLE 161 MALAYSIA GRAPHITE MARKET, BY PHYSICAL FORM, 2021-2030 (USD THOUSAND)
TABLE 162 MALAYSIA GRAPHITE MARKET, BY APPLICATION, 2021-2030 (USD THOUSAND)
TABLE 163 MALAYSIA CONSUMER ELECTRONICS IN GRAPHITE MARKET, BY APPLICATION, 2021-2030 (USD THOUSAND)
TABLE 164 MALAYSIA CONSUMER ELECTRONICS IN GRAPHITE MARKET, BY PHYSICAL FORM, 2021-2030 (USD THOUSAND)
TABLE 165 MALAYSIA TRANSPORTATION IN GRAPHITE MARKET, BY APPLICATION, 2021-2030 (USD THOUSAND)
TABLE 166 MALAYSIA BATTERIES IN GRAPHITE MARKET, BY APPLICATION, 2021-2030 (USD THOUSAND)
TABLE 167 MALAYSIA FUEL CELLS IN GRAPHITE MARKET, BY APPLICATION, 2021-2030 (USD THOUSAND)
TABLE 168 MALAYSIA INTERIOR IN GRAPHITE MARKET, BY APPLICATION, 2021-2030 (USD THOUSAND)
TABLE 169 MALAYSIA TRANSPORTATION IN GRAPHITE MARKET, BY PHYSICAL FORM, 2021-2030 (USD THOUSAND)
TABLE 170 MALAYSIA INDUSTRIAL IN GRAPHITE MARKET, BY APPLICATION, 2021-2030 (USD THOUSAND)
TABLE 171 MALAYSIA INDUSTRIAL IN GRAPHITE MARKET, BY PHYSICAL FORM, 2021-2030 (USD THOUSAND)
TABLE 172 MALAYSIA BUILDING & CONSTRUCTION IN GRAPHITE MARKET, BY APPLICATION, 2021-2030 (USD THOUSAND)
TABLE 173 MALAYSIA BUILDING & CONSTRUCTION IN GRAPHITE MARKET, BY PHYSICAL FORM, 2021-2030 (USD THOUSAND)
TABLE 174 MALAYSIA MEDICAL DIAGNOSTICS IN GRAPHITE MARKET, BY PHYSICAL FORM, 2021-2030 (USD THOUSAND)
TABLE 175 MALAYSIA DEFENSE IN GRAPHITE MARKET, BY PHYSICAL FORM, 2021-2030 (USD THOUSAND)
TABLE 176 AUSTRALIA GRAPHITE MARKET, BY PRODUCT TYPE 2021-2030 (USD THOUSAND)
TABLE 177 AUSTRALIA GRAPHITE MARKET, BY PHYSICAL FORM, 2021-2030 (USD THOUSAND)
TABLE 178 AUSTRALIA GRAPHITE MARKET, BY APPLICATION, 2021-2030 (USD THOUSAND)
TABLE 179 AUSTRALIA CONSUMER ELECTRONICS IN GRAPHITE MARKET, BY APPLICATION, 2021-2030 (USD THOUSAND)
TABLE 180 AUSTRALIA CONSUMER ELECTRONICS IN GRAPHITE MARKET, BY PHYSICAL FORM, 2021-2030 (USD THOUSAND)
TABLE 181 AUSTRALIA TRANSPORTATION IN GRAPHITE MARKET, BY APPLICATION, 2021-2030 (USD THOUSAND)
TABLE 182 AUSTRALIA BATTERIES IN GRAPHITE MARKET, BY APPLICATION, 2021-2030 (USD THOUSAND)
TABLE 183 AUSTRALIA FUEL CELLS IN GRAPHITE MARKET, BY APPLICATION, 2021-2030 (USD THOUSAND)
TABLE 184 AUSTRALIA INTERIOR IN GRAPHITE MARKET, BY APPLICATION, 2021-2030 (USD THOUSAND)
TABLE 185 AUSTRALIA TRANSPORTATION IN GRAPHITE MARKET, BY PHYSICAL FORM, 2021-2030 (USD THOUSAND)
TABLE 186 AUSTRALIA INDUSTRIAL IN GRAPHITE MARKET, BY APPLICATION, 2021-2030 (USD THOUSAND)
TABLE 187 AUSTRALIA INDUSTRIAL IN GRAPHITE MARKET, BY PHYSICAL FORM, 2021-2030 (USD THOUSAND)
TABLE 188 AUSTRALIA BUILDING & CONSTRUCTION IN GRAPHITE MARKET, BY APPLICATION, 2021-2030 (USD THOUSAND)
TABLE 189 AUSTRALIA BUILDING & CONSTRUCTION IN GRAPHITE MARKET, BY PHYSICAL FORM, 2021-2030 (USD THOUSAND)
TABLE 190 AUSTRALIA MEDICAL DIAGNOSTICS IN GRAPHITE MARKET, BY PHYSICAL FORM, 2021-2030 (USD THOUSAND)
TABLE 191 AUSTRALIA DEFENSE IN GRAPHITE MARKET, BY PHYSICAL FORM, 2021-2030 (USD THOUSAND)
TABLE 192 PHILIPPINES GRAPHITE MARKET, BY PRODUCT TYPE 2021-2030 (USD THOUSAND)
TABLE 193 PHILIPPINES GRAPHITE MARKET, BY PHYSICAL FORM, 2021-2030 (USD THOUSAND)
TABLE 194 PHILIPPINES GRAPHITE MARKET, BY APPLICATION, 2021-2030 (USD THOUSAND)
TABLE 195 PHILIPPINES CONSUMER ELECTRONICS IN GRAPHITE MARKET, BY APPLICATION, 2021-2030 (USD THOUSAND)
TABLE 196 PHILIPPINES CONSUMER ELECTRONICS IN GRAPHITE MARKET, BY PHYSICAL FORM, 2021-2030 (USD THOUSAND)
TABLE 197 PHILIPPINES TRANSPORTATION IN GRAPHITE MARKET, BY APPLICATION, 2021-2030 (USD THOUSAND)
TABLE 198 PHILIPPINES BATTERIES IN GRAPHITE MARKET, BY APPLICATION, 2021-2030 (USD THOUSAND)
TABLE 199 PHILIPPINES FUEL CELLS IN GRAPHITE MARKET, BY APPLICATION, 2021-2030 (USD THOUSAND)
TABLE 200 PHILIPPINES INTERIOR IN GRAPHITE MARKET, BY APPLICATION, 2021-2030 (USD THOUSAND)
TABLE 201 PHILIPPINES TRANSPORTATION IN GRAPHITE MARKET, BY PHYSICAL FORM, 2021-2030 (USD THOUSAND)
TABLE 202 PHILIPPINES INDUSTRIAL IN GRAPHITE MARKET, BY APPLICATION, 2021-2030 (USD THOUSAND)
TABLE 203 PHILIPPINES INDUSTRIAL IN GRAPHITE MARKET, BY PHYSICAL FORM, 2021-2030 (USD THOUSAND)
TABLE 204 PHILIPPINES BUILDING & CONSTRUCTION IN GRAPHITE MARKET, BY APPLICATION, 2021-2030 (USD THOUSAND)
TABLE 205 PHILIPPINES BUILDING & CONSTRUCTION IN GRAPHITE MARKET, BY PHYSICAL FORM, 2021-2030 (USD THOUSAND)
TABLE 206 PHILIPPINES MEDICAL DIAGNOSTICS IN GRAPHITE MARKET, BY PHYSICAL FORM, 2021-2030 (USD THOUSAND)
TABLE 207 PHILIPPINES DEFENSE IN GRAPHITE MARKET, BY PHYSICAL FORM, 2021-2030 (USD THOUSAND)
TABLE 208 REST OF ASIA-PACIFIC GRAPHITE MARKET, BY PRODUCT TYPE 2021-2030 (USD THOUSAND)
TABLE 209 EUROPE GRAPHITE MARKET, BY COUNTRY, 2021-2030 (USD THOUSAND)
TABLE 210 EUROPE GRAPHITE MARKET, BY PRODUCT TYPE 2021-2030 (USD THOUSAND)
TABLE 211 EUROPE GRAPHITE MARKET, BY PHYSICAL FORM, 2021-2030 (USD THOUSAND)
TABLE 212 EUROPE GRAPHITE MARKET, BY APPLICATION, 2021-2030 (USD THOUSAND)
TABLE 213 EUROPE CONSUMER ELECTRONICS IN GRAPHITE MARKET, BY APPLICATION, 2021-2030 (USD THOUSAND)
TABLE 214 EUROPE CONSUMER ELECTRONICS IN GRAPHITE MARKET, BY PHYSICAL FORM, 2021-2030 (USD THOUSAND)
TABLE 215 EUROPE TRANSPORTATION IN GRAPHITE MARKET, BY APPLICATION, 2021-2030 (USD THOUSAND)
TABLE 216 EUROPE BATTERIES IN GRAPHITE MARKET, BY APPLICATION, 2021-2030 (USD THOUSAND)
TABLE 217 EUROPE FUEL CELLS IN GRAPHITE MARKET, BY APPLICATION, 2021-2030 (USD THOUSAND)
TABLE 218 EUROPE INTERIOR IN GRAPHITE MARKET, BY APPLICATION, 2021-2030 (USD THOUSAND)
TABLE 219 EUROPE TRANSPORTATION IN GRAPHITE MARKET, BY PHYSICAL FORM, 2021-2030 (USD THOUSAND)
TABLE 220 EUROPE INDUSTRIAL IN GRAPHITE MARKET, BY APPLICATION, 2021-2030 (USD THOUSAND)
TABLE 221 EUROPE INDUSTRIAL IN GRAPHITE MARKET, BY PHYSICAL FORM, 2021-2030 (USD THOUSAND)
TABLE 222 EUROPE BUILDING & CONSTRUCTION IN GRAPHITE MARKET, BY APPLICATION, 2021-2030 (USD THOUSAND)
TABLE 223 EUROPE BUILDING & CONSTRUCTION IN GRAPHITE MARKET, BY PHYSICAL FORM, 2021-2030 (USD THOUSAND)
TABLE 224 EUROPE MEDICAL DIAGNOSTICS IN GRAPHITE MARKET, BY PHYSICAL FORM, 2021-2030 (USD THOUSAND)
TABLE 225 EUROPE DEFENSE IN GRAPHITE MARKET, BY PHYSICAL FORM, 2021-2030 (USD THOUSAND)
TABLE 226 GERMANY GRAPHITE MARKET, BY PRODUCT TYPE 2021-2030 (USD THOUSAND)
TABLE 227 GERMANY GRAPHITE MARKET, BY PHYSICAL FORM, 2021-2030 (USD THOUSAND)
TABLE 228 GERMANY GRAPHITE MARKET, BY APPLICATION, 2021-2030 (USD THOUSAND)
TABLE 229 GERMANY CONSUMER ELECTRONICS IN GRAPHITE MARKET, BY APPLICATION, 2021-2030 (USD THOUSAND)
TABLE 230 GERMANY CONSUMER ELECTRONICS IN GRAPHITE MARKET, BY PHYSICAL FORM, 2021-2030 (USD THOUSAND)
TABLE 231 GERMANY TRANSPORTATION IN GRAPHITE MARKET, BY APPLICATION, 2021-2030 (USD THOUSAND)
TABLE 232 GERMANY BATTERIES IN GRAPHITE MARKET, BY APPLICATION, 2021-2030 (USD THOUSAND)
TABLE 233 GERMANY FUEL CELLS IN GRAPHITE MARKET, BY APPLICATION, 2021-2030 (USD THOUSAND)
TABLE 234 GERMANY INTERIOR IN GRAPHITE MARKET, BY APPLICATION, 2021-2030 (USD THOUSAND)
TABLE 235 GERMANY TRANSPORTATION IN GRAPHITE MARKET, BY PHYSICAL FORM, 2021-2030 (USD THOUSAND)
TABLE 236 GERMANY INDUSTRIAL IN GRAPHITE MARKET, BY APPLICATION, 2021-2030 (USD THOUSAND)
TABLE 237 GERMANY INDUSTRIAL IN GRAPHITE MARKET, BY PHYSICAL FORM, 2021-2030 (USD THOUSAND)
TABLE 238 GERMANY BUILDING & CONSTRUCTION IN GRAPHITE MARKET, BY APPLICATION, 2021-2030 (USD THOUSAND)
TABLE 239 GERMANY BUILDING & CONSTRUCTION IN GRAPHITE MARKET, BY PHYSICAL FORM, 2021-2030 (USD THOUSAND)
TABLE 240 GERMANY MEDICAL DIAGNOSTICS IN GRAPHITE MARKET, BY PHYSICAL FORM, 2021-2030 (USD THOUSAND)
TABLE 241 GERMANY DEFENSE IN GRAPHITE MARKET, BY PHYSICAL FORM, 2021-2030 (USD THOUSAND)
TABLE 242 SPAIN GRAPHITE MARKET, BY PRODUCT TYPE 2021-2030 (USD THOUSAND)
TABLE 243 SPAIN GRAPHITE MARKET, BY PHYSICAL FORM, 2021-2030 (USD THOUSAND)
TABLE 244 SPAIN GRAPHITE MARKET, BY APPLICATION, 2021-2030 (USD THOUSAND)
TABLE 245 SPAIN CONSUMER ELECTRONICS IN GRAPHITE MARKET, BY APPLICATION, 2021-2030 (USD THOUSAND)
TABLE 246 SPAIN CONSUMER ELECTRONICS IN GRAPHITE MARKET, BY PHYSICAL FORM, 2021-2030 (USD THOUSAND)
TABLE 247 SPAIN TRANSPORTATION IN GRAPHITE MARKET, BY APPLICATION, 2021-2030 (USD THOUSAND)
TABLE 248 SPAIN BATTERIES IN GRAPHITE MARKET, BY APPLICATION, 2021-2030 (USD THOUSAND)
TABLE 249 SPAIN FUEL CELLS IN GRAPHITE MARKET, BY APPLICATION, 2021-2030 (USD THOUSAND)
TABLE 250 SPAIN INTERIOR IN GRAPHITE MARKET, BY APPLICATION, 2021-2030 (USD THOUSAND)
TABLE 251 SPAIN TRANSPORTATION IN GRAPHITE MARKET, BY PHYSICAL FORM, 2021-2030 (USD THOUSAND)
TABLE 252 SPAIN INDUSTRIAL IN GRAPHITE MARKET, BY APPLICATION, 2021-2030 (USD THOUSAND)
TABLE 253 SPAIN INDUSTRIAL IN GRAPHITE MARKET, BY PHYSICAL FORM, 2021-2030 (USD THOUSAND)
TABLE 254 SPAIN BUILDING & CONSTRUCTION IN GRAPHITE MARKET, BY APPLICATION, 2021-2030 (USD THOUSAND)
TABLE 255 SPAIN BUILDING & CONSTRUCTION IN GRAPHITE MARKET, BY PHYSICAL FORM, 2021-2030 (USD THOUSAND)
TABLE 256 SPAIN MEDICAL DIAGNOSTICS IN GRAPHITE MARKET, BY PHYSICAL FORM, 2021-2030 (USD THOUSAND)
TABLE 257 SPAIN DEFENSE IN GRAPHITE MARKET, BY PHYSICAL FORM, 2021-2030 (USD THOUSAND)
TABLE 258 AUSTRIA GRAPHITE MARKET, BY PRODUCT TYPE 2021-2030 (USD THOUSAND)
TABLE 259 AUSTRIA GRAPHITE MARKET, BY PHYSICAL FORM, 2021-2030 (USD THOUSAND)
TABLE 260 AUSTRIA GRAPHITE MARKET, BY APPLICATION, 2021-2030 (USD THOUSAND)
TABLE 261 AUSTRIA CONSUMER ELECTRONICS IN GRAPHITE MARKET, BY APPLICATION, 2021-2030 (USD THOUSAND)
TABLE 262 AUSTRIA CONSUMER ELECTRONICS IN GRAPHITE MARKET, BY PHYSICAL FORM, 2021-2030 (USD THOUSAND)
TABLE 263 AUSTRIA TRANSPORTATION IN GRAPHITE MARKET, BY APPLICATION, 2021-2030 (USD THOUSAND)
TABLE 264 AUSTRIA BATTERIES IN GRAPHITE MARKET, BY APPLICATION, 2021-2030 (USD THOUSAND)
TABLE 265 AUSTRIA FUEL CELLS IN GRAPHITE MARKET, BY APPLICATION, 2021-2030 (USD THOUSAND)
TABLE 266 AUSTRIA INTERIOR IN GRAPHITE MARKET, BY APPLICATION, 2021-2030 (USD THOUSAND)
TABLE 267 AUSTRIA TRANSPORTATION IN GRAPHITE MARKET, BY PHYSICAL FORM, 2021-2030 (USD THOUSAND)
TABLE 268 AUSTRIA INDUSTRIAL IN GRAPHITE MARKET, BY APPLICATION, 2021-2030 (USD THOUSAND)
TABLE 269 AUSTRIA INDUSTRIAL IN GRAPHITE MARKET, BY PHYSICAL FORM, 2021-2030 (USD THOUSAND)
TABLE 270 AUSTRIA BUILDING & CONSTRUCTION IN GRAPHITE MARKET, BY APPLICATION, 2021-2030 (USD THOUSAND)
TABLE 271 AUSTRIA BUILDING & CONSTRUCTION IN GRAPHITE MARKET, BY PHYSICAL FORM, 2021-2030 (USD THOUSAND)
TABLE 272 AUSTRIA MEDICAL DIAGNOSTICS IN GRAPHITE MARKET, BY PHYSICAL FORM, 2021-2030 (USD THOUSAND)
TABLE 273 AUSTRIA DEFENSE IN GRAPHITE MARKET, BY PHYSICAL FORM, 2021-2030 (USD THOUSAND)
TABLE 274 NETHERLANDS GRAPHITE MARKET, BY PRODUCT TYPE 2021-2030 (USD THOUSAND)
TABLE 275 NETHERLANDS GRAPHITE MARKET, BY PHYSICAL FORM, 2021-2030 (USD THOUSAND)
TABLE 276 NETHERLANDS GRAPHITE MARKET, BY APPLICATION, 2021-2030 (USD THOUSAND)
TABLE 277 NETHERLANDS CONSUMER ELECTRONICS IN GRAPHITE MARKET, BY APPLICATION, 2021-2030 (USD THOUSAND)
TABLE 278 NETHERLANDS CONSUMER ELECTRONICS IN GRAPHITE MARKET, BY PHYSICAL FORM, 2021-2030 (USD THOUSAND)
TABLE 279 NETHERLANDS TRANSPORTATION IN GRAPHITE MARKET, BY APPLICATION, 2021-2030 (USD THOUSAND)
TABLE 280 NETHERLANDS BATTERIES IN GRAPHITE MARKET, BY APPLICATION, 2021-2030 (USD THOUSAND)
TABLE 281 NETHERLANDS FUEL CELLS IN GRAPHITE MARKET, BY APPLICATION, 2021-2030 (USD THOUSAND)
TABLE 282 NETHERLANDS INTERIOR IN GRAPHITE MARKET, BY APPLICATION, 2021-2030 (USD THOUSAND)
TABLE 283 NETHERLANDS TRANSPORTATION IN GRAPHITE MARKET, BY PHYSICAL FORM, 2021-2030 (USD THOUSAND)
TABLE 284 NETHERLANDS INDUSTRIAL IN GRAPHITE MARKET, BY APPLICATION, 2021-2030 (USD THOUSAND)
TABLE 285 NETHERLANDS INDUSTRIAL IN GRAPHITE MARKET, BY PHYSICAL FORM, 2021-2030 (USD THOUSAND)
TABLE 286 NETHERLANDS BUILDING & CONSTRUCTION IN GRAPHITE MARKET, BY APPLICATION, 2021-2030 (USD THOUSAND)
TABLE 287 NETHERLANDS BUILDING & CONSTRUCTION IN GRAPHITE MARKET, BY PHYSICAL FORM, 2021-2030 (USD THOUSAND)
TABLE 288 NETHERLANDS MEDICAL DIAGNOSTICS IN GRAPHITE MARKET, BY PHYSICAL FORM, 2021-2030 (USD THOUSAND)
TABLE 289 NETHERLANDS DEFENSE IN GRAPHITE MARKET, BY PHYSICAL FORM, 2021-2030 (USD THOUSAND)
TABLE 290 RUSSIA GRAPHITE MARKET, BY PRODUCT TYPE 2021-2030 (USD THOUSAND)
TABLE 291 RUSSIA GRAPHITE MARKET, BY PHYSICAL FORM, 2021-2030 (USD THOUSAND)
TABLE 292 RUSSIA GRAPHITE MARKET, BY APPLICATION, 2021-2030 (USD THOUSAND)
TABLE 293 RUSSIA CONSUMER ELECTRONICS IN GRAPHITE MARKET, BY APPLICATION, 2021-2030 (USD THOUSAND)
TABLE 294 RUSSIA CONSUMER ELECTRONICS IN GRAPHITE MARKET, BY PHYSICAL FORM, 2021-2030 (USD THOUSAND)
TABLE 295 RUSSIA TRANSPORTATION IN GRAPHITE MARKET, BY APPLICATION, 2021-2030 (USD THOUSAND)
TABLE 296 RUSSIA BATTERIES IN GRAPHITE MARKET, BY APPLICATION, 2021-2030 (USD THOUSAND)
TABLE 297 RUSSIA FUEL CELLS IN GRAPHITE MARKET, BY APPLICATION, 2021-2030 (USD THOUSAND)
TABLE 298 RUSSIA INTERIOR IN GRAPHITE MARKET, BY APPLICATION, 2021-2030 (USD THOUSAND)
TABLE 299 RUSSIA TRANSPORTATION IN GRAPHITE MARKET, BY PHYSICAL FORM, 2021-2030 (USD THOUSAND)
TABLE 300 RUSSIA INDUSTRIAL IN GRAPHITE MARKET, BY APPLICATION, 2021-2030 (USD THOUSAND)
TABLE 301 RUSSIA INDUSTRIAL IN GRAPHITE MARKET, BY PHYSICAL FORM, 2021-2030 (USD THOUSAND)
TABLE 302 RUSSIA BUILDING & CONSTRUCTION IN GRAPHITE MARKET, BY APPLICATION, 2021-2030 (USD THOUSAND)
TABLE 303 RUSSIA BUILDING & CONSTRUCTION IN GRAPHITE MARKET, BY PHYSICAL FORM, 2021-2030 (USD THOUSAND)
TABLE 304 RUSSIA MEDICAL DIAGNOSTICS IN GRAPHITE MARKET, BY PHYSICAL FORM, 2021-2030 (USD THOUSAND)
TABLE 305 RUSSIA DEFENSE IN GRAPHITE MARKET, BY PHYSICAL FORM, 2021-2030 (USD THOUSAND)
TABLE 306 TURKEY GRAPHITE MARKET, BY PRODUCT TYPE 2021-2030 (USD THOUSAND)
TABLE 307 TURKEY GRAPHITE MARKET, BY PHYSICAL FORM, 2021-2030 (USD THOUSAND)
TABLE 308 TURKEY GRAPHITE MARKET, BY APPLICATION, 2021-2030 (USD THOUSAND)
TABLE 309 TURKEY CONSUMER ELECTRONICS IN GRAPHITE MARKET, BY APPLICATION, 2021-2030 (USD THOUSAND)
TABLE 310 TURKEY CONSUMER ELECTRONICS IN GRAPHITE MARKET, BY PHYSICAL FORM, 2021-2030 (USD THOUSAND)
TABLE 311 TURKEY TRANSPORTATION IN GRAPHITE MARKET, BY APPLICATION, 2021-2030 (USD THOUSAND)
TABLE 312 TURKEY BATTERIES IN GRAPHITE MARKET, BY APPLICATION, 2021-2030 (USD THOUSAND)
TABLE 313 TURKEY FUEL CELLS IN GRAPHITE MARKET, BY APPLICATION, 2021-2030 (USD THOUSAND)
TABLE 314 TURKEY INTERIOR IN GRAPHITE MARKET, BY APPLICATION, 2021-2030 (USD THOUSAND)
TABLE 315 TURKEY TRANSPORTATION IN GRAPHITE MARKET, BY PHYSICAL FORM, 2021-2030 (USD THOUSAND)
TABLE 316 TURKEY INDUSTRIAL IN GRAPHITE MARKET, BY APPLICATION, 2021-2030 (USD THOUSAND)
TABLE 317 TURKEY INDUSTRIAL IN GRAPHITE MARKET, BY PHYSICAL FORM, 2021-2030 (USD THOUSAND)
TABLE 318 TURKEY BUILDING & CONSTRUCTION IN GRAPHITE MARKET, BY APPLICATION, 2021-2030 (USD THOUSAND)
TABLE 319 TURKEY BUILDING & CONSTRUCTION IN GRAPHITE MARKET, BY PHYSICAL FORM, 2021-2030 (USD THOUSAND)
TABLE 320 TURKEY MEDICAL DIAGNOSTICS IN GRAPHITE MARKET, BY PHYSICAL FORM, 2021-2030 (USD THOUSAND)
TABLE 321 TURKEY DEFENSE IN GRAPHITE MARKET, BY PHYSICAL FORM, 2021-2030 (USD THOUSAND)
TABLE 322 FRANCE GRAPHITE MARKET, BY PRODUCT TYPE 2021-2030 (USD THOUSAND)
TABLE 323 FRANCE GRAPHITE MARKET, BY PHYSICAL FORM, 2021-2030 (USD THOUSAND)
TABLE 324 FRANCE GRAPHITE MARKET, BY APPLICATION, 2021-2030 (USD THOUSAND)
TABLE 325 FRANCE CONSUMER ELECTRONICS IN GRAPHITE MARKET, BY APPLICATION, 2021-2030 (USD THOUSAND)
TABLE 326 FRANCE CONSUMER ELECTRONICS IN GRAPHITE MARKET, BY PHYSICAL FORM, 2021-2030 (USD THOUSAND)
TABLE 327 FRANCE TRANSPORTATION IN GRAPHITE MARKET, BY APPLICATION, 2021-2030 (USD THOUSAND)
TABLE 328 FRANCE BATTERIES IN GRAPHITE MARKET, BY APPLICATION, 2021-2030 (USD THOUSAND)
TABLE 329 FRANCE FUEL CELLS IN GRAPHITE MARKET, BY APPLICATION, 2021-2030 (USD THOUSAND)
TABLE 330 FRANCE INTERIOR IN GRAPHITE MARKET, BY APPLICATION, 2021-2030 (USD THOUSAND)
TABLE 331 FRANCE TRANSPORTATION IN GRAPHITE MARKET, BY PHYSICAL FORM, 2021-2030 (USD THOUSAND)
TABLE 332 FRANCE INDUSTRIAL IN GRAPHITE MARKET, BY APPLICATION, 2021-2030 (USD THOUSAND)
TABLE 333 FRANCE INDUSTRIAL IN GRAPHITE MARKET, BY PHYSICAL FORM, 2021-2030 (USD THOUSAND)
TABLE 334 FRANCE BUILDING & CONSTRUCTION IN GRAPHITE MARKET, BY APPLICATION, 2021-2030 (USD THOUSAND)
TABLE 335 FRANCE BUILDING & CONSTRUCTION IN GRAPHITE MARKET, BY PHYSICAL FORM, 2021-2030 (USD THOUSAND)
TABLE 336 FRANCE MEDICAL DIAGNOSTICS IN GRAPHITE MARKET, BY PHYSICAL FORM, 2021-2030 (USD THOUSAND)
TABLE 337 FRANCE DEFENSE IN GRAPHITE MARKET, BY PHYSICAL FORM, 2021-2030 (USD THOUSAND)
TABLE 338 ITALY GRAPHITE MARKET, BY PRODUCT TYPE 2021-2030 (USD THOUSAND)
TABLE 339 ITALY GRAPHITE MARKET, BY PHYSICAL FORM, 2021-2030 (USD THOUSAND)
TABLE 340 ITALY GRAPHITE MARKET, BY APPLICATION, 2021-2030 (USD THOUSAND)
TABLE 341 ITALY CONSUMER ELECTRONICS IN GRAPHITE MARKET, BY APPLICATION, 2021-2030 (USD THOUSAND)
TABLE 342 ITALY CONSUMER ELECTRONICS IN GRAPHITE MARKET, BY PHYSICAL FORM, 2021-2030 (USD THOUSAND)
TABLE 343 ITALY TRANSPORTATION IN GRAPHITE MARKET, BY APPLICATION, 2021-2030 (USD THOUSAND)
TABLE 344 ITALY BATTERIES IN GRAPHITE MARKET, BY APPLICATION, 2021-2030 (USD THOUSAND)
TABLE 345 ITALY FUEL CELLS IN GRAPHITE MARKET, BY APPLICATION, 2021-2030 (USD THOUSAND)
TABLE 346 ITALY INTERIOR IN GRAPHITE MARKET, BY APPLICATION, 2021-2030 (USD THOUSAND)
TABLE 347 ITALY TRANSPORTATION IN GRAPHITE MARKET, BY PHYSICAL FORM, 2021-2030 (USD THOUSAND)
TABLE 348 ITALY INDUSTRIAL IN GRAPHITE MARKET, BY APPLICATION, 2021-2030 (USD THOUSAND)
TABLE 349 ITALY INDUSTRIAL IN GRAPHITE MARKET, BY PHYSICAL FORM, 2021-2030 (USD THOUSAND)
TABLE 350 ITALY BUILDING & CONSTRUCTION IN GRAPHITE MARKET, BY APPLICATION, 2021-2030 (USD THOUSAND)
TABLE 351 ITALY BUILDING & CONSTRUCTION IN GRAPHITE MARKET, BY PHYSICAL FORM, 2021-2030 (USD THOUSAND)
TABLE 352 ITALY MEDICAL DIAGNOSTICS IN GRAPHITE MARKET, BY PHYSICAL FORM, 2021-2030 (USD THOUSAND)
TABLE 353 ITALY DEFENSE IN GRAPHITE MARKET, BY PHYSICAL FORM, 2021-2030 (USD THOUSAND)
TABLE 354 BELGIUM GRAPHITE MARKET, BY PRODUCT TYPE 2021-2030 (USD THOUSAND)
TABLE 355 BELGIUM GRAPHITE MARKET, BY PHYSICAL FORM, 2021-2030 (USD THOUSAND)
TABLE 356 BELGIUM GRAPHITE MARKET, BY APPLICATION, 2021-2030 (USD THOUSAND)
TABLE 357 BELGIUM CONSUMER ELECTRONICS IN GRAPHITE MARKET, BY APPLICATION, 2021-2030 (USD THOUSAND)
TABLE 358 BELGIUM CONSUMER ELECTRONICS IN GRAPHITE MARKET, BY PHYSICAL FORM, 2021-2030 (USD THOUSAND)
TABLE 359 BELGIUM TRANSPORTATION IN GRAPHITE MARKET, BY APPLICATION, 2021-2030 (USD THOUSAND)
TABLE 360 BELGIUM BATTERIES IN GRAPHITE MARKET, BY APPLICATION, 2021-2030 (USD THOUSAND)
TABLE 361 BELGIUM FUEL CELLS IN GRAPHITE MARKET, BY APPLICATION, 2021-2030 (USD THOUSAND)
TABLE 362 BELGIUM INTERIOR IN GRAPHITE MARKET, BY APPLICATION, 2021-2030 (USD THOUSAND)
TABLE 363 BELGIUM TRANSPORTATION IN GRAPHITE MARKET, BY PHYSICAL FORM, 2021-2030 (USD THOUSAND)
TABLE 364 BELGIUM INDUSTRIAL IN GRAPHITE MARKET, BY APPLICATION, 2021-2030 (USD THOUSAND)
TABLE 365 BELGIUM INDUSTRIAL IN GRAPHITE MARKET, BY PHYSICAL FORM, 2021-2030 (USD THOUSAND)
TABLE 366 BELGIUM BUILDING & CONSTRUCTION IN GRAPHITE MARKET, BY APPLICATION, 2021-2030 (USD THOUSAND)
TABLE 367 BELGIUM BUILDING & CONSTRUCTION IN GRAPHITE MARKET, BY PHYSICAL FORM, 2021-2030 (USD THOUSAND)
TABLE 368 BELGIUM MEDICAL DIAGNOSTICS IN GRAPHITE MARKET, BY PHYSICAL FORM, 2021-2030 (USD THOUSAND)
TABLE 369 BELGIUM DEFENSE IN GRAPHITE MARKET, BY PHYSICAL FORM, 2021-2030 (USD THOUSAND)
TABLE 370 U.K. GRAPHITE MARKET, BY PRODUCT TYPE 2021-2030 (USD THOUSAND)
TABLE 371 U.K. GRAPHITE MARKET, BY PHYSICAL FORM, 2021-2030 (USD THOUSAND)
TABLE 372 U.K. GRAPHITE MARKET, BY APPLICATION, 2021-2030 (USD THOUSAND)
TABLE 373 U.K. CONSUMER ELECTRONICS IN GRAPHITE MARKET, BY APPLICATION, 2021-2030 (USD THOUSAND)
TABLE 374 U.K. CONSUMER ELECTRONICS IN GRAPHITE MARKET, BY PHYSICAL FORM, 2021-2030 (USD THOUSAND)
TABLE 375 U.K. TRANSPORTATION IN GRAPHITE MARKET, BY APPLICATION, 2021-2030 (USD THOUSAND)
TABLE 376 U.K. BATTERIES IN GRAPHITE MARKET, BY APPLICATION, 2021-2030 (USD THOUSAND)
TABLE 377 U.K. FUEL CELLS IN GRAPHITE MARKET, BY APPLICATION, 2021-2030 (USD THOUSAND)
TABLE 378 U.K. INTERIOR IN GRAPHITE MARKET, BY APPLICATION, 2021-2030 (USD THOUSAND)
TABLE 379 U.K. TRANSPORTATION IN GRAPHITE MARKET, BY PHYSICAL FORM, 2021-2030 (USD THOUSAND)
TABLE 380 U.K. INDUSTRIAL IN GRAPHITE MARKET, BY APPLICATION, 2021-2030 (USD THOUSAND)
TABLE 381 U.K. INDUSTRIAL IN GRAPHITE MARKET, BY PHYSICAL FORM, 2021-2030 (USD THOUSAND)
TABLE 382 U.K. BUILDING & CONSTRUCTION IN GRAPHITE MARKET, BY APPLICATION, 2021-2030 (USD THOUSAND)
TABLE 383 U.K. BUILDING & CONSTRUCTION IN GRAPHITE MARKET, BY PHYSICAL FORM, 2021-2030 (USD THOUSAND)
TABLE 384 U.K. MEDICAL DIAGNOSTICS IN GRAPHITE MARKET, BY PHYSICAL FORM, 2021-2030 (USD THOUSAND)
TABLE 385 U.K. DEFENSE IN GRAPHITE MARKET, BY PHYSICAL FORM, 2021-2030 (USD THOUSAND)
TABLE 386 POLAND GRAPHITE MARKET, BY PRODUCT TYPE 2021-2030 (USD THOUSAND)
TABLE 387 POLAND GRAPHITE MARKET, BY PHYSICAL FORM, 2021-2030 (USD THOUSAND)
TABLE 388 POLAND GRAPHITE MARKET, BY APPLICATION, 2021-2030 (USD THOUSAND)
TABLE 389 POLAND CONSUMER ELECTRONICS IN GRAPHITE MARKET, BY APPLICATION, 2021-2030 (USD THOUSAND)
TABLE 390 POLAND CONSUMER ELECTRONICS IN GRAPHITE MARKET, BY PHYSICAL FORM, 2021-2030 (USD THOUSAND)
TABLE 391 POLAND TRANSPORTATION IN GRAPHITE MARKET, BY APPLICATION, 2021-2030 (USD THOUSAND)
TABLE 392 POLAND BATTERIES IN GRAPHITE MARKET, BY APPLICATION, 2021-2030 (USD THOUSAND)
TABLE 393 POLAND FUEL CELLS IN GRAPHITE MARKET, BY APPLICATION, 2021-2030 (USD THOUSAND)
TABLE 394 POLAND INTERIOR IN GRAPHITE MARKET, BY APPLICATION, 2021-2030 (USD THOUSAND)
TABLE 395 POLAND TRANSPORTATION IN GRAPHITE MARKET, BY PHYSICAL FORM, 2021-2030 (USD THOUSAND)
TABLE 396 POLAND INDUSTRIAL IN GRAPHITE MARKET, BY APPLICATION, 2021-2030 (USD THOUSAND)
TABLE 397 POLAND INDUSTRIAL IN GRAPHITE MARKET, BY PHYSICAL FORM, 2021-2030 (USD THOUSAND)
TABLE 398 POLAND BUILDING & CONSTRUCTION IN GRAPHITE MARKET, BY APPLICATION, 2021-2030 (USD THOUSAND)
TABLE 399 POLAND BUILDING & CONSTRUCTION IN GRAPHITE MARKET, BY PHYSICAL FORM, 2021-2030 (USD THOUSAND)
TABLE 400 POLAND MEDICAL DIAGNOSTICS IN GRAPHITE MARKET, BY PHYSICAL FORM, 2021-2030 (USD THOUSAND)
TABLE 401 POLAND DEFENSE IN GRAPHITE MARKET, BY PHYSICAL FORM, 2021-2030 (USD THOUSAND)
TABLE 402 HUNGARY GRAPHITE MARKET, BY PRODUCT TYPE 2021-2030 (USD THOUSAND)
TABLE 403 HUNGARY GRAPHITE MARKET, BY PHYSICAL FORM, 2021-2030 (USD THOUSAND)
TABLE 404 HUNGARY GRAPHITE MARKET, BY APPLICATION, 2021-2030 (USD THOUSAND)
TABLE 405 HUNGARY CONSUMER ELECTRONICS IN GRAPHITE MARKET, BY APPLICATION, 2021-2030 (USD THOUSAND)
TABLE 406 HUNGARY CONSUMER ELECTRONICS IN GRAPHITE MARKET, BY PHYSICAL FORM, 2021-2030 (USD THOUSAND)
TABLE 407 HUNGARY TRANSPORTATION IN GRAPHITE MARKET, BY APPLICATION, 2021-2030 (USD THOUSAND)
TABLE 408 HUNGARY BATTERIES IN GRAPHITE MARKET, BY APPLICATION, 2021-2030 (USD THOUSAND)
TABLE 409 HUNGARY FUEL CELLS IN GRAPHITE MARKET, BY APPLICATION, 2021-2030 (USD THOUSAND)
TABLE 410 HUNGARY INTERIOR IN GRAPHITE MARKET, BY APPLICATION, 2021-2030 (USD THOUSAND)
TABLE 411 HUNGARY TRANSPORTATION IN GRAPHITE MARKET, BY PHYSICAL FORM, 2021-2030 (USD THOUSAND)
TABLE 412 HUNGARY INDUSTRIAL IN GRAPHITE MARKET, BY APPLICATION, 2021-2030 (USD THOUSAND)
TABLE 413 HUNGARY INDUSTRIAL IN GRAPHITE MARKET, BY PHYSICAL FORM, 2021-2030 (USD THOUSAND)
TABLE 414 HUNGARY BUILDING & CONSTRUCTION IN GRAPHITE MARKET, BY APPLICATION, 2021-2030 (USD THOUSAND)
TABLE 415 HUNGARY BUILDING & CONSTRUCTION IN GRAPHITE MARKET, BY PHYSICAL FORM, 2021-2030 (USD THOUSAND)
TABLE 416 HUNGARY MEDICAL DIAGNOSTICS IN GRAPHITE MARKET, BY PHYSICAL FORM, 2021-2030 (USD THOUSAND)
TABLE 417 HUNGARY DEFENSE IN GRAPHITE MARKET, BY PHYSICAL FORM, 2021-2030 (USD THOUSAND)
TABLE 418 SLOVAKIA GRAPHITE MARKET, BY PRODUCT TYPE 2021-2030 (USD THOUSAND)
TABLE 419 SLOVAKIA GRAPHITE MARKET, BY PHYSICAL FORM, 2021-2030 (USD THOUSAND)
TABLE 420 SLOVAKIA GRAPHITE MARKET, BY APPLICATION, 2021-2030 (USD THOUSAND)
TABLE 421 SLOVAKIA CONSUMER ELECTRONICS IN GRAPHITE MARKET, BY APPLICATION, 2021-2030 (USD THOUSAND)
TABLE 422 SLOVAKIA CONSUMER ELECTRONICS IN GRAPHITE MARKET, BY PHYSICAL FORM, 2021-2030 (USD THOUSAND)
TABLE 423 SLOVAKIA TRANSPORTATION IN GRAPHITE MARKET, BY APPLICATION, 2021-2030 (USD THOUSAND)
TABLE 424 SLOVAKIA BATTERIES IN GRAPHITE MARKET, BY APPLICATION, 2021-2030 (USD THOUSAND)
TABLE 425 SLOVAKIA FUEL CELLS IN GRAPHITE MARKET, BY APPLICATION, 2021-2030 (USD THOUSAND)
TABLE 426 SLOVAKIA INTERIOR IN GRAPHITE MARKET, BY APPLICATION, 2021-2030 (USD THOUSAND)
TABLE 427 SLOVAKIA TRANSPORTATION IN GRAPHITE MARKET, BY PHYSICAL FORM, 2021-2030 (USD THOUSAND)
TABLE 428 SLOVAKIA INDUSTRIAL IN GRAPHITE MARKET, BY APPLICATION, 2021-2030 (USD THOUSAND)
TABLE 429 SLOVAKIA INDUSTRIAL IN GRAPHITE MARKET, BY PHYSICAL FORM, 2021-2030 (USD THOUSAND)
TABLE 430 SLOVAKIA BUILDING & CONSTRUCTION IN GRAPHITE MARKET, BY APPLICATION, 2021-2030 (USD THOUSAND)
TABLE 431 SLOVAKIA BUILDING & CONSTRUCTION IN GRAPHITE MARKET, BY PHYSICAL FORM, 2021-2030 (USD THOUSAND)
TABLE 432 SLOVAKIA MEDICAL DIAGNOSTICS IN GRAPHITE MARKET, BY PHYSICAL FORM, 2021-2030 (USD THOUSAND)
TABLE 433 SLOVAKIA DEFENSE IN GRAPHITE MARKET, BY PHYSICAL FORM, 2021-2030 (USD THOUSAND)
TABLE 434 ROMANIA GRAPHITE MARKET, BY PRODUCT TYPE 2021-2030 (USD THOUSAND)
TABLE 435 ROMANIA GRAPHITE MARKET, BY PHYSICAL FORM, 2021-2030 (USD THOUSAND)
TABLE 436 ROMANIA GRAPHITE MARKET, BY APPLICATION, 2021-2030 (USD THOUSAND)
TABLE 437 ROMANIA CONSUMER ELECTRONICS IN GRAPHITE MARKET, BY APPLICATION, 2021-2030 (USD THOUSAND)
TABLE 438 ROMANIA CONSUMER ELECTRONICS IN GRAPHITE MARKET, BY PHYSICAL FORM, 2021-2030 (USD THOUSAND)
TABLE 439 ROMANIA TRANSPORTATION IN GRAPHITE MARKET, BY APPLICATION, 2021-2030 (USD THOUSAND)
TABLE 440 ROMANIA BATTERIES IN GRAPHITE MARKET, BY APPLICATION, 2021-2030 (USD THOUSAND)
TABLE 441 ROMANIA FUEL CELLS IN GRAPHITE MARKET, BY APPLICATION, 2021-2030 (USD THOUSAND)
TABLE 442 ROMANIA INTERIOR IN GRAPHITE MARKET, BY APPLICATION, 2021-2030 (USD THOUSAND)
TABLE 443 ROMANIA TRANSPORTATION IN GRAPHITE MARKET, BY PHYSICAL FORM, 2021-2030 (USD THOUSAND)
TABLE 444 ROMANIA INDUSTRIAL IN GRAPHITE MARKET, BY APPLICATION, 2021-2030 (USD THOUSAND)
TABLE 445 ROMANIA INDUSTRIAL IN GRAPHITE MARKET, BY PHYSICAL FORM, 2021-2030 (USD THOUSAND)
TABLE 446 ROMANIA BUILDING & CONSTRUCTION IN GRAPHITE MARKET, BY APPLICATION, 2021-2030 (USD THOUSAND)
TABLE 447 ROMANIA BUILDING & CONSTRUCTION IN GRAPHITE MARKET, BY PHYSICAL FORM, 2021-2030 (USD THOUSAND)
TABLE 448 ROMANIA MEDICAL DIAGNOSTICS IN GRAPHITE MARKET, BY PHYSICAL FORM, 2021-2030 (USD THOUSAND)
TABLE 449 ROMANIA DEFENSE IN GRAPHITE MARKET, BY PHYSICAL FORM, 2021-2030 (USD THOUSAND)
TABLE 450 SWEDEN GRAPHITE MARKET, BY PRODUCT TYPE 2021-2030 (USD THOUSAND)
TABLE 451 SWEDEN GRAPHITE MARKET, BY PHYSICAL FORM, 2021-2030 (USD THOUSAND)
TABLE 452 SWEDEN GRAPHITE MARKET, BY APPLICATION, 2021-2030 (USD THOUSAND)
TABLE 453 SWEDEN CONSUMER ELECTRONICS IN GRAPHITE MARKET, BY APPLICATION, 2021-2030 (USD THOUSAND)
TABLE 454 SWEDEN CONSUMER ELECTRONICS IN GRAPHITE MARKET, BY PHYSICAL FORM, 2021-2030 (USD THOUSAND)
TABLE 455 SWEDEN TRANSPORTATION IN GRAPHITE MARKET, BY APPLICATION, 2021-2030 (USD THOUSAND)
TABLE 456 SWEDEN BATTERIES IN GRAPHITE MARKET, BY APPLICATION, 2021-2030 (USD THOUSAND)
TABLE 457 SWEDEN FUEL CELLS IN GRAPHITE MARKET, BY APPLICATION, 2021-2030 (USD THOUSAND)
TABLE 458 SWEDEN INTERIOR IN GRAPHITE MARKET, BY APPLICATION, 2021-2030 (USD THOUSAND)
TABLE 459 SWEDEN TRANSPORTATION IN GRAPHITE MARKET, BY PHYSICAL FORM, 2021-2030 (USD THOUSAND)
TABLE 460 SWEDEN INDUSTRIAL IN GRAPHITE MARKET, BY APPLICATION, 2021-2030 (USD THOUSAND)
TABLE 461 SWEDEN INDUSTRIAL IN GRAPHITE MARKET, BY PHYSICAL FORM, 2021-2030 (USD THOUSAND)
TABLE 462 SWEDEN BUILDING & CONSTRUCTION IN GRAPHITE MARKET, BY APPLICATION, 2021-2030 (USD THOUSAND)
TABLE 463 SWEDEN BUILDING & CONSTRUCTION IN GRAPHITE MARKET, BY PHYSICAL FORM, 2021-2030 (USD THOUSAND)
TABLE 464 SWEDEN MEDICAL DIAGNOSTICS IN GRAPHITE MARKET, BY PHYSICAL FORM, 2021-2030 (USD THOUSAND)
TABLE 465 SWEDEN DEFENSE IN GRAPHITE MARKET, BY PHYSICAL FORM, 2021-2030 (USD THOUSAND)
TABLE 466 SWITZERLAND GRAPHITE MARKET, BY PRODUCT TYPE 2021-2030 (USD THOUSAND)
TABLE 467 SWITZERLAND GRAPHITE MARKET, BY PHYSICAL FORM, 2021-2030 (USD THOUSAND)
TABLE 468 SWITZERLAND GRAPHITE MARKET, BY APPLICATION, 2021-2030 (USD THOUSAND)
TABLE 469 SWITZERLAND CONSUMER ELECTRONICS IN GRAPHITE MARKET, BY APPLICATION, 2021-2030 (USD THOUSAND)
TABLE 470 SWITZERLAND CONSUMER ELECTRONICS IN GRAPHITE MARKET, BY PHYSICAL FORM, 2021-2030 (USD THOUSAND)
TABLE 471 SWITZERLAND TRANSPORTATION IN GRAPHITE MARKET, BY APPLICATION, 2021-2030 (USD THOUSAND)
TABLE 472 SWITZERLAND BATTERIES IN GRAPHITE MARKET, BY APPLICATION, 2021-2030 (USD THOUSAND)
TABLE 473 SWITZERLAND FUEL CELLS IN GRAPHITE MARKET, BY APPLICATION, 2021-2030 (USD THOUSAND)
TABLE 474 SWITZERLAND INTERIOR IN GRAPHITE MARKET, BY APPLICATION, 2021-2030 (USD THOUSAND)
TABLE 475 SWITZERLAND TRANSPORTATION IN GRAPHITE MARKET, BY PHYSICAL FORM, 2021-2030 (USD THOUSAND)
TABLE 476 SWITZERLAND INDUSTRIAL IN GRAPHITE MARKET, BY APPLICATION, 2021-2030 (USD THOUSAND)
TABLE 477 SWITZERLAND INDUSTRIAL IN GRAPHITE MARKET, BY PHYSICAL FORM, 2021-2030 (USD THOUSAND)
TABLE 478 SWITZERLAND BUILDING & CONSTRUCTION IN GRAPHITE MARKET, BY APPLICATION, 2021-2030 (USD THOUSAND)
TABLE 479 SWITZERLAND BUILDING & CONSTRUCTION IN GRAPHITE MARKET, BY PHYSICAL FORM, 2021-2030 (USD THOUSAND)
TABLE 480 SWITZERLAND MEDICAL DIAGNOSTICS IN GRAPHITE MARKET, BY PHYSICAL FORM, 2021-2030 (USD THOUSAND)
TABLE 481 SWITZERLAND DEFENSE IN GRAPHITE MARKET, BY PHYSICAL FORM, 2021-2030 (USD THOUSAND)
TABLE 482 DENMARK GRAPHITE MARKET, BY PRODUCT TYPE 2021-2030 (USD THOUSAND)
TABLE 483 DENMARK GRAPHITE MARKET, BY PHYSICAL FORM, 2021-2030 (USD THOUSAND)
TABLE 484 DENMARK GRAPHITE MARKET, BY APPLICATION, 2021-2030 (USD THOUSAND)
TABLE 485 DENMARK CONSUMER ELECTRONICS IN GRAPHITE MARKET, BY APPLICATION, 2021-2030 (USD THOUSAND)
TABLE 486 DENMARK CONSUMER ELECTRONICS IN GRAPHITE MARKET, BY PHYSICAL FORM, 2021-2030 (USD THOUSAND)
TABLE 487 DENMARK TRANSPORTATION IN GRAPHITE MARKET, BY APPLICATION, 2021-2030 (USD THOUSAND)
TABLE 488 DENMARK BATTERIES IN GRAPHITE MARKET, BY APPLICATION, 2021-2030 (USD THOUSAND)
TABLE 489 DENMARK FUEL CELLS IN GRAPHITE MARKET, BY APPLICATION, 2021-2030 (USD THOUSAND)
TABLE 490 DENMARK INTERIOR IN GRAPHITE MARKET, BY APPLICATION, 2021-2030 (USD THOUSAND)
TABLE 491 DENMARK TRANSPORTATION IN GRAPHITE MARKET, BY PHYSICAL FORM, 2021-2030 (USD THOUSAND)
TABLE 492 DENMARK INDUSTRIAL IN GRAPHITE MARKET, BY APPLICATION, 2021-2030 (USD THOUSAND)
TABLE 493 DENMARK INDUSTRIAL IN GRAPHITE MARKET, BY PHYSICAL FORM, 2021-2030 (USD THOUSAND)
TABLE 494 DENMARK BUILDING & CONSTRUCTION IN GRAPHITE MARKET, BY APPLICATION, 2021-2030 (USD THOUSAND)
TABLE 495 DENMARK BUILDING & CONSTRUCTION IN GRAPHITE MARKET, BY PHYSICAL FORM, 2021-2030 (USD THOUSAND)
TABLE 496 DENMARK MEDICAL DIAGNOSTICS IN GRAPHITE MARKET, BY PHYSICAL FORM, 2021-2030 (USD THOUSAND)
TABLE 497 DENMARK DEFENSE IN GRAPHITE MARKET, BY PHYSICAL FORM, 2021-2030 (USD THOUSAND)
TABLE 498 SLOVENIA GRAPHITE MARKET, BY PRODUCT TYPE 2021-2030 (USD THOUSAND)
TABLE 499 SLOVENIA GRAPHITE MARKET, BY PHYSICAL FORM, 2021-2030 (USD THOUSAND)
TABLE 500 SLOVENIA GRAPHITE MARKET, BY APPLICATION, 2021-2030 (USD THOUSAND)
TABLE 501 SLOVENIA CONSUMER ELECTRONICS IN GRAPHITE MARKET, BY APPLICATION, 2021-2030 (USD THOUSAND)
TABLE 502 SLOVENIA CONSUMER ELECTRONICS IN GRAPHITE MARKET, BY PHYSICAL FORM, 2021-2030 (USD THOUSAND)
TABLE 503 SLOVENIA TRANSPORTATION IN GRAPHITE MARKET, BY APPLICATION, 2021-2030 (USD THOUSAND)
TABLE 504 SLOVENIA BATTERIES IN GRAPHITE MARKET, BY APPLICATION, 2021-2030 (USD THOUSAND)
TABLE 505 SLOVENIA FUEL CELLS IN GRAPHITE MARKET, BY APPLICATION, 2021-2030 (USD THOUSAND)
TABLE 506 SLOVENIA INTERIOR IN GRAPHITE MARKET, BY APPLICATION, 2021-2030 (USD THOUSAND)
TABLE 507 SLOVENIA TRANSPORTATION IN GRAPHITE MARKET, BY PHYSICAL FORM, 2021-2030 (USD THOUSAND)
TABLE 508 SLOVENIA INDUSTRIAL IN GRAPHITE MARKET, BY APPLICATION, 2021-2030 (USD THOUSAND)
TABLE 509 SLOVENIA INDUSTRIAL IN GRAPHITE MARKET, BY PHYSICAL FORM, 2021-2030 (USD THOUSAND)
TABLE 510 SLOVENIA BUILDING & CONSTRUCTION IN GRAPHITE MARKET, BY APPLICATION, 2021-2030 (USD THOUSAND)
TABLE 511 SLOVENIA BUILDING & CONSTRUCTION IN GRAPHITE MARKET, BY PHYSICAL FORM, 2021-2030 (USD THOUSAND)
TABLE 512 SLOVENIA MEDICAL DIAGNOSTICS IN GRAPHITE MARKET, BY PHYSICAL FORM, 2021-2030 (USD THOUSAND)
TABLE 513 SLOVENIA DEFENSE IN GRAPHITE MARKET, BY PHYSICAL FORM, 2021-2030 (USD THOUSAND)
TABLE 514 GREECE GRAPHITE MARKET, BY PRODUCT TYPE 2021-2030 (USD THOUSAND)
TABLE 515 GREECE GRAPHITE MARKET, BY PHYSICAL FORM, 2021-2030 (USD THOUSAND)
TABLE 516 GREECE GRAPHITE MARKET, BY APPLICATION, 2021-2030 (USD THOUSAND)
TABLE 517 GREECE CONSUMER ELECTRONICS IN GRAPHITE MARKET, BY APPLICATION, 2021-2030 (USD THOUSAND)
TABLE 518 GREECE CONSUMER ELECTRONICS IN GRAPHITE MARKET, BY PHYSICAL FORM, 2021-2030 (USD THOUSAND)
TABLE 519 GREECE TRANSPORTATION IN GRAPHITE MARKET, BY APPLICATION, 2021-2030 (USD THOUSAND)
TABLE 520 GREECE BATTERIES IN GRAPHITE MARKET, BY APPLICATION, 2021-2030 (USD THOUSAND)
TABLE 521 GREECE FUEL CELLS IN GRAPHITE MARKET, BY APPLICATION, 2021-2030 (USD THOUSAND)
TABLE 522 GREECE INTERIOR IN GRAPHITE MARKET, BY APPLICATION, 2021-2030 (USD THOUSAND)
TABLE 523 GREECE TRANSPORTATION IN GRAPHITE MARKET, BY PHYSICAL FORM, 2021-2030 (USD THOUSAND)
TABLE 524 GREECE INDUSTRIAL IN GRAPHITE MARKET, BY APPLICATION, 2021-2030 (USD THOUSAND)
TABLE 525 GREECE INDUSTRIAL IN GRAPHITE MARKET, BY PHYSICAL FORM, 2021-2030 (USD THOUSAND)
TABLE 526 GREECE BUILDING & CONSTRUCTION IN GRAPHITE MARKET, BY APPLICATION, 2021-2030 (USD THOUSAND)
TABLE 527 GREECE BUILDING & CONSTRUCTION IN GRAPHITE MARKET, BY PHYSICAL FORM, 2021-2030 (USD THOUSAND)
TABLE 528 GREECE MEDICAL DIAGNOSTICS IN GRAPHITE MARKET, BY PHYSICAL FORM, 2021-2030 (USD THOUSAND)
TABLE 529 GREECE DEFENSE IN GRAPHITE MARKET, BY PHYSICAL FORM, 2021-2030 (USD THOUSAND)
TABLE 530 FINLAND GRAPHITE MARKET, BY PRODUCT TYPE 2021-2030 (USD THOUSAND)
TABLE 531 FINLAND GRAPHITE MARKET, BY PHYSICAL FORM, 2021-2030 (USD THOUSAND)
TABLE 532 FINLAND GRAPHITE MARKET, BY APPLICATION, 2021-2030 (USD THOUSAND)
TABLE 533 FINLAND CONSUMER ELECTRONICS IN GRAPHITE MARKET, BY APPLICATION, 2021-2030 (USD THOUSAND)
TABLE 534 FINLAND CONSUMER ELECTRONICS IN GRAPHITE MARKET, BY PHYSICAL FORM, 2021-2030 (USD THOUSAND)
TABLE 535 FINLAND TRANSPORTATION IN GRAPHITE MARKET, BY APPLICATION, 2021-2030 (USD THOUSAND)
TABLE 536 FINLAND BATTERIES IN GRAPHITE MARKET, BY APPLICATION, 2021-2030 (USD THOUSAND)
TABLE 537 FINLAND FUEL CELLS IN GRAPHITE MARKET, BY APPLICATION, 2021-2030 (USD THOUSAND)
TABLE 538 FINLAND INTERIOR IN GRAPHITE MARKET, BY APPLICATION, 2021-2030 (USD THOUSAND)
TABLE 539 FINLAND TRANSPORTATION IN GRAPHITE MARKET, BY PHYSICAL FORM, 2021-2030 (USD THOUSAND)
TABLE 540 FINLAND INDUSTRIAL IN GRAPHITE MARKET, BY APPLICATION, 2021-2030 (USD THOUSAND)
TABLE 541 FINLAND INDUSTRIAL IN GRAPHITE MARKET, BY PHYSICAL FORM, 2021-2030 (USD THOUSAND)
TABLE 542 FINLAND BUILDING & CONSTRUCTION IN GRAPHITE MARKET, BY APPLICATION, 2021-2030 (USD THOUSAND)
TABLE 543 FINLAND BUILDING & CONSTRUCTION IN GRAPHITE MARKET, BY PHYSICAL FORM, 2021-2030 (USD THOUSAND)
TABLE 544 FINLAND MEDICAL DIAGNOSTICS IN GRAPHITE MARKET, BY PHYSICAL FORM, 2021-2030 (USD THOUSAND)
TABLE 545 FINLAND DEFENSE IN GRAPHITE MARKET, BY PHYSICAL FORM, 2021-2030 (USD THOUSAND)
TABLE 546 IRELAND GRAPHITE MARKET, BY PRODUCT TYPE 2021-2030 (USD THOUSAND)
TABLE 547 IRELAND GRAPHITE MARKET, BY PHYSICAL FORM, 2021-2030 (USD THOUSAND)
TABLE 548 IRELAND GRAPHITE MARKET, BY APPLICATION, 2021-2030 (USD THOUSAND)
TABLE 549 IRELAND CONSUMER ELECTRONICS IN GRAPHITE MARKET, BY APPLICATION, 2021-2030 (USD THOUSAND)
TABLE 550 IRELAND CONSUMER ELECTRONICS IN GRAPHITE MARKET, BY PHYSICAL FORM, 2021-2030 (USD THOUSAND)
TABLE 551 IRELAND TRANSPORTATION IN GRAPHITE MARKET, BY APPLICATION, 2021-2030 (USD THOUSAND)
TABLE 552 IRELAND BATTERIES IN GRAPHITE MARKET, BY APPLICATION, 2021-2030 (USD THOUSAND)
TABLE 553 IRELAND FUEL CELLS IN GRAPHITE MARKET, BY APPLICATION, 2021-2030 (USD THOUSAND)
TABLE 554 IRELAND INTERIOR IN GRAPHITE MARKET, BY APPLICATION, 2021-2030 (USD THOUSAND)
TABLE 555 IRELAND TRANSPORTATION IN GRAPHITE MARKET, BY PHYSICAL FORM, 2021-2030 (USD THOUSAND)
TABLE 556 IRELAND INDUSTRIAL IN GRAPHITE MARKET, BY APPLICATION, 2021-2030 (USD THOUSAND)
TABLE 557 IRELAND INDUSTRIAL IN GRAPHITE MARKET, BY PHYSICAL FORM, 2021-2030 (USD THOUSAND)
TABLE 558 IRELAND BUILDING & CONSTRUCTION IN GRAPHITE MARKET, BY APPLICATION, 2021-2030 (USD THOUSAND)
TABLE 559 IRELAND BUILDING & CONSTRUCTION IN GRAPHITE MARKET, BY PHYSICAL FORM, 2021-2030 (USD THOUSAND)
TABLE 560 IRELAND MEDICAL DIAGNOSTICS IN GRAPHITE MARKET, BY PHYSICAL FORM, 2021-2030 (USD THOUSAND)
TABLE 561 IRELAND DEFENSE IN GRAPHITE MARKET, BY PHYSICAL FORM, 2021-2030 (USD THOUSAND)
TABLE 562 BULGARIA GRAPHITE MARKET, BY PRODUCT TYPE 2021-2030 (USD THOUSAND)
TABLE 563 BULGARIA GRAPHITE MARKET, BY PHYSICAL FORM, 2021-2030 (USD THOUSAND)
TABLE 564 BULGARIA GRAPHITE MARKET, BY APPLICATION, 2021-2030 (USD THOUSAND)
TABLE 565 BULGARIA CONSUMER ELECTRONICS IN GRAPHITE MARKET, BY APPLICATION, 2021-2030 (USD THOUSAND)
TABLE 566 BULGARIA CONSUMER ELECTRONICS IN GRAPHITE MARKET, BY PHYSICAL FORM, 2021-2030 (USD THOUSAND)
TABLE 567 BULGARIA TRANSPORTATION IN GRAPHITE MARKET, BY APPLICATION, 2021-2030 (USD THOUSAND)
TABLE 568 BULGARIA BATTERIES IN GRAPHITE MARKET, BY APPLICATION, 2021-2030 (USD THOUSAND)
TABLE 569 BULGARIA FUEL CELLS IN GRAPHITE MARKET, BY APPLICATION, 2021-2030 (USD THOUSAND)
TABLE 570 BULGARIA INTERIOR IN GRAPHITE MARKET, BY APPLICATION, 2021-2030 (USD THOUSAND)
TABLE 571 BULGARIA TRANSPORTATION IN GRAPHITE MARKET, BY PHYSICAL FORM, 2021-2030 (USD THOUSAND)
TABLE 572 BULGARIA INDUSTRIAL IN GRAPHITE MARKET, BY APPLICATION, 2021-2030 (USD THOUSAND)
TABLE 573 BULGARIA INDUSTRIAL IN GRAPHITE MARKET, BY PHYSICAL FORM, 2021-2030 (USD THOUSAND)
TABLE 574 BULGARIA BUILDING & CONSTRUCTION IN GRAPHITE MARKET, BY APPLICATION, 2021-2030 (USD THOUSAND)
TABLE 575 BULGARIA BUILDING & CONSTRUCTION IN GRAPHITE MARKET, BY PHYSICAL FORM, 2021-2030 (USD THOUSAND)
TABLE 576 BULGARIA MEDICAL DIAGNOSTICS IN GRAPHITE MARKET, BY PHYSICAL FORM, 2021-2030 (USD THOUSAND)
TABLE 577 BULGARIA DEFENSE IN GRAPHITE MARKET, BY PHYSICAL FORM, 2021-2030 (USD THOUSAND)
TABLE 578 LITHUANIA GRAPHITE MARKET, BY PRODUCT TYPE 2021-2030 (USD THOUSAND)
TABLE 579 LITHUANIA GRAPHITE MARKET, BY PHYSICAL FORM, 2021-2030 (USD THOUSAND)
TABLE 580 LITHUANIA GRAPHITE MARKET, BY APPLICATION, 2021-2030 (USD THOUSAND)
TABLE 581 LITHUANIA CONSUMER ELECTRONICS IN GRAPHITE MARKET, BY APPLICATION, 2021-2030 (USD THOUSAND)
TABLE 582 LITHUANIA CONSUMER ELECTRONICS IN GRAPHITE MARKET, BY PHYSICAL FORM, 2021-2030 (USD THOUSAND)
TABLE 583 LITHUANIA TRANSPORTATION IN GRAPHITE MARKET, BY APPLICATION, 2021-2030 (USD THOUSAND)
TABLE 584 LITHUANIA BATTERIES IN GRAPHITE MARKET, BY APPLICATION, 2021-2030 (USD THOUSAND)
TABLE 585 LITHUANIA FUEL CELLS IN GRAPHITE MARKET, BY APPLICATION, 2021-2030 (USD THOUSAND)
TABLE 586 LITHUANIA INTERIOR IN GRAPHITE MARKET, BY APPLICATION, 2021-2030 (USD THOUSAND)
TABLE 587 LITHUANIA TRANSPORTATION IN GRAPHITE MARKET, BY PHYSICAL FORM, 2021-2030 (USD THOUSAND)
TABLE 588 LITHUANIA INDUSTRIAL IN GRAPHITE MARKET, BY APPLICATION, 2021-2030 (USD THOUSAND)
TABLE 589 LITHUANIA INDUSTRIAL IN GRAPHITE MARKET, BY PHYSICAL FORM, 2021-2030 (USD THOUSAND)
TABLE 590 LITHUANIA BUILDING & CONSTRUCTION IN GRAPHITE MARKET, BY APPLICATION, 2021-2030 (USD THOUSAND)
TABLE 591 LITHUANIA BUILDING & CONSTRUCTION IN GRAPHITE MARKET, BY PHYSICAL FORM, 2021-2030 (USD THOUSAND)
TABLE 592 LITHUANIA MEDICAL DIAGNOSTICS IN GRAPHITE MARKET, BY PHYSICAL FORM, 2021-2030 (USD THOUSAND)
TABLE 593 LITHUANIA DEFENSE IN GRAPHITE MARKET, BY PHYSICAL FORM, 2021-2030 (USD THOUSAND)
TABLE 594 CROATIA GRAPHITE MARKET, BY PRODUCT TYPE 2021-2030 (USD THOUSAND)
TABLE 595 CROATIA GRAPHITE MARKET, BY PHYSICAL FORM, 2021-2030 (USD THOUSAND)
TABLE 596 CROATIA GRAPHITE MARKET, BY APPLICATION, 2021-2030 (USD THOUSAND)
TABLE 597 CROATIA CONSUMER ELECTRONICS IN GRAPHITE MARKET, BY APPLICATION, 2021-2030 (USD THOUSAND)
TABLE 598 CROATIA CONSUMER ELECTRONICS IN GRAPHITE MARKET, BY PHYSICAL FORM, 2021-2030 (USD THOUSAND)
TABLE 599 CROATIA TRANSPORTATION IN GRAPHITE MARKET, BY APPLICATION, 2021-2030 (USD THOUSAND)
TABLE 600 CROATIA BATTERIES IN GRAPHITE MARKET, BY APPLICATION, 2021-2030 (USD THOUSAND)
TABLE 601 CROATIA FUEL CELLS IN GRAPHITE MARKET, BY APPLICATION, 2021-2030 (USD THOUSAND)
TABLE 602 CROATIA INTERIOR IN GRAPHITE MARKET, BY APPLICATION, 2021-2030 (USD THOUSAND)
TABLE 603 CROATIA TRANSPORTATION IN GRAPHITE MARKET, BY PHYSICAL FORM, 2021-2030 (USD THOUSAND)
TABLE 604 CROATIA INDUSTRIAL IN GRAPHITE MARKET, BY APPLICATION, 2021-2030 (USD THOUSAND)
TABLE 605 CROATIA INDUSTRIAL IN GRAPHITE MARKET, BY PHYSICAL FORM, 2021-2030 (USD THOUSAND)
TABLE 606 CROATIA BUILDING & CONSTRUCTION IN GRAPHITE MARKET, BY APPLICATION, 2021-2030 (USD THOUSAND)
TABLE 607 CROATIA BUILDING & CONSTRUCTION IN GRAPHITE MARKET, BY PHYSICAL FORM, 2021-2030 (USD THOUSAND)
TABLE 608 CROATIA MEDICAL DIAGNOSTICS IN GRAPHITE MARKET, BY PHYSICAL FORM, 2021-2030 (USD THOUSAND)
TABLE 609 CROATIA DEFENSE IN GRAPHITE MARKET, BY PHYSICAL FORM, 2021-2030 (USD THOUSAND)
TABLE 610 PORTUGAL GRAPHITE MARKET, BY PRODUCT TYPE 2021-2030 (USD THOUSAND)
TABLE 611 PORTUGAL GRAPHITE MARKET, BY PHYSICAL FORM, 2021-2030 (USD THOUSAND)
TABLE 612 PORTUGAL GRAPHITE MARKET, BY APPLICATION, 2021-2030 (USD THOUSAND)
TABLE 613 PORTUGAL CONSUMER ELECTRONICS IN GRAPHITE MARKET, BY APPLICATION, 2021-2030 (USD THOUSAND)
TABLE 614 PORTUGAL CONSUMER ELECTRONICS IN GRAPHITE MARKET, BY PHYSICAL FORM, 2021-2030 (USD THOUSAND)
TABLE 615 PORTUGAL TRANSPORTATION IN GRAPHITE MARKET, BY APPLICATION, 2021-2030 (USD THOUSAND)
TABLE 616 PORTUGAL BATTERIES IN GRAPHITE MARKET, BY APPLICATION, 2021-2030 (USD THOUSAND)
TABLE 617 PORTUGAL FUEL CELLS IN GRAPHITE MARKET, BY APPLICATION, 2021-2030 (USD THOUSAND)
TABLE 618 PORTUGAL INTERIOR IN GRAPHITE MARKET, BY APPLICATION, 2021-2030 (USD THOUSAND)
TABLE 619 PORTUGAL TRANSPORTATION IN GRAPHITE MARKET, BY PHYSICAL FORM, 2021-2030 (USD THOUSAND)
TABLE 620 PORTUGAL INDUSTRIAL IN GRAPHITE MARKET, BY APPLICATION, 2021-2030 (USD THOUSAND)
TABLE 621 PORTUGAL INDUSTRIAL IN GRAPHITE MARKET, BY PHYSICAL FORM, 2021-2030 (USD THOUSAND)
TABLE 622 PORTUGAL BUILDING & CONSTRUCTION IN GRAPHITE MARKET, BY APPLICATION, 2021-2030 (USD THOUSAND)
TABLE 623 PORTUGAL BUILDING & CONSTRUCTION IN GRAPHITE MARKET, BY PHYSICAL FORM, 2021-2030 (USD THOUSAND)
TABLE 624 PORTUGAL MEDICAL DIAGNOSTICS IN GRAPHITE MARKET, BY PHYSICAL FORM, 2021-2030 (USD THOUSAND)
TABLE 625 PORTUGAL DEFENSE IN GRAPHITE MARKET, BY PHYSICAL FORM, 2021-2030 (USD THOUSAND)
TABLE 626 LUXEMBOURG GRAPHITE MARKET, BY PRODUCT TYPE 2021-2030 (USD THOUSAND)
TABLE 627 LUXEMBOURG GRAPHITE MARKET, BY PHYSICAL FORM, 2021-2030 (USD THOUSAND)
TABLE 628 LUXEMBOURG GRAPHITE MARKET, BY APPLICATION, 2021-2030 (USD THOUSAND)
TABLE 629 LUXEMBOURG CONSUMER ELECTRONICS IN GRAPHITE MARKET, BY APPLICATION, 2021-2030 (USD THOUSAND)
TABLE 630 LUXEMBOURG CONSUMER ELECTRONICS IN GRAPHITE MARKET, BY PHYSICAL FORM, 2021-2030 (USD THOUSAND)
TABLE 631 LUXEMBOURG TRANSPORTATION IN GRAPHITE MARKET, BY APPLICATION, 2021-2030 (USD THOUSAND)
TABLE 632 LUXEMBOURG BATTERIES IN GRAPHITE MARKET, BY APPLICATION, 2021-2030 (USD THOUSAND)
TABLE 633 LUXEMBOURG FUEL CELLS IN GRAPHITE MARKET, BY APPLICATION, 2021-2030 (USD THOUSAND)
TABLE 634 LUXEMBOURG INTERIOR IN GRAPHITE MARKET, BY APPLICATION, 2021-2030 (USD THOUSAND)
TABLE 635 LUXEMBOURG TRANSPORTATION IN GRAPHITE MARKET, BY PHYSICAL FORM, 2021-2030 (USD THOUSAND)
TABLE 636 LUXEMBOURG INDUSTRIAL IN GRAPHITE MARKET, BY APPLICATION, 2021-2030 (USD THOUSAND)
TABLE 637 LUXEMBOURG INDUSTRIAL IN GRAPHITE MARKET, BY PHYSICAL FORM, 2021-2030 (USD THOUSAND)
TABLE 638 LUXEMBOURG BUILDING & CONSTRUCTION IN GRAPHITE MARKET, BY APPLICATION, 2021-2030 (USD THOUSAND)
TABLE 639 LUXEMBOURG BUILDING & CONSTRUCTION IN GRAPHITE MARKET, BY PHYSICAL FORM, 2021-2030 (USD THOUSAND)
TABLE 640 LUXEMBOURG MEDICAL DIAGNOSTICS IN GRAPHITE MARKET, BY PHYSICAL FORM, 2021-2030 (USD THOUSAND)
TABLE 641 LUXEMBOURG DEFENSE IN GRAPHITE MARKET, BY PHYSICAL FORM, 2021-2030 (USD THOUSAND)
TABLE 642 MALTA GRAPHITE MARKET, BY PRODUCT TYPE 2021-2030 (USD THOUSAND)
TABLE 643 MALTA GRAPHITE MARKET, BY PHYSICAL FORM, 2021-2030 (USD THOUSAND)
TABLE 644 MALTA GRAPHITE MARKET, BY APPLICATION, 2021-2030 (USD THOUSAND)
TABLE 645 MALTA CONSUMER ELECTRONICS IN GRAPHITE MARKET, BY APPLICATION, 2021-2030 (USD THOUSAND)
TABLE 646 MALTA CONSUMER ELECTRONICS IN GRAPHITE MARKET, BY PHYSICAL FORM, 2021-2030 (USD THOUSAND)
TABLE 647 MALTA TRANSPORTATION IN GRAPHITE MARKET, BY APPLICATION, 2021-2030 (USD THOUSAND)
TABLE 648 MALTA BATTERIES IN GRAPHITE MARKET, BY APPLICATION, 2021-2030 (USD THOUSAND)
TABLE 649 MALTA FUEL CELLS IN GRAPHITE MARKET, BY APPLICATION, 2021-2030 (USD THOUSAND)
TABLE 650 MALTA INTERIOR IN GRAPHITE MARKET, BY APPLICATION, 2021-2030 (USD THOUSAND)
TABLE 651 MALTA TRANSPORTATION IN GRAPHITE MARKET, BY PHYSICAL FORM, 2021-2030 (USD THOUSAND)
TABLE 652 MALTA INDUSTRIAL IN GRAPHITE MARKET, BY APPLICATION, 2021-2030 (USD THOUSAND)
TABLE 653 MALTA INDUSTRIAL IN GRAPHITE MARKET, BY PHYSICAL FORM, 2021-2030 (USD THOUSAND)
TABLE 654 MALTA BUILDING & CONSTRUCTION IN GRAPHITE MARKET, BY APPLICATION, 2021-2030 (USD THOUSAND)
TABLE 655 MALTA BUILDING & CONSTRUCTION IN GRAPHITE MARKET, BY PHYSICAL FORM, 2021-2030 (USD THOUSAND)
TABLE 656 MALTA MEDICAL DIAGNOSTICS IN GRAPHITE MARKET, BY PHYSICAL FORM, 2021-2030 (USD THOUSAND)
TABLE 657 MALTA DEFENSE IN GRAPHITE MARKET, BY PHYSICAL FORM, 2021-2030 (USD THOUSAND)
TABLE 658 CYPRUS GRAPHITE MARKET, BY PRODUCT TYPE 2021-2030 (USD THOUSAND)
TABLE 659 CYPRUS GRAPHITE MARKET, BY PHYSICAL FORM, 2021-2030 (USD THOUSAND)
TABLE 660 CYPRUS GRAPHITE MARKET, BY APPLICATION, 2021-2030 (USD THOUSAND)
TABLE 661 CYPRUS CONSUMER ELECTRONICS IN GRAPHITE MARKET, BY APPLICATION, 2021-2030 (USD THOUSAND)
TABLE 662 CYPRUS CONSUMER ELECTRONICS IN GRAPHITE MARKET, BY PHYSICAL FORM, 2021-2030 (USD THOUSAND)
TABLE 663 CYPRUS TRANSPORTATION IN GRAPHITE MARKET, BY APPLICATION, 2021-2030 (USD THOUSAND)
TABLE 664 CYPRUS BATTERIES IN GRAPHITE MARKET, BY APPLICATION, 2021-2030 (USD THOUSAND)
TABLE 665 CYPRUS TRANSPORTATION IN GRAPHITE MARKET, BY APPLICATION, 2021-2030 (USD THOUSAND)
TABLE 666 CYPRUS INTERIOR IN GRAPHITE MARKET, BY APPLICATION, 2021-2030 (USD THOUSAND)
TABLE 667 CYPRUS TRANSPORTATION IN GRAPHITE MARKET, BY PHYSICAL FORM, 2021-2030 (USD THOUSAND)
TABLE 668 CYPRUS INDUSTRIAL IN GRAPHITE MARKET, BY APPLICATION, 2021-2030 (USD THOUSAND)
TABLE 669 CYPRUS INDUSTRIAL IN GRAPHITE MARKET, BY PHYSICAL FORM, 2021-2030 (USD THOUSAND)
TABLE 670 CYPRUS BUILDING & CONSTRUCTION IN GRAPHITE MARKET, BY APPLICATION, 2021-2030 (USD THOUSAND)
TABLE 671 CYPRUS BUILDING & CONSTRUCTION IN GRAPHITE MARKET, BY PHYSICAL FORM, 2021-2030 (USD THOUSAND)
TABLE 672 CYPRUS MEDICAL DIAGNOSTICS IN GRAPHITE MARKET, BY PHYSICAL FORM, 2021-2030 (USD THOUSAND)
TABLE 673 CYPRUS DEFENSE IN GRAPHITE MARKET, BY PHYSICAL FORM, 2021-2030 (USD THOUSAND)
TABLE 674 ESTONIA GRAPHITE MARKET, BY PRODUCT TYPE 2021-2030 (USD THOUSAND)
TABLE 675 ESTONIA GRAPHITE MARKET, BY PHYSICAL FORM, 2021-2030 (USD THOUSAND)
TABLE 676 ESTONIA GRAPHITE MARKET, BY APPLICATION, 2021-2030 (USD THOUSAND)
TABLE 677 ESTONIA CONSUMER ELECTRONICS IN GRAPHITE MARKET, BY APPLICATION, 2021-2030 (USD THOUSAND)
TABLE 678 ESTONIA CONSUMER ELECTRONICS IN GRAPHITE MARKET, BY PHYSICAL FORM, 2021-2030 (USD THOUSAND)
TABLE 679 ESTONIA TRANSPORTATION IN GRAPHITE MARKET, BY APPLICATION, 2021-2030 (USD THOUSAND)
TABLE 680 ESTONIA BATTERIES IN GRAPHITE MARKET, BY APPLICATION, 2021-2030 (USD THOUSAND)
TABLE 681 ESTONIA FUEL CELLS IN GRAPHITE MARKET, BY APPLICATION, 2021-2030 (USD THOUSAND)
TABLE 682 ESTONIA INTERIOR IN GRAPHITE MARKET, BY APPLICATION, 2021-2030 (USD THOUSAND)
TABLE 683 ESTONIA TRANSPORTATION IN GRAPHITE MARKET, BY PHYSICAL FORM, 2021-2030 (USD THOUSAND)
TABLE 684 ESTONIA INDUSTRIAL IN GRAPHITE MARKET, BY APPLICATION, 2021-2030 (USD THOUSAND)
TABLE 685 ESTONIA INDUSTRIAL IN GRAPHITE MARKET, BY PHYSICAL FORM, 2021-2030 (USD THOUSAND)
TABLE 686 ESTONIA BUILDING & CONSTRUCTION IN GRAPHITE MARKET, BY APPLICATION, 2021-2030 (USD THOUSAND)
TABLE 687 ESTONIA BUILDING & CONSTRUCTION IN GRAPHITE MARKET, BY PHYSICAL FORM, 2021-2030 (USD THOUSAND)
TABLE 688 ESTONIA MEDICAL DIAGNOSTICS IN GRAPHITE MARKET, BY PHYSICAL FORM, 2021-2030 (USD THOUSAND)
TABLE 689 ESTONIA DEFENSE IN GRAPHITE MARKET, BY PHYSICAL FORM, 2021-2030 (USD THOUSAND)
TABLE 690 LATVIA GRAPHITE MARKET, BY PRODUCT TYPE 2021-2030 (USD THOUSAND)
TABLE 691 LATVIA GRAPHITE MARKET, BY PHYSICAL FORM, 2021-2030 (USD THOUSAND)
TABLE 692 LATVIA GRAPHITE MARKET, BY APPLICATION, 2021-2030 (USD THOUSAND)
TABLE 693 LATVIA CONSUMER ELECTRONICS IN GRAPHITE MARKET, BY APPLICATION, 2021-2030 (USD THOUSAND)
TABLE 694 LATVIA CONSUMER ELECTRONICS IN GRAPHITE MARKET, BY PHYSICAL FORM, 2021-2030 (USD THOUSAND)
TABLE 695 LATVIA TRANSPORTATION IN GRAPHITE MARKET, BY APPLICATION, 2021-2030 (USD THOUSAND)
TABLE 696 LATVIA BATTERIES IN GRAPHITE MARKET, BY APPLICATION, 2021-2030 (USD THOUSAND)
TABLE 697 LATVIA FUEL CELLS IN GRAPHITE MARKET, BY APPLICATION, 2021-2030 (USD THOUSAND)
TABLE 698 LATVIA INTERIOR IN GRAPHITE MARKET, BY APPLICATION, 2021-2030 (USD THOUSAND)
TABLE 699 LATVIA TRANSPORTATION IN GRAPHITE MARKET, BY PHYSICAL FORM, 2021-2030 (USD THOUSAND)
TABLE 700 LATVIA INDUSTRIAL IN GRAPHITE MARKET, BY APPLICATION, 2021-2030 (USD THOUSAND)
TABLE 701 LATVIA INDUSTRIAL IN GRAPHITE MARKET, BY PHYSICAL FORM, 2021-2030 (USD THOUSAND)
TABLE 702 LATVIA BUILDING & CONSTRUCTION IN GRAPHITE MARKET, BY APPLICATION, 2021-2030 (USD THOUSAND)
TABLE 703 LATVIA BUILDING & CONSTRUCTION IN GRAPHITE MARKET, BY PHYSICAL FORM, 2021-2030 (USD THOUSAND)
TABLE 704 LATVIA MEDICAL DIAGNOSTICS IN GRAPHITE MARKET, BY PHYSICAL FORM, 2021-2030 (USD THOUSAND)
TABLE 705 LATVIA DEFENSE IN GRAPHITE MARKET, BY PHYSICAL FORM, 2021-2030 (USD THOUSAND)
TABLE 706 REST OF EUROPE GRAPHITE MARKET, BY PRODUCT TYPE 2021-2030 (USD THOUSAND)
TABLE 707 NORTH AMERICA GRAPHITE MARKET, BY REGION, 2021-2030 (USD THOUSAND)
TABLE 708 NORTH AMERICA GRAPHITE MARKET, BY PRODUCT TYPE, 2021-2030 (USD THOUSAND)
TABLE 709 NORTH AMERICA GRAPHITE MARKET, BY PHYSICAL FORM, 2021-2030 (USD THOUSAND)
TABLE 710 NORTH AMERICA GRAPHITE MARKET, BY APPLICATION, 2021-2030 (USD THOUSAND)
TABLE 711 NORTH AMERICA CONSUMER ELECTRONICS IN GRAPHITE MARKET, BY APPLICATION, 2021-2030 (USD THOUSAND)
TABLE 712 NORTH AMERICA CONSUMER ELECTRONICS IN GRAPHITE MARKET, BY PHYSICAL FORM, 2021-2030 (USD THOUSAND)
TABLE 713 NORTH AMERICA TRANSPORTATION IN GRAPHITE MARKET, BY APPLICATION, 2021-2030 (USD THOUSAND)
TABLE 714 NORTH AMERICA BATTERIES IN GRAPHITE MARKET, BY APPLICATION, 2021-2030 (USD THOUSAND)
TABLE 715 NORTH AMERICA FUEL CELLS IN GRAPHITE MARKET, BY APPLICATION, 2021-2030 (USD THOUSAND)
TABLE 716 NORTH AMERICA INTERIOR IN GRAPHITE MARKET, BY APPLICATION, 2021-2030 (USD THOUSAND)
TABLE 717 NORTH AMERICA TRANSPORTATION IN GRAPHITE MARKET, BY PHYSICAL FORM, 2021-2030 (USD THOUSAND)
TABLE 718 NORTH AMERICA INDUSTRIAL IN GRAPHITE MARKET, BY APPLICATION, 2021-2030 (USD THOUSAND)
TABLE 719 NORTH AMERICA INDUSTRIAL IN GRAPHITE MARKET, BY PHYSICAL FORM, 2021-2030 (USD THOUSAND)
TABLE 720 NORTH AMERICA BUILDING & CONSTRUCTION IN GRAPHITE MARKET, BY APPLICATION, 2021-2030 (USD THOUSAND)
TABLE 721 NORTH AMERICA BUILDING & CONSTRUCTION IN GRAPHITE MARKET, BY PHYSICAL FORM, 2021-2030 (USD THOUSAND)
TABLE 722 NORTH AMERICA MEDICAL DIAGNOSTICS IN GRAPHITE MARKET, BY PHYSICAL FORM, 2021-2030 (USD THOUSAND)
TABLE 723 NORTH AMERICA DEFENSE IN GRAPHITE MARKET, BY PHYSICAL FORM, 2021-2030 (USD THOUSAND)
TABLE 724 U.S. GRAPHITE MARKET, BY PRODUCT TYPE 2021-2030 (USD THOUSAND)
TABLE 725 U.S. GRAPHITE MARKET, BY PHYSICAL FORM, 2021-2030 (USD THOUSAND)
TABLE 726 U.S. GRAPHITE MARKET, BY APPLICATION, 2021-2030 (USD THOUSAND)
TABLE 727 U.S. CONSUMER ELECTRONICS IN GRAPHITE MARKET, BY APPLICATION, 2021-2030 (USD THOUSAND)
TABLE 728 U.S. CONSUMER ELECTRONICS IN GRAPHITE MARKET, BY PHYSICAL FORM, 2021-2030 (USD THOUSAND)
TABLE 729 U.S. TRANSPORTATION IN GRAPHITE MARKET, BY APPLICATION, 2021-2030 (USD THOUSAND)
TABLE 730 U.S. BATTERIES IN GRAPHITE MARKET, BY APPLICATION, 2021-2030 (USD THOUSAND)
TABLE 731 U.S. FUEL CELLS IN GRAPHITE MARKET, BY APPLICATION, 2021-2030 (USD THOUSAND)
TABLE 732 U.S. INTERIOR IN GRAPHITE MARKET, BY APPLICATION, 2021-2030 (USD THOUSAND)
TABLE 733 U.S. TRANSPORTATION IN GRAPHITE MARKET, BY PHYSICAL FORM, 2021-2030 (USD THOUSAND)
TABLE 734 U.S. INDUSTRIAL IN GRAPHITE MARKET, BY APPLICATION, 2021-2030 (USD THOUSAND)
TABLE 735 U.S. INDUSTRIAL IN GRAPHITE MARKET, BY PHYSICAL FORM, 2021-2030 (USD THOUSAND)
TABLE 736 U.S. BUILDING & CONSTRUCTION IN GRAPHITE MARKET, BY APPLICATION, 2021-2030 (USD THOUSAND)
TABLE 737 U.S. BUILDING & CONSTRUCTION IN GRAPHITE MARKET, BY PHYSICAL FORM, 2021-2030 (USD THOUSAND)
TABLE 738 U.S. MEDICAL DIAGNOSTICS IN GRAPHITE MARKET, BY PHYSICAL FORM, 2021-2030 (USD THOUSAND)
TABLE 739 U.S. DEFENSE IN GRAPHITE MARKET, BY PHYSICAL FORM, 2021-2030 (USD THOUSAND)
TABLE 740 CANADA GRAPHITE MARKET, BY PRODUCT TYPE 2021-2030 (USD THOUSAND)
TABLE 741 CANADA GRAPHITE MARKET, BY PHYSICAL FORM, 2021-2030 (USD THOUSAND)
TABLE 742 CANADA GRAPHITE MARKET, BY APPLICATION, 2021-2030 (USD THOUSAND)
TABLE 743 CANADA CONSUMER ELECTRONICS IN GRAPHITE MARKET, BY APPLICATION, 2021-2030 (USD THOUSAND)
TABLE 744 CANADA CONSUMER ELECTRONICS IN GRAPHITE MARKET, BY PHYSICAL FORM, 2021-2030 (USD THOUSAND)
TABLE 745 CANADA TRANSPORTATION IN GRAPHITE MARKET, BY APPLICATION, 2021-2030 (USD THOUSAND)
TABLE 746 CANADA BATTERIES IN GRAPHITE MARKET, BY APPLICATION, 2021-2030 (USD THOUSAND)
TABLE 747 CANADA FUEL CELLS IN GRAPHITE MARKET, BY APPLICATION, 2021-2030 (USD THOUSAND)
TABLE 748 CANADA INTERIOR IN GRAPHITE MARKET, BY APPLICATION, 2021-2030 (USD THOUSAND)
TABLE 749 CANADA TRANSPORTATION IN GRAPHITE MARKET, BY PHYSICAL FORM, 2021-2030 (USD THOUSAND)
TABLE 750 CANADA INDUSTRIAL IN GRAPHITE MARKET, BY APPLICATION, 2021-2030 (USD THOUSAND)
TABLE 751 CANADA INDUSTRIAL IN GRAPHITE MARKET, BY PHYSICAL FORM, 2021-2030 (USD THOUSAND)
TABLE 752 CANADA BUILDING & CONSTRUCTION IN GRAPHITE MARKET, BY APPLICATION, 2021-2030 (USD THOUSAND)
TABLE 753 CANADA BUILDING & CONSTRUCTION IN GRAPHITE MARKET, BY PHYSICAL FORM, 2021-2030 (USD THOUSAND)
TABLE 754 CANADA MEDICAL DIAGNOSTICS IN GRAPHITE MARKET, BY PHYSICAL FORM, 2021-2030 (USD THOUSAND)
TABLE 755 CANADA DEFENSE IN GRAPHITE MARKET, BY PHYSICAL FORM, 2021-2030 (USD THOUSAND)
TABLE 756 MEXICO GRAPHITE MARKET, BY PRODUCT TYPE 2021-2030 (USD THOUSAND)
TABLE 757 MEXICO GRAPHITE MARKET, BY PHYSICAL FORM, 2021-2030 (USD THOUSAND)
TABLE 758 MEXICO GRAPHITE MARKET, BY APPLICATION, 2021-2030 (USD THOUSAND)
TABLE 759 MEXICO CONSUMER ELECTRONICS IN GRAPHITE MARKET, BY APPLICATION, 2021-2030 (USD THOUSAND)
TABLE 760 MEXICO CONSUMER ELECTRONICS IN GRAPHITE MARKET, BY PHYSICAL FORM, 2021-2030 (USD THOUSAND)
TABLE 761 MEXICO TRANSPORTATION IN GRAPHITE MARKET, BY APPLICATION, 2021-2030 (USD THOUSAND)
TABLE 762 MEXICO BATTERIES IN GRAPHITE MARKET, BY APPLICATION, 2021-2030 (USD THOUSAND)
TABLE 763 MEXICO FUEL CELLS IN GRAPHITE MARKET, BY APPLICATION, 2021-2030 (USD THOUSAND)
TABLE 764 MEXICO INTERIOR IN GRAPHITE MARKET, BY APPLICATION, 2021-2030 (USD THOUSAND)
TABLE 765 MEXICO TRANSPORTATION IN GRAPHITE MARKET, BY PHYSICAL FORM, 2021-2030 (USD THOUSAND)
TABLE 766 MEXICO INDUSTRIAL IN GRAPHITE MARKET, BY APPLICATION, 2021-2030 (USD THOUSAND)
TABLE 767 MEXICO INDUSTRIAL IN GRAPHITE MARKET, BY PHYSICAL FORM, 2021-2030 (USD THOUSAND)
TABLE 768 MEXICO BUILDING & CONSTRUCTION IN GRAPHITE MARKET, BY APPLICATION, 2021-2030 (USD THOUSAND)
TABLE 769 MEXICO BUILDING & CONSTRUCTION IN GRAPHITE MARKET, BY PHYSICAL FORM, 2021-2030 (USD THOUSAND)
TABLE 770 MEXICO MEDICAL DIAGNOSTICS IN GRAPHITE MARKET, BY PHYSICAL FORM, 2021-2030 (USD THOUSAND)
TABLE 771 MEXICO DEFENSE IN GRAPHITE MARKET, BY PHYSICAL FORM, 2021-2030 (USD THOUSAND)
TABLE 772 SOUTH AMERICA GRAPHITE MARKET, BY REGION, 2021-2030 (USD THOUSAND)
TABLE 773 SOUTH AMERICA GRAPHITE MARKET, BY PRODUCT TYPE 2021-2030 (USD THOUSAND)
TABLE 774 SOUTH AMERICA GRAPHITE MARKET, BY PHYSICAL FORM, 2021-2030 (USD THOUSAND)
TABLE 775 SOUTH AMERICA GRAPHITE MARKET, BY APPLICATION, 2021-2030 (USD THOUSAND)
TABLE 776 SOUTH AMERICA CONSUMER ELECTRONICS IN GRAPHITE MARKET, BY APPLICATION, 2021-2030 (USD THOUSAND)
TABLE 777 SOUTH AMERICA CONSUMER ELECTRONICS IN GRAPHITE MARKET, BY PHYSICAL FORM, 2021-2030 (USD THOUSAND)
TABLE 778 SOUTH AMERICA TRANSPORTATION IN GRAPHITE MARKET, BY APPLICATION, 2021-2030 (USD THOUSAND)
TABLE 779 SOUTH AMERICA BATTERIES IN GRAPHITE MARKET, BY APPLICATION, 2021-2030 (USD THOUSAND)
TABLE 780 SOUTH AMERICA FUEL CELLS IN GRAPHITE MARKET, BY APPLICATION, 2021-2030 (USD THOUSAND)
TABLE 781 SOUTH AMERICA INTERIOR IN GRAPHITE MARKET, BY APPLICATION, 2021-2030 (USD THOUSAND)
TABLE 782 SOUTH AMERICA TRANSPORTATION IN GRAPHITE MARKET, BY PHYSICAL FORM, 2021-2030 (USD THOUSAND)
TABLE 783 SOUTH AMERICA INDUSTRIAL IN GRAPHITE MARKET, BY APPLICATION, 2021-2030 (USD THOUSAND)
TABLE 784 SOUTH AMERICA INDUSTRIAL IN GRAPHITE MARKET, BY PHYSICAL FORM, 2021-2030 (USD THOUSAND)
TABLE 785 SOUTH AMERICA BUILDING & CONSTRUCTION IN GRAPHITE MARKET, BY APPLICATION, 2021-2030 (USD THOUSAND)
TABLE 786 SOUTH AMERICA BUILDING & CONSTRUCTION IN GRAPHITE MARKET, BY PHYSICAL FORM, 2021-2030 (USD THOUSAND)
TABLE 787 SOUTH AMERICA MEDICAL DIAGNOSTICS IN GRAPHITE MARKET, BY PHYSICAL FORM, 2021-2030 (USD THOUSAND)
TABLE 788 SOUTH AMERICA DEFENSE IN GRAPHITE MARKET, BY PHYSICAL FORM, 2021-2030 (USD THOUSAND)
TABLE 789 BRAZIL GRAPHITE MARKET, BY PRODUCT TYPE 2021-2030 (USD THOUSAND)
TABLE 790 BRAZIL GRAPHITE MARKET, BY PHYSICAL FORM, 2021-2030 (USD THOUSAND)
TABLE 791 BRAZIL GRAPHITE MARKET, BY APPLICATION, 2021-2030 (USD THOUSAND)
TABLE 792 BRAZIL CONSUMER ELECTRONICS IN GRAPHITE MARKET, BY APPLICATION, 2021-2030 (USD THOUSAND)
TABLE 793 BRAZIL CONSUMER ELECTRONICS IN GRAPHITE MARKET, BY PHYSICAL FORM, 2021-2030 (USD THOUSAND)
TABLE 794 BRAZIL TRANSPORTATION IN GRAPHITE MARKET, BY APPLICATION, 2021-2030 (USD THOUSAND)
TABLE 795 BRAZIL BATTERIES IN GRAPHITE MARKET, BY APPLICATION, 2021-2030 (USD THOUSAND)
TABLE 796 BRAZIL FUEL CELLS IN GRAPHITE MARKET, BY APPLICATION, 2021-2030 (USD THOUSAND)
TABLE 797 BRAZIL INTERIOR IN GRAPHITE MARKET, BY APPLICATION, 2021-2030 (USD THOUSAND)
TABLE 798 BRAZIL TRANSPORTATION IN GRAPHITE MARKET, BY PHYSICAL FORM, 2021-2030 (USD THOUSAND)
TABLE 799 BRAZIL INDUSTRIAL IN GRAPHITE MARKET, BY APPLICATION, 2021-2030 (USD THOUSAND)
TABLE 800 BRAZIL INDUSTRIAL IN GRAPHITE MARKET, BY PHYSICAL FORM, 2021-2030 (USD THOUSAND)
TABLE 801 BRAZIL BUILDING & CONSTRUCTION IN GRAPHITE MARKET, BY APPLICATION, 2021-2030 (USD THOUSAND)
TABLE 802 BRAZIL BUILDING & CONSTRUCTION IN GRAPHITE MARKET, BY PHYSICAL FORM, 2021-2030 (USD THOUSAND)
TABLE 803 BRAZIL MEDICAL DIAGNOSTICS IN GRAPHITE MARKET, BY PHYSICAL FORM, 2021-2030 (USD THOUSAND)
TABLE 804 BRAZIL DEFENSE IN GRAPHITE MARKET, BY PHYSICAL FORM, 2021-2030 (USD THOUSAND)
TABLE 805 ARGENTINA GRAPHITE MARKET, BY PRODUCT TYPE 2021-2030 (USD THOUSAND)
TABLE 806 ARGENTINA GRAPHITE MARKET, BY PHYSICAL FORM, 2021-2030 (USD THOUSAND)
TABLE 807 ARGENTINA GRAPHITE MARKET, BY APPLICATION, 2021-2030 (USD THOUSAND)
TABLE 808 ARGENTINA CONSUMER ELECTRONICS IN GRAPHITE MARKET, BY APPLICATION, 2021-2030 (USD THOUSAND)
TABLE 809 ARGENTINA CONSUMER ELECTRONICS IN GRAPHITE MARKET, BY PHYSICAL FORM, 2021-2030 (USD THOUSAND)
TABLE 810 ARGENTINA TRANSPORTATION IN GRAPHITE MARKET, BY APPLICATION, 2021-2030 (USD THOUSAND)
TABLE 811 ARGENTINA BATTERIES IN GRAPHITE MARKET, BY APPLICATION, 2021-2030 (USD THOUSAND)
TABLE 812 ARGENTINA FUEL CELLS IN GRAPHITE MARKET, BY APPLICATION, 2021-2030 (USD THOUSAND)
TABLE 813 ARGENTINA INTERIOR IN GRAPHITE MARKET, BY APPLICATION, 2021-2030 (USD THOUSAND)
TABLE 814 ARGENTINA TRANSPORTATION IN GRAPHITE MARKET, BY PHYSICAL FORM, 2021-2030 (USD THOUSAND)
TABLE 815 ARGENTINA INDUSTRIAL IN GRAPHITE MARKET, BY APPLICATION, 2021-2030 (USD THOUSAND)
TABLE 816 ARGENTINA INDUSTRIAL IN GRAPHITE MARKET, BY PHYSICAL FORM, 2021-2030 (USD THOUSAND)
TABLE 817 ARGENTINA BUILDING & CONSTRUCTION IN GRAPHITE MARKET, BY APPLICATION, 2021-2030 (USD THOUSAND)
TABLE 818 ARGENTINA BUILDING & CONSTRUCTION IN GRAPHITE MARKET, BY PHYSICAL FORM, 2021-2030 (USD THOUSAND)
TABLE 819 ARGENTINA MEDICAL DIAGNOSTICS IN GRAPHITE MARKET, BY PHYSICAL FORM, 2021-2030 (USD THOUSAND)
TABLE 820 ARGENTINA DEFENSE IN GRAPHITE MARKET, BY PHYSICAL FORM, 2021-2030 (USD THOUSAND)
TABLE 821 REST OF SOUTH AMERICA GRAPHITE MARKET, BY PRODUCT TYPE 2021-2030 (USD THOUSAND)
TABLE 822 MIDDLE EAST AND AFRICA GRAPHITE MARKET, BY COUNTRY, 2021-2030 (USD THOUSAND)
TABLE 823 MIDDLE EAST AND AFRICA GRAPHITE MARKET, BY PRODUCT TYPE 2021-2030 (USD THOUSAND)
TABLE 824 MIDDLE EAST AND AFRICA GRAPHITE MARKET, BY PHYSICAL FORM, 2021-2030 (USD THOUSAND)
TABLE 825 MIDDLE EAST AND AFRICA GRAPHITE MARKET, BY APPLICATION, 2021-2030 (USD THOUSAND)
TABLE 826 MIDDLE EAST AND AFRICA CONSUMER ELECTRONICS IN GRAPHITE MARKET, BY APPLICATION, 2021-2030 (USD THOUSAND)
TABLE 827 MIDDLE EAST AND AFRICA CONSUMER ELECTRONICS IN GRAPHITE MARKET, BY PHYSICAL FORM, 2021-2030 (USD THOUSAND)
TABLE 828 MIDDLE EAST AND AFRICA TRANSPORTATION IN GRAPHITE MARKET, BY APPLICATION, 2021-2030 (USD THOUSAND)
TABLE 829 MIDDLE EAST AND AFRICA BATTERIES IN GRAPHITE MARKET, BY APPLICATION, 2021-2030 (USD THOUSAND)
TABLE 830 MIDDLE EAST AND AFRICA FUEL CELLS IN GRAPHITE MARKET, BY APPLICATION, 2021-2030 (USD THOUSAND)
TABLE 831 MIDDLE EAST AND AFRICA INTERIOR IN GRAPHITE MARKET, BY APPLICATION, 2021-2030 (USD THOUSAND)
TABLE 832 MIDDLE EAST AND AFRICA TRANSPORTATION IN GRAPHITE MARKET, BY PHYSICAL FORM, 2021-2030 (USD THOUSAND)
TABLE 833 MIDDLE EAST AND AFRICA INDUSTRIAL IN GRAPHITE MARKET, BY APPLICATION, 2021-2030 (USD THOUSAND)
TABLE 834 MIDDLE EAST AND AFRICA INDUSTRIAL IN GRAPHITE MARKET, BY PHYSICAL FORM, 2021-2030 (USD THOUSAND)
TABLE 835 MIDDLE EAST AND AFRICA BUILDING & CONSTRUCTION IN GRAPHITE MARKET, BY APPLICATION, 2021-2030 (USD THOUSAND)
TABLE 836 MIDDLE EAST AND AFRICA BUILDING & CONSTRUCTION IN GRAPHITE MARKET, BY PHYSICAL FORM, 2021-2030 (USD THOUSAND)
TABLE 837 MIDDLE EAST AND AFRICA MEDICAL DIAGNOSTICS IN GRAPHITE MARKET, BY PHYSICAL FORM, 2021-2030 (USD THOUSAND)
TABLE 838 MIDDLE EAST AND AFRICA DEFENSE IN GRAPHITE MARKET, BY PHYSICAL FORM, 2021-2030 (USD THOUSAND)
TABLE 839 U.A.E. GRAPHITE MARKET, BY PRODUCT TYPE 2021-2030 (USD THOUSAND)
TABLE 840 U.A.E. GRAPHITE MARKET, BY PHYSICAL FORM, 2021-2030 (USD THOUSAND)
TABLE 841 U.A.E. GRAPHITE MARKET, BY APPLICATION, 2021-2030 (USD THOUSAND)
TABLE 842 U.A.E. CONSUMER ELECTRONICS IN GRAPHITE MARKET, BY APPLICATION, 2021-2030 (USD THOUSAND)
TABLE 843 U.A.E. CONSUMER ELECTRONICS IN GRAPHITE MARKET, BY PHYSICAL FORM, 2021-2030 (USD THOUSAND)
TABLE 844 U.A.E. TRANSPORTATION IN GRAPHITE MARKET, BY APPLICATION, 2021-2030 (USD THOUSAND)
TABLE 845 U.A.E. BATTERIES IN GRAPHITE MARKET, BY APPLICATION, 2021-2030 (USD THOUSAND)
TABLE 846 U.A.E. FUEL CELLS IN GRAPHITE MARKET, BY APPLICATION, 2021-2030 (USD THOUSAND)
TABLE 847 U.A.E. INTERIOR IN GRAPHITE MARKET, BY APPLICATION, 2021-2030 (USD THOUSAND)
TABLE 848 U.A.E. TRANSPORTATION IN GRAPHITE MARKET, BY PHYSICAL FORM, 2021-2030 (USD THOUSAND)
TABLE 849 U.A.E. INDUSTRIAL IN GRAPHITE MARKET, BY APPLICATION, 2021-2030 (USD THOUSAND)
TABLE 850 U.A.E. INDUSTRIAL IN GRAPHITE MARKET, BY PHYSICAL FORM, 2021-2030 (USD THOUSAND)
TABLE 851 U.A.E. BUILDING & CONSTRUCTION IN GRAPHITE MARKET, BY APPLICATION, 2021-2030 (USD THOUSAND)
TABLE 852 U.A.E. BUILDING & CONSTRUCTION IN GRAPHITE MARKET, BY PHYSICAL FORM, 2021-2030 (USD THOUSAND)
TABLE 853 U.A.E. MEDICAL DIAGNOSTICS IN GRAPHITE MARKET, BY PHYSICAL FORM, 2021-2030 (USD THOUSAND)
TABLE 854 U.A.E. DEFENSE IN GRAPHITE MARKET, BY PHYSICAL FORM, 2021-2030 (USD THOUSAND)
TABLE 855 SOUTH AFRICA GRAPHITE MARKET, BY PRODUCT TYPE 2021-2030 (USD THOUSAND)
TABLE 856 SOUTH AFRICA GRAPHITE MARKET, BY PHYSICAL FORM, 2021-2030 (USD THOUSAND)
TABLE 857 SOUTH AFRICA GRAPHITE MARKET, BY APPLICATION, 2021-2030 (USD THOUSAND)
TABLE 858 SOUTH AFRICA CONSUMER ELECTRONICS IN GRAPHITE MARKET, BY APPLICATION, 2021-2030 (USD THOUSAND)
TABLE 859 SOUTH AFRICA CONSUMER ELECTRONICS IN GRAPHITE MARKET, BY PHYSICAL FORM, 2021-2030 (USD THOUSAND)
TABLE 860 SOUTH AFRICA TRANSPORTATION IN GRAPHITE MARKET, BY APPLICATION, 2021-2030 (USD THOUSAND)
TABLE 861 SOUTH AFRICA BATTERIES IN GRAPHITE MARKET, BY APPLICATION, 2021-2030 (USD THOUSAND)
TABLE 862 SOUTH AFRICA FUEL CELLS IN GRAPHITE MARKET, BY APPLICATION, 2021-2030 (USD THOUSAND)
TABLE 863 SOUTH AFRICA INTERIOR IN GRAPHITE MARKET, BY APPLICATION, 2021-2030 (USD THOUSAND)
TABLE 864 SOUTH AFRICA TRANSPORTATION IN GRAPHITE MARKET, BY PHYSICAL FORM, 2021-2030 (USD THOUSAND)
TABLE 865 SOUTH AFRICA INDUSTRIAL IN GRAPHITE MARKET, BY APPLICATION, 2021-2030 (USD THOUSAND)
TABLE 866 SOUTH AFRICA INDUSTRIAL IN GRAPHITE MARKET, BY PHYSICAL FORM, 2021-2030 (USD THOUSAND)
TABLE 867 SOUTH AFRICA BUILDING & CONSTRUCTION IN GRAPHITE MARKET, BY APPLICATION, 2021-2030 (USD THOUSAND)
TABLE 868 SOUTH AFRICA BUILDING & CONSTRUCTION IN GRAPHITE MARKET, BY PHYSICAL FORM, 2021-2030 (USD THOUSAND)
TABLE 869 SOUTH AFRICA MEDICAL DIAGNOSTICS IN GRAPHITE MARKET, BY PHYSICAL FORM, 2021-2030 (USD THOUSAND)
TABLE 870 SOUTH AFRICA DEFENSE IN GRAPHITE MARKET, BY PHYSICAL FORM, 2021-2030 (USD THOUSAND)
TABLE 871 SAUDI ARABIA GRAPHITE MARKET, BY PRODUCT TYPE 2021-2030 (USD THOUSAND)
TABLE 872 SAUDI ARABIA GRAPHITE MARKET, BY PHYSICAL FORM, 2021-2030 (USD THOUSAND)
TABLE 873 SAUDI ARABIA GRAPHITE MARKET, BY APPLICATION, 2021-2030 (USD THOUSAND)
TABLE 874 SAUDI ARABIA CONSUMER ELECTRONICS IN GRAPHITE MARKET, BY APPLICATION, 2021-2030 (USD THOUSAND)
TABLE 875 SAUDI ARABIA CONSUMER ELECTRONICS IN GRAPHITE MARKET, BY PHYSICAL FORM, 2021-2030 (USD THOUSAND)
TABLE 876 SAUDI ARABIA TRANSPORTATION IN GRAPHITE MARKET, BY APPLICATION, 2021-2030 (USD THOUSAND)
TABLE 877 SAUDI ARABIA BATTERIES IN GRAPHITE MARKET, BY APPLICATION, 2021-2030 (USD THOUSAND)
TABLE 878 SAUDI ARABIA FUEL CELLS IN GRAPHITE MARKET, BY APPLICATION, 2021-2030 (USD THOUSAND)
TABLE 879 SAUDI ARABIA INTERIOR IN GRAPHITE MARKET, BY APPLICATION, 2021-2030 (USD THOUSAND)
TABLE 880 SAUDI ARABIA TRANSPORTATION IN GRAPHITE MARKET, BY PHYSICAL FORM, 2021-2030 (USD THOUSAND)
TABLE 881 SAUDI ARABIA INDUSTRIAL IN GRAPHITE MARKET, BY APPLICATION, 2021-2030 (USD THOUSAND)
TABLE 882 SAUDI ARABIA INDUSTRIAL IN GRAPHITE MARKET, BY PHYSICAL FORM, 2021-2030 (USD THOUSAND)
TABLE 883 SAUDI ARABIA BUILDING & CONSTRUCTION IN GRAPHITE MARKET, BY APPLICATION, 2021-2030 (USD THOUSAND)
TABLE 884 SAUDI ARABIA BUILDING & CONSTRUCTION IN GRAPHITE MARKET, BY PHYSICAL FORM, 2021-2030 (USD THOUSAND)
TABLE 885 SAUDI ARABIA MEDICAL DIAGNOSTICS IN GRAPHITE MARKET, BY PHYSICAL FORM, 2021-2030 (USD THOUSAND)
TABLE 886 SAUDI ARABIA DEFENSE IN GRAPHITE MARKET, BY PHYSICAL FORM, 2021-2030 (USD THOUSAND)
TABLE 887 ISRAEL GRAPHITE MARKET, BY PRODUCT TYPE 2021-2030 (USD THOUSAND)
TABLE 888 ISRAEL GRAPHITE MARKET, BY PHYSICAL FORM, 2021-2030 (USD THOUSAND)
TABLE 889 ISRAEL GRAPHITE MARKET, BY APPLICATION, 2021-2030 (USD THOUSAND)
TABLE 890 ISRAEL CONSUMER ELECTRONICS IN GRAPHITE MARKET, BY APPLICATION, 2021-2030 (USD THOUSAND)
TABLE 891 ISRAEL CONSUMER ELECTRONICS IN GRAPHITE MARKET, BY PHYSICAL FORM, 2021-2030 (USD THOUSAND)
TABLE 892 ISRAEL TRANSPORTATION IN GRAPHITE MARKET, BY APPLICATION, 2021-2030 (USD THOUSAND)
TABLE 893 ISRAEL BATTERIES IN GRAPHITE MARKET, BY APPLICATION, 2021-2030 (USD THOUSAND)
TABLE 894 ISRAEL FUEL CELLS IN GRAPHITE MARKET, BY APPLICATION, 2021-2030 (USD THOUSAND)
TABLE 895 ISRAEL INTERIOR IN GRAPHITE MARKET, BY APPLICATION, 2021-2030 (USD THOUSAND)
TABLE 896 ISRAEL TRANSPORTATION IN GRAPHITE MARKET, BY PHYSICAL FORM, 2021-2030 (USD THOUSAND)
TABLE 897 ISRAEL INDUSTRIAL IN GRAPHITE MARKET, BY APPLICATION, 2021-2030 (USD THOUSAND)
TABLE 898 ISRAEL INDUSTRIAL IN GRAPHITE MARKET, BY PHYSICAL FORM, 2021-2030 (USD THOUSAND)
TABLE 899 ISRAEL BUILDING & CONSTRUCTION IN GRAPHITE MARKET, BY APPLICATION, 2021-2030 (USD THOUSAND)
TABLE 900 ISRAEL BUILDING & CONSTRUCTION IN GRAPHITE MARKET, BY PHYSICAL FORM, 2021-2030 (USD THOUSAND)
TABLE 901 ISRAEL MEDICAL DIAGNOSTICS IN GRAPHITE MARKET, BY PHYSICAL FORM, 2021-2030 (USD THOUSAND)
TABLE 902 ISRAEL DEFENSE IN GRAPHITE MARKET, BY PHYSICAL FORM, 2021-2030 (USD THOUSAND)
TABLE 903 EGYPT GRAPHITE MARKET, BY PRODUCT TYPE 2021-2030 (USD THOUSAND)
TABLE 904 EGYPT GRAPHITE MARKET, BY PHYSICAL FORM, 2021-2030 (USD THOUSAND)
TABLE 905 EGYPT GRAPHITE MARKET, BY APPLICATION, 2021-2030 (USD THOUSAND)
TABLE 906 EGYPT CONSUMER ELECTRONICS IN GRAPHITE MARKET, BY APPLICATION, 2021-2030 (USD THOUSAND)
TABLE 907 EGYPT CONSUMER ELECTRONICS IN GRAPHITE MARKET, BY PHYSICAL FORM, 2021-2030 (USD THOUSAND)
TABLE 908 EGYPT TRANSPORTATION IN GRAPHITE MARKET, BY APPLICATION, 2021-2030 (USD THOUSAND)
TABLE 909 EGYPT BATTERIES IN GRAPHITE MARKET, BY APPLICATION, 2021-2030 (USD THOUSAND)
TABLE 910 EGYPT FUEL CELLS IN GRAPHITE MARKET, BY APPLICATION, 2021-2030 (USD THOUSAND)
TABLE 911 EGYPT INTERIOR IN GRAPHITE MARKET, BY APPLICATION, 2021-2030 (USD THOUSAND)
TABLE 912 EGYPT TRANSPORTATION IN GRAPHITE MARKET, BY PHYSICAL FORM, 2021-2030 (USD THOUSAND)
TABLE 913 EGYPT INDUSTRIAL IN GRAPHITE MARKET, BY APPLICATION, 2021-2030 (USD THOUSAND)
TABLE 914 EGYPT INDUSTRIAL IN GRAPHITE MARKET, BY PHYSICAL FORM, 2021-2030 (USD THOUSAND)
TABLE 915 EGYPT BUILDING & CONSTRUCTION IN GRAPHITE MARKET, BY APPLICATION, 2021-2030 (USD THOUSAND)
TABLE 916 EGYPT BUILDING & CONSTRUCTION IN GRAPHITE MARKET, BY PHYSICAL FORM, 2021-2030 (USD THOUSAND)
TABLE 917 EGYPT MEDICAL DIAGNOSTICS IN GRAPHITE MARKET, BY PHYSICAL FORM, 2021-2030 (USD THOUSAND)
TABLE 918 EGYPT DEFENSE IN GRAPHITE MARKET, BY PHYSICAL FORM, 2021-2030 (USD THOUSAND)
TABLE 919 REST OF MIDDLE EAST AND AFRICA GRAPHITE MARKET, BY PRODUCT TYPE 2021-2030 (USD THOUSAND)
Lista de figuras
FIGURE 1 GLOBAL GRAPHITE MARKET
FIGURE 2 GLOBAL GRAPHITE MARKET: DATA TRIANGULATION
FIGURE 3 GLOBAL GRAPHITE MARKET: DROC ANALYSIS
FIGURE 4 GLOBAL GRAPHITE MARKET: GLOBAL VS REGIONAL MARKET ANALYSIS
FIGURE 5 GLOBAL GRAPHITE MARKET: COMPANY RESEARCH ANALYSIS
FIGURE 6 GLOBAL GRAPHITE MARKET: MULTIVARIATE MODELLING
FIGURE 7 GLOBAL GRAPHITE MARKET: INTERVIEW DEMOGRAPHICS
FIGURE 8 GLOBAL GRAPHITE MARKET: DBMR MARKET POSITION GRID
FIGURE 9 GLOBAL GRAPHITE MARKET: MARKET APPLICATION COVERAGE GRID
FIGURE 10 GLOBAL GRAPHITE MARKET: VENDOR SHARE ANALYSIS
FIGURE 11 GLOBAL GRAPHITE MARKET: SEGMENTATION
FIGURE 12 GRAPHITE’S VERSATILITY AND EXCEPTIONAL ELECTRICAL CONDUCTIVITY MAKE IT A FUNDAMENTAL MATERIAL WHICH IS EXPECTED TO DRIVE THE MARKET GROWTH IN THE FORECAST PERIOD OF 2023 TO 2030
FIGURE 13 THE SYNTHETIC SEGMENT IS EXPECTED TO ACCOUNT FOR THE LARGEST SHARE OF THE GLOBAL GRAPHITE MARKET IN 2023 AND 2030
FIGURE 14 DRIVERS, RESTRAINTS, OPPORTUNITIES, AND CHALLENGES OF THE GLOBAL GRAPHITE MARKET
FIGURE 15 GLOBAL GRAPHITE MARKET: BY PRODUCT TYPE, 2022
FIGURE 16 GLOBAL GRAPHITE MARKET: BY PHYSICAL FORM, 2022
FIGURE 17 GLOBAL GRAPHITE MARKET: BY APPLICATION, 2022
FIGURE 18 GLOBAL GRAPHITE MARKET: SNAPSHOT (2022)
FIGURE 19 ASIA-PACIFIC HANGERS MARKET: SNAPSHOT (2022)
FIGURE 20 EUROPE HANGERS MARKET: SNAPSHOT (2022)
FIGURE 21 NORTH AMERICA HANGERS MARKET: SNAPSHOT (2022)
FIGURE 22 SOUTH AMERICA HANGERS MARKET: SNAPSHOT (2022)
FIGURE 23 MIDDLE EAST AND AFRICA HANGERS MARKET: SNAPSHOT (2022)
FIGURE 24 GLOBAL GRAPHITE MARKET: COMPANY SHARE 2022 (%)
FIGURE 25 EUROPE GRAPHITE MARKET: COMPANY SHARE 2022 (%)
FIGURE 26 ASIA-PACIFC GRAPHITE MARKET: COMPANY SHARE 2022 (%)
FIGURE 27 NORTH AMERICA GRAPHITE MARKET: COMPANY SHARE 2022 (%)
Metodología de investigación
La recopilación de datos y el análisis del año base se realizan utilizando módulos de recopilación de datos con muestras de gran tamaño. La etapa incluye la obtención de información de mercado o datos relacionados a través de varias fuentes y estrategias. Incluye el examen y la planificación de todos los datos adquiridos del pasado con antelación. Asimismo, abarca el examen de las inconsistencias de información observadas en diferentes fuentes de información. Los datos de mercado se analizan y estiman utilizando modelos estadísticos y coherentes de mercado. Además, el análisis de la participación de mercado y el análisis de tendencias clave son los principales factores de éxito en el informe de mercado. Para obtener más información, solicite una llamada de un analista o envíe su consulta.
La metodología de investigación clave utilizada por el equipo de investigación de DBMR es la triangulación de datos, que implica la extracción de datos, el análisis del impacto de las variables de datos en el mercado y la validación primaria (experto en la industria). Los modelos de datos incluyen cuadrícula de posicionamiento de proveedores, análisis de línea de tiempo de mercado, descripción general y guía del mercado, cuadrícula de posicionamiento de la empresa, análisis de patentes, análisis de precios, análisis de participación de mercado de la empresa, estándares de medición, análisis global versus regional y de participación de proveedores. Para obtener más información sobre la metodología de investigación, envíe una consulta para hablar con nuestros expertos de la industria.
Personalización disponible
Data Bridge Market Research es líder en investigación formativa avanzada. Nos enorgullecemos de brindar servicios a nuestros clientes existentes y nuevos con datos y análisis que coinciden y se adaptan a sus objetivos. El informe se puede personalizar para incluir análisis de tendencias de precios de marcas objetivo, comprensión del mercado de países adicionales (solicite la lista de países), datos de resultados de ensayos clínicos, revisión de literatura, análisis de mercado renovado y base de productos. El análisis de mercado de competidores objetivo se puede analizar desde análisis basados en tecnología hasta estrategias de cartera de mercado. Podemos agregar tantos competidores sobre los que necesite datos en el formato y estilo de datos que esté buscando. Nuestro equipo de analistas también puede proporcionarle datos en archivos de Excel sin procesar, tablas dinámicas (libro de datos) o puede ayudarlo a crear presentaciones a partir de los conjuntos de datos disponibles en el informe.

