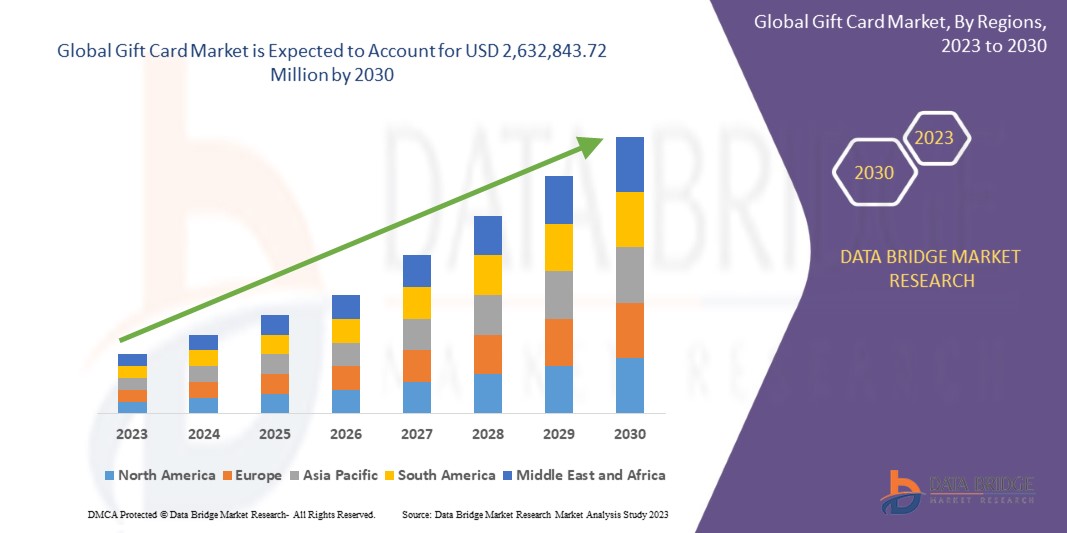
Image

Mercado mundial de tarjetas de regalo: tendencias de la industria y pronóstico hasta 2030

bienes de consumo

Image

Mercado mundial de tarjetas de regalo: tendencias de la industria y pronóstico hasta 2030

  • bienes de consumo
  • Informe publicado
  • junio de 2023
  • Global
  • 350 páginas
  • Número de mesas: 601
  • Número de figuras: 50

Mercado global de tarjetas de regalo, por producto (tarjetas de regalo electrónicas y tarjetas físicas), atributo funcional (bucle cerrado, bucle abierto universal aceptado y regalos electrónicos), industria vertical (instituciones minoristas y corporativas), comerciante (restaurantes, tiendas de descuento, cafeterías, tiendas departamentales, tiendas de comestibles/supermercados de alimentos, entretenimiento y otros): tendencias de la industria y pronóstico para 2030.

Gift Card Market


Análisis y tamaño del mercado de tarjetas de regalo

El mercado mundial de tarjetas de regalo está siendo impulsado por el uso de tarjetas de regalo como táctica comercial, que se espera que impulse el crecimiento del mercado. Además, se espera que la amplia tendencia social de dar obsequios en línea impulse el crecimiento del mercado. Sin embargo, se espera que las prácticas explotadoras de tarjetas de regalo, como las tarifas de canje y latencia, limiten el crecimiento del mercado.

Gift Card MarketGift Card Market

Data Bridge Market Research analiza que se espera que el mercado de tarjetas de regalo alcance el valor de 2.632.843,72 millones de dólares para 2030, con una tasa compuesta anual del 14,2% durante el período previsto.

Métrica de informe

Detalles

Período de pronóstico

2023 a 2030

Año base

2022

Año histórico

2021 (Personalizable para 2015 - 2020)

Unidades Cuantitativas

Ingresos en millones de dólares

Segmentos cubiertos

Producto (tarjetas de regalo electrónicas y tarjetas físicas), atributo funcional (circuito cerrado, circuito abierto universalmente aceptado y regalos electrónicos), industria vertical (instituciones minoristas y corporativas), comerciante (restaurantes, tiendas de descuento, cafeterías, tiendas departamentales, Tienda de comestibles/Supermercados de alimentos, entretenimiento y otros)

Países cubiertos

EE.UU., Canadá, México, Alemania, Rusia, Francia, Reino Unido, Turquía, Italia, España, Polonia, Países Bajos, Bélgica, Suiza, Suecia y resto de Europa, China, India, Sudeste Asiático, Japón, Australia, Nueva Zelanda , Corea del Sur, Resto de Asia-Pacífico, Indonesia, Filipinas, Tailandia, Vietnam, Malasia, Singapur, Camboya, Myanmar y Resto del Sudeste Asiático, Arabia Saudita, Irán, Egipto, Sudáfrica, Emiratos Árabes Unidos, Irak, Israel, Qatar, Kuwait, Jordania y Resto de Medio Oriente y África, Brasil, Argentina y Resto de Sudamérica

Actores del mercado cubiertos

Walmart Inc., Under Armour, Inc., Givex Corporation, American Express, Target Brands, Inc., Best Buy, Starbucks Coffee Company, PayPal Holdings, Inc., Apple Inc., Sephora USA, Inc., Gyft, Inc., Walgreen Co., TransGate Solutions, AMILON SRL, Jigsaw Business Solutions, Diggecard, Pine Labs Private Limited, Alltimeprint.com, Plastek Card Solutions, Inc., Card USA, Inc., Duracard, Blackhawk Network, Tango Card. Inc, Stockpile, Inc. y Huuray A/S

Definición de mercado

Una tarjeta regalo es una tarjeta de débito prepago artificial que se carga con una cantidad específica. Se utiliza para diversos fines, como regalar a alguien y comprar cosas. La mayoría de los consumidores, incluidos los millennials y las generaciones mayores, tienen una demanda creciente de tarjetas de regalo debido a su facilidad de uso y la creciente adopción de teléfono inteligente tecnologías de pago. Se espera que las crecientes tendencias sociales de entrega de regalos en línea y la creciente demanda de los millennials impulsen el crecimiento del mercado.

Dinámica del mercado mundial de tarjetas de regalo

Esta sección trata de comprender los impulsores, las ventajas, las oportunidades, las restricciones y los desafíos del mercado. Todo esto se analiza en detalle a continuación:

Conductores

  • El uso de tarjetas de regalo como táctica comercial es cada vez más popular

Varias empresas se están centrando cada vez más en relaciones sostenibles con los consumidores para que puedan cumplir sus objetivos. Hay algunos beneficios de las tarjetas de regalo que se pueden utilizar en estrategias comerciales, como que son rentables y los consumidores suelen gastar en tarjetas de regalo en lugar de obsequios físicos. Esto se debe a que la mayoría de las personas perciben el monto de las tarjetas de regalo como dinero gratis. Por lo tanto, la implementación de ofertas asociadas con tarjetas de regalo puede aumentar los ingresos de una empresa.

Las tarjetas de regalo también pueden aumentar el tráfico en una tienda y organización en particular. Como involucra a dos personas en el proceso, una es el remitente, que entrega la tarjeta de regalo, y la segunda es el destinatario, que recibe la tarjeta de regalo. Muchas veces sucede que la tarjeta regalo caduca, no se utiliza y el importe total va a parar a la organización. Por lo tanto, utilizar tarjetas de regalo como estrategia comercial es una decisión esencial y rentable que se espera que impulse el crecimiento del mercado.

  • La extendida tendencia social de dar obsequios online

Junto con el crecimiento económico de los consumidores y la mayor conciencia de la población sobre las tendencias sociales, la situación del mercado de las tarjetas regalo ha ido cambiando. Los regalos en línea han ganado popularidad debido a su conveniencia y accesibilidad. Con solo unos pocos clics, los clientes pueden comprar y enviar obsequios digitales a destinatarios en cualquier parte del mundo. Esto hace que las tarjetas de regalo sean una opción atractiva para realizar obsequios de última hora. La creciente tendencia de las compras en línea y las transacciones digitales continúa aumentando la preferencia por las tarjetas de regalo, lo que se espera que impulse el crecimiento del mercado.

Gift Card Market

Oportunidades

  • La creciente tasa de penetración de Internet y teléfonos inteligentes en todo el mundo

La creciente popularidad de comercio electrónico permite al usuario utilizar tarjetas de regalo fácilmente y explorar más productos con compras sencillas. Uno de los campos tecnológicos más innovadores en el mercado de las tarjetas regalo es la introducción de la tecnología de teléfonos inteligentes. Los beneficios de las tarjetas de regalo electrónicas que utilizan la tecnología de teléfonos inteligentes en los métodos de pago permiten una amplia gama de consumidores que pueden brindar crecimiento al mercado con enormes oportunidades. Los continuos lanzamientos y anuncios en el segmento de tarjetas de regalo de billetera móvil y tarjetas de regalo electrónicas y su tendencia creciente pueden llevar al mercado de tarjetas de regalo a enfrentar un crecimiento extremo en el futuro cercano. Las tarjetas de regalo electrónicas se consideran una buena forma de pago alternativa si algún consumidor no tiene efectivo para pagar un producto, ya que pueden transferirse digitalmente si el destinatario vive a mayor distancia del remitente de las tarjetas de regalo. Por lo tanto, estos beneficios están creando una preferencia por las tarjetas de regalo electrónicas y las empresas están lanzando nuevos productos, que se espera que brinden una oportunidad de crecimiento en el mercado.

  • Alianzas Estratégicas para Incrementar la Penetración Comercial de la Empresa

Las alianzas estratégicas son un elemento clave en las estrategias comerciales para lograr una ventaja competitiva y evitar que los competidores avancen en un mercado. Una alianza estratégica exitosa es fundamental para el éxito de un objetivo comercial central y también ayuda a mitigar un riesgo significativo para el negocio. Las alianzas ayudan a brindar acceso al mercado con una solución que no habría sido posible para ninguna empresa por sí sola. Con la alianza adecuada, los socios pueden superar a la competencia con nuevas soluciones. Esto ayuda a ampliar la producción y crear soluciones innovadoras para sus clientes, ingresar a nuevos mercados y aunar experiencia y recursos valiosos, lo que se espera que brinde una oportunidad de crecimiento en el mercado.

Restricciones/Desafíos

  • Prácticas explotadoras de tarjetas de regalo, como tarifas de canje y latencia

Una tarjeta de regalo es un método de pago alternativo que los clientes pueden utilizar para realizar pagos en varios lugares, como tiendas minoristas, restaurantes, gasolineras y otros. Se puede agregar dinero a la tarjeta y gastarlo en los locales aceptados. Las tarjetas regalo tienen muchas ventajas para los clientes. Son más convenientes y un mejor sustituto del dinero en efectivo, pero aún tienen algunas desventajas. Debido a estos factores negativos, el crecimiento del mercado puede verse obstaculizado.

Las prácticas de explotación, como las tarifas de latencia y las tarifas de reembolso, pueden afectar negativamente al mercado. Algunos emisores de tarjetas de regalo imponen tarifas de canje cuando se utiliza la tarjeta. Estos son los cargos que se deducen del saldo de la tarjeta. Esto reduce el valor de las tarjetas de regalo y disuade a los destinatarios de utilizarlas por completo. Para los consumidores, crea una experiencia negativa y reduce su confianza en el sistema de tarjetas de regalo. Existe la posibilidad de que los clientes compren o acepten menos tarjetas de regalo si perciben que su tarjeta de regalo está sujeta a algunos cargos ocultos. Se espera que esto limite el crecimiento del mercado.

  • Preocupaciones de seguridad como piratería informática y fraude asociados con las tarjetas de regalo

La mayoría de las tarjetas de regalo tienen una vida útil de hasta unos pocos años y están destinadas a compras de importes cortos a medianos. A pesar de la amplia preferencia por las tarjetas de regalo, también existen algunos problemas asociados con la seguridad. Con la creciente cantidad de ingresos generados por el uso de tarjetas de valor almacenado o tarjetas de regalo, los problemas de seguridad asociados con las tarjetas de regalo también están aumentando, como problemas de piratería informática y falta de seguridad para el dinero.

Los piratas informáticos pueden acceder a la tarjeta de regalo yendo directamente al sitio web donde el consumidor accede a sus tarjetas de regalo. Esto se puede hacer mediante el uso de un ataque de botnet que proporciona a los piratas informáticos millones de combinaciones de números de cuentas de tarjetas de regalo y PIN o contraseñas robadas mediante las cuales el pirata informático puede iniciar sesión en la tarjeta de regalo en línea y cargar el dinero en su cuenta. Se espera que esto limite el crecimiento del mercado.

  • La amenaza de sustitutos como mercancías y artículos electrónicos como obsequio

La tarjeta de regalo es bien conocida por consumir una gran cantidad de empresas de consumidores que dan tarjetas de regalo a sus empleados como bonificación o agradecimiento. Existe un buen historial de tarjetas de regalo no utilizadas, ya que las personas generalmente tienden a usar las tarjetas de regalo que reciben, pero la tarjeta caduca, la pierden o no las canjean. Hay pocas alternativas de moda disponibles en el mercado de tarjetas de regalo que puedan suponer un desafío para el crecimiento del mercado.

Por ejemplo,

  • Según una encuesta realizada por Bankrate, LLC., un gigante proveedor de servicios financieros, el 51% de los adultos estadounidenses desperdician tarjetas de regalo por valor de 15,3 mil millones de dólares en todo el país.

Además, las alternativas basadas en productos de marca personalizados, como chaquetas, sudaderas con capucha o sudaderas con capucha, se están convirtiendo en una tendencia creciente para regalar. La mayoría de los destinatarios aprecian este tipo de producto en lugar de las tarjetas de regalo porque, la mayoría de las veces, las tarjetas de regalo no se utilizan ni se canjean. Otras opciones, como botellas de agua inteligentes con impresiones de logotipos personalizados y bancos de energía, se enfrentan a una tendencia creciente en términos de donaciones en masa (como empleados de una empresa específica o estudiantes de un instituto en particular). Además, las suscripciones a revistas online y las suscripciones OTT también entran en la competencia por alternativas a las tarjetas regalo.

Desarrollos recientes

  • El 29 de octubre de 2020, PRNewswire publicó un artículo titulado “El aumento de los obsequios digitales allana el camino para nuevas opciones de tarjetas de regalo electrónicas más personales disponibles en Giftcards.com”. Giftcards.com ha ampliado sus ofertas de tarjetas de regalo digitales. Proporcionan una variedad de tarjetas de regalo únicas a sus clientes que desean hacer obsequios más personales. Cada tarjeta está diseñada para una ocasión, destinatario o causa concreta. Están ofreciendo varios obsequios electrónicos nuevos sin ningún cargo.
  • El 9 de abril de 2021, Thought Works publicó un blog. Según esto, para los minoristas, las tarjetas de regalo se han convertido en puntos de entrada potenciales para guiar a los clientes al circuito cerrado de pago, membresía y sistema de pedidos. Pueden cultivar a los usuarios para generar nuevos hábitos de gasto. Por ejemplo, la tarjeta de regalo de Starbucks no solo está diseñada para regalar, sino que también brinda a los clientes un método de pago sencillo y también aumenta la frecuencia de las visitas a la tienda. Esto ha aumentado su venta automáticamente.

Alcance del mercado global de tarjetas de regalo

El mercado mundial de tarjetas de regalo se clasifica en cuatro segmentos notables, por producto, atributo funcional, industria vertical y comerciante. El crecimiento entre estos segmentos lo ayudará a analizar los principales segmentos de crecimiento en las industrias y brindará a los usuarios una valiosa descripción general del mercado e información sobre el mercado para ayudarlos a tomar decisiones estratégicas para identificar las aplicaciones principales del mercado.

Producto

  • Tarjetas físicas
  • Tarjetas de regalo electrónicas

Según el producto, el mercado se segmenta en tarjetas de regalo electrónicas y tarjetas físicas.

Atributo funcional

  • Bucle cerrado
  • Bucle abierto universalmente aceptado
  • E-Regalar

Sobre la base de atributos funcionales, el mercado se segmenta en circuito cerrado, circuito abierto universalmente aceptado y regalos electrónicos.

Verticales de la industria

  • Minorista
  • Instituciones corporativas

Sobre la base de la vertical de la industria, el mercado se segmenta en instituciones corporativas y minoristas.

Comerciante

  • Restaurantes
  • Tiendas de descuento
  • Cafeterías
  • Tienda departamental
  • Tienda de comestibles/Supermercados de alimentos
  • Entretenimiento
  • Otros

Según el comerciante, el mercado se segmenta en restaurantes, tiendas de descuento, cafeterías, grandes almacenes, tiendas de abarrotes/supermercados de alimentos, entretenimiento y otros.

Gift Card Market

Análisis/perspectivas regionales del mercado global de tarjetas de regalo

Se analiza el mercado mundial de tarjetas de regalo y se proporcionan conocimientos y tendencias sobre el tamaño del mercado por país, producto, atributo funcional, industria vertical y comerciante, como se mencionó anteriormente.

Los países cubiertos en el informe de mercado son EE. UU., Canadá, México, Alemania, Rusia, Francia, Reino Unido, Turquía, Italia, España, Polonia, Países Bajos, Bélgica, Suiza, Suecia y el resto de Europa, China, India, Sudeste. Asia, Japón, Australia, Nueva Zelanda, Corea del Sur, Resto de Asia-Pacífico, Indonesia, Filipinas, Tailandia, Vietnam, Malasia, Singapur, Camboya, Myanmar y resto del Sudeste Asiático, Arabia Saudita, Irán, Egipto, Sur África, Emiratos Árabes Unidos, Irak, Israel, Qatar, Kuwait, Jordania y resto de Medio Oriente y África, Brasil, Argentina y resto de América del Sur.

Se espera que América del Norte domine el mercado mundial de tarjetas de regalo porque las tarjetas de regalo están ganando rápidamente popularidad entre los consumidores; Estados Unidos es el país dominante en la región. Se estima que Asia-Pacífico es la región de más rápido crecimiento en el mercado mundial de tarjetas de regalo debido a la creciente conciencia y las tendencias crecientes entre las tarjetas de regalo; China domina la región de Asia-Pacífico. Alemania es el país de mayor crecimiento en la región de Europa, ya que las tarjetas de regalo electrónicas se están volviendo cada vez más populares entre los millennials.

La sección de países del informe también proporciona factores individuales que impactan el mercado y cambios en la regulación del mercado que impactan las tendencias actuales y futuras del mercado. Puntos de datos como el análisis de la cadena de valor ascendente y descendente, las tendencias técnicas, el análisis de las cinco fuerzas de Porter y los estudios de casos son algunos de los indicadores utilizados para pronosticar el escenario del mercado para países individuales. Además, se consideran la presencia y disponibilidad de marcas globales y los desafíos que enfrentan debido a la competencia grande o escasa de marcas locales y nacionales, el impacto de los aranceles internos y las rutas comerciales, al tiempo que se proporciona un análisis de pronóstico de los datos del país.

Gift Card Market

Panorama competitivo y análisis de cuota de mercado global de Tarjetas de regalo

El panorama competitivo del mercado mundial de tarjetas de regalo proporciona detalles por competidor. Los detalles incluidos son descripción general de la empresa, finanzas de la empresa, ingresos generados, potencial de mercado, inversión en investigación y desarrollo, nuevas iniciativas de mercado, presencia global, sitios e instalaciones de producción, capacidades de producción, fortalezas y debilidades de la empresa, lanzamiento de productos, ancho y amplitud del producto, y dominio de la aplicación. Los datos anteriores sólo están relacionados con el enfoque de las empresas en el mercado.

Algunos de los principales actores que operan en el mercado son Walmart Inc., Under Armour, Inc., Givex Corporation, American Express, Target Brands, Inc., Best Buy, Starbucks Coffee Company, PayPal Holdings, Inc., Apple Inc., Sephora. USA, Inc., Gyft, Inc., Walgreen Co., TransGate Solutions, AMILON SRL, Jigsaw Business Solutions, Diggecard, Pine Labs Private Limited, Alltimeprint.com, Plastek Card Solutions, Inc., Card USA, Inc., Duracard, Red Blackhawk, Tarjeta Tango. Inc, Stockpile, Inc. y Huuray A/S, entre otros.


SKU-

TABLA 1 MARCO REGULATORIO

TABLA 2 MERCADO MUNDIAL DE TARJETAS DE REGALO, POR REGIÓN, 2021-2030 (MILLONES DE USD)

TABLA 3 MERCADO MUNDIAL DE TARJETAS DE REGALO, POR PRODUCTO, 2021-2030 (MILLONES DE USD)

TABLA 4 MERCADO MUNDIAL DE TARJETAS DE REGALO, POR ATRIBUTO FUNCIONAL, 2021-2030 (MILLONES DE USD)

TABLA 5 BUCLE CERRADO GLOBAL EN EL MERCADO DE TARJETAS DE REGALO, POR TIPO, 2021-2030 (MILLONES DE USD)

TABLA 6 MERCADO MUNDIAL DE TARJETAS DE REGALO, POR VERTICAL DE LA INDUSTRIA, 2021-2030 (MILLONES DE USD)

TABLA 7 MERCADO MUNDIAL DE TARJETAS DE REGALO, POR COMERCIANTE, 2021-2030 (MILLONES DE USD)

TABLA 8 RESTAURANTES MUNDIALES EN EL MERCADO DE TARJETAS DE REGALO, POR PRODUCTO, 2021-2030 (MILLONES DE USD)

TABLA 9 TIENDAS DE DESCUENTO MUNDIALES EN EL MERCADO DE TARJETAS DE REGALO, POR PRODUCTO, 2021-2030 (MILLONES DE USD)

TABLA 10 CAFETERÍAS MUNDIALES EN EL MERCADO DE TARJETAS DE REGALO, POR PRODUCTO, 2021-2030 (MILLONES DE USD)

TABLA 11 TIENDAS DEPARTAMENTALES MUNDIALES EN EL MERCADO DE TARJETAS DE REGALO, POR PRODUCTO, 2021-2030 (MILLONES DE USD)

TABLA 12 TIENDAS DE COMESTIBLES/SUPERMERCADOS DE ALIMENTOS MUNDIALES EN EL MERCADO DE TARJETAS DE REGALO, POR PRODUCTO, 2021-2030 (MILLONES DE USD)

TABLA 13 MERCADO GLOBAL DE ENTRETENIMIENTO EN TARJETAS DE REGALO, POR PRODUCTO, 2021-2030 (MILLONES DE USD)

TABLA 14 MERCADO GLOBAL DE OTROS EN TARJETAS DE REGALO, POR PRODUCTO, 2021-2030 (MILLONES DE USD)

TABLA 15 MERCADO DE TARJETAS DE REGALO DE AMÉRICA DEL NORTE, POR PAÍS, 2021-2030 (MILLONES DE USD)

TABLA 16 MERCADO DE TARJETAS DE REGALO DE AMÉRICA DEL NORTE, POR PRODUCTO, 2021-2030 (MILLONES DE USD)

TABLA 17 MERCADO DE TARJETAS DE REGALO DE AMÉRICA DEL NORTE, POR ATRIBUTO FUNCIONAL, 2021-2030 (MILLONES DE USD)

TABLA 18 CICLO CERRADO DE AMÉRICA DEL NORTE EN EL MERCADO DE TARJETAS DE REGALO, POR TIPO, 2021-2030 (MILLONES DE USD)

TABLA 19 MERCADO DE TARJETAS DE REGALO DE AMÉRICA DEL NORTE, POR VERTICAL DE INDUSTRIA, 2021-2030 (MILLONES DE USD)

TABLA 20 MERCADO DE TARJETAS DE REGALO DE AMÉRICA DEL NORTE, POR COMERCIANTE, 2021-2030 (MILLONES DE USD)

TABLA 21 RESTAURANTES DE AMÉRICA DEL NORTE EN EL MERCADO DE TARJETAS DE REGALO, POR PRODUCTO, 2021-2030 (MILLONES DE USD)

TABLA 22 TIENDAS DE DESCUENTO DE AMÉRICA DEL NORTE EN EL MERCADO DE TARJETAS DE REGALO, POR PRODUCTO, 2021-2030 (MILLONES DE USD)

TABLA 23 CAFETERÍAS DE AMÉRICA DEL NORTE EN EL MERCADO DE TARJETAS DE REGALO, POR PRODUCTO, 2021-2030 (MILLONES DE USD)

TABLA 24 TIENDAS DEPARTAMENTALES DE AMÉRICA DEL NORTE EN EL MERCADO DE TARJETAS DE REGALO, POR PRODUCTO, 2021-2030 (MILLONES DE USD)

TABLA 25 TIENDAS DE COMESTIBLES/SUPERMERCADOS DE ALIMENTOS DE AMÉRICA DEL NORTE EN EL MERCADO DE TARJETAS DE REGALO, POR PRODUCTO, 2021-2030 (MILLONES DE USD)

TABLA 26 ENTRETENIMIENTO EN AMÉRICA DEL NORTE EN EL MERCADO DE TARJETAS DE REGALO, POR PRODUCTO, 2021-2030 (MILLONES DE USD)

TABLA 27 OTROS AMÉRICA DEL NORTE EN EL MERCADO DE TARJETAS DE REGALO, POR PRODUCTO, 2021-2030 (MILLONES DE USD)

TABLA 28 MERCADO DE TARJETAS DE REGALO DE EE. UU., POR PRODUCTO, 2021-2030 (MILLONES DE USD)

TABLA 29 MERCADO DE TARJETAS DE REGALO DE EE. UU., POR ATRIBUTO FUNCIONAL, 2021-2030 (MILLONES DE USD)

TABLA 30 BUCLE CERRADO DE EE. UU. EN EL MERCADO DE TARJETAS DE REGALO, POR TIPO, 2021-2030 (MILLONES DE USD)

TABLA 31 MERCADO DE TARJETAS DE REGALO DE EE. UU., POR VERTICAL DE LA INDUSTRIA, 2021-2030 (MILLONES DE USD)

TABLA 32 MERCADO DE TARJETAS DE REGALO DE EE. UU., POR COMERCIANTE, 2021-2030 (MILLONES DE USD)

TABLA 33 RESTAURANTES DE EE. UU. EN EL MERCADO DE TARJETAS DE REGALO, POR PRODUCTO, 2021-2030 (MILLONES DE USD)

TABLA 34 TIENDAS DE DESCUENTO DE EE. UU. EN EL MERCADO DE TARJETAS DE REGALO, POR PRODUCTO, 2021-2030 (MILLONES DE USD)

TABLA 35 CAFETERÍAS DE EE. UU. EN EL MERCADO DE TARJETAS DE REGALO, POR PRODUCTO, 2021-2030 (MILLONES DE USD)

TABLA 36 TIENDAS DEPARTAMENTALES DE EE. UU. EN EL MERCADO DE TARJETAS DE REGALO, POR PRODUCTO, 2021-2030 (MILLONES DE USD)

TABLA 37 TIENDAS DE COMESTIBLES/SUPERMERCADOS DE ALIMENTOS DE EE. UU. EN EL MERCADO DE TARJETAS DE REGALO, POR PRODUCTO, 2021-2030 (MILLONES DE USD)

TABLA 38 ENTRETENIMIENTO DE EE. UU. EN EL MERCADO DE TARJETAS DE REGALO, POR PRODUCTO, 2021-2030 (MILLONES DE USD)

TABLA 39 OTROS DE EE. UU. EN EL MERCADO DE TARJETAS DE REGALO, POR PRODUCTO, 2021-2030 (MILLONES DE USD)

TABLA 40 MERCADO DE TARJETAS DE REGALO DE CANADÁ, POR PRODUCTO, 2021-2030 (MILLONES DE USD)

TABLA 41 MERCADO DE TARJETAS DE REGALO DE CANADÁ, POR ATRIBUTO FUNCIONAL, 2021-2030 (MILLONES DE USD)

TABLA 42 BUCLE CERRADO DE CANADÁ EN EL MERCADO DE TARJETAS DE REGALO, POR TIPO, 2021-2030 (MILLONES DE USD)

TABLA 43 MERCADO DE TARJETAS DE REGALO DE CANADÁ, POR VERTICAL DE LA INDUSTRIA, 2021-2030 (MILLONES DE USD)

TABLA 44 MERCADO DE TARJETAS DE REGALO DE CANADÁ, POR COMERCIANTE, 2021-2030 (MILLONES DE USD)

TABLA 45 RESTAURANTES DE CANADÁ EN EL MERCADO DE TARJETAS DE REGALO, POR PRODUCTO, 2021-2030 (MILLONES DE USD)

TABLA 46 TIENDAS DE DESCUENTO DE CANADÁ EN EL MERCADO DE TARJETAS DE REGALO, POR PRODUCTO, 2021-2030 (MILLONES DE USD)

TABLA 47 CAFETERÍAS DE CANADÁ EN EL MERCADO DE TARJETAS DE REGALO, POR PRODUCTO, 2021-2030 (MILLONES DE USD)

TABLA 48 TIENDAS DEPARTAMENTALES DE CANADÁ EN EL MERCADO DE TARJETAS DE REGALO, POR PRODUCTO, 2021-2030 (MILLONES DE USD)

TABLA 49 TIENDAS DE COMESTIBLES/SUPERMERCADOS DE ALIMENTOS EN EL MERCADO DE TARJETAS DE REGALO DE CANADÁ, POR PRODUCTO, 2021-2030 (MILLONES DE USD)

TABLA 50 ENTRETENIMIENTO EN CANADÁ EN EL MERCADO DE TARJETAS DE REGALO, POR PRODUCTO, 2021-2030 (MILLONES DE USD)

TABLA 51 CANADÁ OTROS EN EL MERCADO DE TARJETAS DE REGALO, POR PRODUCTO, 2021-2030 (MILLONES DE USD)

TABLA 52 MERCADO DE TARJETAS DE REGALO EN MÉXICO, POR PRODUCTO, 2021-2030 (MILLONES DE USD)

CUADRO 53 MERCADO DE TARJETAS DE REGALO EN MÉXICO, POR ATRIBUTO FUNCIONAL, 2021-2030 (MILLONES DE USD)

CUADRO 54 CICLO CERRADO EN MÉXICO EN EL MERCADO DE TARJETAS DE REGALO, POR TIPO, 2021-2030 (MILLONES DE USD)

CUADRO 55 MERCADO DE TARJETAS DE REGALO EN MÉXICO, POR VERTICAL DE INDUSTRIA, 2021-2030 (MILLONES DE USD)

CUADRO 56 MERCADO DE TARJETAS DE REGALO EN MÉXICO, POR COMERCIAL, 2021-2030 (MILLONES DE USD)

TABLA 57 RESTAURANTES DE MÉXICO EN EL MERCADO DE TARJETAS DE REGALO, POR PRODUCTO, 2021-2030 (MILLONES DE USD)

TABLA 58 TIENDAS DE DESCUENTO EN MÉXICO EN EL MERCADO DE TARJETAS DE REGALO, POR PRODUCTO, 2021-2030 (MILLONES DE USD)

CUADRO 59 CAFETERÍAS EN EL MERCADO DE TARJETAS DE REGALO EN MÉXICO, POR PRODUCTO, 2021-2030 (MILLONES DE USD)

TABLA 60 TIENDAS DEPARTAMENTALES DE MÉXICO EN EL MERCADO DE TARJETAS DE REGALO, POR PRODUCTO, 2021-2030 (MILLONES DE USD)

TABLA 61 SUPERMERCADOS/SUPERMERCADOS DE ALIMENTOS EN EL MERCADO DE TARJETAS DE REGALO DE MÉXICO, POR PRODUCTO, 2021-2030 (MILLONES DE USD)

TABLA 62 ENTRETENIMIENTO EN MÉXICO EN EL MERCADO DE TARJETAS DE REGALO, POR PRODUCTO, 2021-2030 (MILLONES DE USD)

CUADRO 63 OTROS DE MÉXICO EN EL MERCADO DE TARJETAS DE REGALO, POR PRODUCTO, 2021-2030 (MILLONES DE USD)

CUADRO 64 MERCADO DE TARJETAS REGALO EN EUROPA, POR PAÍS, 2021-2030 (MILLONES DE USD)

TABLA 65 MERCADO EUROPEO DE TARJETAS REGALO, POR PRODUCTO, 2021-2030 (MILLONES DE USD)

TABLA 66 MERCADO EUROPEO DE TARJETAS REGALO, POR ATRIBUTO FUNCIONAL, 2021-2030 (MILLONES DE USD)

TABLA 67 BUCLE CERRADO EN EUROPA EN EL MERCADO DE TARJETAS DE REGALO, POR TIPO, 2021-2030 (MILLONES DE USD)

TABLA 68 MERCADO EUROPEO DE TARJETAS REGALO, POR VERTICAL DE LA INDUSTRIA, 2021-2030 (MILLONES DE USD)

TABLA 69 MERCADO EUROPEO DE TARJETAS REGALO, POR COMERCIANTE, 2021-2030 (MILLONES DE USD)

TABLA 70 RESTAURANTES DE EUROPA EN EL MERCADO DE TARJETAS DE REGALO, POR PRODUCTO, 2021-2030 (MILLONES DE USD)

TABLA 71 TIENDAS DE DESCUENTO EN EUROPA EN EL MERCADO DE TARJETAS DE REGALO, POR PRODUCTO, 2021-2030 (MILLONES DE USD)

TABLA 72 CAFETERÍAS DE EUROPA EN EL MERCADO DE TARJETAS DE REGALO, POR PRODUCTO, 2021-2030 (MILLONES DE USD)

TABLA 73 TIENDAS DEPARTAMENTALES DE EUROPA EN EL MERCADO DE TARJETAS DE REGALO, POR PRODUCTO, 2021-2030 (MILLONES DE USD)

TABLA 74 TIENDAS DE COMESTIBLES/SUPERMERCADOS DE ALIMENTOS EN EL MERCADO DE TARJETAS DE REGALO DE EUROPA, POR PRODUCTO, 2021-2030 (MILLONES DE USD)

TABLA 75 ENTRETENIMIENTO EN EL MERCADO DE TARJETAS REGALO EN EUROPA, POR PRODUCTO, 2021-2030 (MILLONES DE USD)

TABLA 76 EUROPA OTROS EN EL MERCADO DE TARJETAS DE REGALO, POR PRODUCTO, 2021-2030 (MILLONES DE USD)

TABLA 77 MERCADO DE TARJETAS DE REGALO DE ALEMANIA, POR PRODUCTO, 2021-2030 (MILLONES DE USD)

TABLA 78 MERCADO DE TARJETAS REGALO DE ALEMANIA, POR ATRIBUTO FUNCIONAL, 2021-2030 (MILLONES DE USD)

TABLA 79 BUCLE CERRADO DE ALEMANIA EN EL MERCADO DE TARJETAS DE REGALO, POR TIPO, 2021-2030 (MILLONES DE USD)

TABLA 80 MERCADO DE TARJETAS DE REGALO DE ALEMANIA, POR VERTICAL DE LA INDUSTRIA, 2021-2030 (MILLONES DE USD)

TABLA 81 MERCADO DE TARJETAS DE REGALO DE ALEMANIA, POR COMERCIANTE, 2021-2030 (MILLONES DE USD)

TABLA 82 RESTAURANTES DE ALEMANIA EN EL MERCADO DE TARJETAS DE REGALO, POR PRODUCTO, 2021-2030 (MILLONES DE USD)

TABLA 83 TIENDAS DE DESCUENTO DE ALEMANIA EN EL MERCADO DE TARJETAS DE REGALO, POR PRODUCTO, 2021-2030 (MILLONES DE USD)

TABLA 84 CAFETERÍAS DE ALEMANIA EN EL MERCADO DE TARJETAS DE REGALO, POR PRODUCTO, 2021-2030 (MILLONES DE USD)

TABLA 85 TIENDAS DEPARTAMENTALES DE ALEMANIA EN EL MERCADO DE TARJETAS DE REGALO, POR PRODUCTO, 2021-2030 (MILLONES DE USD)

TABLA 86 TIENDAS DE COMESTIBLES/SUPERMERCADOS DE ALIMENTOS EN EL MERCADO DE TARJETAS DE REGALO DE ALEMANIA, POR PRODUCTO, 2021-2030 (MILLONES DE USD)

TABLA 87 ENTRETENIMIENTO EN ALEMANIA EN EL MERCADO DE TARJETAS DE REGALO, POR PRODUCTO, 2021-2030 (MILLONES DE USD)

TABLA 88 ALEMANIA OTROS EN EL MERCADO DE TARJETAS DE REGALO, POR PRODUCTO, 2021-2030 (MILLONES DE USD)

TABLA 89 MERCADO DE TARJETAS DE REGALO DE RUSIA, POR PRODUCTO, 2021-2030 (MILLONES DE USD)

TABLA 90 MERCADO DE TARJETAS DE REGALO DE RUSIA, POR ATRIBUTO FUNCIONAL, 2021-2030 (MILLONES DE USD)

TABLA 91 BUCLE CERRADO DE RUSIA EN EL MERCADO DE TARJETAS DE REGALO, POR TIPO, 2021-2030 (MILLONES DE USD)

TABLA 92 MERCADO DE TARJETAS DE REGALO DE RUSIA, POR VERTICAL DE LA INDUSTRIA, 2021-2030 (MILLONES DE USD)

TABLA 93 MERCADO DE TARJETAS DE REGALO DE RUSIA, POR COMERCIANTE, 2021-2030 (MILLONES DE USD)

TABLA 94 RESTAURANTES DE RUSIA EN EL MERCADO DE TARJETAS DE REGALO, POR PRODUCTO, 2021-2030 (MILLONES DE USD)

TABLA 95 TIENDAS DE DESCUENTO DE RUSIA EN EL MERCADO DE TARJETAS DE REGALO, POR PRODUCTO, 2021-2030 (MILLONES DE USD)

TABLA 96 CAFETERÍAS DE RUSIA EN EL MERCADO DE TARJETAS DE REGALO, POR PRODUCTO, 2021-2030 (MILLONES DE USD)

TABLA 97 TIENDAS DEPARTAMENTALES DE RUSIA EN EL MERCADO DE TARJETAS DE REGALO, POR PRODUCTO, 2021-2030 (MILLONES DE USD)

TABLA 98 TIENDAS DE COMESTIBLES/SUPERMERCADOS DE ALIMENTOS DE RUSIA EN EL MERCADO DE TARJETAS DE REGALO, POR PRODUCTO, 2021-2030 (MILLONES DE USD)

TABLA 99 ENTRETENIMIENTO EN RUSIA EN EL MERCADO DE TARJETAS DE REGALO, POR PRODUCTO, 2021-2030 (MILLONES DE USD)

TABLA 100 RUSIA OTROS EN EL MERCADO DE TARJETAS DE REGALO, POR PRODUCTO, 2021-2030 (MILLONES DE USD)

TABLA 101 MERCADO DE TARJETAS DE REGALO DE FRANCIA, POR PRODUCTO, 2021-2030 (MILLONES DE USD)

TABLA 102 MERCADO DE TARJETAS REGALO DE FRANCIA, POR ATRIBUTO FUNCIONAL, 2021-2030 (MILLONES DE USD)

TABLA 103 BUCLE CERRADO EN FRANCIA EN EL MERCADO DE TARJETAS DE REGALO, POR TIPO, 2021-2030 (MILLONES DE USD)

TABLA 104 MERCADO DE TARJETAS DE REGALO DE FRANCIA, POR VERTICAL DE LA INDUSTRIA, 2021-2030 (MILLONES DE USD)

TABLA 105 MERCADO DE TARJETAS REGALO DE FRANCIA, POR COMERCIANTE, 2021-2030 (MILLONES DE USD)

TABLA 106 RESTAURANTES DE FRANCIA EN EL MERCADO DE TARJETAS DE REGALO, POR PRODUCTO, 2021-2030 (MILLONES DE USD)

TABLA 107 TIENDAS DE DESCUENTO EN FRANCIA EN EL MERCADO DE TARJETAS DE REGALO, POR PRODUCTO, 2021-2030 (MILLONES DE USD)

TABLA 108 CAFETERÍAS EN FRANCIA EN EL MERCADO DE TARJETAS DE REGALO, POR PRODUCTO, 2021-2030 (MILLONES DE USD)

TABLA 109 TIENDAS DEPARTAMENTALES DE FRANCIA EN EL MERCADO DE TARJETAS DE REGALO, POR PRODUCTO, 2021-2030 (MILLONES DE USD)

TABLA 110 TIENDAS DE COMESTIBLES/SUPERMERCADOS DE ALIMENTOS EN EL MERCADO DE TARJETAS DE REGALO DE FRANCIA, POR PRODUCTO, 2021-2030 (MILLONES DE USD)

TABLA 111 ENTRETENIMIENTO EN FRANCIA EN EL MERCADO DE TARJETAS DE REGALO, POR PRODUCTO, 2021-2030 (MILLONES DE USD)

TABLA 112 FRANCIA OTROS EN EL MERCADO DE TARJETAS DE REGALO, POR PRODUCTO, 2021-2030 (MILLONES DE USD)

TABLA 113 MERCADO DE TARJETAS REGALO DEL REINO UNIDO, POR PRODUCTO, 2021-2030 (MILLONES DE USD)

TABLA 114 MERCADO DE TARJETAS REGALO DEL REINO UNIDO, POR ATRIBUTO FUNCIONAL, 2021-2030 (MILLONES DE USD)

TABLA 115 BUCLE CERRADO DEL MERCADO DE TARJETAS REGALO DEL REINO UNIDO, POR TIPO, 2021-2030 (MILLONES DE USD)

TABLA 116 MERCADO DE TARJETAS REGALO DEL REINO UNIDO, POR VERTICAL DE LA INDUSTRIA, 2021-2030 (MILLONES DE USD)

TABLA 117 MERCADO DE TARJETAS DE REGALO DEL REINO UNIDO, POR COMERCIANTE, 2021-2030 (MILLONES DE USD)

TABLA 118 RESTAURANTES DEL REINO UNIDO EN EL MERCADO DE TARJETAS DE REGALO, POR PRODUCTO, 2021-2030 (MILLONES DE USD)

TABLA 119 TIENDAS DE DESCUENTO DEL REINO UNIDO EN EL MERCADO DE TARJETAS DE REGALO, POR PRODUCTO, 2021-2030 (MILLONES DE USD)

TABLA 120 CAFETERÍAS DEL REINO UNIDO EN EL MERCADO DE TARJETAS DE REGALO, POR PRODUCTO, 2021-2030 (MILLONES DE USD)

TABLA 121 TIENDAS DEPARTAMENTALES DEL REINO UNIDO EN EL MERCADO DE TARJETAS DE REGALO, POR PRODUCTO, 2021-2030 (MILLONES DE USD)

TABLA 122 TIENDAS DE COMESTIBLES/SUPERMERCADOS DE ALIMENTOS DEL REINO UNIDO EN EL MERCADO DE TARJETAS DE REGALO, POR PRODUCTO, 2021-2030 (MILLONES DE USD)

TABLA 123 ENTRETENIMIENTO DEL REINO UNIDO EN EL MERCADO DE TARJETAS DE REGALO, POR PRODUCTO, 2021-2030 (MILLONES DE USD)

TABLA 124 OTROS DEL REINO UNIDO EN EL MERCADO DE TARJETAS DE REGALO, POR PRODUCTO, 2021-2030 (MILLONES DE USD)

TABLA 125 MERCADO DE TARJETAS DE REGALO DE TURQUÍA, POR PRODUCTO, 2021-2030 (MILLONES DE USD)

TABLA 126 MERCADO DE TARJETAS DE REGALO DE TURQUÍA, POR ATRIBUTO FUNCIONAL, 2021-2030 (MILLONES DE USD)

TABLA 127 BUCLE CERRADO DE TURQUÍA EN EL MERCADO DE TARJETAS DE REGALO, POR TIPO, 2021-2030 (MILLONES DE USD)

TABLA 128 MERCADO DE TARJETAS DE REGALO DE TURQUÍA, POR VERTICAL DE LA INDUSTRIA, 2021-2030 (MILLONES DE USD)

TABLA 129 MERCADO DE TARJETAS DE REGALO DE TURQUÍA, POR COMERCIANTE, 2021-2030 (MILLONES DE USD)

TABLA 130 RESTAURANTES DE TURQUÍA EN EL MERCADO DE TARJETAS DE REGALO, POR PRODUCTO, 2021-2030 (MILLONES DE USD)

TABLA 131 TIENDAS DE DESCUENTO DE TURQUÍA EN EL MERCADO DE TARJETAS DE REGALO, POR PRODUCTO, 2021-2030 (MILLONES DE USD)

TABLA 132 CAFETERÍAS DE TURQUÍA EN EL MERCADO DE TARJETAS DE REGALO, POR PRODUCTO, 2021-2030 (MILLONES DE USD)

TABLA 133 TIENDAS DEPARTAMENTALES DE TURQUÍA EN EL MERCADO DE TARJETAS DE REGALO, POR PRODUCTO, 2021-2030 (MILLONES DE USD)

TABLA 134 TIENDAS DE COMESTIBLES/SUPERMERCADOS DE ALIMENTOS EN EL MERCADO DE TARJETAS DE REGALO DE TURQUÍA, POR PRODUCTO, 2021-2030 (MILLONES DE USD)

TABLA 135 ENTRETENIMIENTO EN TURQUÍA EN EL MERCADO DE TARJETAS DE REGALO, POR PRODUCTO, 2021-2030 (MILLONES DE USD)

TABLA 136 TURQUÍA OTROS EN EL MERCADO DE TARJETAS DE REGALO, POR PRODUCTO, 2021-2030 (MILLONES DE USD)

TABLA 137 MERCADO DE TARJETAS DE REGALO DE ITALIA, POR PRODUCTO, 2021-2030 (MILLONES DE USD)

TABLA 138 MERCADO DE TARJETAS REGALO DE ITALIA, POR ATRIBUTO FUNCIONAL, 2021-2030 (MILLONES DE USD)

TABLA 139 BUCLE CERRADO DE ITALIA EN EL MERCADO DE TARJETAS DE REGALO, POR TIPO, 2021-2030 (MILLONES DE USD)

TABLA 140 MERCADO DE TARJETAS DE REGALO DE ITALIA, POR VERTICAL DE LA INDUSTRIA, 2021-2030 (MILLONES DE USD)

TABLA 141 MERCADO DE TARJETAS DE REGALO DE ITALIA, POR COMERCIANTE, 2021-2030 (MILLONES DE USD)

TABLA 142 RESTAURANTES DE ITALIA EN EL MERCADO DE TARJETAS DE REGALO, POR PRODUCTO, 2021-2030 (MILLONES DE USD)

TABLA 143 TIENDAS DE DESCUENTO DE ITALIA EN EL MERCADO DE TARJETAS DE REGALO, POR PRODUCTO, 2021-2030 (MILLONES DE USD)

TABLA 144 CAFETERÍAS DE ITALIA EN EL MERCADO DE TARJETAS DE REGALO, POR PRODUCTO, 2021-2030 (MILLONES DE USD)

TABLA 145 TIENDAS DEPARTAMENTALES DE ITALIA EN EL MERCADO DE TARJETAS DE REGALO, POR PRODUCTO, 2021-2030 (MILLONES DE USD)

TABLA 146 TIENDAS DE COMESTIBLES/SUPERMERCADOS DE ALIMENTOS EN EL MERCADO DE TARJETAS DE REGALO DE ITALIA, POR PRODUCTO, 2021-2030 (MILLONES DE USD)

TABLA 147 ENTRETENIMIENTO EN ITALIA EN EL MERCADO DE TARJETAS DE REGALO, POR PRODUCTO, 2021-2030 (MILLONES DE USD)

TABLA 148 ITALIA OTROS EN EL MERCADO DE TARJETAS DE REGALO, POR PRODUCTO, 2021-2030 (MILLONES DE USD)

TABLA 149 MERCADO DE TARJETAS REGALO EN ESPAÑA, POR PRODUCTO, 2021-2030 (MILLONES DE USD)

TABLA 150 MERCADO DE TARJETAS REGALO EN ESPAÑA, POR ATRIBUTO FUNCIONAL, 2021-2030 (MILLONES DE USD)

TABLA 151 BUCLE CERRADO EN ESPAÑA DEL MERCADO DE TARJETAS REGALO, POR TIPO, 2021-2030 (MILLONES DE USD)

TABLA 152 MERCADO DE TARJETAS REGALO EN ESPAÑA, POR VERTICAL DE INDUSTRIA, 2021-2030 (MILLONES DE USD)

TABLA 153 MERCADO DE TARJETAS REGALO EN ESPAÑA, POR COMERCIANTE, 2021-2030 (MILLONES DE USD)

TABLA 154 RESTAURANTES DE ESPAÑA EN EL MERCADO DE TARJETAS REGALO, POR PRODUCTO, 2021-2030 (MILLONES DE USD)

TABLA 155 TIENDAS DE DESCUENTO DE ESPAÑA EN EL MERCADO DE TARJETAS REGALO, POR PRODUCTO, 2021-2030 (MILLONES DE USD)

TABLA 156 CAFETERÍAS DE ESPAÑA EN EL MERCADO DE TARJETAS REGALO, POR PRODUCTO, 2021-2030 (MILLONES DE USD)

TABLA 157 TIENDAS DEPARTAMENTALES DE ESPAÑA EN EL MERCADO DE TARJETAS REGALO, POR PRODUCTO, 2021-2030 (MILLONES DE USD)

TABLA 158 SUPERMERCADOS DE COMESTIBLES/SUPERMERCADOS DE ALIMENTACIÓN EN EL MERCADO DE TARJETAS REGALO DE ESPAÑA, POR PRODUCTO, 2021-2030 (MILLONES DE USD)

TABLA 159 ENTRETENIMIENTO EN ESPAÑA EN EL MERCADO DE TARJETAS REGALO, POR PRODUCTO, 2021-2030 (MILLONES DE USD)

TABLA 160 ESPAÑA OTROS EN EL MERCADO DE TARJETAS REGALO, POR PRODUCTO, 2021-2030 (MILLONES DE USD)

TABLA 161 MERCADO DE TARJETAS DE REGALO DE POLONIA, POR PRODUCTO, 2021-2030 (MILLONES DE USD)

TABLA 162 MERCADO DE TARJETAS REGALO DE POLONIA, POR ATRIBUTO FUNCIONAL, 2021-2030 (MILLONES DE USD)

TABLA 163 CICLO CERRADO DE POLONIA EN EL MERCADO DE TARJETAS DE REGALO, POR TIPO, 2021-2030 (MILLONES DE USD)

TABLA 164 MERCADO DE TARJETAS DE REGALO DE POLONIA, POR VERTICAL DE LA INDUSTRIA, 2021-2030 (MILLONES DE USD)

TABLA 165 MERCADO DE TARJETAS DE REGALO DE POLONIA, POR COMERCIANTE, 2021-2030 (MILLONES DE USD)

TABLA 166 RESTAURANTES DE POLONIA EN EL MERCADO DE TARJETAS DE REGALO, POR PRODUCTO, 2021-2030 (MILLONES DE USD)

TABLA 167 TIENDAS DE DESCUENTO DE POLONIA EN EL MERCADO DE TARJETAS DE REGALO, POR PRODUCTO, 2021-2030 (MILLONES DE USD)

TABLA 168 CAFETERÍAS DE POLONIA EN EL MERCADO DE TARJETAS DE REGALO, POR PRODUCTO, 2021-2030 (MILLONES DE USD)

TABLA 169 TIENDAS DEPARTAMENTALES DE POLONIA EN EL MERCADO DE TARJETAS DE REGALO, POR PRODUCTO, 2021-2030 (MILLONES DE USD)

TABLA 170 TIENDAS DE COMESTIBLES/SUPERMERCADOS DE ALIMENTOS DE POLONIA EN EL MERCADO DE TARJETAS DE REGALO, POR PRODUCTO, 2021-2030 (MILLONES DE USD)

TABLA 171 ENTRETENIMIENTO DE POLONIA EN EL MERCADO DE TARJETAS DE REGALO, POR PRODUCTO, 2021-2030 (MILLONES DE USD)

TABLA 172 POLONIA OTROS EN EL MERCADO DE TARJETAS DE REGALO, POR PRODUCTO, 2021-2030 (MILLONES DE USD)

TABLA 173 MERCADO DE TARJETAS DE REGALO DE LOS PAÍSES BAJOS, POR PRODUCTO, 2021-2030 (MILLONES DE USD)

TABLA 174 MERCADO DE TARJETAS DE REGALO DE LOS PAÍSES BAJOS, POR ATRIBUTO FUNCIONAL, 2021-2030 (MILLONES DE USD)

TABLA 175 BUCLE CERRADO DE LOS PAÍSES BAJOS EN EL MERCADO DE TARJETAS DE REGALO, POR TIPO, 2021-2030 (MILLONES DE USD)

TABLA 176 MERCADO DE TARJETAS DE REGALO DE LOS PAÍSES BAJOS, POR VERTICAL DE LA INDUSTRIA, 2021-2030 (MILLONES DE USD)

TABLA 177 MERCADO DE TARJETAS DE REGALO DE LOS PAÍSES BAJOS, POR COMERCIANTE, 2021-2030 (MILLONES DE USD)

TABLA 178 RESTAURANTES DE HOLANDA EN EL MERCADO DE TARJETAS DE REGALO, POR PRODUCTO, 2021-2030 (MILLONES DE USD)

TABLA 179 TIENDAS DE DESCUENTO DE LOS PAÍSES BAJOS EN EL MERCADO DE TARJETAS DE REGALO, POR PRODUCTO, 2021-2030 (MILLONES DE USD)

TABLA 180 CAFETERÍAS DE HOLANDA EN EL MERCADO DE TARJETAS DE REGALO, POR PRODUCTO, 2021-2030 (MILLONES DE USD)

TABLA 181 TIENDAS DEPARTAMENTALES DE HOLANDA EN EL MERCADO DE TARJETAS DE REGALO, POR PRODUCTO, 2021-2030 (MILLONES DE USD)

TABLA 182 TIENDAS DE COMESTIBLES/SUPERMERCADOS DE ALIMENTOS DE LOS PAÍSES BAJOS EN EL MERCADO DE TARJETAS DE REGALO, POR PRODUCTO, 2021-2030 (MILLONES DE USD)

TABLA 183 ENTRETENIMIENTO DE LOS PAÍSES BAJOS EN EL MERCADO DE TARJETAS DE REGALO, POR PRODUCTO, 2021-2030 (MILLONES DE USD)

TABLA 184 OTROS PAÍSES BAJOS EN EL MERCADO DE TARJETAS DE REGALO, POR PRODUCTO, 2021-2030 (MILLONES DE USD)

TABLA 185 MERCADO DE TARJETAS REGALO DE BÉLGICA, POR PRODUCTO, 2021-2030 (MILLONES DE USD)

TABLA 186 MERCADO DE TARJETAS REGALO DE BÉLGICA, POR ATRIBUTO FUNCIONAL, 2021-2030 (MILLONES DE USD)

TABLA 187 BUCLE CERRADO EN BÉLGICA EN EL MERCADO DE TARJETAS DE REGALO, POR TIPO, 2021-2030 (MILLONES DE USD)

TABLA 188 MERCADO DE TARJETAS REGALO DE BÉLGICA, POR VERTICAL DE LA INDUSTRIA, 2021-2030 (MILLONES DE USD)

TABLA 189 MERCADO DE TARJETAS REGALO DE BÉLGICA, POR COMERCIANTE, 2021-2030 (MILLONES DE USD)

TABLA 190 RESTAURANTES DE BÉLGICA EN EL MERCADO DE TARJETAS DE REGALO, POR PRODUCTO, 2021-2030 (MILLONES DE USD)

TABLA 191 TIENDAS DE DESCUENTO DE BÉLGICA EN EL MERCADO DE TARJETAS DE REGALO, POR PRODUCTO, 2021-2030 (MILLONES DE USD)

TABLA 192 CAFETERÍAS DE BÉLGICA EN EL MERCADO DE TARJETAS DE REGALO, POR PRODUCTO, 2021-2030 (MILLONES DE USD)

TABLA 193 TIENDAS DEPARTAMENTALES DE BÉLGICA EN EL MERCADO DE TARJETAS DE REGALO, POR PRODUCTO, 2021-2030 (MILLONES DE USD)

TABLA 194 TIENDAS DE COMESTIBLES/SUPERMERCADOS DE ALIMENTOS DE BÉLGICA EN EL MERCADO DE TARJETAS DE REGALO, POR PRODUCTO, 2021-2030 (MILLONES DE USD)

TABLA 195 ENTRETENIMIENTO EN BÉLGICA EN EL MERCADO DE TARJETAS DE REGALO, POR PRODUCTO, 2021-2030 (MILLONES DE USD)

TABLA 196 OTROS BÉLGICA EN EL MERCADO DE TARJETAS DE REGALO, POR PRODUCTO, 2021-2030 (MILLONES DE USD)

TABLA 197 MERCADO DE TARJETAS DE REGALO DE SUIZA, POR PRODUCTO, 2021-2030 (MILLONES DE USD)

TABLA 198 MERCADO DE TARJETAS REGALO DE SUIZA, POR ATRIBUTO FUNCIONAL, 2021-2030 (MILLONES DE USD)

TABLA 199 BUCLE CERRADO DE SUIZA EN EL MERCADO DE TARJETAS DE REGALO, POR TIPO, 2021-2030 (MILLONES DE USD)

TABLA 200 MERCADO DE TARJETAS DE REGALO DE SUIZA, POR VERTICAL DE INDUSTRIA, 2021-2030 (MILLONES DE USD)

TABLA 201 MERCADO DE TARJETAS DE REGALO DE SUIZA, POR COMERCIANTE, 2021-2030 (MILLONES DE USD)

TABLA 202 RESTAURANTES DE SUIZA EN EL MERCADO DE TARJETAS DE REGALO, POR PRODUCTO, 2021-2030 (MILLONES DE USD)

TABLA 203 TIENDAS DE DESCUENTO EN SUIZA EN EL MERCADO DE TARJETAS DE REGALO, POR PRODUCTO, 2021-2030 (MILLONES DE USD)

TABLA 204 CAFETERÍAS EN EL MERCADO DE TARJETAS REGALO DE SUIZA, POR PRODUCTO, 2021-2030 (MILLONES DE USD)

TABLA 205 TIENDAS DEPARTAMENTALES DE SUIZA EN EL MERCADO DE TARJETAS DE REGALO, POR PRODUCTO, 2021-2030 (MILLONES DE USD)

TABLA 206 TIENDAS DE COMESTIBLES/SUPERMERCADOS DE ALIMENTOS EN EL MERCADO DE TARJETAS DE REGALO DE SUIZA, POR PRODUCTO, 2021-2030 (MILLONES DE USD)

TABLA 207 ENTRETENIMIENTO EN SUIZA EN EL MERCADO DE TARJETAS DE REGALO, POR PRODUCTO, 2021-2030 (MILLONES DE USD)

TABLA 208 SUIZA OTROS EN EL MERCADO DE TARJETAS DE REGALO, POR PRODUCTO, 2021-2030 (MILLONES DE USD)

TABLA 209 MERCADO DE TARJETAS DE REGALO DE SUECIA, POR PRODUCTO, 2021-2030 (MILLONES DE USD)

TABLA 210 MERCADO DE TARJETAS DE REGALO DE SUECIA, POR ATRIBUTO FUNCIONAL, 2021-2030 (MILLONES DE USD)

TABLA 211 BUCLE CERRADO DE SUECIA EN EL MERCADO DE TARJETAS DE REGALO, POR TIPO, 2021-2030 (MILLONES DE USD)

TABLA 212 MERCADO DE TARJETAS DE REGALO DE SUECIA, POR VERTICAL DE LA INDUSTRIA, 2021-2030 (MILLONES DE USD)

TABLA 213 MERCADO DE TARJETAS DE REGALO DE SUECIA, POR COMERCIANTE, 2021-2030 (MILLONES DE USD)

TABLA 214 RESTAURANTES DE SUECIA EN EL MERCADO DE TARJETAS DE REGALO, POR PRODUCTO, 2021-2030 (MILLONES DE USD)

TABLA 215 TIENDAS DE DESCUENTO EN SUECIA EN EL MERCADO DE TARJETAS DE REGALO, POR PRODUCTO, 2021-2030 (MILLONES DE USD)

TABLA 216 CAFETERÍAS EN EL MERCADO DE TARJETAS DE REGALO DE SUECIA, POR PRODUCTO, 2021-2030 (MILLONES DE USD)

TABLA 217 TIENDAS DEPARTAMENTALES DE SUECIA EN EL MERCADO DE TARJETAS DE REGALO, POR PRODUCTO, 2021-2030 (MILLONES DE USD)

TABLA 218 TIENDAS DE COMESTIBLES/SUPERMERCADOS DE ALIMENTOS EN EL MERCADO DE TARJETAS DE REGALO DE SUECIA, POR PRODUCTO, 2021-2030 (MILLONES DE USD)

TABLA 219 ENTRETENIMIENTO EN SUECIA EN EL MERCADO DE TARJETAS DE REGALO, POR PRODUCTO, 2021-2030 (MILLONES DE USD)

TABLA 220 SUECIA OTROS EN EL MERCADO DE TARJETAS DE REGALO, POR PRODUCTO, 2021-2030 (MILLONES DE USD)

TABLA 221 MERCADO DE TARJETAS REGALO DEL RESTO DE EUROPA, POR PRODUCTO, 2021-2030 (MILLONES DE USD)

CUADRO 222 MERCADO DE TARJETAS DE REGALO DE ASIA Y EL PACÍFICO, POR PAÍS, 2021-2030 (MILLONES DE USD)

TABLA 223 MERCADO DE TARJETAS DE REGALO DE ASIA Y EL PACÍFICO, POR PRODUCTO, 2021-2030 (MILLONES DE USD)

TABLA 224 MERCADO DE TARJETAS DE REGALO DE ASIA Y EL PACÍFICO, POR ATRIBUTO FUNCIONAL, 2021-2030 (MILLONES DE USD)

TABLA 225 CICLO CERRADO DE ASIA Y PACÍFICO EN EL MERCADO DE TARJETAS DE REGALO, POR TIPO, 2021-2030 (MILLONES DE USD)

TABLA 226 MERCADO DE TARJETAS DE REGALO DE ASIA Y EL PACÍFICO, POR VERTICAL DE INDUSTRIA, 2021-2030 (MILLONES DE USD)

TABLA 227 MERCADO DE TARJETAS DE REGALO DE ASIA Y EL PACÍFICO, POR COMERCIANTE, 2021-2030 (MILLONES DE USD)

TABLA 228 RESTAURANTES DE ASIA Y PACÍFICO EN EL MERCADO DE TARJETAS DE REGALO, POR PRODUCTO, 2021-2030 (MILLONES DE USD)

TABLA 229 TIENDAS DE DESCUENTO DE ASIA Y EL PACÍFICO EN EL MERCADO DE TARJETAS DE REGALO, POR PRODUCTO, 2021-2030 (MILLONES DE USD)

TABLA 230 CAFETERÍAS DE ASIA Y EL PACÍFICO EN EL MERCADO DE TARJETAS DE REGALO, POR PRODUCTO, 2021-2030 (MILLONES DE USD)

TABLA 231 TIENDAS DEPARTAMENTALES DE ASIA Y PACÍFICO EN EL MERCADO DE TARJETAS DE REGALO, POR PRODUCTO, 2021-2030 (MILLONES DE USD)

TABLA 232 TIENDAS DE COMESTIBLES/SUPERMERCADOS DE ALIMENTOS DE ASIA Y EL PACÍFICO EN EL MERCADO DE TARJETAS DE REGALO, POR PRODUCTO, 2021-2030 (MILLONES DE USD)

TABLA 233 ENTRETENIMIENTO EN EL MERCADO DE TARJETAS DE REGALO DE ASIA Y EL PACÍFICO, POR PRODUCTO, 2021-2030 (MILLONES DE USD)

TABLA 234 OTROS DE ASIA Y EL PACÍFICO EN EL MERCADO DE TARJETAS DE REGALO, POR PRODUCTO, 2021-2030 (MILLONES DE USD)

TABLA 235 MERCADO DE TARJETAS DE REGALO DE CHINA, POR PRODUCTO, 2021-2030 (MILLONES DE USD)

CUADRO 236 MERCADO DE TARJETAS DE REGALO DE CHINA, POR ATRIBUTO FUNCIONAL, 2021-2030 (MILLONES DE USD)

TABLA 237 BUCLE CERRADO DE CHINA EN EL MERCADO DE TARJETAS DE REGALO, POR TIPO, 2021-2030 (MILLONES DE USD)

TABLA 238 MERCADO DE TARJETAS DE REGALO DE CHINA, POR VERTICAL DE LA INDUSTRIA, 2021-2030 (MILLONES DE USD)

TABLA 239 MERCADO DE TARJETAS DE REGALO DE CHINA, POR COMERCIANTE, 2021-2030 (MILLONES DE USD)

TABLA 240 RESTAURANTES DE CHINA EN EL MERCADO DE TARJETAS DE REGALO, POR PRODUCTO, 2021-2030 (MILLONES DE USD)

TABLA 241 TIENDAS DE DESCUENTO DE CHINA EN EL MERCADO DE TARJETAS DE REGALO, POR PRODUCTO, 2021-2030 (MILLONES DE USD)

TABLA 242 CAFETERÍAS DE CHINA EN EL MERCADO DE TARJETAS DE REGALO, POR PRODUCTO, 2021-2030 (MILLONES DE USD)

TABLA 243 TIENDAS DEPARTAMENTALES DE CHINA EN EL MERCADO DE TARJETAS DE REGALO, POR PRODUCTO, 2021-2030 (MILLONES DE USD)

TABLA 244 TIENDAS DE COMESTIBLES/SUPERMERCADOS DE ALIMENTOS DE CHINA EN EL MERCADO DE TARJETAS DE REGALO, POR PRODUCTO, 2021-2030 (MILLONES DE USD)

TABLA 245 ENTRETENIMIENTO EN CHINA EN EL MERCADO DE TARJETAS DE REGALO, POR PRODUCTO, 2021-2030 (MILLONES DE USD)

TABLA 246 CHINA OTROS EN EL MERCADO DE TARJETAS DE REGALO, POR PRODUCTO, 2021-2030 (MILLONES DE USD)

TABLA 247 MERCADO DE TARJETAS DE REGALO DE LA INDIA, POR PRODUCTO, 2021-2030 (MILLONES DE USD)

TABLA 248 MERCADO DE TARJETAS DE REGALO DE LA INDIA, POR ATRIBUTO FUNCIONAL, 2021-2030 (MILLONES DE USD)

TABLA 249 BUCLE CERRADO DE LA INDIA EN EL MERCADO DE TARJETAS DE REGALO, POR TIPO, 2021-2030 (MILLONES DE USD)

TABLA 250 MERCADO DE TARJETAS DE REGALO DE LA INDIA, POR VERTICAL DE LA INDUSTRIA, 2021-2030 (MILLONES DE USD)

TABLA 251 MERCADO DE TARJETAS DE REGALO DE LA INDIA, POR COMERCIANTE, 2021-2030 (MILLONES DE USD)

TABLA 252 RESTAURANTES DE LA INDIA EN EL MERCADO DE TARJETAS DE REGALO, POR PRODUCTO, 2021-2030 (MILLONES DE USD)

TABLA 253 TIENDAS DE DESCUENTO DE LA INDIA EN EL MERCADO DE TARJETAS DE REGALO, POR PRODUCTO, 2021-2030 (MILLONES DE USD)

TABLA 254 CAFETERÍAS DE LA INDIA EN EL MERCADO DE TARJETAS DE REGALO, POR PRODUCTO, 2021-2030 (MILLONES DE USD)

TABLA 255 TIENDAS DEPARTAMENTALES DE LA INDIA EN EL MERCADO DE TARJETAS DE REGALO, POR PRODUCTO, 2021-2030 (MILLONES DE USD)

TABLA 256 TIENDAS DE COMESTIBLES/SUPERMERCADOS DE ALIMENTOS DE LA INDIA EN EL MERCADO DE TARJETAS DE REGALO, POR PRODUCTO, 2021-2030 (MILLONES DE USD)

TABLA 257 ENTRETENIMIENTO EN LA INDIA EN EL MERCADO DE TARJETAS DE REGALO, POR PRODUCTO, 2021-2030 (MILLONES DE USD)

TABLA 258 INDIA OTROS EN EL MERCADO DE TARJETAS DE REGALO, POR PRODUCTO, 2021-2030 (MILLONES DE USD)

TABLA 259 MERCADO DE TARJETAS DE REGALO DEL SUDESTE DE ASIA, POR PRODUCTO, 2021-2030 (MILLONES DE USD)

CUADRO 260 MERCADO DE TARJETAS DE REGALO DEL SUDESTE DE ASIA, POR ATRIBUTO FUNCIONAL, 2021-2030 (MILLONES DE USD)

TABLA 261 BUCLE CERRADO DEL SUDESTE DE ASIA EN EL MERCADO DE TARJETAS DE REGALO, POR TIPO, 2021-2030 (MILLONES DE USD)

CUADRO 262 MERCADO DE TARJETAS DE REGALO DEL SUDESTE DE ASIA, POR VERTICAL DE INDUSTRIA, 2021-2030 (MILLONES DE USD)

CUADRO 263 MERCADO DE TARJETAS DE REGALO DEL SUDESTE DE ASIA, POR COMERCIANTE, 2021-2030 (MILLONES DE USD)

TABLA 264 RESTAURANTES DEL SUDESTE DE ASIA EN EL MERCADO DE TARJETAS DE REGALO, POR PRODUCTO, 2021-2030 (MILLONES DE USD)

TABLA 265 TIENDAS DE DESCUENTO DEL SUDESTE DE ASIA EN EL MERCADO DE TARJETAS DE REGALO, POR PRODUCTO, 2021-2030 (MILLONES DE USD)

TABLA 266 CAFETERÍAS DEL SUDESTE DE ASIA EN EL MERCADO DE TARJETAS DE REGALO, POR PRODUCTO, 2021-2030 (MILLONES DE USD)

TABLA 267 TIENDAS DEPARTAMENTALES DEL SUDESTE DE ASIA EN EL MERCADO DE TARJETAS DE REGALO, POR PRODUCTO, 2021-2030 (MILLONES DE USD)

TABLA 268 TIENDAS DE COMESTIBLES Y SUPERMERCADOS DE ALIMENTOS DEL SUDESTE DE ASIA EN EL MERCADO DE TARJETAS DE REGALO, POR PRODUCTO, 2021-2030 (MILLONES DE USD)

TABLA 269 ENTRETENIMIENTO DEL SUDESTE DE ASIA EN EL MERCADO DE TARJETAS DE REGALO, POR PRODUCTO, 2021-2030 (MILLONES DE USD)

TABLA 270 OTROS SUDESTE DE ASIA EN EL MERCADO DE TARJETAS DE REGALO, POR PRODUCTO, 2021-2030 (MILLONES DE USD)

TABLA 271 MERCADO DE TARJETAS DE REGALO DE JAPÓN, POR PRODUCTO, 2021-2030 (MILLONES DE USD)

TABLA 272 MERCADO DE TARJETAS DE REGALO DE JAPÓN, POR ATRIBUTO FUNCIONAL, 2021-2030 (MILLONES DE USD)

TABLA 273 BUCLE CERRADO EN EL MERCADO DE TARJETAS DE REGALO EN JAPÓN, POR TIPO, 2021-2030 (MILLONES DE USD)

TABLA 274 MERCADO DE TARJETAS DE REGALO DE JAPÓN, POR VERTICAL DE LA INDUSTRIA, 2021-2030 (MILLONES DE USD)

TABLA 275 MERCADO DE TARJETAS DE REGALO DE JAPÓN, POR COMERCIANTE, 2021-2030 (MILLONES DE USD)

TABLA 276 RESTAURANTES DE JAPÓN EN EL MERCADO DE TARJETAS DE REGALO, POR PRODUCTO, 2021-2030 (MILLONES DE USD)

TABLA 277 TIENDAS DE DESCUENTO DE JAPÓN EN EL MERCADO DE TARJETAS DE REGALO, POR PRODUCTO, 2021-2030 (MILLONES DE USD)

TABLA 278 CAFETERÍAS DE JAPÓN EN EL MERCADO DE TARJETAS DE REGALO, POR PRODUCTO, 2021-2030 (MILLONES DE USD)

TABLA 279 TIENDAS DEPARTAMENTALES DE JAPÓN EN EL MERCADO DE TARJETAS DE REGALO, POR PRODUCTO, 2021-2030 (MILLONES DE USD)

TABLA 280 TIENDAS DE COMESTIBLES/SUPERMERCADOS DE ALIMENTOS EN EL MERCADO DE TARJETAS DE REGALO DE JAPÓN, POR PRODUCTO, 2021-2030 (MILLONES DE USD)

TABLA 281 ENTRETENIMIENTO JAPÓN EN EL MERCADO DE TARJETAS DE REGALO, POR PRODUCTO, 2021-2030 (MILLONES DE USD)

TABLA 282 JAPÓN OTROS EN EL MERCADO DE TARJETAS DE REGALO, POR PRODUCTO, 2021-2030 (MILLONES DE USD)

TABLA 283 MERCADO DE TARJETAS DE REGALO DE AUSTRALIA, POR PRODUCTO, 2021-2030 (MILLONES DE USD)

TABLA 284 MERCADO DE TARJETAS DE REGALO DE AUSTRALIA, POR ATRIBUTO FUNCIONAL, 2021-2030 (MILLONES DE USD)

TABLA 285 CICLO CERRADO DE AUSTRALIA EN EL MERCADO DE TARJETAS DE REGALO, POR TIPO, 2021-2030 (MILLONES DE USD)

TABLA 286 MERCADO DE TARJETAS DE REGALO DE AUSTRALIA, POR VERTICAL DE LA INDUSTRIA, 2021-2030 (MILLONES DE USD)

TABLA 287 MERCADO DE TARJETAS DE REGALO DE AUSTRALIA, POR COMERCIANTE, 2021-2030 (MILLONES DE USD)

TABLA 288 RESTAURANTES DE AUSTRALIA EN EL MERCADO DE TARJETAS DE REGALO, POR PRODUCTO, 2021-2030 (MILLONES DE USD)

TABLA 289 TIENDAS DE DESCUENTO DE AUSTRALIA EN EL MERCADO DE TARJETAS DE REGALO, POR PRODUCTO, 2021-2030 (MILLONES DE USD)

TABLA 290 CAFETERÍAS DE AUSTRALIA EN EL MERCADO DE TARJETAS DE REGALO, POR PRODUCTO, 2021-2030 (MILLONES DE USD)

TABLA 291 TIENDAS DEPARTAMENTALES DE AUSTRALIA EN EL MERCADO DE TARJETAS DE REGALO, POR PRODUCTO, 2021-2030 (MILLONES DE USD)

TABLA 292 TIENDAS DE COMESTIBLES/SUPERMERCADOS DE ALIMENTOS DE AUSTRALIA EN EL MERCADO DE TARJETAS DE REGALO, POR PRODUCTO, 2021-2030 (MILLONES DE USD)

TABLA 293 ENTRETENIMIENTO EN AUSTRALIA EN EL MERCADO DE TARJETAS DE REGALO, POR PRODUCTO, 2021-2030 (MILLONES DE USD)

TABLA 294 AUSTRALIA OTROS EN EL MERCADO DE TARJETAS DE REGALO, POR PRODUCTO, 2021-2030 (MILLONES DE USD)

TABLA 295 MERCADO DE TARJETAS DE REGALO DE NUEVA ZELANDA, POR PRODUCTO, 2021-2030 (MILLONES DE USD)

TABLA 296 MERCADO DE TARJETAS DE REGALO DE NUEVA ZELANDA, POR ATRIBUTO FUNCIONAL, 2021-2030 (MILLONES DE USD)

TABLA 297 BUCLE CERRADO DE NUEVA ZELANDA EN EL MERCADO DE TARJETAS DE REGALO, POR TIPO, 2021-2030 (MILLONES DE USD)

TABLA 298 MERCADO DE TARJETAS DE REGALO DE NUEVA ZELANDA, POR VERTICAL DE LA INDUSTRIA, 2021-2030 (MILLONES DE USD)

TABLA 299 MERCADO DE TARJETAS DE REGALO DE NUEVA ZELANDA, POR COMERCIANTE, 2021-2030 (MILLONES DE USD)

TABLA 300 RESTAURANTES DE NUEVA ZELANDA EN EL MERCADO DE TARJETAS DE REGALO, POR PRODUCTO, 2021-2030 (MILLONES DE USD)

TABLA 301 TIENDAS DE DESCUENTO DE NUEVA ZELANDA EN EL MERCADO DE TARJETAS DE REGALO, POR PRODUCTO, 2021-2030 (MILLONES DE USD)

TABLA 302 CAFETERÍAS DE NUEVA ZELANDA EN EL MERCADO DE TARJETAS DE REGALO, POR PRODUCTO, 2021-2030 (MILLONES DE USD)

TABLA 303 TIENDAS DEPARTAMENTALES DE NUEVA ZELANDA EN EL MERCADO DE TARJETAS DE REGALO, POR PRODUCTO, 2021-2030 (MILLONES DE USD)

TABLA 304 TIENDAS DE COMESTIBLES/SUPERMERCADOS DE ALIMENTOS DE NUEVA ZELANDA EN EL MERCADO DE TARJETAS DE REGALO, POR PRODUCTO, 2021-2030 (MILLONES DE USD)

TABLA 305 ENTRETENIMIENTO DE NUEVA ZELANDA EN EL MERCADO DE TARJETAS DE REGALO, POR PRODUCTO, 2021-2030 (MILLONES DE USD)

TABLA 306 OTROS DE NUEVA ZELANDA EN EL MERCADO DE TARJETAS DE REGALO, POR PRODUCTO, 2021-2030 (MILLONES DE USD)

TABLA 307 MERCADO DE TARJETAS DE REGALO DE COREA DEL SUR, POR PRODUCTO, 2021-2030 (MILLONES DE USD)

TABLA 308 MERCADO DE TARJETAS DE REGALO DE COREA DEL SUR, POR ATRIBUTO FUNCIONAL, 2021-2030 (MILLONES DE USD)

TABLA 309 CICLO CERRADO DE COREA DEL SUR EN EL MERCADO DE TARJETAS DE REGALO, POR TIPO, 2021-2030 (MILLONES DE USD)

TABLA 310 MERCADO DE TARJETAS DE REGALO DE COREA DEL SUR, POR VERTICAL DE INDUSTRIA, 2021-2030 (MILLONES DE USD)

TABLA 311 MERCADO DE TARJETAS DE REGALO DE COREA DEL SUR, POR COMERCIANTE, 2021-2030 (MILLONES DE USD)

TABLA 312 RESTAURANTES DE COREA DEL SUR EN EL MERCADO DE TARJETAS DE REGALO, POR PRODUCTO, 2021-2030 (MILLONES DE USD)

TABLA 313 TIENDAS DE DESCUENTO DE COREA DEL SUR EN EL MERCADO DE TARJETAS DE REGALO, POR PRODUCTO, 2021-2030 (MILLONES DE USD)

TABLA 314 CAFETERÍAS DE COREA DEL SUR EN EL MERCADO DE TARJETAS DE REGALO, POR PRODUCTO, 2021-2030 (MILLONES DE USD)

TABLA 315 TIENDAS DEPARTAMENTALES DE COREA DEL SUR EN EL MERCADO DE TARJETAS DE REGALO, POR PRODUCTO, 2021-2030 (MILLONES DE USD)

TABLA 316 TIENDAS DE COMESTIBLES/SUPERMERCADOS DE ALIMENTOS DE COREA DEL SUR EN EL MERCADO DE TARJETAS DE REGALO, POR PRODUCTO, 2021-2030 (MILLONES DE USD)

TABLA 317 ENTRETENIMIENTO EN COREA DEL SUR EN EL MERCADO DE TARJETAS DE REGALO, POR PRODUCTO, 2021-2030 (MILLONES DE USD)

TABLA 318 COREA DEL SUR OTROS EN EL MERCADO DE TARJETAS DE REGALO, POR PRODUCTO, 2021-2030 (MILLONES DE USD)

TABLA 319 RESTO DEL MERCADO DE TARJETAS DE REGALO DE ASIA Y EL PACÍFICO, POR PRODUCTO, 2021-2030 (MILLONES DE USD)

CUADRO 320 MERCADO DE TARJETAS DE REGALO DEL SUDESTE DE ASIA, POR PAÍS, 2021-2030 (MILLONES DE USD)

TABLA 321 MERCADO DE TARJETAS DE REGALO DEL SUDESTE DE ASIA, POR PRODUCTO, 2021-2030 (MILLONES DE USD)

CUADRO 322 MERCADO DE TARJETAS DE REGALO DEL SUDESTE DE ASIA, POR ATRIBUTO FUNCIONAL, 2021-2030 (MILLONES DE USD)

TABLA 323 BUCLE CERRADO DEL SUDESTE DE ASIA EN EL MERCADO DE TARJETAS DE REGALO, POR TIPO, 2021-2030 (MILLONES DE USD)

TABLA 324 MERCADO DE TARJETAS DE REGALO DEL SUDESTE DE ASIA, POR VERTICAL DE INDUSTRIA, 2021-2030 (MILLONES DE USD)

TABLA 325 MERCADO DE TARJETAS DE REGALO DEL SUDESTE DE ASIA, POR COMERCIANTE, 2021-2030 (MILLONES DE USD)

TABLA 326 RESTAURANTES DEL SUDESTE DE ASIA EN EL MERCADO DE TARJETAS DE REGALO, POR PRODUCTO, 2021-2030 (MILLONES DE USD)

TABLA 327 TIENDAS DE DESCUENTO DEL SUDESTE DE ASIA EN EL MERCADO DE TARJETAS DE REGALO, POR PRODUCTO, 2021-2030 (MILLONES DE USD)

TABLA 328 CAFETERÍAS DEL SUDESTE DE ASIA EN EL MERCADO DE TARJETAS DE REGALO, POR PRODUCTO, 2021-2030 (MILLONES DE USD)

TABLA 329 TIENDAS DEPARTAMENTALES DEL SUDESTE DE ASIA EN EL MERCADO DE TARJETAS DE REGALO, POR PRODUCTO, 2021-2030 (MILLONES DE USD)

TABLA 330 TIENDAS DE COMESTIBLES Y SUPERMERCADOS DE ALIMENTOS DEL SUDESTE DE ASIA EN EL MERCADO DE TARJETAS DE REGALO, POR PRODUCTO, 2021-2030 (MILLONES DE USD)

TABLA 331 ENTRETENIMIENTO DEL SUDESTE DE ASIA EN EL MERCADO DE TARJETAS DE REGALO, POR PRODUCTO, 2021-2030 (MILLONES DE USD)

TABLA 332 OTROS DEL SUDESTE DE ASIA EN EL MERCADO DE TARJETAS DE REGALO, POR PRODUCTO, 2021-2030 (MILLONES DE USD)

TABLA 333 MERCADO DE TARJETAS DE REGALO DE INDONESIA, POR PRODUCTO, 2021-2030 (MILLONES DE USD)

TABLA 334 MERCADO DE TARJETAS DE REGALO DE INDONESIA, POR ATRIBUTO FUNCIONAL, 2021-2030 (MILLONES DE USD)

TABLA 335 BUCLE CERRADO DE INDONESIA EN EL MERCADO DE TARJETAS DE REGALO, POR TIPO, 2021-2030 (MILLONES DE USD)

TABLA 336 MERCADO DE TARJETAS DE REGALO DE INDONESIA, POR VERTICAL DE LA INDUSTRIA, 2021-2030 (MILLONES DE USD)

TABLA 337 MERCADO DE TARJETAS DE REGALO DE INDONESIA, POR COMERCIANTE, 2021-2030 (MILLONES DE USD)

TABLA 338 RESTAURANTES DE INDONESIA EN EL MERCADO DE TARJETAS DE REGALO, POR PRODUCTO, 2021-2030 (MILLONES DE USD)

TABLA 339 TIENDAS DE DESCUENTO DE INDONESIA EN EL MERCADO DE TARJETAS DE REGALO, POR PRODUCTO, 2021-2030 (MILLONES DE USD)

TABLA 340 CAFETERÍAS DE INDONESIA EN EL MERCADO DE TARJETAS DE REGALO, POR PRODUCTO, 2021-2030 (MILLONES DE USD)

TABLA 341 TIENDAS DEPARTAMENTALES DE INDONESIA EN EL MERCADO DE TARJETAS DE REGALO, POR PRODUCTO, 2021-2030 (MILLONES DE USD)

TABLA 342 TIENDAS DE COMESTIBLES/SUPERMERCADOS DE ALIMENTOS DE INDONESIA EN EL MERCADO DE TARJETAS DE REGALO, POR PRODUCTO, 2021-2030 (MILLONES DE USD)

TABLA 343 ENTRETENIMIENTO DE INDONESIA EN EL MERCADO DE TARJETAS DE REGALO, POR PRODUCTO, 2021-2030 (MILLONES DE USD)

TABLA 344 INDONESIA OTROS EN EL MERCADO DE TARJETAS DE REGALO, POR PRODUCTO, 2021-2030 (MILLONES DE USD)

TABLA 345 MERCADO DE TARJETAS DE REGALO DE FILIPINAS, POR PRODUCTO, 2021-2030 (MILLONES DE USD)

TABLA 346 MERCADO DE TARJETAS DE REGALO DE FILIPINAS, POR ATRIBUTO FUNCIONAL, 2021-2030 (MILLONES DE USD)

TABLA 347 CICLO CERRADO DE FILIPINAS EN EL MERCADO DE TARJETAS DE REGALO, POR TIPO, 2021-2030 (MILLONES DE USD)

TABLA 348 MERCADO DE TARJETAS DE REGALO DE FILIPINAS, POR VERTICAL DE LA INDUSTRIA, 2021-2030 (MILLONES DE USD)

TABLA 349 MERCADO DE TARJETAS DE REGALO DE FILIPINAS, POR COMERCIANTE, 2021-2030 (MILLONES DE USD)

TABLA 350 RESTAURANTES DE FILIPINAS EN EL MERCADO DE TARJETAS DE REGALO, POR PRODUCTO, 2021-2030 (MILLONES DE USD)

TABLA 351 TIENDAS DE DESCUENTO DE FILIPINAS EN EL MERCADO DE TARJETAS DE REGALO, POR PRODUCTO, 2021-2030 (MILLONES DE USD)

TABLA 352 CAFETERÍAS DE FILIPINAS EN EL MERCADO DE TARJETAS DE REGALO, POR PRODUCTO, 2021-2030 (MILLONES DE USD)

TABLA 353 TIENDAS DEPARTAMENTALES DE FILIPINAS EN EL MERCADO DE TARJETAS DE REGALO, POR PRODUCTO, 2021-2030 (MILLONES DE USD)

TABLA 354 TIENDAS DE COMESTIBLES/SUPERMERCADOS DE ALIMENTOS EN EL MERCADO DE TARJETAS DE REGALO DE FILIPINAS, POR PRODUCTO, 2021-2030 (MILLONES DE USD)

TABLA 355 ENTRETENIMIENTO EN FILIPINAS EN EL MERCADO DE TARJETAS DE REGALO, POR PRODUCTO, 2021-2030 (MILLONES DE USD)

TABLA 356 FILIPINAS OTROS EN EL MERCADO DE TARJETAS DE REGALO, POR PRODUCTO, 2021-2030 (MILLONES DE USD)

TABLA 357 MERCADO DE TARJETAS DE REGALO DE TAILANDIA, POR PRODUCTO, 2021-2030 (MILLONES DE USD)

TABLA 358 MERCADO DE TARJETAS DE REGALO DE TAILANDIA, POR ATRIBUTO FUNCIONAL, 2021-2030 (MILLONES DE USD)

TABLA 359 BUCLE CERRADO DE TAILANDIA EN EL MERCADO DE TARJETAS DE REGALO, POR TIPO, 2021-2030 (MILLONES DE USD)

TABLA 360 MERCADO DE TARJETAS DE REGALO DE TAILANDIA, POR VERTICAL DE LA INDUSTRIA, 2021-2030 (MILLONES DE USD)

TABLA 361 MERCADO DE TARJETAS DE REGALO DE TAILANDIA, POR COMERCIANTE, 2021-2030 (MILLONES DE USD)

TABLA 362 RESTAURANTES DE TAILANDIA EN EL MERCADO DE TARJETAS DE REGALO, POR PRODUCTO, 2021-2030 (MILLONES DE USD)

TABLA 363 TIENDAS DE DESCUENTO DE TAILANDIA EN EL MERCADO DE TARJETAS DE REGALO, POR PRODUCTO, 2021-2030 (MILLONES DE USD)

TABLA 364 CAFETERÍAS DE TAILANDIA EN EL MERCADO DE TARJETAS DE REGALO, POR PRODUCTO, 2021-2030 (MILLONES DE USD)

TABLA 365 TIENDAS DEPARTAMENTALES DE TAILANDIA EN EL MERCADO DE TARJETAS DE REGALO, POR PRODUCTO, 2021-2030 (MILLONES DE USD)

TABLA 366 TIENDAS DE COMESTIBLES/SUPERMERCADOS DE ALIMENTOS DE TAILANDIA EN EL MERCADO DE TARJETAS DE REGALO, POR PRODUCTO, 2021-2030 (MILLONES DE USD)

TABLA 367 ENTRETENIMIENTO EN TAILANDIA EN EL MERCADO DE TARJETAS DE REGALO, POR PRODUCTO, 2021-2030 (MILLONES DE USD)

TABLA 368 TAILANDIA OTROS EN EL MERCADO DE TARJETAS DE REGALO, POR PRODUCTO, 2021-2030 (MILLONES DE USD)

TABLA 369 MERCADO DE TARJETAS DE REGALO DE VIETNAM, POR PRODUCTO, 2021-2030 (MILLONES DE USD)

CUADRO 370 MERCADO DE TARJETAS DE REGALO DE VIETNAM, POR ATRIBUTO FUNCIONAL, 2021-2030 (MILLONES DE USD)

TABLA 371 BUCLE CERRADO DE VIETNAM EN EL MERCADO DE TARJETAS DE REGALO, POR TIPO, 2021-2030 (MILLONES DE USD)

CUADRO 372 MERCADO DE TARJETAS DE REGALO DE VIETNAM, POR VERTICAL DE INDUSTRIA, 2021-2030 (MILLONES DE USD)

TABLA 373 MERCADO DE TARJETAS DE REGALO DE VIETNAM, POR COMERCIANTE, 2021-2030 (MILLONES DE USD)

TABLA 374 RESTAURANTES DE VIETNAM EN EL MERCADO DE TARJETAS DE REGALO, POR PRODUCTO, 2021-2030 (MILLONES DE USD)

TABLA 375 TIENDAS DE DESCUENTO DE VIETNAM EN EL MERCADO DE TARJETAS DE REGALO, POR PRODUCTO, 2021-2030 (MILLONES DE USD)

TABLA 376 CAFETERÍAS DE VIETNAM EN EL MERCADO DE TARJETAS DE REGALO, POR PRODUCTO, 2021-2030 (MILLONES DE USD)

TABLA 377 TIENDAS DEPARTAMENTALES DE VIETNAM EN EL MERCADO DE TARJETAS DE REGALO, POR PRODUCTO, 2021-2030 (MILLONES DE USD)

TABLA 378 TIENDAS DE COMESTIBLES/SUPERMERCADOS DE ALIMENTOS DE VIETNAM EN EL MERCADO DE TARJETAS DE REGALO, POR PRODUCTO, 2021-2030 (MILLONES DE USD)

TABLA 379 ENTRETENIMIENTO EN VIETNAM EN EL MERCADO DE TARJETAS DE REGALO, POR PRODUCTO, 2021-2030 (MILLONES DE USD)

TABLA 380 VIETNAM OTROS EN EL MERCADO DE TARJETAS DE REGALO, POR PRODUCTO, 2021-2030 (MILLONES DE USD)

TABLA 381 MERCADO DE TARJETAS DE REGALO DE MALASIA, POR PRODUCTO, 2021-2030 (MILLONES DE USD)

TABLA 382 MERCADO DE TARJETAS DE REGALO DE MALASIA, POR ATRIBUTO FUNCIONAL, 2021-2030 (MILLONES DE USD)

TABLA 383 BUCLE CERRADO DE MALASIA EN EL MERCADO DE TARJETAS DE REGALO, POR TIPO, 2021-2030 (MILLONES DE USD)

TABLA 384 MERCADO DE TARJETAS DE REGALO DE MALASIA, POR VERTICAL DE INDUSTRIA, 2021-2030 (MILLONES DE USD)

TABLA 385 MERCADO DE TARJETAS DE REGALO DE MALASIA, POR COMERCIANTE, 2021-2030 (MILLONES DE USD)

TABLA 386 RESTAURANTES DE MALASIA EN EL MERCADO DE TARJETAS DE REGALO, POR PRODUCTO, 2021-2030 (MILLONES DE USD)

TABLA 387 TIENDAS DE DESCUENTO DE MALASIA EN EL MERCADO DE TARJETAS DE REGALO, POR PRODUCTO, 2021-2030 (MILLONES DE USD)

TABLA 388 CAFETERÍAS DE MALASIA EN EL MERCADO DE TARJETAS DE REGALO, POR PRODUCTO, 2021-2030 (MILLONES DE USD)

TABLA 389 TIENDAS DEPARTAMENTALES DE MALASIA EN EL MERCADO DE TARJETAS DE REGALO, POR PRODUCTO, 2021-2030 (MILLONES DE USD)

TABLA 390 SUPERMERCADOS DE COMESTIBLES/SUPERMERCADOS DE ALIMENTOS DE MALASIA EN EL MERCADO DE TARJETAS DE REGALO, POR PRODUCTO, 2021-2030 (MILLONES DE USD)

TABLA 391 ENTRETENIMIENTO DE MALASIA EN EL MERCADO DE TARJETAS DE REGALO, POR PRODUCTO, 2021-2030 (MILLONES DE USD)

TABLA 392 MALASIA OTROS EN EL MERCADO DE TARJETAS DE REGALO, POR PRODUCTO, 2021-2030 (MILLONES DE USD)

TABLA 393 MERCADO DE TARJETAS DE REGALO DE SINGAPUR, POR PRODUCTO, 2021-2030 (MILLONES DE USD)

TABLA 394 MERCADO DE TARJETAS DE REGALO DE SINGAPUR, POR ATRIBUTO FUNCIONAL, 2021-2030 (MILLONES DE USD)

TABLA 395 CICLO CERRADO DE SINGAPUR EN EL MERCADO DE TARJETAS DE REGALO, POR TIPO, 2021-2030 (MILLONES DE USD)

TABLA 396 MERCADO DE TARJETAS DE REGALO DE SINGAPUR, POR VERTICAL DE LA INDUSTRIA, 2021-2030 (MILLONES DE USD)

TABLA 397 MERCADO DE TARJETAS DE REGALO DE SINGAPUR, POR COMERCIANTE, 2021-2030 (MILLONES DE USD)

TABLA 398 RESTAURANTES DE SINGAPUR EN EL MERCADO DE TARJETAS DE REGALO, POR PRODUCTO, 2021-2030 (MILLONES DE USD)

TABLA 399 TIENDAS DE DESCUENTO DE SINGAPUR EN EL MERCADO DE TARJETAS DE REGALO, POR PRODUCTO, 2021-2030 (MILLONES DE USD)

TABLA 400 CAFETERÍAS DE SINGAPUR EN EL MERCADO DE TARJETAS DE REGALO, POR PRODUCTO, 2021-2030 (MILLONES DE USD)

TABLA 401 TIENDAS DEPARTAMENTALES DE SINGAPUR EN EL MERCADO DE TARJETAS DE REGALO, POR PRODUCTO, 2021-2030 (MILLONES DE USD)

TABLA 402 TIENDAS DE COMESTIBLES/SUPERMERCADOS DE ALIMENTOS DE SINGAPUR EN EL MERCADO DE TARJETAS DE REGALO, POR PRODUCTO, 2021-2030 (MILLONES DE USD)

TABLA 403 ENTRETENIMIENTO DE SINGAPUR EN EL MERCADO DE TARJETAS DE REGALO, POR PRODUCTO, 2021-2030 (MILLONES DE USD)

TABLA 404 SINGAPUR OTROS EN EL MERCADO DE TARJETAS DE REGALO, POR PRODUCTO, 2021-2030 (MILLONES DE USD)

TABLA 405 MERCADO DE TARJETAS DE REGALO DE CAMBOYA, POR PRODUCTO, 2021-2030 (MILLONES DE USD)

TABLA 406 MERCADO DE TARJETAS DE REGALO DE CAMBOYA, POR ATRIBUTO FUNCIONAL, 2021-2030 (MILLONES DE USD)

TABLA 407 CICLO CERRADO DE CAMBOYA EN EL MERCADO DE TARJETAS DE REGALO, POR TIPO, 2021-2030 (MILLONES DE USD)

TABLA 408 MERCADO DE TARJETAS DE REGALO EN CAMBOYA, POR VERTICAL DE LA INDUSTRIA, 2021-2030 (MILLONES DE USD)

TABLA 409 MERCADO DE TARJETAS DE REGALO DE CAMBOYA, POR COMERCIANTE, 2021-2030 (MILLONES DE USD)

TABLA 410 RESTAURANTES DE CAMBOYA EN EL MERCADO DE TARJETAS DE REGALO, POR PRODUCTO, 2021-2030 (MILLONES DE USD)

TABLA 411 TIENDAS DE DESCUENTO EN CAMBOYA EN EL MERCADO DE TARJETAS DE REGALO, POR PRODUCTO, 2021-2030 (MILLONES DE USD)

TABLA 412 CAFETERÍAS DE CAMBOYA EN EL MERCADO DE TARJETAS DE REGALO, POR PRODUCTO, 2021-2030 (MILLONES DE USD)

TABLA 413 TIENDAS DEPARTAMENTALES DE CAMBOYA EN EL MERCADO DE TARJETAS DE REGALO, POR PRODUCTO, 2021-2030 (MILLONES DE USD)

TABLA 414 CAMBOYA TIENDAS DE COMESTIBLES/SUPERMERCADOS DE ALIMENTOS EN EL MERCADO DE TARJETAS DE REGALO, POR PRODUCTO, 2021-2030 (MILLONES DE USD)

TABLA 415 ENTRETENIMIENTO EN CAMBOYA EN EL MERCADO DE TARJETAS DE REGALO, POR PRODUCTO, 2021-2030 (MILLONES DE USD)

TABLA 416 CAMBOYA OTROS EN EL MERCADO DE TARJETAS DE REGALO, POR PRODUCTO, 2021-2030 (MILLONES DE USD)

TABLA 417 MERCADO DE TARJETAS DE REGALO DE MYANMAR, POR PRODUCTO, 2021-2030 (MILLONES DE USD)

TABLA 418 MERCADO DE TARJETAS REGALO DE MYANMAR, POR ATRIBUTO FUNCIONAL, 2021-2030 (MILLONES DE USD)

TABLA 419 BUCLE CERRADO DE MYANMAR EN EL MERCADO DE TARJETAS DE REGALO, POR TIPO, 2021-2030 (MILLONES DE USD)

TABLA 420 MERCADO DE TARJETAS DE REGALO DE MYANMAR, POR VERTICAL DE LA INDUSTRIA, 2021-2030 (MILLONES DE USD)

TABLA 421 MERCADO DE TARJETAS DE REGALO DE MYANMAR, POR COMERCIANTE, 2021-2030 (MILLONES DE USD)

TABLA 422 RESTAURANTES DE MYANMAR EN EL MERCADO DE TARJETAS DE REGALO, POR PRODUCTO, 2021-2030 (MILLONES DE USD)

TABLA 423 TIENDAS DE DESCUENTO DE MYANMAR EN EL MERCADO DE TARJETAS DE REGALO, POR PRODUCTO, 2021-2030 (MILLONES DE USD)

TABLA 424 CAFETERÍAS DE MYANMAR EN EL MERCADO DE TARJETAS DE REGALO, POR PRODUCTO, 2021-2030 (MILLONES DE USD)

TABLA 425 TIENDAS DEPARTAMENTALES DE MYANMAR EN EL MERCADO DE TARJETAS DE REGALO, POR PRODUCTO, 2021-2030 (MILLONES DE USD)

TABLA 426 SUPERMERCADOS/SUPERMERCADOS DE ALIMENTOS DE MYANMAR EN EL MERCADO DE TARJETAS DE REGALO, POR PRODUCTO, 2021-2030 (MILLONES DE USD)

TABLA 427 ENTRETENIMIENTO DE MYANMAR EN EL MERCADO DE TARJETAS DE REGALO, POR PRODUCTO, 2021-2030 (MILLONES DE USD)

TABLA 428 MYANMAR OTROS EN EL MERCADO DE TARJETAS DE REGALO, POR PRODUCTO, 2021-2030 (MILLONES DE USD)

TABLA 429 MERCADO DE TARJETAS DE REGALO DEL RESTO DEL SUDESTE DE ASIA, POR PRODUCTO, 2021-2030 (MILLONES DE USD)

TABLA 430 MERCADO DE TARJETAS DE REGALO DE AMÉRICA DEL SUR, POR PAÍS, 2021-2030 (MILLONES DE USD)

TABLA 431 MERCADO DE TARJETAS DE REGALO DE AMÉRICA DEL SUR, POR PRODUCTO, 2021-2030 (MILLONES DE USD)

TABLA 432 MERCADO DE TARJETAS DE REGALO DE AMÉRICA DEL SUR, POR ATRIBUTO FUNCIONAL, 2021-2030 (MILLONES DE USD)

TABLA 433 CICLO CERRADO DE AMÉRICA DEL SUR EN EL MERCADO DE TARJETAS DE REGALO, POR TIPO, 2021-2030 (MILLONES DE USD)

TABLA 434 MERCADO DE TARJETAS DE REGALO DE AMÉRICA DEL SUR, POR VERTICAL DE INDUSTRIA, 2021-2030 (MILLONES DE USD)

TABLA 435 MERCADO DE TARJETAS DE REGALO DE AMÉRICA DEL SUR, POR COMERCIANTE, 2021-2030 (MILLONES DE USD)

TABLA 436 RESTAURANTES DE SUDAMÉRICA EN EL MERCADO DE TARJETAS DE REGALO, POR PRODUCTO, 2021-2030 (MILLONES DE USD)

TABLA 437 TIENDAS DE DESCUENTO DE SUDAMÉRICA EN EL MERCADO DE TARJETAS DE REGALO, POR PRODUCTO, 2021-2030 (MILLONES DE USD)

TABLA 438 CAFÉS DE AMÉRICA DEL SUR EN EL MERCADO DE TARJETAS DE REGALO, POR PRODUCTO, 2021-2030 (MILLONES DE USD)

TABLA 439 TIENDAS DEPARTAMENTALES DE SUDAMÉRICA EN EL MERCADO DE TARJETAS DE REGALO, POR PRODUCTO, 2021-2030 (MILLONES DE USD)

TABLA 440 SUPERMERCADOS/SUPERMERCADOS DE ALIMENTOS DE AMÉRICA DEL SUR EN EL MERCADO DE TARJETAS DE REGALO, POR PRODUCTO, 2021-2030 (MILLONES DE USD)

TABLA 441 ENTRETENIMIENTO EN AMÉRICA DEL SUR EN EL MERCADO DE TARJETAS DE REGALO, POR PRODUCTO, 2021-2030 (MILLONES DE USD)

TABLA 442 OTROS AMÉRICA DEL SUR EN EL MERCADO DE TARJETAS DE REGALO, POR PRODUCTO, 2021-2030 (MILLONES DE USD)

TABLA 443 MERCADO DE TARJETAS DE REGALO DE BRASIL, POR PRODUCTO, 2021-2030 (MILLONES DE USD)

TABLA 444 MERCADO DE TARJETAS DE REGALO DE BRASIL, POR ATRIBUTO FUNCIONAL, 2021-2030 (MILLONES DE USD)

TABLA 445 BUCLE CERRADO DE BRASIL EN EL MERCADO DE TARJETAS DE REGALO, POR TIPO, 2021-2030 (MILLONES DE USD)

TABLA 446 MERCADO DE TARJETAS DE REGALO DE BRASIL, POR VERTICAL DE INDUSTRIA, 2021-2030 (MILLONES DE USD)

TABLA 447 MERCADO DE TARJETAS DE REGALO DE BRASIL, POR COMERCIANTE, 2021-2030 (MILLONES DE USD)

TABLA 448 RESTAURANTES DE BRASIL EN EL MERCADO DE TARJETAS DE REGALO, POR PRODUCTO, 2021-2030 (MILLONES DE USD)

TABLA 449 TIENDAS DE DESCUENTO EN BRASIL EN EL MERCADO DE TARJETAS DE REGALO, POR PRODUCTO, 2021-2030 (MILLONES DE USD)

TABLA 450 CAFETERÍAS DE BRASIL EN EL MERCADO DE TARJETAS DE REGALO, POR PRODUCTO, 2021-2030 (MILLONES DE USD)

TABLA 451 TIENDAS DEPARTAMENTALES DE BRASIL EN EL MERCADO DE TARJETAS DE REGALO, POR PRODUCTO, 2021-2030 (MILLONES DE USD)

TABLA 452 TIENDAS DE COMESTIBLES/SUPERMERCADOS DE ALIMENTOS EN EL MERCADO DE TARJETAS DE REGALO DE BRASIL, POR PRODUCTO, 2021-2030 (MILLONES DE USD)

TABLA 453 ENTRETENIMIENTO EN BRASIL EN EL MERCADO DE TARJETAS DE REGALO, POR PRODUCTO, 2021-2030 (MILLONES DE USD)

TABLA 454 BRASIL OTROS EN EL MERCADO DE TARJETAS DE REGALO, POR PRODUCTO, 2021-2030 (MILLONES DE USD)

TABLA 455 MERCADO DE TARJETAS DE REGALO DE ARGENTINA, POR PRODUCTO, 2021-2030 (MILLONES DE USD)

CUADRO 456 MERCADO DE TARJETAS REGALO ARGENTINA, POR ATRIBUTO FUNCIONAL, 2021-2030 (MILLONES DE USD)

TABLA 457 BUCLE CERRADO DE ARGENTINA EN EL MERCADO DE TARJETAS DE REGALO, POR TIPO, 2021-2030 (MILLONES DE USD)

TABLA 458 MERCADO DE TARJETAS DE REGALO DE ARGENTINA, POR VERTICAL DE INDUSTRIA, 2021-2030 (MILLONES DE USD)

TABLA 459 MERCADO DE TARJETAS DE REGALO DE ARGENTINA, POR COMERCIANTE, 2021-2030 (MILLONES DE USD)

TABLA 460 RESTAURANTES DE ARGENTINA EN EL MERCADO DE GIFT CARD, POR PRODUCTO, 2021-2030 (USD MILLONES)

TABLA 461 TIENDAS DE DESCUENTO DE ARGENTINA EN EL MERCADO DE TARJETAS DE REGALO, POR PRODUCTO, 2021-2030 (MILLONES DE USD)

TABLA 462 CAFETERÍAS DE ARGENTINA EN EL MERCADO DE TARJETAS DE REGALO, POR PRODUCTO, 2021-2030 (MILLONES DE USD)

TABLA 463 TIENDAS DEPARTAMENTALES DE ARGENTINA EN EL MERCADO DE TARJETAS DE REGALO, POR PRODUCTO, 2021-2030 (MILLONES DE USD)

TABLA 464 SUPERMERCADOS/SUPERMERCADOS DE ALIMENTOS EN EL MERCADO DE TARJETAS DE REGALO DE ARGENTINA, POR PRODUCTO, 2021-2030 (MILLONES DE USD)

TABLA 465 ENTRETENIMIENTO ARGENTINO EN EL MERCADO DE TARJETAS DE REGALO, POR PRODUCTO, 2021-2030 (MILLONES DE USD)

CUADRO 466 ARGENTINA OTROS EN EL MERCADO DE TARJETAS DE REGALO, POR PRODUCTO, 2021-2030 (MILLONES DE USD)

TABLA 467 MERCADO DE TARJETAS DE REGALO DEL RESTO DE SUDAMÉRICA, POR PRODUCTO, 2021-2030 (MILLONES DE USD)

TABLA 468 MERCADO DE TARJETAS DE REGALO DE ORIENTE MEDIO Y ÁFRICA, POR PAÍS, 2021-2030 (MILLONES DE USD)

TABLA 469 MERCADO DE TARJETAS DE REGALO DE ORIENTE MEDIO Y ÁFRICA, POR PRODUCTO, 2021-2030 (MILLONES DE USD)

TABLA 470 MERCADO DE TARJETAS DE REGALO DE ORIENTE MEDIO Y ÁFRICA, POR ATRIBUTO FUNCIONAL, 2021-2030 (MILLONES DE USD)

TABLA 471 CICLO CERRADO DE ORIENTE MEDIO Y ÁFRICA EN EL MERCADO DE TARJETAS DE REGALO, POR TIPO, 2021-2030 (MILLONES DE USD)

TABLA 472 MERCADO DE TARJETAS DE REGALO DE ORIENTE MEDIO Y ÁFRICA, POR VERTICAL DE INDUSTRIA, 2021-2030 (MILLONES DE USD)

TABLA 473 MERCADO DE TARJETAS DE REGALO DE ORIENTE MEDIO Y ÁFRICA, POR COMERCIANTE, 2021-2030 (MILLONES DE USD)

TABLA 474 RESTAURANTES DE ORIENTE MEDIO Y ÁFRICA EN EL MERCADO DE TARJETAS DE REGALO, POR PRODUCTO, 2021-2030 (MILLONES DE USD)

TABLA 475 TIENDAS DE DESCUENTO DE ORIENTE MEDIO Y ÁFRICA EN EL MERCADO DE TARJETAS DE REGALO, POR PRODUCTO, 2021-2030 (MILLONES DE USD)

TABLA 476 CAFETERÍAS DE ORIENTE MEDIO Y ÁFRICA EN EL MERCADO DE TARJETAS DE REGALO, POR PRODUCTO, 2021-2030 (MILLONES DE USD)

TABLA 477 TIENDAS DEPARTAMENTALES DE ORIENTE MEDIO Y ÁFRICA EN EL MERCADO DE TARJETAS DE REGALO, POR PRODUCTO, 2021-2030 (MILLONES DE USD)

TABLA 478 ORIENTE MEDIO Y ÁFRICA TIENDAS DE COMESTIBLES/SUPERMERCADOS DE ALIMENTOS EN EL MERCADO DE TARJETAS DE REGALO, POR PRODUCTO, 2021-2030 (MILLONES DE USD)

TABLA 479 ENTRETENIMIENTO EN ORIENTE MEDIO Y ÁFRICA EN EL MERCADO DE TARJETAS DE REGALO, POR PRODUCTO, 2021-2030 (MILLONES DE USD)

TABLA 480 ORIENTE MEDIO Y ÁFRICA OTROS EN EL MERCADO DE TARJETAS DE REGALO, POR PRODUCTO, 2021-2030 (MILLONES DE USD)

TABLA 481 MERCADO DE TARJETAS DE REGALO DE ARABIA SAUDITA, POR PRODUCTO, 2021-2030 (MILLONES DE USD)

TABLA 482 MERCADO DE TARJETAS DE REGALO DE ARABIA SAUDITA, POR ATRIBUTO FUNCIONAL, 2021-2030 (MILLONES DE USD)

TABLA 483 BUCLE CERRADO DE ARABIA SAUDITA EN EL MERCADO DE TARJETAS DE REGALO, POR TIPO, 2021-2030 (MILLONES DE USD)

TABLA 484 MERCADO DE TARJETAS DE REGALO DE ARABIA SAUDITA, POR VERTICAL DE INDUSTRIA, 2021-2030 (MILLONES DE USD)

TABLA 485 MERCADO DE TARJETAS DE REGALO DE ARABIA SAUDITA, POR COMERCIANTE, 2021-2030 (MILLONES DE USD)

TABLA 486 RESTAURANTES DE ARABIA SAUDITA EN EL MERCADO DE TARJETAS DE REGALO, POR PRODUCTO, 2021-2030 (MILLONES DE USD)

TABLA 487 TIENDAS DE DESCUENTO DE ARABIA SAUDITA EN EL MERCADO DE TARJETAS DE REGALO, POR PRODUCTO, 2021-2030 (MILLONES DE USD)

TABLA 488 CAFETERÍAS DE ARABIA SAUDITA EN EL MERCADO DE TARJETAS DE REGALO, POR PRODUCTO, 2021-2030 (MILLONES DE USD)

TABLA 489 TIENDAS DEPARTAMENTALES DE ARABIA SAUDITA EN EL MERCADO DE TARJETAS DE REGALO, POR PRODUCTO, 2021-2030 (MILLONES DE USD)

TABLA 490 SUPERMERCADOS/SUPERMERCADOS DE ALIMENTOS DE ARABIA SAUDITA EN EL MERCADO DE TARJETAS DE REGALO, POR PRODUCTO, 2021-2030 (MILLONES DE USD)

TABLA 491 ENTRETENIMIENTO DE ARABIA SAUDITA EN EL MERCADO DE TARJETAS DE REGALO, POR PRODUCTO, 2021-2030 (MILLONES DE USD)

TABLA 492 ARABIA SAUDITA OTROS EN EL MERCADO DE TARJETAS DE REGALO, POR PRODUCTO, 2021-2030 (MILLONES DE USD)

TABLA 493 MERCADO DE TARJETAS DE REGALO DE IRÁN, POR PRODUCTO, 2021-2030 (MILLONES DE USD)

TABLA 494 MERCADO DE TARJETAS DE REGALO DE IRÁN, POR ATRIBUTO FUNCIONAL, 2021-2030 (MILLONES DE USD)

TABLA 495 BUCLE CERRADO DE IRÁN EN EL MERCADO DE TARJETAS DE REGALO, POR TIPO, 2021-2030 (MILLONES DE USD)

TABLA 496 MERCADO DE TARJETAS DE REGALO DE IRÁN, POR VERTICAL DE LA INDUSTRIA, 2021-2030 (MILLONES DE USD)

TABLA 497 MERCADO DE TARJETAS DE REGALO DE IRÁN, POR COMERCIANTE, 2021-2030 (MILLONES DE USD)

TABLA 498 RESTAURANTES DE IRÁN EN EL MERCADO DE TARJETAS DE REGALO, POR PRODUCTO, 2021-2030 (MILLONES DE USD)

TABLA 499 TIENDAS DE DESCUENTO DE IRÁN EN EL MERCADO DE TARJETAS DE REGALO, POR PRODUCTO, 2021-2030 (MILLONES DE USD)

TABLA 500 CAFETERÍAS DE IRÁN EN EL MERCADO DE TARJETAS DE REGALO, POR PRODUCTO, 2021-2030 (MILLONES DE USD)

TABLA 501 TIENDAS DEPARTAMENTALES DE IRÁN EN EL MERCADO DE TARJETAS DE REGALO, POR PRODUCTO, 2021-2030 (MILLONES DE USD)

TABLA 502 TIENDAS DE COMESTIBLES/SUPERMERCADOS DE ALIMENTOS EN EL MERCADO DE TARJETAS DE REGALO DE IRÁN, POR PRODUCTO, 2021-2030 (MILLONES DE USD)

TABLA 503 ENTRETENIMIENTO EN IRÁN EN EL MERCADO DE TARJETAS DE REGALO, POR PRODUCTO, 2021-2030 (MILLONES DE USD)

TABLA 504 IRÁN OTROS EN EL MERCADO DE TARJETAS DE REGALO, POR PRODUCTO, 2021-2030 (MILLONES DE USD)

TABLA 505 MERCADO DE TARJETAS DE REGALO DE EGIPTO, POR PRODUCTO, 2021-2030 (MILLONES DE USD)

TABLA 506 MERCADO DE TARJETAS DE REGALO DE EGIPTO, POR ATRIBUTO FUNCIONAL, 2021-2030 (MILLONES DE USD)

TABLA 507 BUCLE CERRADO DE EGIPTO EN EL MERCADO DE TARJETAS DE REGALO, POR TIPO, 2021-2030 (MILLONES DE USD)

TABLA 508 MERCADO DE TARJETAS DE REGALO DE EGIPTO, POR VERTICAL DE LA INDUSTRIA, 2021-2030 (MILLONES DE USD)

TABLA 509 MERCADO DE TARJETAS DE REGALO DE EGIPTO, POR COMERCIANTE, 2021-2030 (MILLONES DE USD)

TABLA 510 RESTAURANTES DE EGIPTO EN EL MERCADO DE TARJETAS DE REGALO, POR PRODUCTO, 2021-2030 (MILLONES DE USD)

TABLA 511 TIENDAS DE DESCUENTO DE EGIPTO EN EL MERCADO DE TARJETAS DE REGALO, POR PRODUCTO, 2021-2030 (MILLONES DE USD)

TABLA 512 CAFETERÍAS DE EGIPTO EN EL MERCADO DE TARJETAS DE REGALO, POR PRODUCTO, 2021-2030 (MILLONES DE USD)

TABLA 513 TIENDAS DEPARTAMENTALES DE EGIPTO EN EL MERCADO DE TARJETAS DE REGALO, POR PRODUCTO, 2021-2030 (MILLONES DE USD)

TABLA 514 TIENDAS DE COMESTIBLES/SUPERMERCADOS DE ALIMENTOS DE EGIPTO EN EL MERCADO DE TARJETAS DE REGALO, POR PRODUCTO, 2021-2030 (MILLONES DE USD)

TABLA 515 ENTRETENIMIENTO EN EGIPTO EN EL MERCADO DE TARJETAS DE REGALO, POR PRODUCTO, 2021-2030 (MILLONES DE USD)

TABLA 516 EGIPTO OTROS EN EL MERCADO DE TARJETAS DE REGALO, POR PRODUCTO, 2021-2030 (MILLONES DE USD)

TABLA 517 MERCADO DE TARJETAS DE REGALO DE SUDÁFRICA, POR PRODUCTO, 2021-2030 (MILLONES DE USD)

TABLA 518 MERCADO DE TARJETAS DE REGALO DE SUDÁFRICA, POR ATRIBUTO FUNCIONAL, 2021-2030 (MILLONES DE USD)

TABLA 519 BUCLE CERRADO DE SUDÁFRICA EN EL MERCADO DE TARJETAS DE REGALO, POR TIPO, 2021-2030 (MILLONES DE USD)

TABLA 520 MERCADO DE TARJETAS DE REGALO DE SUDÁFRICA, POR VERTICAL DE INDUSTRIA, 2021-2030 (MILLONES DE USD)

TABLA 521 MERCADO DE TARJETAS DE REGALO DE SUDÁFRICA, POR COMERCIANTE, 2021-2030 (MILLONES DE USD)

TABLA 522 RESTAURANTES DE SUDÁFRICA EN EL MERCADO DE TARJETAS DE REGALO, POR PRODUCTO, 2021-2030 (MILLONES DE USD)

TABLA 523 TIENDAS DE DESCUENTO DE SUDÁFRICA EN EL MERCADO DE TARJETAS DE REGALO, POR PRODUCTO, 2021-2030 (MILLONES DE USD)

TABLA 524 CAFETERÍAS DE SUDÁFRICA EN EL MERCADO DE TARJETAS DE REGALO, POR PRODUCTO, 2021-2030 (MILLONES DE USD)

TABLA 525 TIENDAS DEPARTAMENTALES DE SUDÁFRICA EN EL MERCADO DE TARJETAS DE REGALO, POR PRODUCTO, 2021-2030 (MILLONES DE USD)

TABLA 526 TIENDAS DE COMESTIBLES/SUPERMERCADOS DE ALIMENTOS DE SUDÁFRICA EN EL MERCADO DE TARJETAS DE REGALO, POR PRODUCTO, 2021-2030 (MILLONES DE USD)

TABLA 527 ENTRETENIMIENTO EN SUDÁFRICA EN EL MERCADO DE TARJETAS DE REGALO, POR PRODUCTO, 2021-2030 (MILLONES DE USD)

TABLA 528 SUDÁFRICA OTROS EN EL MERCADO DE TARJETAS DE REGALO, POR PRODUCTO, 2021-2030 (MILLONES DE USD)

TABLA 529 MERCADO DE TARJETAS DE REGALO DE LOS EAU, POR PRODUCTO, 2021-2030 (MILLONES DE USD)

TABLA 530 MERCADO DE TARJETAS DE REGALO DE LOS EAU, POR ATRIBUTO FUNCIONAL, 2021-2030 (MILLONES DE USD)

TABLA 531 BUCLE CERRADO DE LOS EAU EN EL MERCADO DE TARJETAS DE REGALO, POR TIPO, 2021-2030 (MILLONES DE USD)

TABLA 532 MERCADO DE TARJETAS DE REGALO DE LOS EAU, POR VERTICAL DE LA INDUSTRIA, 2021-2030 (MILLONES DE USD)

TABLA 533 MERCADO DE TARJETAS DE REGALO DE LOS EAU, POR COMERCIANTE, 2021-2030 (MILLONES DE USD)

TABLA 534 RESTAURANTES DE LOS EAU EN EL MERCADO DE TARJETAS DE REGALO, POR PRODUCTO, 2021-2030 (MILLONES DE USD)

TABLA 535 TIENDAS DE DESCUENTO DE LOS EAU EN EL MERCADO DE TARJETAS DE REGALO, POR PRODUCTO, 2021-2030 (MILLONES DE USD)

TABLA 536 CAFETERÍAS DE LOS EAU EN EL MERCADO DE TARJETAS DE REGALO, POR PRODUCTO, 2021-2030 (MILLONES DE USD)

TABLA 537 TIENDAS DEPARTAMENTALES DE LOS EAU EN EL MERCADO DE TARJETAS DE REGALO, POR PRODUCTO, 2021-2030 (MILLONES DE USD)

TABLA 538 TIENDAS DE COMESTIBLES/SUPERMERCADOS DE ALIMENTOS DE LOS EAU EN EL MERCADO DE TARJETAS DE REGALO, POR PRODUCTO, 2021-2030 (MILLONES DE USD)

TABLA 539 ENTRETENIMIENTO EN LOS EAU EN EL MERCADO DE TARJETAS DE REGALO, POR PRODUCTO, 2021-2030 (MILLONES DE USD)

TABLA 540 EAU OTROS EN EL MERCADO DE TARJETAS DE REGALO, POR PRODUCTO, 2021-2030 (MILLONES DE USD)

TABLA 541 MERCADO DE TARJETAS DE REGALO DE IRAK, POR PRODUCTO, 2021-2030 (MILLONES DE USD)

TABLA 542 MERCADO DE TARJETAS DE REGALO DE IRAK, POR ATRIBUTO FUNCIONAL, 2021-2030 (MILLONES DE USD)

TABLA 543 BUCLE CERRADO DE IRAK EN EL MERCADO DE TARJETAS DE REGALO, POR TIPO, 2021-2030 (MILLONES DE USD)

TABLA 544 MERCADO DE TARJETAS DE REGALO DE IRAK, POR VERTICAL DE LA INDUSTRIA, 2021-2030 (MILLONES DE USD)

TABLA 545 MERCADO DE TARJETAS DE REGALO DE IRAK, POR COMERCIANTE, 2021-2030 (MILLONES DE USD)

TABLA 546 RESTAURANTES DE IRAK EN EL MERCADO DE TARJETAS DE REGALO, POR PRODUCTO, 2021-2030 (MILLONES DE USD)

TABLA 547 TIENDAS DE DESCUENTO EN IRAK EN EL MERCADO DE TARJETAS DE REGALO, POR PRODUCTO, 2021-2030 (MILLONES DE USD)

TABLA 548 CAFETERÍAS DE IRAK EN EL MERCADO DE TARJETAS DE REGALO, POR PRODUCTO, 2021-2030 (MILLONES DE USD)

TABLA 549 TIENDAS DEPARTAMENTALES DE IRAK EN EL MERCADO DE TARJETAS DE REGALO, POR PRODUCTO, 2021-2030 (MILLONES DE USD)

TABLA 550 TIENDAS DE COMESTIBLES/SUPERMERCADOS DE ALIMENTOS EN EL MERCADO DE TARJETAS DE REGALO DE IRAK, POR PRODUCTO, 2021-2030 (MILLONES DE USD)

TABLA 551 ENTRETENIMIENTO EN IRAK EN EL MERCADO DE TARJETAS DE REGALO, POR PRODUCTO, 2021-2030 (MILLONES DE USD)

TABLA 552 IRAK OTROS EN EL MERCADO DE TARJETAS DE REGALO, POR PRODUCTO, 2021-2030 (MILLONES DE USD)

TABLA 553 MERCADO DE TARJETAS DE REGALO DE ISRAEL, POR PRODUCTO, 2021-2030 (MILLONES DE USD)

TABLA 554 MERCADO DE TARJETAS DE REGALO DE ISRAEL, POR ATRIBUTO FUNCIONAL, 2021-2030 (MILLONES DE USD)

TABLA 555 BUCLE CERRADO DE ISRAEL EN EL MERCADO DE TARJETAS DE REGALO, POR TIPO, 2021-2030 (MILLONES DE USD)

TABLA 556 MERCADO DE TARJETAS DE REGALO DE ISRAEL, POR VERTICAL DE LA INDUSTRIA, 2021-2030 (MILLONES DE USD)

TABLA 557 MERCADO DE TARJETAS DE REGALO DE ISRAEL, POR COMERCIANTE, 2021-2030 (MILLONES DE USD)

TABLA 558 RESTAURANTES DE ISRAEL EN EL MERCADO DE TARJETAS DE REGALO, POR PRODUCTO, 2021-2030 (MILLONES DE USD)

TABLA 559 TIENDAS DE DESCUENTO DE ISRAEL EN EL MERCADO DE TARJETAS DE REGALO, POR PRODUCTO, 2021-2030 (MILLONES DE USD)

TABLA 560 CAFETERÍAS DE ISRAEL EN EL MERCADO DE TARJETAS DE REGALO, POR PRODUCTO, 2021-2030 (MILLONES DE USD)

TABLA 561 TIENDAS DEPARTAMENTALES DE ISRAEL EN EL MERCADO DE TARJETAS DE REGALO, POR PRODUCTO, 2021-2030 (MILLONES DE USD)

TABLA 562 TIENDAS DE COMESTIBLES/SUPERMERCADOS DE ALIMENTOS DE ISRAEL EN EL MERCADO DE TARJETAS DE REGALO, POR PRODUCTO, 2021-2030 (MILLONES DE USD)

TABLA 563 ENTRETENIMIENTO ISRAEL EN EL MERCADO DE TARJETAS DE REGALO, POR PRODUCTO, 2021-2030 (MILLONES DE USD)

TABLA 564 ISRAEL OTROS EN EL MERCADO DE TARJETAS DE REGALO, POR PRODUCTO, 2021-2030 (MILLONES DE USD)

TABLA 565 MERCADO DE TARJETAS DE REGALO DE QATAR, POR PRODUCTO, 2021-2030 (MILLONES DE USD)

TABLA 566 MERCADO DE TARJETAS DE REGALO DE QATAR, POR ATRIBUTO FUNCIONAL, 2021-2030 (MILLONES DE USD)

TABLA 567 BUCLE CERRADO DE QATAR EN EL MERCADO DE TARJETAS DE REGALO, POR TIPO, 2021-2030 (MILLONES DE USD)

TABLA 568 MERCADO DE TARJETAS DE REGALO DE QATAR, POR VERTICAL DE LA INDUSTRIA, 2021-2030 (MILLONES DE USD)

TABLA 569 MERCADO DE TARJETAS DE REGALO DE QATAR, POR COMERCIANTE, 2021-2030 (MILLONES DE USD)

TABLA 570 RESTAURANTES DE QATAR EN EL MERCADO DE TARJETAS DE REGALO, POR PRODUCTO, 2021-2030 (MILLONES DE USD)

TABLA 571 TIENDAS DE DESCUENTO DE QATAR EN EL MERCADO DE TARJETAS DE REGALO, POR PRODUCTO, 2021-2030 (MILLONES DE USD)

TABLA 572 CAFÉS DE QATAR EN EL MERCADO DE TARJETAS DE REGALO, POR PRODUCTO, 2021-2030 (MILLONES DE USD)

TABLA 573 TIENDAS DEPARTAMENTALES DE QATAR EN EL MERCADO DE TARJETAS DE REGALO, POR PRODUCTO, 2021-2030 (MILLONES DE USD)

TABLA 574 SUPERMERCADOS/SUPERMERCADOS DE ALIMENTOS DE QATAR EN EL MERCADO DE TARJETAS DE REGALO, POR PRODUCTO, 2021-2030 (MILLONES DE USD)

TABLA 575 ENTRETENIMIENTO DE QATAR EN EL MERCADO DE TARJETAS DE REGALO, POR PRODUCTO, 2021-2030 (MILLONES DE USD)

TABLA 576 QATAR OTROS EN EL MERCADO DE TARJETAS DE REGALO, POR PRODUCTO, 2021-2030 (MILLONES DE USD)

TABLA 577 MERCADO DE TARJETAS DE REGALO DE KUWAIT, POR PRODUCTO, 2021-2030 (MILLONES DE USD)

TABLA 578 MERCADO DE TARJETAS DE REGALO DE KUWAIT, POR ATRIBUTO FUNCIONAL, 2021-2030 (MILLONES DE USD)

TABLA 579 BUCLE CERRADO DE KUWAIT EN EL MERCADO DE TARJETAS DE REGALO, POR TIPO, 2021-2030 (MILLONES DE USD)

TABLA 580 MERCADO DE TARJETAS DE REGALO DE KUWAIT, POR VERTICAL DE LA INDUSTRIA, 2021-2030 (MILLONES DE USD)

TABLA 581 MERCADO DE TARJETAS DE REGALO DE KUWAIT, POR COMERCIANTE, 2021-2030 (MILLONES DE USD)

TABLA 582 RESTAURANTES DE KUWAIT EN EL MERCADO DE TARJETAS DE REGALO, POR PRODUCTO, 2021-2030 (MILLONES DE USD)

TABLA 583 TIENDAS DE DESCUENTO DE KUWAIT EN EL MERCADO DE TARJETAS DE REGALO, POR PRODUCTO, 2021-2030 (MILLONES DE USD)

TABLA 584 CAFETERÍAS DE KUWAIT EN EL MERCADO DE TARJETAS DE REGALO, POR PRODUCTO, 2021-2030 (MILLONES DE USD)

TABLA 585 TIENDAS DEPARTAMENTALES DE KUWAIT EN EL MERCADO DE TARJETAS DE REGALO, POR PRODUCTO, 2021-2030 (MILLONES DE USD)

TABLA 586 TIENDAS DE COMESTIBLES/SUPERMERCADOS DE ALIMENTOS DE KUWAIT EN EL MERCADO DE TARJETAS DE REGALO, POR PRODUCTO, 2021-2030 (MILLONES DE USD)

TABLA 587 ENTRETENIMIENTO DE KUWAIT EN EL MERCADO DE TARJETAS DE REGALO, POR PRODUCTO, 2021-2030 (MILLONES DE USD)

TABLA 588 KUWAIT OTROS EN EL MERCADO DE TARJETAS DE REGALO, POR PRODUCTO, 2021-2030 (MILLONES DE USD)

TABLA 589 MERCADO DE TARJETAS DE REGALO DE JORDANIA, POR PRODUCTO, 2021-2030 (MILLONES DE USD)

TABLA 590 MERCADO DE TARJETAS DE REGALO DE JORDANIA, POR ATRIBUTO FUNCIONAL, 2021-2030 (MILLONES DE USD)

TABLA 591 BUCLE CERRADO DE JORDANIA EN EL MERCADO DE TARJETAS DE REGALO, POR TIPO, 2021-2030 (MILLONES DE USD)

TABLA 592 MERCADO DE TARJETAS DE REGALO EN JORDANIA, POR VERTICAL DE LA INDUSTRIA, 2021-2030 (MILLONES DE USD)

TABLA 593 MERCADO DE TARJETAS DE REGALO DE JORDANIA, POR COMERCIANTE, 2021-2030 (MILLONES DE USD)

TABLA 594 RESTAURANTES DE JORDANIA EN EL MERCADO DE TARJETAS DE REGALO, POR PRODUCTO, 2021-2030 (MILLONES DE USD)

TABLA 595 TIENDAS DE DESCUENTO DE JORDANIA EN EL MERCADO DE TARJETAS DE REGALO, POR PRODUCTO, 2021-2030 (MILLONES DE USD)

TABLA 596 CAFETERÍAS DE JORDANIA EN EL MERCADO DE TARJETAS DE REGALO, POR PRODUCTO, 2021-2030 (MILLONES DE USD)

TABLA 597 TIENDAS DEPARTAMENTALES DE JORDANIA EN EL MERCADO DE TARJETAS DE REGALO, POR PRODUCTO, 2021-2030 (MILLONES DE USD)

TABLA 598 SUPERMERCADOS/SUPERMERCADOS DE ALIMENTOS DE JORDANIA EN EL MERCADO DE TARJETAS DE REGALO, POR PRODUCTO, 2021-2030 (MILLONES DE USD)

TABLA 599 ENTRETENIMIENTO JORDANO EN EL MERCADO DE TARJETAS DE REGALO, POR PRODUCTO, 2021-2030 (MILLONES DE USD)

TABLA 600 OTROS JORDANOS EN EL MERCADO DE TARJETAS DE REGALO, POR PRODUCTO, 2021-2030 (MILLONES DE USD)

TABLA 601 MERCADO DE TARJETAS DE REGALO DEL RESTO DE ORIENTE MEDIO Y ÁFRICA, POR PRODUCTO, 2021-2030 (MILLONES DE USD)

Por favor complete el siguiente formulario para Infografías

Al hacer clic en el botón "Enviar", usted acepta la investigación de mercado de Data Bridge. política de privacidad y Términos y condiciones

Metodología de investigación:

La recopilación de datos y el análisis del año base se realizan mediante módulos de recopilación de datos con muestras de gran tamaño. La etapa incluye la obtención de información de mercado o datos relacionados a través de diversas fuentes y estrategias. Incluye examinar y planificar de antemano todos los datos adquiridos del pasado. Asimismo, abarca el examen de las inconsistencias de la información observadas en diferentes fuentes de información. Los datos de mercado se analizan y estiman utilizando modelos estadísticos y coherentes de mercado. Además, el análisis de la cuota de mercado y el análisis de tendencias clave son los principales factores de éxito en el informe de mercado. Para saber más, solicite una llamada de analista o envíe su consulta.

La metodología de investigación clave utilizada por el equipo de investigación de DBMR es la triangulación de datos, que implica extracción de datos, análisis del impacto de las variables de datos en el mercado y validación primaria (experto de la industria). Los modelos de datos incluyen cuadrícula de posicionamiento de proveedores, análisis de la línea de tiempo del mercado, descripción general y guía del mercado, cuadrícula de posicionamiento de la empresa, análisis de patentes, análisis de precios, análisis de participación de mercado de la empresa, estándares de medición, análisis global versus regional y de participación de proveedores. Para saber más sobre la metodología de investigación, envíe una consulta para hablar con nuestros expertos de la industria.

Por favor complete el siguiente formulario para Metodología de Investigación

Al hacer clic en el botón "Enviar", usted acepta la investigación de mercado de Data Bridge. política de privacidad y Términos y condiciones

Personalización disponible:

Data Bridge Market Research es líder en investigación formativa avanzada. Estamos orgullosos de brindar servicios a nuestros clientes nuevos y existentes con datos y análisis que coinciden y se adaptan a sus objetivos. El informe se puede personalizar para incluir análisis de tendencias de precios de marcas objetivo que comprendan el mercado de países adicionales (solicite la lista de países), datos de resultados de ensayos clínicos, revisión de la literatura, mercado renovado y análisis de la base de productos. El análisis de mercado de los competidores objetivo se puede analizar desde análisis basados ​​en tecnología hasta estrategias de cartera de mercado. Podemos agregar tantos competidores sobre los que necesite datos en el formato y estilo de datos que esté buscando. Nuestro equipo de analistas también puede proporcionarle datos en tablas dinámicas de archivos de Excel sin procesar (libro de datos) o puede ayudarlo a crear presentaciones a partir de los conjuntos de datos disponibles en el informe.

Complete el siguiente formulario para personalizar disponible

Al hacer clic en el botón "Enviar", usted acepta la investigación de mercado de Data Bridge. política de privacidad y Términos y condiciones

HAGA PREGUNTAS FRECUENTES

El mercado de tarjetas de regalo tendrá un valor de 2.632.843,72 millones de dólares en el período previsto para 2030.
La tasa de crecimiento del mercado de tarjetas de regalo es del 14,2% durante el período previsto.
El uso de tarjetas de regalo como táctica comercial se está volviendo más popular y la tendencia social generalizada de dar obsequios en línea son los motores de crecimiento del mercado de tarjetas de regalo.
El producto, el atributo funcional, la industria vertical y el comerciante son los factores en los que se basa la investigación de mercado de tarjetas de regalo.
Las principales empresas en el mercado de tarjetas de regalo son Walmart Inc., Under Armour, Inc., Givex Corporation, American Express, Target Brands, Inc., Best Buy, Starbucks Coffee Company, PayPal Holdings, Inc., Apple Inc., Sephora USA, Inc., Gyft, Inc., Walgreen Co., TransGate Solutions, AMILON SRL, Jigsaw Business Solutions, Diggecard, Pine Labs Private Limited, Alltimeprint.com, Plastek Card Solutions, Inc., Card USA, Inc., Duracard, Blackhawk Network , Tarjeta de Tango. Inc, existencias, Inc.
Informe de muestra gratuito

ELEGIR TIPO DE LICENCIA

  • 7000.00
  • 4800.00
  • 3000.00
  • 8000.00
  • 12000.00

Por qué elegirnos

Cobertura de la industria

DBMR trabaja en todo el mundo en múltiples industrias, lo que nos brinda conocimiento en todos los sectores verticales y brinda a nuestros clientes información no solo de su industria sino también de cómo otras industrias afectarán su ecosistema.

Cobertura Regional

La cobertura de Data Bridge no se limita a las economías desarrolladas o emergentes. Trabajamos en todo el mundo cubriendo la mayor variedad de países donde ninguna otra firma de investigación de mercado o consultoría de negocios ha realizado investigaciones; creando oportunidades de crecimiento para nuestros clientes en áreas aún desconocidas.

Cobertura Tecnológica

En el mundo actual, la tecnología impulsa el sentimiento del mercado, por lo que nuestra visión es brindar a nuestros clientes información no solo sobre las tecnologías desarrolladas, sino también sobre los cambios tecnológicos futuros e disruptivos a lo largo del ciclo de vida del producto, brindándoles oportunidades imprevistas en el mercado que crearán disrupciones en su industria. . Esto lleva a la innovación y a que nuestros clientes salgan ganadores.

Soluciones orientadas a objetivos

El objetivo de DBMR es ayudar a nuestros clientes a alcanzar sus objetivos a través de nuestras soluciones; por lo tanto, creamos de manera formativa las soluciones más adecuadas para las necesidades de nuestros clientes, ahorrándoles tiempo y esfuerzos para impulsar sus grandes estrategias.

Soporte de analista incomparable

Nuestros analistas se enorgullecen del éxito de nuestros clientes. A diferencia de otros, creemos en trabajar junto a nuestros clientes para lograr sus objetivos con soporte de analistas las 24 horas para determinar las necesidades correctas e inspirar la innovación a través del servicio.

Banner

testimonios de clientes