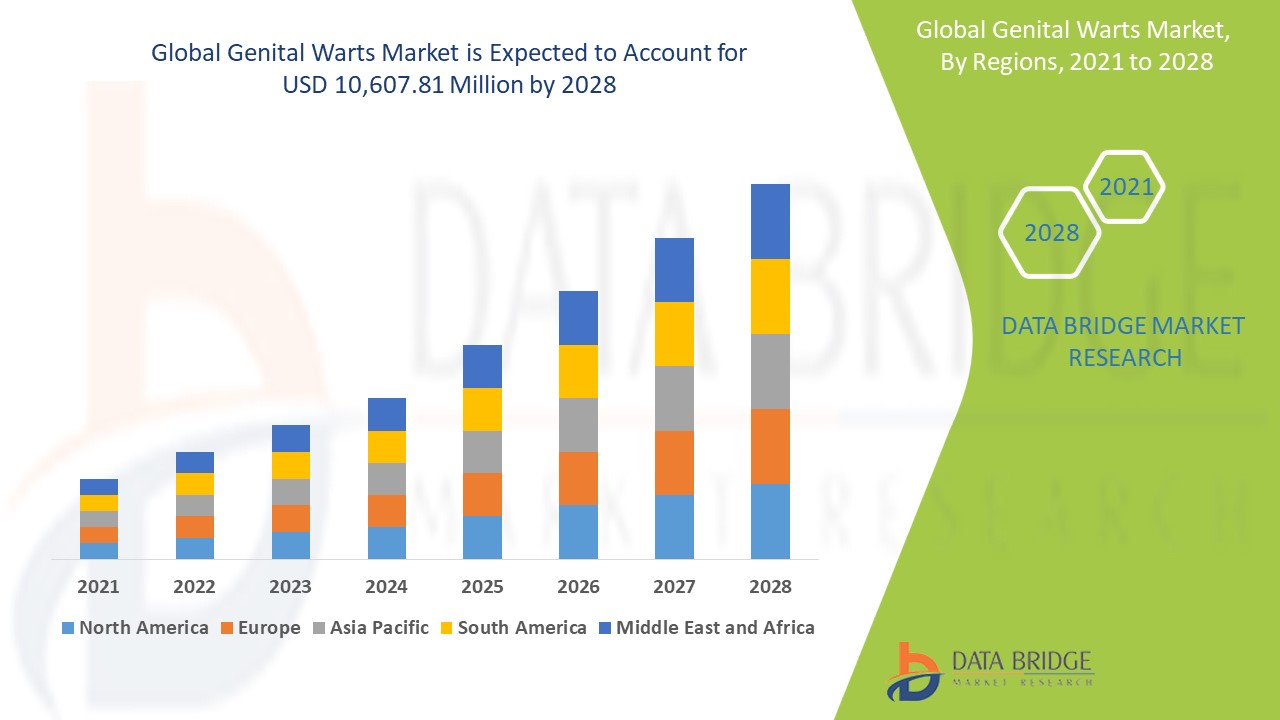
Image

Mercado global de verrugas genitales: tendencias de la industria y pronóstico para 2028

Farmacéutico

Image

Mercado global de verrugas genitales: tendencias de la industria y pronóstico para 2028

  • Farmacéutico
  • Informe publicado
  • agosto de 2021
  • Global
  • 350 páginas
  • Número de mesas: 622
  • Número de figuras: 83

Mercado global de verrugas genitales: tendencias de la industria y pronóstico para 2028

Tamaño del mercado en miles de millones de dólares

CAGR: % Diagram

Diagram Período de pronóstico 2020-2028
Diagram Tamaño del mercado (año base) USD 6447,97 millones
Diagram Tamaño del mercado (año previsto) USD 10.607,81 millones
Diagram CAGR %

Principales actores de los mercados

  • Bausch Health Companies Inc.
  • criocirugía
  • Inc.
  • Merck Sharpe & Dohme Corp.
  • Taro Industrias Farmacéuticas Ltd.

Mercado global de verrugas genitales, por morfología (verrugas similares a coliflor, papulares lisas, queratósicas y planas), tipo (prevención, diagnóstico, tratamiento), causa (VPH 6, VPH 11, otros), ubicación (vulva, cuello uterino, uretra). , Ano, Escroto), Género (Masculino y Femenino), Dosis (Crema, Gel, Ungüento, Intramuscular y Otros), Usuario Final (Hospitales, Centros de Diagnóstico, Centros Quirúrgicos, Centros de Cirugía Ambulatoria y Otros), Canal de Distribución (Directo Licitación, Farmacias y Otros), Por País (EE.UU., Canadá, México, Alemania, Reino Unido, Francia, Italia, España, Suiza, Países Bajos, Bélgica, Rusia, Turquía y Resto de Europa, China, Japón, China, India, Sur Corea, Australia, Singapur, Tailandia, Malasia, Indonesia, Filipinas y Resto de Asia-Pacífico, Brasil, Argentina y Resto de Sudamérica, Sudáfrica, Arabia Saudita, Emiratos Árabes Unidos, Israel, Egipto y Resto de Medio Oriente y África) Industria Tendencias y pronóstico hasta 2028

Genital Warts Market Análisis e información del mercado: mercado global de verrugas genitales.

Se espera que el mercado mundial de verrugas genitales gane crecimiento en el período previsto de 2020 a 2028. Data Bridge Market Research analiza que el mercado está creciendo con una tasa compuesta anual del 6,8% en el período previsto de 2021 a 2028 y se espera que alcance los USD 10.607,81 millones al 2028 desde USD 6.447,97 millones en 2020.

Las verrugas genitales son uno de los tipos más recurrentes de infecciones de transmisión sexual. El virus del papiloma humano es el virus responsable de causar las verrugas genitales. Las personas se infectarán con al menos un tipo de virus del papiloma humano (VPH) en algún momento de sus vidas. Las verrugas genitales afectan a la mayoría de los tejidos húmedos de las zonas genitales de pacientes masculinos y femeninos. Aunque la infección genital es asintomática, con frecuencia se reconoce como verrugas genitales debido a la aparición de los síntomas. Se estima que alrededor del 1% de los hombres y mujeres sexualmente activos en los Estados Unidos tienen verrugas genitales.

Las verrugas genitales son causadas por el virus del papiloma humano (VPH). Hay alrededor de 30 a 40 cepas de VPH. Sin embargo, sólo unas pocas cepas causan verrugas genitales. El virus se transmite fácilmente a través del contacto de piel a piel. De ahí que se considere una infección de transmisión sexual (ITS). El Centro para el Control y la Prevención de Enfermedades (CDC) dice que las personas contraen verrugas genitales debido a la actividad mutante del VPH.

El aumento de la prevalencia de enfermedades de transmisión sexual (ETS) y las infecciones por el virus del papiloma humano, el aumento de la población masculina, el aumento de las iniciativas gubernamentales y los programas de concientización impulsarán el mercado de las verrugas genitales. Además, el aumento de los ensayos clínicos, el aumento del gasto sanitario y las iniciativas estratégicas de los actores del mercado y el enorme potencial de mercado en los países en desarrollo refuerzan el crecimiento del mercado de las verrugas genitales. Sin embargo, el aumento del costo del tratamiento para las verrugas genitales, los efectos secundarios observados durante el tratamiento para las verrugas genitales y la falta de conciencia de los pacientes y los consumidores son las limitaciones que podrían obstaculizar el crecimiento del mercado de las verrugas genitales. El aumento de las retiradas de productos asociados con las vacunas y la administración tópica de verrugas genitales y el cumplimiento del paciente con respecto al uso de vacunas son las restricciones que podrían obstaculizar el crecimiento del mercado.

Sin embargo, la falta de profesionales capacitados y calificados podría representar un desafío para el crecimiento del mercado de las verrugas genitales.

El informe del mercado global de Verrugas genitales proporciona detalles de la participación de mercado, los nuevos desarrollos y el análisis de la cartera de productos, el impacto de los actores del mercado nacional y localizado, analiza las oportunidades en términos de bolsillos de ingresos emergentes, cambios en las regulaciones del mercado, aprobaciones de productos, decisiones estratégicas, producto. lanzamientos, expansiones geográficas e innovaciones tecnológicas en el mercado. Para comprender el análisis y el escenario del mercado, contáctenos para recibir un resumen del analista. Nuestro equipo lo ayudará a crear una solución de impacto en los ingresos para lograr el objetivo deseado.

Genital Warts Market Mercado global de verrugas genitales: alcance y tamaño del mercado

El mercado mundial de verrugas genitales está segmentado según la morfología, el tipo, la causa, la ubicación, el género, la dosis, el usuario final y el canal de distribución. El crecimiento entre segmentos le ayuda a analizar nichos de crecimiento y estrategias para acercarse al mercado y determinar sus áreas de aplicación principales y la diferencia en sus mercados objetivo.

  • Según la morfología, el mercado mundial de verrugas genitales se segmenta en verrugas planas, papulares lisas, parecidas a coliflores y queratósicas. En 2021, se espera que el segmento similar a la coliflor domine el mercado mundial de verrugas genitales debido a la alta prevalencia de esta forma de verrugas genitales.
  • Según el tipo, el mercado mundial de verrugas genitales se segmenta en prevención, diagnóstico y tratamiento. En 2021, se espera que el segmento de prevención domine el mercado mundial de verrugas genitales a medida que la prevención aumente debido a la disponibilidad de vacunas preventivas.
  • Según la causa, el mercado mundial de verrugas genitales se segmenta en VPH 6, VPH 11 y otros. En 2021, se espera que el segmento del VPH 6 domine el mercado mundial de verrugas genitales debido a que la cepa del VPH 6 tiene la mayor abundancia en los diagnósticos y tiene una tasa de prevalencia más alta que el VPH 11.
  • Según la ubicación, el mercado mundial de verrugas genitales se segmenta en cuello uterino, uretra, ano, vulva y escroto. En 2021, se espera que el segmento de la vulva domine el mercado mundial de las verrugas genitales porque la tasa de prevalencia en las mujeres es más alta que en los hombres y la vulva tiene el tejido más blando y las glándulas secretoras.
  • Según el género, el mercado mundial de verrugas genitales se segmenta en masculino y femenino. En 2021, se espera que el segmento femenino domine el mercado mundial de verrugas genitales debido a la mayor prevalencia o tasa de incidencia.
  • Según la dosis, el mercado mundial de verrugas genitales se segmenta en crema, gel, ungüento, por vía intramuscular y otros. En 2021, se espera que el segmento de las cremas domine el mercado mundial de las verrugas genitales porque el tratamiento con crema es la forma más sencilla de tratar las verrugas genitales y puede realizarlo el propio paciente en casa.
  • Según el usuario final, el mercado mundial de verrugas genitales se segmenta en hospitales, centros de diagnóstico, centros quirúrgicos, centros quirúrgicos ambulatorios y otros. En 2021, se espera que el segmento hospitalario domine el mercado mundial de verrugas genitales, ya que los pacientes de los hospitales tienen todas las instalaciones y pueden contactar directamente a los médicos, quienes pueden diagnosticar la enfermedad y administrar el tratamiento correspondiente.
  • Según los canales de distribución, el mercado mundial de verrugas genitales se segmenta en licitación directa, farmacias y otros. En 2021, se espera que el segmento de licitación directa domine el mercado mundial de verrugas genitales, ya que no requiere prescripción médica y se puede comprar y utilizar.

Genital Warts Market Análisis a nivel de país del mercado global de verrugas genitales

Se analiza el mercado mundial de verrugas genitales y se proporciona información sobre el tamaño del mercado por morfología, tipo, causa, ubicación, género, dosis, usuario final y canal de distribución.

Los países cubiertos en el informe del mercado de las verrugas genitales son EE. UU., Canadá, México, Alemania, Francia, Reino Unido, Italia, España, Rusia, Polonia, Turquía, Suiza, Países Bajos, Hungría, Austria, Noruega, Irlanda, Lituania y el resto de Europa. en Europa, China, Japón, India, Australia, Corea del Sur, Singapur, Tailandia, Malasia, Indonesia, Filipinas, Vietnam, resto de Asia-Pacífico (APAC) en Asia-Pacífico (APAC) Brasil, Argentina, Perú, resto de Sur América en Sudamérica, Sudáfrica, Arabia Saudita, Emiratos Árabes Unidos, Israel, Egipto, Kuwait y resto de Medio Oriente y África en Medio Oriente y África (MEA).

Se espera que Estados Unidos domine el mercado mundial de verrugas genitales en la región de América del Norte debido a un aumento en la prevalencia de casos de ETS y verrugas genitales y al aumento de la aprobación de productos. El segmento morfológico domina en los EE. UU. debido al aumento de casos y garantiza un tratamiento y diagnóstico completos en los pacientes estadounidenses. Al mismo tiempo, se espera que Alemania domine las verrugas genitales globales en la región europea debido a la presencia de oportunidades sin explotar en Alemania para las verrugas genitales y la mayor prevalencia de casos de enfermedades de transmisión sexual en Alemania. Se espera que el segmento morfológico domine el mercado debido a una mayor preferencia por métodos mínimamente invasivos. Además, se espera que Japón domine las verrugas genitales globales en la región de Asia Pacífico debido a una mayor conciencia sobre el tratamiento de las verrugas genitales y escenarios de reembolso favorables en Japón. Se espera que el segmento morfológico domine el mercado debido a la mejora de la arquitectura sanitaria en Japón y a las colaboraciones entre las organizaciones sanitarias y los actores del mercado para el suministro de medicamentos imiquimod.

La sección de países del informe también proporciona factores que impactan el mercado individual y cambios en la regulación del mercado a nivel nacional que impactan las tendencias actuales y futuras del mercado. Datos como ventas nuevas, ventas de reemplazo, demografía del país, leyes regulatorias y aranceles de importación y exportación son algunos de los indicadores importantes que se utilizan para pronosticar el escenario del mercado para países individuales. Además, se considera la presencia y disponibilidad de marcas globales y los desafíos que enfrentan debido a la competencia grande o escasa de marcas locales y nacionales, y el impacto de los canales de ventas al tiempo que se proporciona un análisis de pronóstico de los datos del país.

El potencial de crecimiento de las verrugas genitales en las economías emergentes y las iniciativas estratégicas de los actores del mercado están creando nuevas oportunidades en el mercado mundial de las verrugas genitales.

El mercado global de verrugas genitales también le proporciona un análisis de mercado detallado para el crecimiento de cada país en una industria particular con ventas de dispositivos de desbridamiento de heridas, el impacto del avance en las verrugas genitales y cambios en los escenarios regulatorios con su apoyo al mercado de las verrugas genitales. Los datos están disponibles para el periodo histórico 2019 a 2020.

Panorama competitivo y cuota de mercado análisis global de Verrugas genitales

El panorama competitivo del mercado global de verrugas genitales proporciona detalles de un competidor. Los detalles incluidos son descripción general de la empresa, finanzas de la empresa, ingresos generados, potencial de mercado, inversión en investigación y desarrollo, nuevas iniciativas de mercado, sitios e instalaciones de producción, fortalezas y debilidades de la empresa, lanzamiento de productos, proyectos de pruebas de productos, aprobaciones de productos, patentes, ancho del producto, y amplitud, dominio de las aplicaciones, curva de salvación de la tecnología. Los puntos de datos anteriores proporcionados sólo están relacionados con el enfoque de la empresa en el mercado de las verrugas genitales.

Las principales empresas que ofrecen tratamiento mundial para las verrugas genitales son Bausch Health Companies Inc., CryoSurgery, Inc., Merck Sharpe & Dohme Corp., una subsidiaria de Merck & Co., Inc., Taro Pharmaceutical Industries Ltd., Glenmark Pharmaceutical Inc., EE. UU. (una subsidiaria de Glenmark Pharmaceuticals Ltd.), Edge Pharma, CryoConcepts LP, CryoIQ, GlaxoSmithKline plc, ANI Pharmaceuticals, Inc., Cassiopea, Inc., Verrica Pharmaceuticals, Novan, Inc., BioNTech SE, Serum Institute of India Pvt. Limitado. Ltd., Fotona, Orgenesis Inc., Perrigo Company plc entre otras.

Las iniciativas estratégicas de los actores del mercado, junto con los nuevos avances tecnológicos para la producción de vacunas y el suministro de imiquimod para el tratamiento de las verrugas genitales, están cerrando la brecha en el tratamiento.

Por ejemplo,

  • En junio de 2020, Merck Sharp & Dohme Corp., una subsidiaria de Merck & Co., Inc., había declarado la aprobación de la FDA de EE. UU. para GARDASIL9 (vacuna recombinante 9-valente contra el virus del papiloma humano) para la prevención de enfermedades cervicales, vaginales relacionadas con el VPH. , vulvar, anal, orofaríngeo y otros cánceres de cabeza y cuello. La aprobación de la FDA recibida permitiría abordar las necesidades clínicas no cubiertas de los pacientes, aumentar la distribución de la vacuna en hospitales e institutos de investigación del cáncer y aumentar las ventas del producto.

La colaboración, las empresas conjuntas y otras estrategias del actor del mercado están mejorando el mercado de la empresa en el mercado global de verrugas genitales, lo que también brinda el beneficio para que una organización mejore su oferta de productos de tratamiento.


SKU-

LISTA DE TABLAS

TABLA 1 MERCADO MUNDIAL DE VERRUGAS GENITALES, ANÁLISIS EN CURSO

TABLA 2 MERCADO MUNDIAL DE VERRUGAS GENITALES, POR MORFOLOGÍA, 2019-2028 (MILLONES DE USD)

TABLA 3 MERCADO MUNDIAL DE VERRUGAS GENITALES, POR REGIÓN, 2019-2028 (MILLONES DE USD)

TABLA 4 MERCADO GLOBAL DE PAPULAR LISO EN LAS VERRUGAS GENITALES, POR REGIÓN, 2019-2028 (MILLONES DE USD)

TABLA 5 MERCADO GLOBAL DE QUERATÓSICO EN LAS VERRUGAS GENITALES, POR REGIÓN, 2019-2028 (MILLONES DE USD)

TABLA 6 MERCADO MUNDIAL DE VERRUGAS PLANAS EN LAS VERRUGAS GENITALES, POR REGIÓN, 2019-2028 (MILLONES DE USD)

TABLA 7 MERCADO MUNDIAL DE VERRUGAS GENITALES, POR TIPO, 2019-2028 (MILLONES DE USD)

TABLA 8 MERCADO GLOBAL DE PREVENCIÓN DE LAS VERRUGAS GENITALES, POR REGIÓN, 2019-2028 (MILLONES DE USD)

TABLA 9 MERCADO GLOBAL DE DIAGNÓSTICO DE VERRUGAS GENITALES, POR REGIÓN, 2019-2028 (MILLONES DE USD)

TABLA 10 MERCADO GLOBAL DE DIAGNÓSTICO DE VERRUGAS GENITALES, POR TIPO, 2019-2028 (MILLONES DE USD)

TABLA 11 MERCADO GLOBAL DE TRATAMIENTO DE LAS VERRUGAS GENITALES, POR REGIÓN, 2019-2028 (MILLONES DE USD)

TABLA 12 MERCADO GLOBAL DE TRATAMIENTO DE LAS VERRUGAS GENITALES, POR TIPO, 2019-2028 (MILLONES DE USD)

TABLA 13 MERCADO GLOBAL DE TRATAMIENTO FARMACOLÓGICO DE LAS VERRUGAS GENITALES, POR TIPO, 2019-2028 (MILLONES DE USD)

TABLA 14 MERCADO GLOBAL DE TRATAMIENTOS NO FARMACOLÓGICOS PARA LAS VERRUGAS GENITALES, POR TIPO, 2019-2028 (MILLONES DE USD)

TABLA 15 MERCADO GLOBAL DE TRATAMIENTO DE LAS VERRUGAS GENITALES, POR TIPO, 2019-2028 (MILLONES DE USD)

TABLA 16 MERCADO MUNDIAL DE VERRUGAS GENITALES, POR CAUSA, 2019-2028 (MILLONES DE USD)

TABLA 17 MERCADO GLOBAL DEL VPH 6 EN LAS VERRUGAS GENITALES, POR REGIÓN, 2019-2028 (MILLONES DE USD)

TABLA 18 MERCADO GLOBAL DEL VPH 11 EN LAS VERRUGAS GENITALES, POR REGIÓN, 2019-2028 (MILLONES DE USD)

TABLA 19 MERCADO GLOBAL DE OTRAS VERRUGAS GENITALES, POR REGIÓN, 2019-2028 (MILLONES DE USD)

TABLA 20 MERCADO MUNDIAL DE VERRUGAS GENITALES, POR UBICACIÓN, 2019-2028 (MILLONES DE USD)

TABLA 21 MERCADO GLOBAL DE VULVA EN VERRUGAS GENITALES, POR REGIÓN, 2019-2028 (MILLONES DE USD)

TABLA 22 MERCADO MUNDIAL DEL CÉRVIX ÚTERO EN LAS VERRUGAS GENITALES, POR REGIÓN, 2019-2028 (MILLONES DE USD)

TABLA 23 MERCADO GLOBAL DE URETRA EN VERRUGAS GENITALES, POR REGIÓN, 2019-2028 (MILLONES DE USD)

TABLA 24 MERCADO GLOBAL DEL ANO EN LAS VERRUGAS GENITALES, POR REGIÓN, 2019-2028 (MILLONES DE USD)

TABLA 25 MERCADO GLOBAL DEL ESCROTO EN LAS VERRUGAS GENITALES, POR REGIÓN, 2019-2028 (MILLONES DE USD)

TABLA 26 MERCADO MUNDIAL DE VERRUGAS GENITALES, POR GÉNERO, 2019-2028 (MILLONES DE USD)

TABLA 27 MERCADO MUNDIAL DE VERRUGAS GENITALES PARA MUJERES, POR REGIÓN, 2019-2028 (MILLONES DE USD)

TABLA 28 MERCADO MUNDIAL DE VERRUGAS GENITALES EN HOMBRES, POR REGIÓN, 2019-2028 (MILLONES DE USD)

TABLA 29 MERCADO MUNDIAL DE VERRUGAS GENITALES, POR DOSIS, 2019-2028 (MILLONES DE USD)

TABLA 30 MERCADO GLOBAL DE CREMA PARA LAS VERRUGAS GENITALES, POR REGIÓN, 2019-2028 (MILLONES DE USD)

TABLA 31 MERCADO GLOBAL DE GEL PARA LAS VERRUGAS GENITALES, POR REGIÓN, 2019-2028 (MILLONES DE USD)

TABLA 32 MERCADO GLOBAL DE UNGUENTO PARA LAS VERRUGAS GENITALES, POR REGIÓN, 2019-2028 (MILLONES DE USD)

TABLA 33 MERCADO GLOBAL DE VÍA INTRAMUSCULAR EN LAS VERRUGAS GENITALES, POR REGIÓN, 2019-2028 (MILLONES DE USD)

TABLA 34 MERCADO GLOBAL DE OTRAS VERRUGAS GENITALES, POR REGIÓN, 2019-2028 (MILLONES DE USD)

TABLA 35 MERCADO MUNDIAL DE VERRUGAS GENITALES, POR USUARIO FINAL, 2019-2028 (MILLONES DE USD)

TABLA 36 HOSPITALES MUNDIALES EN EL MERCADO DE VERRUGAS GENITALES, POR REGIÓN, 2019-2028 (MILLONES DE USD)

TABLA 37 CENTROS GLOBALES DE DIAGNÓSTICO EN EL MERCADO DE VERRUGAS GENITALES, POR REGIÓN, 2019-2028 (MILLONES DE USD)

TABLA 38 CENTROS QUIRÚRGICOS MUNDIALES EN EL MERCADO DE VERRUGAS GENITALES, POR REGIÓN, 2019-2028 (MILLONES DE USD)

TABLA 39 CENTROS QUIRÚRGICOS AMBULATORIOS MUNDIALES EN EL MERCADO DE VERRUGAS GENITALES, POR REGIÓN, 2019-2028 (MILLONES DE USD)

TABLA 40 MERCADO GLOBAL DE OTRAS VERRUGAS GENITALES, POR REGIÓN, 2019-2028 (MILLONES DE USD)

TABLA 41 MERCADO GLOBAL DE VERRUGAS GENITALES, POR CANAL DE DISTRIBUCIÓN 2019-2028 (MILLONES DE USD)

CUADRO 42 LICITACIÓN DIRECTA GLOBAL EN EL MERCADO DE VERRUGAS GENITALES, POR REGIÓN, 2019-2028 (MILLONES DE USD)

TABLA 43 TIENDAS DE FARMACIA MUNDIALES EN EL MERCADO DE VERRUGAS GENITALES, POR REGIÓN, 2019-2028 (MILLONES DE USD)

TABLA 44 MERCADO GLOBAL DE OTRAS VERRUGAS GENITALES, POR REGIÓN, 2019-2028 (MILLONES DE USD)

TABLA 45 MERCADO MUNDIAL DE VERRUGAS GENITALES, POR REGIÓN, 2019-2028 (MILLONES DE USD)

CUADRO 46 MERCADO DE VERRUGAS GENITALES EN AMÉRICA DEL NORTE, POR PAÍS, 2019-2028 (MILLONES DE USD)

TABLA 47 MERCADO DE VERRUGAS GENITALES EN AMÉRICA DEL NORTE, POR MORFOLOGÍA, 2019-2028 (MILLONES DE USD)

TABLA 48 MERCADO DE VERRUGAS GENITALES EN AMÉRICA DEL NORTE, POR TIPO, 2019-2028 (MILLONES DE USD)

TABLA 49 MERCADO DE PREVENCIÓN DE LAS VERRUGAS GENITALES EN AMÉRICA DEL NORTE, POR TIPO, 2019-2028 (MILLONES DE USD)

TABLA 50 MERCADO DE GARDASIL EN LAS VERRUGAS GENITALES DE AMÉRICA DEL NORTE, POR PAÍS, 2019-2028 (MILLONES DE USD)

TABLA 51 MERCADO DE DIAGNÓSTICO DE VERRUGAS GENITALES EN AMÉRICA DEL NORTE, POR TIPO, 2019-2028 (MILLONES DE USD)

TABLA 52 MERCADO DE TRATAMIENTO DE LAS VERRUGAS GENITALES EN AMÉRICA DEL NORTE, POR TIPO, 2019-2028 (MILLONES DE USD)

TABLA 53 MERCADO DE TRATAMIENTO FARMACOLÓGICO DE LAS VERRUGAS GENITALES EN AMÉRICA DEL NORTE, POR TIPO, 2019-2028 (MILLONES DE USD)

TABLA 54 MERCADO DE TRATAMIENTOS NO FARMACOLÓGICOS DE LAS VERRUGAS GENITALES EN AMÉRICA DEL NORTE, POR TIPO, 2019-2028 (MILLONES DE USD)

TABLA 55 MERCADO DE VERRUGAS GENITALES EN AMÉRICA DEL NORTE, POR CAUSA, 2019-2028 (MILLONES DE USD)

TABLA 56 MERCADO DE VERRUGAS GENITALES EN AMÉRICA DEL NORTE, POR UBICACIÓN, 2019-2028 (MILLONES DE USD)

TABLA 57 MERCADO DE VERRUGAS GENITALES EN AMÉRICA DEL NORTE, POR GÉNERO, 2019-2028 (MILLONES DE USD)

CUADRO 58 MERCADO DE VERRUGAS GENITALES EN AMÉRICA DEL NORTE, POR DOSIS, 2019-2028 (MILLONES DE USD)

TABLA 59 MERCADO DE VERRUGAS GENITALES DE AMÉRICA DEL NORTE, POR USUARIO FINAL, 2019-2028 (MILLONES DE USD)

TABLA 60 MERCADO DE VERRUGAS GENITALES EN AMÉRICA DEL NORTE, POR CANAL DE DISTRIBUCIÓN, 2019-2028 (MILLONES DE USD)

TABLA 61 MERCADO DE VERRUGAS GENITALES DE EE. UU., POR MORFOLOGÍA, 2019-2028 (MILLONES DE USD)

TABLA 62 MERCADO DE VERRUGAS GENITALES DE EE. UU., POR TIPO, 2019-2028 (MILLONES DE USD)

TABLA 63 MERCADO DE PREVENCIÓN DE VERRUGAS GENITALES EN EE. UU., POR TIPO, 2019-2028 (MILLONES DE USD)

TABLA 64 MERCADO DE DIAGNÓSTICO EN VERRUGAS GENITALES DE EE. UU., POR TIPO, 2019-2028 (MILLONES DE USD)

TABLA 65 MERCADO DE TRATAMIENTO DE LAS VERRUGAS GENITALES EN EE. UU., POR TIPO, 2019-2028 (MILLONES DE USD)

TABLA 66 MERCADO DE TRATAMIENTOS FARMACOLÓGICOS DE EE. UU. EN LAS VERRUGAS GENITALES, POR TIPO, 2019-2028 (MILLONES DE USD)

TABLA 67 MERCADO DE TRATAMIENTOS NO FARMACOLÓGICOS DE EE. UU. PARA LAS VERRUGAS GENITALES, POR TIPO, 2019-2028 (MILLONES DE USD)

TABLA 68 MERCADO DE VERRUGAS GENITALES DE EE. UU., POR CAUSA, 2019-2028 (MILLONES DE USD)

TABLA 69 MERCADO DE VERRUGAS GENITALES DE EE. UU., POR UBICACIÓN, 2019-2028 (MILLONES DE USD)

TABLA 70 MERCADO DE VERRUGAS GENITALES DE EE. UU., POR GÉNERO, 2019-2028 (MILLONES DE USD)

TABLA 71 MERCADO DE VERRUGAS GENITALES DE EE. UU., POR DOSIS, 2019-2028 (MILLONES DE USD)

TABLA 72 MERCADO DE VERRUGAS GENITALES DE EE. UU., POR USUARIO FINAL, 2019-2028 (MILLONES DE USD)

TABLA 73 MERCADO DE VERRUGAS GENITALES DE EE. UU., POR CANAL DE DISTRIBUCIÓN, 2019-2028 (MILLONES DE USD)

TABLA 74 MERCADO DE VERRUGAS GENITALES EN CANADÁ, POR MORFOLOGÍA, 2019-2028 (MILLONES DE USD)

TABLA 75 MERCADO DE VERRUGAS GENITALES EN CANADÁ, POR TIPO, 2019-2028 (MILLONES DE USD)

TABLA 76 PREVENCIÓN DEL MERCADO DE VERRUGAS GENITALES EN CANADÁ, POR TIPO, 2019-2028 (MILLONES DE USD)

TABLA 77 MERCADO DE DIAGNÓSTICO DE VERRUGAS GENITALES EN CANADÁ, POR TIPO, 2019-2028 (MILLONES DE USD)

TABLA 78 MERCADO DE TRATAMIENTO DE LAS VERRUGAS GENITALES EN CANADÁ, POR TIPO, 2019-2028 (MILLONES DE USD)

TABLA 79 MERCADO DE TRATAMIENTO FARMACOLÓGICO DE LAS VERRUGAS GENITALES EN CANADÁ, POR TIPO, 2019-2028 (MILLONES DE USD)

TABLA 80 MERCADO DE TRATAMIENTOS NO FARMACOLÓGICOS DE CANADÁ PARA LAS VERRUGAS GENITALES, POR TIPO, 2019-2028 (MILLONES DE USD)

TABLA 81 MERCADO DE VERRUGAS GENITALES EN CANADÁ, POR CAUSA, 2019-2028 (MILLONES DE USD)

TABLA 82 MERCADO DE VERRUGAS GENITALES EN CANADÁ, POR UBICACIÓN, 2019-2028 (MILLONES DE USD)

TABLA 83 MERCADO DE VERRUGAS GENITALES EN CANADÁ, POR GÉNERO, 2019-2028 (MILLONES DE USD)

TABLA 84 MERCADO DE VERRUGAS GENITALES EN CANADÁ, POR DOSIS, 2019-2028 (MILLONES DE USD)

TABLA 85 MERCADO DE VERRUGAS GENITALES EN CANADÁ, POR USUARIO FINAL, 2019-2028 (MILLONES DE USD)

TABLA 86 MERCADO DE VERRUGAS GENITALES EN CANADÁ, POR CANAL DE DISTRIBUCIÓN, 2019-2028 (MILLONES DE USD)

CUADRO 87 MERCADO DE VERRUGAS GENITALES EN MÉXICO, POR MORFOLOGÍA, 2019-2028 (MILLONES DE USD)

CUADRO 88 MERCADO DE VERRUGAS GENITALES EN MÉXICO, POR TIPO, 2019-2028 (MILLONES DE USD)

CUADRO 89 MERCADO DE PREVENCIÓN DE VERRUGAS GENITALES EN MÉXICO, POR TIPO, 2019-2028 (MILLONES DE USD)

TABLA 90 MERCADO DE DIAGNÓSTICO EN VERRUGAS GENITALES EN MÉXICO, POR TIPO, 2019-2028 (MILLONES DE USD)

CUADRO 91 MERCADO DE TRATAMIENTO DE VERRUGAS GENITALES EN MÉXICO, POR TIPO, 2019-2028 (MILLONES DE USD)

CUADRO 92 MERCADO DE TRATAMIENTOS FARMACOLÓGICOS EN VERRUGAS GENITALES EN MÉXICO, POR TIPO, 2019-2028 (MILLONES DE USD)

CUADRO 93 MERCADO DE TRATAMIENTOS NO FARMACOLÓGICOS EN LAS VERRUGAS GENITALES EN MÉXICO, POR TIPO, 2019-2028 (MILLONES DE USD)

CUADRO 94 MERCADO DE VERRUGAS GENITALES EN MÉXICO, POR CAUSA, 2019-2028 (MILLONES DE USD)

CUADRO 95 MERCADO DE VERRUGAS GENITALES EN MÉXICO, POR UBICACIÓN, 2019-2028 (MILLONES DE USD)

CUADRO 96 MERCADO DE VERRUGAS GENITALES EN MÉXICO, POR GÉNERO, 2019-2028 (MILLONES DE USD)

CUADRO 97 MERCADO DE VERRUGAS GENITALES EN MÉXICO, POR DOSIS, 2019-2028 (MILLONES DE USD)

CUADRO 98 MERCADO DE VERRUGAS GENITALES EN MÉXICO, POR USUARIO FINAL, 2019-2028 (MILLONES DE USD)

CUADRO 99 MERCADO DE VERRUGAS GENITALES EN MÉXICO, POR CANAL DE DISTRIBUCIÓN, 2019-2028 (MILLONES DE USD)

CUADRO 100 MERCADO EUROPEO DE VERRUGAS GENITALES, POR PAÍS, 2019-2028 (MILLONES DE USD)

TABLA 101 MERCADO EUROPEO DE VERRUGAS GENITALES, POR MORFOLOGÍA, 2019-2028 (MILLONES DE USD)

TABLA 102 MERCADO EUROPEO DE VERRUGAS GENITALES, POR TIPO, 2019-2028 (MILLONES DE USD)

TABLA 103 MERCADO EUROPEO DE DIAGNÓSTICO EN VERRUGAS GENITALES, POR TIPO, 2019-2028 (MILLONES DE USD)

TABLA 104 MERCADO EUROPEO DE TRATAMIENTO DE LAS VERRUGAS GENITALES, POR TIPO, 2019-2028 (MILLONES DE USD)

TABLA 105 MERCADO EUROPEO DE TRATAMIENTO FARMACOLÓGICO EN LAS VERRUGAS GENITALES, POR TIPO, 2019-2028 (MILLONES DE USD)

CUADRO 106 MERCADO EUROPEO DE PREVENCIÓN DE VERRUGAS GENITALES, POR TRATAMIENTO, 2019-2028 (MILLONES DE USD)

TABLA 107 MERCADO EUROPEO DE VERRUGAS GENITALES DE GARDASIL, POR PAÍS, 2019-2028 (MILLONES DE USD)

CUADRO 108 MERCADO EUROPEO DE VERRUGAS GENITALES CERVARIX, POR PAÍS, 2019-2028 (MILLONES DE USD)

TABLA 109 MERCADO EUROPEO DE TRATAMIENTOS NO FARMACOLÓGICOS PARA LAS VERRUGAS GENITALES, POR TIPO, 2019-2028 (MILLONES DE USD)

TABLA 110 MERCADO EUROPEO DE VERRUGAS GENITALES, POR CAUSA, 2019-2028 (MILLONES DE USD)

TABLA 111 MERCADO EUROPEO DE VERRUGAS GENITALES, POR UBICACIÓN, 2019-2028 (MILLONES DE USD)

TABLA 112 MERCADO EUROPEO DE VERRUGAS GENITALES, POR GÉNERO, 2019-2028 (MILLONES DE USD)

CUADRO 113 MERCADO EUROPEO DE VERRUGAS GENITALES, POR DOSIS, 2019-2028 (MILLONES DE USD)

TABLA 114 MERCADO EUROPEO DE VERRUGAS GENITALES, POR USUARIO FINAL, 2019-2028 (MILLONES DE USD)

CUADRO 115 MERCADO EUROPEO DE VERRUGAS GENITALES, POR CANAL DE DISTRIBUCIÓN, 2019-2028 (MILLONES DE USD)

TABLA 116 MERCADO DE VERRUGAS GENITALES EN ALEMANIA, POR MORFOLOGÍA, 2019-2028 (MILLONES DE USD)

TABLA 117 MERCADO DE VERRUGAS GENITALES EN ALEMANIA, POR TIPO, 2019-2028 (MILLONES DE USD)

TABLA 118 MERCADO DE DIAGNÓSTICO DE VERRUGAS GENITALES EN ALEMANIA, POR TIPO, 2019-2028 (MILLONES DE USD)

TABLA 119 MERCADO DE TRATAMIENTO DE LAS VERRUGAS GENITALES EN ALEMANIA, POR TIPO, 2019-2028 (MILLONES DE USD)

TABLA 120 MERCADO DE TRATAMIENTO FARMACOLÓGICO EN VERRUGAS GENITALES EN ALEMANIA, POR TIPO, 2019-2028 (MILLONES DE USD)

CUADRO 121 MERCADO DE VERRUGAS GENITALES EN ALEMANIA, POR TRATAMIENTO, 2019-2028 (MILLONES DE USD)

TABLA 122 MERCADO DE TRATAMIENTOS NO FARMACOLÓGICOS DE ALEMANIA EN LAS VERRUGAS GENITALES, POR TIPO, 2019-2028 (MILLONES DE USD)

TABLA 123 MERCADO DE VERRUGAS GENITALES EN ALEMANIA, POR CAUSA, 2019-2028 (MILLONES DE USD)

TABLA 124 MERCADO DE VERRUGAS GENITALES EN ALEMANIA, POR UBICACIÓN, 2019-2028 (MILLONES DE USD)

TABLA 125 MERCADO DE VERRUGAS GENITALES EN ALEMANIA, POR GÉNERO, 2019-2028 (MILLONES DE USD)

TABLA 126 MERCADO DE VERRUGAS GENITALES EN ALEMANIA, POR DOSIS, 2019-2028 (MILLONES DE USD)

TABLA 127 MERCADO DE VERRUGAS GENITALES EN ALEMANIA, POR USUARIO FINAL, 2019-2028 (MILLONES DE USD)

TABLA 128 MERCADO DE VERRUGAS GENITALES EN ALEMANIA, POR CANAL DE DISTRIBUCIÓN, 2019-2028 (MILLONES DE USD)

CUADRO 129 MERCADO DE VERRUGAS GENITALES EN FRANCIA, POR MORFOLOGÍA, 2019-2028 (MILLONES DE USD)

TABLA 130 MERCADO DE VERRUGAS GENITALES EN FRANCIA, POR TIPO, 2019-2028 (MILLONES DE USD)

TABLA 131 MERCADO DE DIAGNÓSTICO DE VERRUGAS GENITALES EN FRANCIA, POR TIPO, 2019-2028 (MILLONES DE USD)

TABLA 132 MERCADO DE TRATAMIENTO DE LAS VERRUGAS GENITALES EN FRANCIA, POR TIPO, 2019-2028 (MILLONES DE USD)

TABLA 133 MERCADO DE TRATAMIENTO FARMACOLÓGICO DE FRANCIA EN LAS VERRUGAS GENITALES, POR TIPO, 2019-2028 (MILLONES DE USD)

CUADRO 134 MERCADO DE VERRUGAS GENITALES EN FRANCIA, POR TRATAMIENTO, 2019-2028 (MILLONES DE USD)

CUADRO 135 MERCADO DE TRATAMIENTO DE LAS VERRUGAS GENITALES EN FRANCIA, POR TIPO, 2019-2028 (MILLONES DE USD)

CUADRO 136 MERCADO DE VERRUGAS GENITALES EN FRANCIA, POR CAUSA, 2019-2028 (MILLONES DE USD)

CUADRO 137 MERCADO DE VERRUGAS GENITALES EN FRANCIA, POR UBICACIÓN, 2019-2028 (MILLONES DE USD)

CUADRO 138 MERCADO DE VERRUGAS GENITALES EN FRANCIA, POR GÉNERO, 2019-2028 (MILLONES DE USD)

CUADRO 139 MERCADO DE VERRUGAS GENITALES EN FRANCIA, POR DOSIS, 2019-2028 (MILLONES DE USD)

TABLA 140 MERCADO DE VERRUGAS GENITALES EN FRANCIA, POR USUARIO FINAL, 2019-2028 (MILLONES DE USD)

CUADRO 141 MERCADO DE VERRUGAS GENITALES EN FRANCIA, POR CANAL DE DISTRIBUCIÓN, 2019-2028 (MILLONES DE USD)

TABLA 142 MERCADO DE VERRUGAS GENITALES DEL REINO UNIDO, POR MORFOLOGÍA, 2019-2028 (MILLONES DE USD)

TABLA 143 MERCADO DE VERRUGAS GENITALES DEL REINO UNIDO, POR TIPO, 2019-2028 (MILLONES DE USD)

TABLA 144 DIAGNÓSTICO DEL REINO UNIDO EN EL MERCADO DE VERRUGAS GENITALES, POR TIPO, 2019-2028 (MILLONES DE USD)

TABLA 145 MERCADO DE TRATAMIENTO DE LAS VERRUGAS GENITALES EN EL REINO UNIDO, POR TIPO, 2019-2028 (MILLONES DE USD)

TABLA 146 MERCADO DE TRATAMIENTO FARMACOLÓGICO DEL REINO UNIDO PARA LAS VERRUGAS GENITALES, POR TIPO, 2019-2028 (MILLONES DE USD)

CUADRO 147 MERCADO DE VERRUGAS GENITALES DEL REINO UNIDO, POR TRATAMIENTO, 2019-2028 (MILLONES DE USD)

TABLA 148 MERCADO DE TRATAMIENTOS NO FARMACOLÓGICOS DEL REINO UNIDO PARA LAS VERRUGAS GENITALES, POR TIPO, 2019-2028 (MILLONES DE USD)

TABLA 149 MERCADO DE VERRUGAS GENITALES DEL REINO UNIDO, POR CAUSA, 2019-2028 (MILLONES DE USD)

TABLA 150 MERCADO DE VERRUGAS GENITALES DEL REINO UNIDO, POR UBICACIÓN, 2019-2028 (MILLONES DE USD)

TABLA 151 MERCADO DE VERRUGAS GENITALES DEL REINO UNIDO, POR GÉNERO, 2019-2028 (MILLONES DE USD)

TABLA 152 MERCADO DE VERRUGAS GENITALES DEL REINO UNIDO, POR DOSIS, 2019-2028 (MILLONES DE USD)

TABLA 153 MERCADO DE VERRUGAS GENITALES DEL REINO UNIDO, POR USUARIO FINAL, 2019-2028 (MILLONES DE USD)

CUADRO 154 MERCADO DE VERRUGAS GENITALES DEL REINO UNIDO, POR CANAL DE DISTRIBUCIÓN, 2019-2028 (MILLONES DE USD)

TABLA 155 MERCADO DE VERRUGAS GENITALES EN ITALIA, POR MORFOLOGÍA, 2019-2028 (MILLONES DE USD)

TABLA 156 MERCADO DE VERRUGAS GENITALES DE ITALIA, POR TIPO, 2019-2028, (MILLONES DE USD)

TABLA 157 MERCADO DE VERRUGAS GENITALES EN ITALIA, POR TIPO DE DIAGNÓSTICO, 2019-2028, (MILLONES DE USD)

TABLA 158 MERCADO DE TRATAMIENTO DE LAS VERRUGAS GENITALES EN ITALIA, POR TIPO, 2019-2028, (MILLONES DE USD)

TABLA 159 MERCADO FARMACOLÓGICO EN LAS VERRUGAS GENITALES DE ITALIA, POR TRATAMIENTO, 2019-2028, (MILLONES DE USD)

TABLA 160 MERCADO DE VERRUGAS GENITALES EN ITALIA, POR TRATAMIENTO, 2019-2028, (MILLONES DE USD)

TABLA 161 MERCADO DE TRATAMIENTOS NO FARMACOLÓGICOS DE ITALIA EN LAS VERRUGAS GENITALES, POR TRATAMIENTO, 2019-2028, (MILLONES DE USD)

TABLA 162 MERCADO DE VERRUGAS GENITALES EN ITALIA, POR CAUSA, 2019-2028, (MILLONES DE USD)

TABLA 163 MERCADO DE VERRUGAS GENITALES EN ITALIA, POR UBICACIÓN, 2019-2028, (MILLONES DE USD)

TABLA 164 MERCADO DE VERRUGAS GENITALES EN ITALIA, POR GÉNERO, 2019-2028, (MILLONES DE USD)

TABLA 165 MERCADO DE VERRUGAS GENITALES DE ITALIA, POR DOSIS, 2019-2028, (MILLONES DE USD)

TABLA 166 MERCADO DE VERRUGAS GENITALES DE ITALIA, POR USUARIO FINAL, 2019-2028, (MILLONES DE USD)

TABLA 167 MERCADO DE VERRUGAS GENITALES DE ITALIA, POR CANAL DE DISTRIBUCIÓN, 2019-2028, (MILLONES DE USD)

TABLA 168 MERCADO MUNDIAL DE VERRUGAS GENITALES EN ESPAÑA, POR MORFOLOGÍA, 2019-2028 (MILLONES DE USD)

TABLA 169 MERCADO DE VERRUGAS GENITALES EN ESPAÑA, POR TIPO, 2019-2028 (MILLONES DE USD)

TABLA 170 DIAGNÓSTICO EN EL MERCADO DE VERRUGAS GENITALES EN ESPAÑA, POR TIPO, 2019-2028 (MILLONES DE USD)

TABLA 171 MERCADO DE TRATAMIENTO DE LAS VERRUGAS GENITALES EN ESPAÑA, POR TIPO, 2019-2028 (MILLONES DE USD)

TABLA 172 MERCADO DE TRATAMIENTO FARMACOLÓGICO DE LAS VERRUGAS GENITALES EN ESPAÑA, POR TIPO, 2019-2028 (MILLONES DE USD)

CUADRO 173 MERCADO DE VERRUGAS GENITALES EN ESPAÑA, POR TRATAMIENTO, 2019-2028 (MILLONES DE USD)

TABLA 174 MERCADO DE TRATAMIENTOS NO FARMACOLÓGICOS DE LAS VERRUGAS GENITALES EN ESPAÑA, POR TIPO, 2019-2028 (MILLONES DE USD)

CUADRO 175 MERCADO DE VERRUGAS GENITALES EN ESPAÑA, POR CAUSA, 2019-2028 (MILLONES DE USD)

TABLA 176 MERCADO DE VERRUGAS GENITALES EN ESPAÑA, POR UBICACIÓN, 2019-2028 (MILLONES DE USD)

TABLA 177 MERCADO DE VERRUGAS GENITALES EN ESPAÑA, POR GÉNERO, 2019-2028 (MILLONES DE USD)

CUADRO 178 MERCADO DE VERRUGAS GENITALES EN ESPAÑA, POR DOSIS, 2019-2028 (MILLONES DE USD)

TABLA 179 MERCADO DE VERRUGAS GENITALES EN ESPAÑA, POR USUARIO FINAL, 2019-2028 (MILLONES DE USD)

CUADRO 180 MERCADO DE VERRUGAS GENITALES EN ESPAÑA, POR CANAL DE DISTRIBUCIÓN, 2019-2028 (MILLONES DE USD)

CUADRO 181 MERCADO DE VERRUGAS GENITALES DE LOS PAÍSES BAJOS, POR MORFOLOGÍA, 2019-2028 (MILLONES DE USD)

CUADRO 182 MERCADO DE VERRUGAS GENITALES DE LOS PAÍSES BAJOS, POR TIPO, 2019-2028 (MILLONES DE USD)

TABLA 183 DIAGNÓSTICO EN EL MERCADO DE VERRUGAS GENITALES DE LOS PAÍSES BAJOS, POR TIPO, 2019-2028 (MILLONES DE USD)

CUADRO 184 MERCADO DE TRATAMIENTO DE LAS VERRUGAS GENITALES EN LOS PAÍSES BAJOS, POR TIPO, 2019-2028 (MILLONES DE USD)

CUADRO 185 TRATAMIENTO FARMACOLÓGICO DE LOS PAÍSES BAJOS EN EL MERCADO DE LAS VERRUGAS GENITALES, POR TIPO, 2019-2028 (MILLONES DE USD)

CUADRO 186 MERCADO DE VERRUGAS GENITALES DE LOS PAÍSES BAJOS, POR TRATAMIENTO, 2019-2028 (MILLONES DE USD)

CUADRO 187 MERCADO DE TRATAMIENTOS NO FARMACOLÓGICOS DE LOS PAÍSES BAJOS PARA LAS VERRUGAS GENITALES, POR TIPO, 2019-2028 (MILLONES DE USD)

CUADRO 188 MERCADO DE VERRUGAS GENITALES DE LOS PAÍSES BAJOS, POR CAUSA, 2019-2028 (MILLONES DE USD)

CUADRO 189 MERCADO DE VERRUGAS GENITALES DE LOS PAÍSES BAJOS, POR UBICACIÓN, 2019-2028 (MILLONES DE USD)

CUADRO 190 MERCADO DE VERRUGAS GENITALES DE LOS PAÍSES BAJOS, POR GÉNERO, 2019-2028 (MILLONES DE USD)

CUADRO 191 MERCADO DE VERRUGAS GENITALES DE LOS PAÍSES BAJOS, POR DOSIS, 2019-2028 (MILLONES DE USD)

TABLA 192 MERCADO DE VERRUGAS GENITALES DE LOS PAÍSES BAJOS, POR USUARIO FINAL, 2019-2028 (MILLONES DE USD)

CUADRO 193 MERCADO DE VERRUGAS GENITALES DE LOS PAÍSES BAJOS, POR CANAL DE DISTRIBUCIÓN, 2019-2028 (MILLONES DE USD)

CUADRO 194 MERCADO DE VERRUGAS GENITALES EN RUSIA, POR MORFOLOGÍA, 2019-2028 (MILLONES DE USD)

TABLA 195 MERCADO DE VERRUGAS GENITALES DE RUSIA, POR TIPO, 2019-2028 (MILLONES DE USD)

TABLA 196 DIAGNÓSTICO DE RUSIA EN EL MERCADO DE VERRUGAS GENITALES, POR TIPO, 2019-2028 (MILLONES DE USD)

TABLA 197 MERCADO DE TRATAMIENTO DE LAS VERRUGAS GENITALES EN RUSIA, POR TIPO, 2019-2028 (MILLONES DE USD)

TABLA 198 MERCADO DE TRATAMIENTO FARMACOLÓGICO DE LAS VERRUGAS GENITALES EN RUSIA, POR TIPO, 2019-2028 (MILLONES DE USD)

CUADRO 199 MERCADO DE VERRUGAS GENITALES EN RUSIA, POR TRATAMIENTO, 2019-2028 (MILLONES DE USD)

TABLA 200 MERCADO DE TRATAMIENTOS NO FARMACOLÓGICOS DE RUSIA PARA LAS VERRUGAS GENITALES, POR TIPO, 2019-2028 (MILLONES DE USD)

TABLA 201 MERCADO DE VERRUGAS GENITALES DE RUSIA, POR CAUSA, 2019-2028 (MILLONES DE USD)

TABLA 202 MERCADO DE VERRUGAS GENITALES DE RUSIA, POR UBICACIÓN, 2019-2028 (MILLONES DE USD)

TABLA 203 MERCADO DE VERRUGAS GENITALES EN RUSIA, POR GÉNERO, 2019-2028 (MILLONES DE USD)

TABLA 204 MERCADO DE VERRUGAS GENITALES DE RUSIA, POR DOSIS, 2019-2028 (MILLONES DE USD)

TABLA 205 MERCADO DE VERRUGAS GENITALES DE RUSIA, POR USUARIO FINAL, 2019-2028 (MILLONES DE USD)

TABLA 206 MERCADO DE VERRUGAS GENITALES DE RUSIA, POR CANAL DE DISTRIBUCIÓN, 2019-2028 (MILLONES DE USD)

TABLA 207 MERCADO MUNDIAL DE VERRUGAS GENITALES EN SUIZA, POR MORFOLOGÍA, 2019-2028 (MILLONES DE USD)

TABLA 208 MERCADO DE VERRUGAS GENITALES EN SUIZA, POR TIPO, 2019-2028 (MILLONES DE USD)

TABLA 209 DIAGNÓSTICO DEL MERCADO DE VERRUGAS GENITALES EN SUIZA, POR TIPO, 2019-2028 (MILLONES DE USD)

TABLA 210 MERCADO DE TRATAMIENTO DE LAS VERRUGAS GENITALES EN SUIZA, POR TIPO, 2019-2028 (MILLONES DE USD)

TABLA 211 MERCADO DE TRATAMIENTO FARMACOLÓGICO DE LAS VERRUGAS GENITALES EN SUIZA, POR TIPO, 2019-2028 (MILLONES DE USD)

CUADRO 212 MERCADO DE VERRUGAS GENITALES EN SUIZA, POR TRATAMIENTO, 2019-2028 (MILLONES DE USD)

TABLA 213 MERCADO DE TRATAMIENTOS NO FARMACOLÓGICOS DE LAS VERRUGAS GENITALES EN SUIZA, POR TIPO, 2019-2028 (MILLONES DE USD)

TABLA 214 MERCADO DE VERRUGAS GENITALES EN SUIZA, POR CAUSA, 2019-2028 (MILLONES DE USD)

TABLA 215 MERCADO DE VERRUGAS GENITALES EN SUIZA, POR UBICACIÓN, 2019-2028 (MILLONES DE USD)

TABLA 216 MERCADO DE VERRUGAS GENITALES EN SUIZA, POR GÉNERO, 2019-2028 (MILLONES DE USD)

CUADRO 217 MERCADO DE VERRUGAS GENITALES EN SUIZA, POR DOSIS, 2019-2028 (MILLONES DE USD)

TABLA 218 MERCADO DE VERRUGAS GENITALES EN SUIZA, POR USUARIO FINAL, 2019-2028 (MILLONES DE USD)

TABLA 219 MERCADO DE VERRUGAS GENITALES EN SUIZA, POR CANAL DE DISTRIBUCIÓN, 2019-2028 (MILLONES DE USD)

CUADRO 220 MERCADO DE VERRUGAS GENITALES DE TURQUÍA, POR MORFOLOGÍA, 2019-2028 (MILLONES DE USD)

TABLA 221 MERCADO DE VERRUGAS GENITALES DE TURQUÍA, POR TIPO, 2019-2028 (MILLONES DE USD)

TABLA 222 MERCADO DE DIAGNÓSTICO DE VERRUGAS GENITALES EN TURQUÍA, POR TIPO, 2019-2028 (MILLONES DE USD)

TABLA 223 MERCADO DEL TRATAMIENTO DE LAS VERRUGAS GENITALES EN TURQUÍA, POR TIPO, 2019-2028 (MILLONES DE USD)

TABLA 224 MERCADO DE TRATAMIENTO FARMACOLÓGICO DE LAS VERRUGAS GENITALES EN TURQUÍA, POR TIPO, 2019-2028 (MILLONES DE USD)

TABLA 225 MERCADO DE TRATAMIENTO NO FARMACOLÓGICO DE LAS VERRUGAS GENITALES EN TURQUÍA, POR TIPO, 2019-2028 (MILLONES DE USD)

CUADRO 226 MERCADO DE VERRUGAS GENITALES DE TURQUÍA, POR TRATAMIENTO, 2019-2028 (MILLONES DE USD)

TABLA 227 MERCADO DE VERRUGAS GENITALES DE TURQUÍA, POR CAUSA, 2019-2028 (MILLONES DE USD)

TABLA 228 MERCADO DE VERRUGAS GENITALES DE TURQUÍA, POR UBICACIÓN, 2019-2028 (MILLONES DE USD)

TABLA 229 MERCADO DE VERRUGAS GENITALES DE TURQUÍA, POR GÉNERO, 2019-2028 (MILLONES DE USD)

TABLA 230 MERCADO DE VERRUGAS GENITALES DE TURQUÍA, POR DOSIS, 2019-2028 (MILLONES DE USD)

TABLA 231 MERCADO DE VERRUGAS GENITALES DE TURQUÍA, POR USUARIO FINAL, 2019-2028 (MILLONES DE USD)

CUADRO 232 MERCADO DE VERRUGAS GENITALES DE TURQUÍA, POR CANAL DE DISTRIBUCIÓN, 2019-2028 (MILLONES DE USD)

CUADRO 233 MERCADO DE VERRUGAS GENITALES EN AUSTRIA, POR MORFOLOGÍA, 2019-2028 (MILLONES DE USD)

TABLA 234 MERCADO DE VERRUGAS GENITALES EN AUSTRIA, POR TIPO, 2019-2028 (MILLONES DE USD)

TABLA 235 MERCADO DE DIAGNÓSTICO DE VERRUGAS GENITALES EN AUSTRIA, POR TIPO, 2019-2028 (MILLONES DE USD)

TABLA 236 MERCADO DE TRATAMIENTO DE LAS VERRUGAS GENITALES EN AUSTRIA, POR TIPO, 2019-2028 (MILLONES DE USD)

TABLA 237 MERCADO DE TRATAMIENTO FARMACOLÓGICO DE AUSTRIA EN LAS VERRUGAS GENITALES, POR TIPO, 2019-2028 (MILLONES DE USD)

CUADRO 238 MERCADO DE VERRUGAS GENITALES EN AUSTRIA, POR TRATAMIENTO, 2019-2028 (MILLONES DE USD)

TABLA 239 MERCADO DE TRATAMIENTO DE LAS VERRUGAS GENITALES EN AUSTRIA, POR TIPO, 2019-2028 (MILLONES DE USD)

TABLA 240 MERCADO DE VERRUGAS GENITALES EN AUSTRIA, POR CAUSA, 2019-2028 (MILLONES DE USD)

TABLA 241 MERCADO DE VERRUGAS GENITALES EN AUSTRIA, POR UBICACIÓN, 2019-2028 (MILLONES DE USD)

TABLA 242 MERCADO DE VERRUGAS GENITALES EN AUSTRIA, POR GÉNERO, 2019-2028 (MILLONES DE USD)

CUADRO 243 MERCADO DE VERRUGAS GENITALES EN AUSTRIA, POR DOSIS, 2019-2028 (MILLONES DE USD)

TABLA 244 MERCADO DE VERRUGAS GENITALES EN AUSTRIA, POR USUARIO FINAL, 2019-2028 (MILLONES DE USD)

CUADRO 245 MERCADO DE VERRUGAS GENITALES EN AUSTRIA, POR CANAL DE DISTRIBUCIÓN, 2019-2028 (MILLONES DE USD)

CUADRO 246 MERCADO DE VERRUGAS GENITALES DE NORUEGA, POR MORFOLOGÍA, 2019-2028 (MILLONES DE USD)

TABLA 247 MERCADO DE VERRUGAS GENITALES DE NORUEGA, POR TIPO, 2019-2028 (MILLONES DE USD)

TABLA 248 NORUEGA DIAGNÓSTICO EN EL MERCADO DE VERRUGAS GENITALES, POR TIPO, 2019-2028 (MILLONES DE USD)

TABLA 249 MERCADO DE TRATAMIENTO DE LAS VERRUGAS GENITALES EN NORUEGA, POR TIPO, 2019-2028 (MILLONES DE USD)

TABLA 250 NORUEGA TRATAMIENTO FARMACOLÓGICO EN EL MERCADO DE VERRUGAS GENITALES, POR TIPO, 2019-2028 (MILLONES DE USD)

CUADRO 251 MERCADO DE VERRUGAS GENITALES DE NORUEGA, POR TRATAMIENTO, 2019-2028 (MILLONES DE USD)

TABLA 252 MERCADO DE TRATAMIENTOS NO FARMACOLÓGICOS EN LAS VERRUGAS GENITALES DE NORUEGA, POR TIPO, 2019-2028 (MILLONES DE USD)

CUADRO 253 MERCADO DE VERRUGAS GENITALES DE NORUEGA, POR CAUSA, 2019-2028 (MILLONES DE USD)

TABLA 254 MERCADO DE VERRUGAS GENITALES DE NORUEGA, POR UBICACIÓN, 2019-2028 (MILLONES DE USD)

CUADRO 255 ​​MERCADO DE VERRUGAS GENITALES DE NORUEGA, POR GÉNERO, 2019-2028 (MILLONES DE USD)

CUADRO 256 MERCADO DE VERRUGAS GENITALES DE NORUEGA, POR DOSIS, 2019-2028 (MILLONES DE USD)

TABLA 257 MERCADO DE VERRUGAS GENITALES DE NORUEGA, POR USUARIO FINAL, 2019-2028 (MILLONES DE USD)

CUADRO 258 MERCADO DE VERRUGAS GENITALES DE NORUEGA, POR CANAL DE DISTRIBUCIÓN, 2019-2028 (MILLONES DE USD)

CUADRO 259 MERCADO DE VERRUGAS GENITALES DE HUNGRÍA, POR MORFOLOGÍA, 2019-2028 (MILLONES DE USD)

TABLA 260 MERCADO DE VERRUGAS GENITALES DE HUNGRÍA, POR TIPO, 2019-2028 (MILLONES DE USD)

TABLA 261 MERCADO DE DIAGNÓSTICO DE VERRUGAS GENITALES DE HUNGRÍA, POR TIPO, 2019-2028 (MILLONES DE USD)

TABLA 262 MERCADO DE TRATAMIENTO DE LAS VERRUGAS GENITALES EN HUNGRÍA, POR TIPO, 2019-2028 (MILLONES DE USD)

CUADRO 263 TRATAMIENTO FARMACOLÓGICO DE HUNGRÍA EN EL MERCADO DE VERRUGAS GENITALES, POR TIPO, 2019-2028 (MILLONES DE USD)

CUADRO 264 MERCADO DE VERRUGAS GENITALES DE HUNGRÍA, POR TRATAMIENTO, 2019-2028 (MILLONES DE USD)

TABLA 265 MERCADO DE TRATAMIENTOS NO FARMACOLÓGICOS DE HUNGRÍA PARA LAS VERRUGAS GENITALES, POR TIPO, 2019-2028 (MILLONES DE USD)

CUADRO 266 MERCADO DE VERRUGAS GENITALES DE HUNGRÍA, POR CAUSA, 2019-2028 (MILLONES DE USD)

TABLA 267 MERCADO DE VERRUGAS GENITALES DE HUNGRÍA, POR UBICACIÓN, 2019-2028 (MILLONES DE USD)

CUADRO 268 MERCADO DE VERRUGAS GENITALES DE HUNGRÍA, POR GÉNERO, 2019-2028 (MILLONES DE USD)

CUADRO 269 MERCADO DE VERRUGAS GENITALES DE HUNGRÍA, POR DOSIS, 2019-2028 (MILLONES DE USD)

TABLA 270 MERCADO DE VERRUGAS GENITALES DE HUNGRÍA, POR USUARIO FINAL, 2019-2028 (MILLONES DE USD)

CUADRO 271 MERCADO DE VERRUGAS GENITALES DE HUNGRÍA, POR CANAL DE DISTRIBUCIÓN, 2019-2028 (MILLONES DE USD)

CUADRO 272 MERCADO DE VERRUGAS GENITALES DE LITUANIA, POR MORFOLOGÍA, 2019-2028 (MILLONES DE USD)

TABLA 273 MERCADO DE VERRUGAS GENITALES DE LITUANIA, POR TIPO, 2019-2028 (MILLONES DE USD)

TABLA 274 LITUANIA DIAGNÓSTICO EN EL MERCADO DE VERRUGAS GENITALES, POR TIPO, 2019-2028 (MILLONES DE USD)

CUADRO 275 MERCADO DE TRATAMIENTO DE LAS VERRUGAS GENITALES EN LITUANIA, POR TIPO, 2019-2028 (MILLONES DE USD)

CUADRO 276 MERCADO DE TRATAMIENTO FARMACOLÓGICO DE LITUANIA EN LAS VERRUGAS GENITALES, POR TIPO, 2019-2028 (MILLONES DE USD)

CUADRO 277 MERCADO DE VERRUGAS GENITALES DE LITUANIA, POR TRATAMIENTO, 2019-2028 (MILLONES DE USD)

TABLA 278 MERCADO DE TRATAMIENTOS NO FARMACOLÓGICOS DE LITUANIA PARA LAS VERRUGAS GENITALES, POR TIPO, 2019-2028 (MILLONES DE USD)

CUADRO 279 MERCADO DE VERRUGAS GENITALES DE LITUANIA, POR CAUSA, 2019-2028 (MILLONES DE USD)

TABLA 280 MERCADO DE VERRUGAS GENITALES DE LITUANIA, POR UBICACIÓN, 2019-2028 (MILLONES DE USD)

CUADRO 281 MERCADO DE VERRUGAS GENITALES DE LITUANIA, POR GÉNERO, 2019-2028 (MILLONES DE USD)

CUADRO 282 MERCADO DE VERRUGAS GENITALES DE LITUANIA, POR DOSIS, 2019-2028 (MILLONES DE USD)

TABLA 283 MERCADO DE VERRUGAS GENITALES DE LITUANIA, POR USUARIO FINAL, 2019-2028 (MILLONES DE USD)

CUADRO 284 MERCADO DE VERRUGAS GENITALES DE LITUANIA, POR CANAL DE DISTRIBUCIÓN, 2019-2028 (MILLONES DE USD)

CUADRO 285 MERCADO DE VERRUGAS GENITALES DE IRLANDA, POR MORFOLOGÍA, 2019-2028 (MILLONES DE USD)

TABLA 286 MERCADO DE VERRUGAS GENITALES DE IRLANDA, POR TIPO, 2019-2028 (MILLONES DE USD)

TABLA 287 MERCADO DE DIAGNÓSTICO DE VERRUGAS GENITALES DE IRLANDA, POR TIPO, 2019-2028 (MILLONES DE USD)

TABLA 288 MERCADO DE TRATAMIENTO DE LAS VERRUGAS GENITALES EN IRLANDA, POR TIPO, 2019-2028 (MILLONES DE USD)

TABLA 289 MERCADO DE TRATAMIENTO FARMACOLÓGICO DE LAS VERRUGAS GENITALES EN IRLANDA, POR TIPO, 2019-2028 (MILLONES DE USD)

CUADRO 290 MERCADO DE VERRUGAS GENITALES DE IRLANDA, POR TRATAMIENTO, 2019-2028 (MILLONES DE USD)

TABLA 291 MERCADO DE TRATAMIENTOS NO FARMACOLÓGICOS DE LAS VERRUGAS GENITALES DE IRLANDA, POR TIPO, 2019-2028 (MILLONES DE USD)

TABLA 292 MERCADO DE VERRUGAS GENITALES DE IRLANDA, POR CAUSA, 2019-2028 (MILLONES DE USD)

TABLA 293 MERCADO DE VERRUGAS GENITALES DE IRLANDA, POR UBICACIÓN, 2019-2028 (MILLONES DE USD)

TABLA 294 MERCADO DE VERRUGAS GENITALES DE IRLANDA, POR GÉNERO, 2019-2028 (MILLONES DE USD)

TABLA 295 MERCADO DE VERRUGAS GENITALES DE IRLANDA, POR DOSIS, 2019-2028 (MILLONES DE USD)

TABLA 296 MERCADO DE VERRUGAS GENITALES DE IRLANDA, POR USUARIO FINAL, 2019-2028 (MILLONES DE USD)

TABLA 297 MERCADO DE VERRUGAS GENITALES DE IRLANDA, POR CANAL DE DISTRIBUCIÓN, 2019-2028 (MILLONES DE USD)

CUADRO 298 MERCADO DE VERRUGAS GENITALES DE POLONIA, POR MORFOLOGÍA, 2019-2028 (MILLONES DE USD)

TABLA 299 MERCADO DE VERRUGAS GENITALES DE POLONIA, POR TIPO, 2019-2028 (MILLONES DE USD)

TABLA 300 MERCADO DE DIAGNÓSTICO DE VERRUGAS GENITALES DE POLONIA, POR TIPO, 2019-2028 (MILLONES DE USD)

TABLA 301 MERCADO DE TRATAMIENTO DE LAS VERRUGAS GENITALES EN POLONIA, POR TIPO, 2019-2028 (MILLONES DE USD)

TABLA 302 MERCADO DE TRATAMIENTO FARMACOLÓGICO DE POLONIA PARA LAS VERRUGAS GENITALES, POR TIPO, 2019-2028 (MILLONES DE USD)

CUADRO 303 MERCADO DE VERRUGAS GENITALES DE POLONIA, POR TRATAMIENTO, 2019-2028 (MILLONES DE USD)

TABLA 304 MERCADO DE TRATAMIENTOS NO FARMACOLÓGICOS DE POLONIA PARA LAS VERRUGAS GENITALES, POR TIPO, 2019-2028 (MILLONES DE USD)

TABLA 305 MERCADO DE VERRUGAS GENITALES DE POLONIA, POR CAUSA, 2019-2028 (MILLONES DE USD)

TABLA 306 MERCADO DE VERRUGAS GENITALES DE POLONIA, POR UBICACIÓN, 2019-2028 (MILLONES DE USD)

TABLA 307 MERCADO DE VERRUGAS GENITALES DE POLONIA, POR GÉNERO, 2019-2028 (MILLONES DE USD)

TABLA 308 MERCADO DE VERRUGAS GENITALES DE POLONIA, POR DOSIS, 2019-2028 (MILLONES DE USD)

TABLA 309 MERCADO DE VERRUGAS GENITALES DE POLONIA, POR USUARIO FINAL, 2019-2028 (MILLONES DE USD)

TABLA 310 MERCADO DE VERRUGAS GENITALES DE POLONIA, POR CANAL DE DISTRIBUCIÓN, 2019-2028 (MILLONES DE USD)

TABLA 311 MERCADO MUNDIAL DE VERRUGAS GENITALES DEL RESTO DE EUROPA, POR MORFOLOGÍA, 2019-2028 (MILLONES DE USD)

CUADRO 312 MERCADO DE VERRUGAS GENITALES DE ASIA Y EL PACÍFICO, POR PAÍS, 2019-2028 (MILLONES DE USD)

CUADRO 313 MERCADO DE VERRUGAS GENITALES DE ASIA Y EL PACÍFICO, POR MORFOLOGÍA, 2019-2028 (MILLONES DE USD)

TABLA 314 MERCADO DE VERRUGAS GENITALES DE ASIA Y EL PACÍFICO, POR TIPO, 2019-2028 (MILLONES DE USD)

TABLA 315 MERCADO DE DIAGNÓSTICO DE VERRUGAS GENITALES EN ASIA Y PACÍFICO, POR TIPO, 2019-2028 (MILLONES DE USD)

TABLA 316 MERCADO DE TRATAMIENTO DE LAS VERRUGAS GENITALES EN ASIA Y EL PACÍFICO, POR TIPO, 2019-2028 (MILLONES DE USD)

TABLA 317 MERCADO DE TRATAMIENTO FARMACOLÓGICO DE LAS VERRUGAS GENITALES EN ASIA Y EL PACÍFICO, POR TIPO, 2019-2028 (MILLONES DE USD)

CUADRO 318 MERCADO DE VERRUGAS GENITALES DE ASIA Y EL PACÍFICO, POR TRATAMIENTO, 2019-2028 (MILLONES DE USD)

TABLA 319 MERCADO DE GARDASIL EN LAS VERRUGAS GENITALES DE ASIA Y EL PACÍFICO, POR PAÍS, 2019-2028 (MILLONES DE USD)

CUADRO 320 MERCADO DE CERVARIX EN LAS VERRUGAS GENITALES DE ASIA Y EL PACÍFICO, POR TRATAMIENTO, 2019-2028 (MILLONES DE USD)

TABLA 321 MERCADO DE TRATAMIENTO NO FARMACOLÓGICO DE LAS VERRUGAS GENITALES EN ASIA Y EL PACÍFICO, POR TIPO, 2019-2028 (MILLONES DE USD)

CUADRO 322 MERCADO DE VERRUGAS GENITALES DE ASIA Y EL PACÍFICO, POR CAUSA, 2019-2028 (MILLONES DE USD)

CUADRO 323 MERCADO DE VERRUGAS GENITALES DE ASIA Y EL PACÍFICO, POR UBICACIÓN, 2019-2028 (MILLONES DE USD)

CUADRO 324 MERCADO DE VERRUGAS GENITALES DE ASIA Y EL PACÍFICO, POR GÉNERO, 2019-2028 (MILLONES DE USD)

CUADRO 325 MERCADO DE VERRUGAS GENITALES DE ASIA Y EL PACÍFICO, POR DOSIS, 2019-2028 (MILLONES DE USD)

TABLA 326 MERCADO DE VERRUGAS GENITALES DE ASIA Y EL PACÍFICO, POR USUARIO FINAL, 2019-2028 (MILLONES DE USD)

CUADRO 327 MERCADO DE VERRUGAS GENITALES DE ASIA Y EL PACÍFICO, POR CANAL DE DISTRIBUCIÓN, 2019-2028 (MILLONES DE USD)

CUADRO 328 MERCADO DE VERRUGAS GENITALES EN JAPÓN, POR MORFOLOGÍA, 2019-2028 (MILLONES DE USD)

TABLA 329 MERCADO DE VERRUGAS GENITALES EN JAPÓN, POR TIPO, 2019-2028 (MILLONES DE USD)

TABLA 330 MERCADO DE DIAGNÓSTICO DE VERRUGAS GENITALES EN JAPÓN, POR TIPO, 2019-2028 (MILLONES DE USD)

TABLA 331 MERCADO JAPÓN DE TRATAMIENTO DE LAS VERRUGAS GENITALES, POR TIPO, 2019-2028 (MILLONES DE USD)

CUADRO 332 TRATAMIENTO FARMACOLÓGICO EN EL MERCADO DE LAS VERRUGAS GENITALES EN JAPÓN, POR TIPO, 2019-2028 (MILLONES DE USD)

CUADRO 333 MERCADO DE VERRUGAS GENITALES EN JAPÓN, POR TRATAMIENTO, 2019-2028 (MILLONES DE USD)

TABLA 334 MERCADO DE TRATAMIENTOS NO FARMACOLÓGICOS EN JAPÓN PARA LAS VERRUGAS GENITALES, POR TIPO, 2019-2028 (MILLONES DE USD)

TABLA 335 MERCADO DE VERRUGAS GENITALES EN JAPÓN, POR CAUSA, 2019-2028 (MILLONES DE USD)

TABLA 336 MERCADO DE VERRUGAS GENITALES EN JAPÓN, POR UBICACIÓN, 2019-2028 (MILLONES DE USD)

TABLA 337 MERCADO DE VERRUGAS GENITALES EN JAPÓN, POR GÉNERO, 2019-2028 (MILLONES DE USD)

CUADRO 338 MERCADO DE VERRUGAS GENITALES EN JAPÓN, POR DOSIS, 2019-2028 (MILLONES DE USD)

TABLA 339 MERCADO DE VERRUGAS GENITALES EN JAPÓN, POR USUARIO FINAL, 2019-2028 (MILLONES DE USD)

CUADRO 340 MERCADO DE VERRUGAS GENITALES EN JAPÓN, POR CANAL DE DISTRIBUCIÓN, 2019-2028 (MILLONES DE USD)

CUADRO 341 MERCADO CHINA DE VERRUGAS GENITALES, POR MORFOLOGÍA, 2019-2028 (MILLONES DE USD)

TABLA 342 MERCADO CHINA DE VERRUGAS GENITALES, POR TIPO, 2019-2028 (MILLONES DE USD)

TABLA 343 MERCADO CHINA DE DIAGNÓSTICO EN VERRUGAS GENITALES, POR TIPO, 2019-2028 (MILLONES DE USD)

CUADRO 344 MERCADO CHINA DE TRATAMIENTO DE LAS VERRUGAS GENITALES, POR TIPO, 2019-2028 (MILLONES DE USD)

CUADRO 345 MERCADO DE TRATAMIENTO FARMACOLÓGICO DE LAS VERRUGAS GENITALES EN CHINA, POR TIPO, 2019-2028 (MILLONES DE USD)

CUADRO 346 MERCADO CHINA DE VERRUGAS GENITALES, POR TRATAMIENTO, 2019-2028 (MILLONES DE USD)

CUADRO 347 MERCADO CHINA DE TRATAMIENTO DE LAS VERRUGAS GENITALES, POR TIPO, 2019-2028 (MILLONES DE USD)

CUADRO 348 MERCADO CHINA DE VERRUGAS GENITALES, POR CAUSA, 2019-2028 (MILLONES DE USD)

CUADRO 349 MERCADO DE VERRUGAS GENITALES DE CHINA, POR UBICACIÓN, 2019-2028 (MILLONES DE USD)

CUADRO 350 MERCADO CHINA DE VERRUGAS GENITALES, POR GÉNERO, 2019-2028 (MILLONES DE USD)

CUADRO 351 MERCADO CHINA DE VERRUGAS GENITALES, POR DOSIS, 2019-2028 (MILLONES DE USD)

TABLA 352 MERCADO CHINA DE VERRUGAS GENITALES, POR USUARIO FINAL, 2019-2028 (MILLONES DE USD)

CUADRO 353 MERCADO DE VERRUGAS GENITALES DE CHINA, POR CANAL DE DISTRIBUCIÓN, 2019-2028 (MILLONES DE USD)

CUADRO 354 MERCADO DE VERRUGAS GENITALES DE COREA DEL SUR, POR MORFOLOGÍA, 2019-2028 (MILLONES DE USD)

TABLA 355 MERCADO DE VERRUGAS GENITALES DE COREA DEL SUR, POR TIPO, 2019-2028 (MILLONES DE USD)

TABLA 356 MERCADO DE DIAGNÓSTICO DE VERRUGAS GENITALES EN COREA DEL SUR, POR TIPO, 2019-2028 (MILLONES DE USD)

CUADRO 357 MERCADO DE TRATAMIENTO DE LAS VERRUGAS GENITALES EN COREA DEL SUR, POR TIPO, 2019-2028 (MILLONES DE USD)

CUADRO 358 MERCADO DE TRATAMIENTO FARMACOLÓGICO DE COREA DEL SUR EN LAS VERRUGAS GENITALES, POR TIPO, 2019-2028 (MILLONES DE USD)

CUADRO 359 MERCADO DE VERRUGAS GENITALES DE COREA DEL SUR, POR TRATAMIENTO, 2019-2028 (MILLONES DE USD)

TABLA 360 MERCADO DE TRATAMIENTOS NO FARMACOLÓGICOS DE COREA DEL SUR PARA LAS VERRUGAS GENITALES, POR TIPO, 2019-2028 (MILLONES DE USD)

CUADRO 361 MERCADO DE VERRUGAS GENITALES DE COREA DEL SUR, POR CAUSA, 2019-2028 (MILLONES DE USD)

CUADRO 362 MERCADO DE VERRUGAS GENITALES DE COREA DEL SUR, POR UBICACIÓN, 2019-2028 (MILLONES DE USD)

CUADRO 363 MERCADO DE VERRUGAS GENITALES DE COREA DEL SUR, POR GÉNERO, 2019-2028 (MILLONES DE USD)

CUADRO 364 MERCADO DE VERRUGAS GENITALES DE COREA DEL SUR, POR DOSIS, 2019-2028 (MILLONES DE USD)

TABLA 365 MERCADO DE VERRUGAS GENITALES DE COREA DEL SUR, POR USUARIO FINAL, 2019-2028 (MILLONES DE USD)

CUADRO 366 MERCADO DE VERRUGAS GENITALES DE COREA DEL SUR, POR CANAL DE DISTRIBUCIÓN, 2019-2028 (MILLONES DE USD)

CUADRO 367 MERCADO DE VERRUGAS GENITALES DE LA INDIA, POR MORFOLOGÍA, 2019-2028 (MILLONES DE USD)

TABLA 368 MERCADO DE VERRUGAS GENITALES DE LA INDIA, POR TIPO, 2019-2028 (MILLONES DE USD)

TABLA 369 DIAGNÓSTICO DE LA INDIA EN EL MERCADO DE VERRUGAS GENITALES, POR TIPO, 2019-2028 (MILLONES DE USD)

CUADRO 370 TRATAMIENTO DE LA INDIA EN EL MERCADO DE VERRUGAS GENITALES, POR TIPO, 2019-2028 (MILLONES DE USD)

CUADRO 371 MERCADO DE TRATAMIENTO FARMACOLÓGICO DE LA INDIA EN LAS VERRUGAS GENITALES, POR TIPO, 2019-2028 (MILLONES DE USD)

CUADRO 372 MERCADO DE VERRUGAS GENITALES DE LA INDIA, POR TRATAMIENTO, 2019-2028 (MILLONES DE USD)

CUADRO 373 MERCADO DE TRATAMIENTOS NO FARMACOLÓGICOS DE LA INDIA PARA LAS VERRUGAS GENITALES, POR TIPO, 2019-2028 (MILLONES DE USD)

CUADRO 374 MERCADO DE VERRUGAS GENITALES DE LA INDIA, POR CAUSA, 2019-2028 (MILLONES DE USD)

CUADRO 375 MERCADO DE VERRUGAS GENITALES DE LA INDIA, POR UBICACIÓN, 2019-2028 (MILLONES DE USD)

CUADRO 376 MERCADO DE VERRUGAS GENITALES DE LA INDIA, POR GÉNERO, 2019-2028 (MILLONES DE USD)

CUADRO 377 MERCADO DE VERRUGAS GENITALES DE LA INDIA, POR DOSIS, 2019-2028 (MILLONES DE USD)

TABLA 378 MERCADO DE VERRUGAS GENITALES DE LA INDIA, POR USUARIO FINAL, 2019-2028 (MILLONES DE USD)

CUADRO 379 MERCADO DE VERRUGAS GENITALES DE LA INDIA, POR CANAL DE DISTRIBUCIÓN, 2019-2028 (MILLONES DE USD)

CUADRO 380 MERCADO DE VERRUGAS GENITALES DE AUSTRALIA, POR MORFOLOGÍA, 2019-2028 (MILLONES DE USD)

TABLA 381 MERCADO DE VERRUGAS GENITALES DE AUSTRALIA, POR TIPO, 2019-2028 (MILLONES DE USD)

TABLA 382 MERCADO DE DIAGNÓSTICO DE VERRUGAS GENITALES EN AUSTRALIA, POR TIPO, 2019-2028 (MILLONES DE USD)

CUADRO 383 MERCADO DE TRATAMIENTO DE LAS VERRUGAS GENITALES EN AUSTRALIA, POR TIPO, 2019-2028 (MILLONES DE USD)

CUADRO 384 MERCADO DE TRATAMIENTO FARMACOLÓGICO DE LAS VERRUGAS GENITALES EN AUSTRALIA, POR TIPO, 2019-2028 (MILLONES DE USD)

CUADRO 385 MERCADO DE VERRUGAS GENITALES DE AUSTRALIA, POR TRATAMIENTO, 2019-2028 (MILLONES DE USD)

CUADRO 386 MERCADO DE TRATAMIENTOS NO FARMACOLÓGICOS DE AUSTRALIA PARA LAS VERRUGAS GENITALES, POR TIPO, 2019-2028 (MILLONES DE USD)

TABLA 387 MERCADO DE VERRUGAS GENITALES DE AUSTRALIA, POR CAUSA, 2019-2028 (MILLONES DE USD)

TABLA 388 MERCADO DE VERRUGAS GENITALES DE AUSTRALIA, POR UBICACIÓN, 2019-2028 (MILLONES DE USD)

CUADRO 389 MERCADO DE VERRUGAS GENITALES DE AUSTRALIA, POR GÉNERO, 2019-2028 (MILLONES DE USD)

CUADRO 390 MERCADO DE VERRUGAS GENITALES DE AUSTRALIA, POR DOSIS, 2019-2028 (MILLONES DE USD)

TABLA 391 MERCADO DE VERRUGAS GENITALES DE AUSTRALIA, POR USUARIO FINAL, 2019-2028 (MILLONES DE USD)

CUADRO 392 MERCADO DE VERRUGAS GENITALES DE AUSTRALIA, POR CANAL DE DISTRIBUCIÓN, 2019-2028 (MILLONES DE USD)

CUADRO 393 MERCADO DE VERRUGAS GENITALES DE SINGAPUR, POR MORFOLOGÍA, 2019-2028 (MILLONES DE USD)

CUADRO 394 MERCADO DE VERRUGAS GENITALES DE SINGAPUR, POR TIPO, 2019-2028 (MILLONES DE USD)

TABLA 395 DIAGNÓSTICO DE SINGAPUR EN EL MERCADO DE VERRUGAS GENITALES, POR TIPO, 2019-2028 (MILLONES DE USD)

CUADRO 396 MERCADO DE TRATAMIENTO DE LAS VERRUGAS GENITALES DE SINGAPUR, POR TIPO, 2019-2028 (MILLONES DE USD)

CUADRO 397 MERCADO DE TRATAMIENTO FARMACOLÓGICO DE LAS VERRUGAS GENITALES DE SINGAPUR, POR TIPO, 2019-2028 (MILLONES DE USD)

CUADRO 398 MERCADO DE VERRUGAS GENITALES DE SINGAPUR, POR TRATAMIENTO, 2019-2028 (MILLONES DE USD)

TABLA 399 MERCADO DE TRATAMIENTOS NO FARMACOLÓGICOS DE LAS VERRUGAS GENITALES DE SINGAPUR, POR TIPO, 2019-2028 (MILLONES DE USD)

TABLA 400 MERCADO DE VERRUGAS GENITALES DE SINGAPUR, POR CAUSA, 2019-2028 (MILLONES DE USD)

TABLA 401 MERCADO DE VERRUGAS GENITALES DE SINGAPUR, POR UBICACIÓN, 2019-2028 (MILLONES DE USD)

TABLA 402 MERCADO DE VERRUGAS GENITALES DE SINGAPUR, POR GÉNERO, 2019-2028 (MILLONES DE USD)

CUADRO 403 MERCADO DE VERRUGAS GENITALES DE SINGAPUR, POR DOSIS, 2019-2028 (MILLONES DE USD)

TABLA 404 MERCADO DE VERRUGAS GENITALES DE SINGAPUR, POR USUARIO FINAL, 2019-2028 (MILLONES DE USD)

TABLA 405 MERCADO DE VERRUGAS GENITALES DE SINGAPUR, POR CANAL DE DISTRIBUCIÓN, 2019-2028 (MILLONES DE USD)

TABLA 406 MERCADO DE VERRUGAS GENITALES DE TAILANDIA, POR MORFOLOGÍA, 2019-2028 (MILLONES DE USD)

TABLA 407 MERCADO DE VERRUGAS GENITALES DE TAILANDIA, POR TIPO, 2019-2028 (MILLONES DE USD)

TABLA 408 DIAGNÓSTICO DE TAILANDIA EN EL MERCADO DE VERRUGAS GENITALES, POR TIPO, 2019-2028 (MILLONES DE USD)

TABLA 409 TRATAMIENTO DE TAILANDIA EN EL MERCADO DE VERRUGAS GENITALES, POR TIPO, 2019-2028 (MILLONES DE USD)

TABLA 410 TRATAMIENTO FARMACOLÓGICO DE TAILANDIA EN EL MERCADO DE VERRUGAS GENITALES, POR TIPO, 2019-2028 (MILLONES DE USD)

CUADRO 411 MERCADO DE VERRUGAS GENITALES DE TAILANDIA, POR TRATAMIENTO, 2019-2028 (MILLONES DE USD)

TABLA 412 MERCADO DE TRATAMIENTOS NO FARMACOLÓGICOS DE TAILANDIA PARA LAS VERRUGAS GENITALES, POR TIPO, 2019-2028 (MILLONES DE USD)

TABLA 413 MERCADO DE VERRUGAS GENITALES DE TAILANDIA, POR CAUSA, 2019-2028 (MILLONES DE USD)

TABLA 414 MERCADO DE VERRUGAS GENITALES DE TAILANDIA, POR UBICACIÓN, 2019-2028 (MILLONES DE USD)

TABLA 415 MERCADO DE VERRUGAS GENITALES DE TAILANDIA, POR GÉNERO, 2019-2028 (MILLONES DE USD)

TABLA 416 MERCADO DE VERRUGAS GENITALES DE TAILANDIA, POR DOSIS, 2019-2028 (MILLONES DE USD)

TABLA 417 MERCADO DE VERRUGAS GENITALES DE TAILANDIA, POR USUARIO FINAL, 2019-2028 (MILLONES DE USD)

TABLA 418 MERCADO DE VERRUGAS GENITALES DE TAILANDIA, POR CANAL DE DISTRIBUCIÓN, 2019-2028 (MILLONES DE USD)

TABLA 419 MERCADO DE VERRUGAS GENITALES DE MALASIA, POR MORFOLOGÍA, 2019-2028 (MILLONES DE USD)

TABLA 420 MERCADO DE VERRUGAS GENITALES DE MALASIA, POR TIPO, 2019-2028 (MILLONES DE USD)

TABLA 421 MERCADO DE DIAGNÓSTICO DE VERRUGAS GENITALES DE MALASIA, POR TIPO, 2019-2028 (MILLONES DE USD)

TABLA 422 MERCADO DE TRATAMIENTO DE LAS VERRUGAS GENITALES EN MALASIA, POR TIPO, 2019-2028 (MILLONES DE USD)

CUADRO 423 TRATAMIENTO FARMACOLÓGICO DE MALASIA EN EL MERCADO DE VERRUGAS GENITALES, POR TIPO, 2019-2028 (MILLONES DE USD)

CUADRO 424 MERCADO DE VERRUGAS GENITALES DE MALASIA, POR TRATAMIENTO, 2019-2028 (MILLONES DE USD)

TABLA 425 MERCADO DE TRATAMIENTOS NO FARMACOLÓGICOS DE MALASIA PARA LAS VERRUGAS GENITALES, POR TIPO, 2019-2028 (MILLONES DE USD)

TABLA 426 MERCADO DE VERRUGAS GENITALES DE MALASIA, POR CAUSA, 2019-2028 (MILLONES DE USD)

TABLA 427 MERCADO DE VERRUGAS GENITALES DE MALASIA, POR UBICACIÓN, 2019-2028 (MILLONES DE USD)

TABLA 428 MERCADO DE VERRUGAS GENITALES DE MALASIA, POR GÉNERO, 2019-2028 (MILLONES DE USD)

TABLA 429 MERCADO DE VERRUGAS GENITALES DE MALASIA, POR DOSIS, 2019-2028 (MILLONES DE USD)

TABLA 430 MERCADO DE VERRUGAS GENITALES DE MALASIA, POR USUARIO FINAL, 2019-2028 (MILLONES DE USD)

TABLA 431 MERCADO DE VERRUGAS GENITALES DE MALASIA, POR CANAL DE DISTRIBUCIÓN, 2019-2028 (MILLONES DE USD)

CUADRO 432 MERCADO DE VERRUGAS GENITALES DE INDONESIA, POR MORFOLOGÍA, 2019-2028 (MILLONES DE USD)

TABLA 433 MERCADO DE VERRUGAS GENITALES DE INDONESIA, POR TIPO, 2019-2028 (MILLONES DE USD)

TABLA 434 DIAGNÓSTICO DE INDONESIA EN EL MERCADO DE VERRUGAS GENITALES, POR TIPO, 2019-2028 (MILLONES DE USD)

TABLA 435 TRATAMIENTO DE INDONESIA EN EL MERCADO DE VERRUGAS GENITALES, POR TIPO, 2019-2028 (MILLONES DE USD)

TABLA 436 TRATAMIENTO FARMACOLÓGICO DE INDONESIA EN EL MERCADO DE VERRUGAS GENITALES, POR TIPO, 2019-2028 (MILLONES DE USD)

CUADRO 437 MERCADO DE VERRUGAS GENITALES DE INDONESIA, POR TRATAMIENTO, 2019-2028 (MILLONES DE USD)

TABLA 438 MERCADO DE TRATAMIENTO NO FARMACOLÓGICO DE LAS VERRUGAS GENITALES EN INDONESIA, POR TIPO, 2019-2028 (MILLONES DE USD)

TABLA 439 MERCADO DE VERRUGAS GENITALES DE INDONESIA, POR CAUSA, 2019-2028 (MILLONES DE USD)

TABLA 440 MERCADO DE VERRUGAS GENITALES DE INDONESIA, POR UBICACIÓN, 2019-2028 (MILLONES DE USD)

CUADRO 441 MERCADO DE VERRUGAS GENITALES DE INDONESIA, POR GÉNERO, 2019-2028 (MILLONES DE USD)

CUADRO 442 MERCADO DE VERRUGAS GENITALES DE INDONESIA, POR DOSIS, 2019-2028 (MILLONES DE USD)

TABLA 443 MERCADO DE VERRUGAS GENITALES DE INDONESIA, POR USUARIO FINAL, 2019-2028 (MILLONES DE USD)

CUADRO 444 MERCADO DE VERRUGAS GENITALES DE INDONESIA, POR CANAL DE DISTRIBUCIÓN, 2019-2028 (MILLONES DE USD)

CUADRO 445 MERCADO DE VERRUGAS GENITALES EN FILIPINAS, POR MORFOLOGÍA, 2019-2028 (MILLONES DE USD)

TABLA 446 MERCADO DE VERRUGAS GENITALES DE FILIPINAS, POR TIPO, 2019-2028 (MILLONES DE USD)

TABLA 447 FILIPINAS DIAGNÓSTICO EN EL MERCADO DE VERRUGAS GENITALES, POR TIPO, 2019-2028 (MILLONES DE USD)

CUADRO 448 TRATAMIENTO DE FILIPINAS EN EL MERCADO DE VERRUGAS GENITALES, POR TIPO, 2019-2028 (MILLONES DE USD)

CUADRO 449 MERCADO DE TRATAMIENTO FARMACOLÓGICO DE LAS VERRUGAS GENITALES EN FILIPINAS, POR TIPO, 2019-2028 (MILLONES DE USD)

CUADRO 450 MERCADO DE VERRUGAS GENITALES EN FILIPINAS, POR TRATAMIENTO, 2019-2028 (MILLONES DE USD)

CUADRO 451 MERCADO DE TRATAMIENTOS NO FARMACOLÓGICOS DE LAS VERRUGAS GENITALES EN FILIPINAS, POR TIPO, 2019-2028 (MILLONES DE USD)

CUADRO 452 MERCADO DE VERRUGAS GENITALES EN FILIPINAS, POR CAUSA, 2019-2028 (MILLONES DE USD)

CUADRO 453 MERCADO DE VERRUGAS GENITALES EN FILIPINAS, POR UBICACIÓN, 2019-2028 (MILLONES DE USD)

CUADRO 454 MERCADO DE VERRUGAS GENITALES EN FILIPINAS, POR GÉNERO, 2019-2028 (MILLONES DE USD)

CUADRO 455 MERCADO DE VERRUGAS GENITALES EN FILIPINAS, POR DOSIS, 2019-2028 (MILLONES DE USD)

TABLA 456 MERCADO DE VERRUGAS GENITALES EN FILIPINAS, POR USUARIO FINAL, 2019-2028 (MILLONES DE USD)

CUADRO 457 MERCADO DE VERRUGAS GENITALES EN FILIPINAS, POR CANAL DE DISTRIBUCIÓN, 2019-2028 (MILLONES DE USD)

CUADRO 458 MERCADO DE VERRUGAS GENITALES DE VIETNAM, POR MORFOLOGÍA, 2019-2028 (MILLONES DE USD)

TABLA 459 MERCADO DE VERRUGAS GENITALES DE VIETNAM, POR TIPO, 2019-2028 (MILLONES DE USD)

TABLA 460 DIAGNÓSTICO DE VIETNAM EN EL MERCADO DE VERRUGAS GENITALES, POR TIPO, 2019-2028 (MILLONES DE USD)

CUADRO 461 MERCADO DE TRATAMIENTO DE LAS VERRUGAS GENITALES EN VIETNAM, POR TIPO, 2019-2028 (MILLONES DE USD)

CUADRO 462 MERCADO DE TRATAMIENTO FARMACOLÓGICO DE VIETNAM PARA LAS VERRUGAS GENITALES, POR TIPO, 2019-2028 (MILLONES DE USD)

CUADRO 463 MERCADO DE VERRUGAS GENITALES DE VIETNAM, POR TRATAMIENTO, 2019-2028 (MILLONES DE USD)

CUADRO 464 MERCADO DE TRATAMIENTOS NO FARMACOLÓGICOS DE VIETNAM PARA LAS VERRUGAS GENITALES, POR TIPO, 2019-2028 (MILLONES DE USD)

CUADRO 465 MERCADO DE VERRUGAS GENITALES DE VIETNAM, POR CAUSA, 2019-2028 (MILLONES DE USD)

CUADRO 466 MERCADO DE VERRUGAS GENITALES DE VIETNAM, POR UBICACIÓN, 2019-2028 (MILLONES DE USD)

CUADRO 467 MERCADO DE VERRUGAS GENITALES DE VIETNAM, POR GÉNERO, 2019-2028 (MILLONES DE USD)

CUADRO 468 MERCADO DE VERRUGAS GENITALES DE VIETNAM, POR DOSIFICACIÓN, 2019-2028 (MILLONES DE USD)

TABLA 469 MERCADO DE VERRUGAS GENITALES DE VIETNAM, POR USUARIO FINAL, 2019-2028 (MILLONES DE USD)

CUADRO 470 MERCADO DE VERRUGAS GENITALES DE VIETNAM, POR CANAL DE DISTRIBUCIÓN, 2019-2028 (MILLONES DE USD)

TABLA 471 RESTO DEL MERCADO MUNDIAL DE VERRUGAS GENITALES DE ASIA Y EL PACÍFICO, POR MORFOLOGÍA, 2019-2028 (MILLONES DE USD)

CUADRO 472 MERCADO DE VERRUGAS GENITALES DE ORIENTE MEDIO Y ÁFRICA, POR PAÍS, 2019-2028 (MILLONES DE USD)

CUADRO 473 MERCADO DE VERRUGAS GENITALES DE ORIENTE MEDIO Y ÁFRICA, POR MORFOLOGÍA, 2019-2028 (MILLONES DE USD)

TABLA 474 MERCADO DE VERRUGAS GENITALES DE ORIENTE MEDIO Y ÁFRICA, POR TIPO, 2019-2028 (MILLONES DE USD)

CUADRO 475 MERCADO DE VERRUGAS GENITALES DE ORIENTE MEDIO Y ÁFRICA, POR TRATAMIENTO, 2019-2028 (MILLONES DE USD)

TABLA 476 MERCADO DE VERRUGAS GENITALES DE GARDASIL EN ORIENTE MEDIO Y ÁFRICA, POR TIPO, 2019-2028, (MILLONES DE USD)

TABLA 477 MERCADO DE VERRUGAS GENITALES DE ORIENTE MEDIO Y ÁFRICA, POR TIPO, 2019-2028 (MILLONES DE USD)

TABLA 478 MEDIO ORIENTE Y ÁFRICA DIAGNÓSTICO EN EL MERCADO DE VERRUGAS GENITALES, POR TIPO, 2019-2028 (MILLONES DE USD)

TABLA 479 TRATAMIENTO DE LAS VERRUGAS GENITALES EN ORIENTE MEDIO Y ÁFRICA, POR TIPO, 2019-2028 (MILLONES DE USD)

TABLA 480 MERCADO DE TRATAMIENTO FARMACOLÓGICO DE LAS VERRUGAS GENITALES DE ORIENTE MEDIO Y ÁFRICA, POR TIPO, 2019-2028 (MILLONES DE USD)

TABLA 481 MERCADO DE TRATAMIENTOS NO FARMACOLÓGICOS DE ORIENTE MEDIO Y ÁFRICA PARA LAS VERRUGAS GENITALES, POR TIPO, 2019-2028 (MILLONES DE USD)

CUADRO 482 MERCADO DE VERRUGAS GENITALES DE ORIENTE MEDIO Y ÁFRICA, POR CAUSA, 2019-2028 (MILLONES DE USD)

CUADRO 483 MERCADO DE VERRUGAS GENITALES DE ORIENTE MEDIO Y ÁFRICA, POR UBICACIÓN, 2019-2028 (MILLONES DE USD)

CUADRO 484 MERCADO DE VERRUGAS GENITALES DE ORIENTE MEDIO Y ÁFRICA, POR GÉNERO, 2019-2028 (MILLONES DE USD)

CUADRO 485 MERCADO DE VERRUGAS GENITALES DE ORIENTE MEDIO Y ÁFRICA, POR DOSIS, 2019-2028 (MILLONES DE USD)

TABLA 486 MERCADO DE VERRUGAS GENITALES DE ORIENTE MEDIO Y ÁFRICA, POR USUARIO FINAL, 2019-2028 (MILLONES DE USD)

CUADRO 487 MERCADO DE VERRUGAS GENITALES DE ORIENTE MEDIO Y ÁFRICA, POR CANAL DE DISTRIBUCIÓN, 2019-2028 (MILLONES DE USD)

CUADRO 488 MERCADO DE VERRUGAS GENITALES DE SUDÁFRICA, POR MORFOLOGÍA, 2019-2028 (MILLONES DE USD)

TABLA 489 MERCADO DE VERRUGAS GENITALES DE SUDÁFRICA, POR TIPO, 2019-2028 (MILLONES DE USD)

TABLA 490 MERCADO DE VERRUGAS GENITALES DE SUDÁFRICA, POR TIPO, 2019-2028 (MILLONES DE USD)

TABLA 491 MERCADO DE DIAGNÓSTICO DE VERRUGAS GENITALES DE SUDÁFRICA, POR TIPO, 2019-2028 (MILLONES DE USD)

CUADRO 492 MERCADO DE TRATAMIENTO DE LAS VERRUGAS GENITALES DE SUDÁFRICA, POR TIPO, 2019-2028 (MILLONES DE USD)

CUADRO 493 MERCADO DE TRATAMIENTO FARMACOLÓGICO DE LAS VERRUGAS GENITALES DE SUDÁFRICA, POR TIPO, 2019-2028 (MILLONES DE USD)

TABLA 494 MERCADO DE TRATAMIENTOS NO FARMACOLÓGICOS DE LAS VERRUGAS GENITALES DE SUDÁFRICA, POR TIPO, 2019-2028 (MILLONES DE USD)

CUADRO 495 MERCADO DE VERRUGAS GENITALES DE SUDÁFRICA, POR CAUSA, 2019-2028 (MILLONES DE USD)

CUADRO 496 MERCADO DE VERRUGAS GENITALES DE SUDÁFRICA, POR UBICACIÓN, 2019-2028 (MILLONES DE USD)

CUADRO 497 MERCADO DE VERRUGAS GENITALES DE SUDÁFRICA, POR GÉNERO, 2019-2028 (MILLONES DE USD)

CUADRO 498 MERCADO DE VERRUGAS GENITALES DE SUDÁFRICA, POR DOSIS, 2019-2028 (MILLONES DE USD)

TABLA 499 MERCADO DE VERRUGAS GENITALES DE SUDÁFRICA, POR USUARIO FINAL, 2019-2028 (MILLONES DE USD)

TABLA 500 MERCADO DE VERRUGAS GENITALES DE SUDÁFRICA, POR CANAL DE DISTRIBUCIÓN, 2019-2028 (MILLONES DE USD)

TABLA 501 MERCADO DE VERRUGAS GENITALES DE ARABIA SAUDITA, POR MORFOLOGÍA, 2019-2028 (MILLONES DE USD)

TABLA 502 MERCADO DE VERRUGAS GENITALES DE ARABIA SAUDITA, POR TIPO, 2019-2028 (MILLONES DE USD)

CUADRO 503 MERCADO DE VERRUGAS GENITALES DE ARABIA SAUDITA, POR TRATAMIENTO, 2019-2028 (MILLONES DE USD)

TABLA 504 DIAGNÓSTICO DE ARABIA SAUDITA EN EL MERCADO DE VERRUGAS GENITALES, POR TIPO, 2019-2028 (MILLONES DE USD)

TABLA 505 TIPO DE MERCADO DE VERRUGAS GENITALES DE ARABIA SAUDITA, POR TIPO, 2019-2028 (MILLONES DE USD)

TABLA 506 MERCADO DE TRATAMIENTO FARMACOLÓGICO DE ARABIA SAUDITA EN LAS VERRUGAS GENITALES, POR TIPO, 2019-2028 (MILLONES DE USD)

TABLA 507 MERCADO DE TRATAMIENTOS NO FARMACOLÓGICOS DE ARABIA SAUDITA EN LAS VERRUGAS GENITALES, POR TIPO, 2019-2028 (MILLONES DE USD)

TABLA 508 MERCADO DE VERRUGAS GENITALES DE ARABIA SAUDITA, POR CAUSA, 2019-2028 (MILLONES DE USD)

TABLA 509 MERCADO DE VERRUGAS GENITALES DE ARABIA SAUDITA, POR UBICACIÓN, 2019-2028 (MILLONES DE USD)

TABLA 510 MERCADO DE VERRUGAS GENITALES DE ARABIA SAUDITA, POR GÉNERO, 2019-2028 (MILLONES DE USD)

CUADRO 511 MERCADO DE VERRUGAS GENITALES DE ARABIA SAUDITA, POR DOSIS, 2019-2028 (MILLONES DE USD)

TABLA 512 MERCADO DE VERRUGAS GENITALES DE ARABIA SAUDITA, POR USUARIO FINAL, 2019-2028 (MILLONES DE USD)

TABLA 513 MERCADO DE VERRUGAS GENITALES DE ARABIA SAUDITA, POR CANAL DE DISTRIBUCIÓN, 2019-2028 (MILLONES DE USD)

TABLA 514 MERCADO DE VERRUGAS GENITALES DE LOS EAU, POR MORFOLOGÍA, 2019-2028 (MILLONES DE USD)

TABLA 515 MERCADO DE VERRUGAS GENITALES DE LOS EAU, POR TIPO, 2019-2028 (MILLONES DE USD)

TABLA 516 MERCADO DE VERRUGAS GENITALES DE LOS EAU, POR TRATAMIENTO, 2019-2028 (MILLONES DE USD)

TABLA 517 DIAGNÓSTICO DE LOS EAU EN EL MERCADO DE VERRUGAS GENITALES, POR TIPO, 2019-2028 (MILLONES DE USD)

TABLA 518 TRATAMIENTO DE LOS EAU EN EL MERCADO DE VERRUGAS GENITALES, POR TIPO, 2019-2028 (MILLONES DE USD)

TABLA 519 TRATAMIENTO FARMACOLÓGICO DE LOS EAU EN EL MERCADO DE VERRUGAS GENITALES, POR TIPO, 2019-2028 (MILLONES DE USD)

TABLA 520 TRATAMIENTO NO FARMACOLÓGICO DE LOS EAU EN EL MERCADO DE LAS VERRUGAS GENITALES, POR TIPO, 2019-2028 (MILLONES DE USD)

TABLA 521 MERCADO DE VERRUGAS GENITALES DE LOS EAU, POR CAUSA, 2019-2028 (MILLONES DE USD)

TABLA 522 MERCADO DE VERRUGAS GENITALES DE LOS EAU, POR UBICACIÓN, 2019-2028 (MILLONES DE USD)

TABLA 523 MERCADO DE VERRUGAS GENITALES DE LOS EAU, POR GÉNERO, 2019-2028 (MILLONES DE USD)

TABLA 524 MERCADO DE VERRUGAS GENITALES DE LOS EAU, POR DOSIS, 2019-2028 (MILLONES DE USD)

TABLA 525 MERCADO DE VERRUGAS GENITALES DE LOS EAU, POR USUARIO FINAL, 2019-2028 (MILLONES DE USD)

TABLA 526 MERCADO DE VERRUGAS GENITALES DE LOS EAU, POR CANAL DE DISTRIBUCIÓN, 2019-2028 (MILLONES DE USD)

TABLA 527 MERCADO DE VERRUGAS GENITALES DE EGIPTO, POR MORFOLOGÍA, 2019-2028 (MILLONES DE USD)

TABLA 528 MERCADO DE VERRUGAS GENITALES DE EGIPTO, POR TIPO, 2019-2028 (MILLONES DE USD)

CUADRO 529 MERCADO DE VERRUGAS GENITALES DE EGIPTO, POR TRATAMIENTO, 2019-2028 (MILLONES DE USD)

TABLA 530 DIAGNÓSTICO DE EGIPTO EN EL MERCADO DE VERRUGAS GENITALES, POR TIPO, 2019-2028 (MILLONES DE USD)

TABLA 531 MERCADO DE TRATAMIENTO DE LAS VERRUGAS GENITALES EN EGIPTO, POR TIPO, 2019-2028 (MILLONES DE USD)

TABLA 532 MERCADO DE TRATAMIENTO FARMACOLÓGICO DE LAS VERRUGAS GENITALES EN EGIPTO, POR TIPO, 2019-2028 (MILLONES DE USD)

TABLA 533 MERCADO DE TRATAMIENTOS NO FARMACOLÓGICOS DE EGIPTO PARA LAS VERRUGAS GENITALES, POR TIPO, 2019-2028 (MILLONES DE USD)

TABLA 534 MERCADO DE VERRUGAS GENITALES DE EGIPTO, POR CAUSA, 2019-2028 (MILLONES DE USD)

TABLA 535 MERCADO DE VERRUGAS GENITALES DE EGIPTO, POR UBICACIÓN, 2019-2028 (MILLONES DE USD)

TABLA 536 MERCADO DE VERRUGAS GENITALES DE EGIPTO, POR GÉNERO, 2019-2028 (MILLONES DE USD)

TABLA 537 MERCADO DE VERRUGAS GENITALES DE EGIPTO, POR DOSIS, 2019-2028 (MILLONES DE USD)

TABLA 538 MERCADO DE VERRUGAS GENITALES DE EGIPTO, POR USUARIO FINAL, 2019-2028 (MILLONES DE USD)

TABLA 539 MERCADO DE VERRUGAS GENITALES DE EGIPTO, POR CANAL DE DISTRIBUCIÓN, 2019-2028 (MILLONES DE USD)

CUADRO 540 MERCADO DE VERRUGAS GENITALES DE KUWAIT, POR MORFOLOGÍA, 2019-2028 (MILLONES DE USD)

TABLA 541 MERCADO DE VERRUGAS GENITALES DE KUWAIT, POR TIPO, 2019-2028 (MILLONES DE USD)

CUADRO 542 MERCADO DE VERRUGAS GENITALES DE KUWAIT, POR TRATAMIENTO, 2019-2028 (MILLONES DE USD)

TABLA 543 DIAGNÓSTICO DE KUWAIT EN EL MERCADO DE VERRUGAS GENITALES, POR TIPO, 2019-2028 (MILLONES DE USD)

TABLA 544 TRATAMIENTO KUWAIT EN EL MERCADO DE VERRUGAS GENITALES, POR TIPO, 2019-2028 (MILLONES DE USD)

CUADRO 545 TRATAMIENTO FARMACOLÓGICO DE KUWAIT EN EL MERCADO DE VERRUGAS GENITALES, POR TIPO, 2019-2028 (MILLONES DE USD)

TABLA 546 MERCADO DE TRATAMIENTOS NO FARMACOLÓGICOS DE KUWAIT EN LAS VERRUGAS GENITALES, POR TIPO, 2019-2028 (MILLONES DE USD)

TABLA 547 MERCADO DE VERRUGAS GENITALES DE KUWAIT, POR CAUSA, 2019-2028 (MILLONES DE USD)

TABLA 548 MERCADO DE VERRUGAS GENITALES DE KUWAIT, POR UBICACIÓN, 2019-2028 (MILLONES DE USD)

TABLA 549 MERCADO DE VERRUGAS GENITALES DE KUWAIT, POR GÉNERO, 2019-2028 (MILLONES DE USD)

TABLA 550 MERCADO DE VERRUGAS GENITALES DE KUWAIT, POR DOSIS, 2019-2028 (MILLONES DE USD)

TABLA 551 MERCADO DE VERRUGAS GENITALES DE KUWAIT, POR USUARIO FINAL, 2019-2028 (MILLONES DE USD)

CUADRO 552 MERCADO DE VERRUGAS GENITALES DE KUWAIT, POR CANAL DE DISTRIBUCIÓN, 2019-2028 (MILLONES DE USD)

CUADRO 553 MERCADO DE VERRUGAS GENITALES EN ISRAEL, POR MORFOLOGÍA, 2019-2028 (MILLONES DE USD)

TABLA 554 MERCADO DE VERRUGAS GENITALES DE ISRAEL, POR TIPO, 2019-2028 (MILLONES DE USD)

CUADRO 555 MERCADO DE VERRUGAS GENITALES EN ISRAEL, POR TRATAMIENTO, 2019-2028 (MILLONES DE USD)

TABLA 556 MERCADO DE DIAGNÓSTICO DE VERRUGAS GENITALES EN ISRAEL, POR TIPO, 2019-2028 (MILLONES DE USD)

CUADRO 557 MERCADO DE TRATAMIENTO DE LAS VERRUGAS GENITALES EN ISRAEL, POR TIPO, 2019-2028 (MILLONES DE USD)

CUADRO 558 MERCADO DE TRATAMIENTO FARMACOLÓGICO DE ISRAEL EN LAS VERRUGAS GENITALES, POR TIPO, 2019-2028 (MILLONES DE USD)

TABLA 559 MERCADO DE TRATAMIENTOS NO FARMACOLÓGICOS DE ISRAEL EN LAS VERRUGAS GENITALES, POR TIPO, 2019-2028 (MILLONES DE USD)

TABLA 560 MERCADO DE VERRUGAS GENITALES EN ISRAEL, POR CAUSA, 2019-2028 (MILLONES DE USD)

TABLA 561 MERCADO DE VERRUGAS GENITALES EN ISRAEL, POR UBICACIÓN, 2019-2028 (MILLONES DE USD)

TABLA 562 MERCADO DE VERRUGAS GENITALES EN ISRAEL, POR GÉNERO, 2019-2028 (MILLONES DE USD)

CUADRO 563 MERCADO DE VERRUGAS GENITALES EN ISRAEL, POR DOSIS, 2019-2028 (MILLONES DE USD)

TABLA 564 MERCADO DE VERRUGAS GENITALES EN ISRAEL, POR USUARIO FINAL, 2019-2028 (MILLONES DE USD)

CUADRO 565 MERCADO DE VERRUGAS GENITALES EN ISRAEL, POR CANAL DE DISTRIBUCIÓN, 2019-2028 (MILLONES DE USD)

TABLA 566 MERCADO DE VERRUGAS GENITALES DEL RESTO DE ORIENTE MEDIO Y ÁFRICA, POR MORFOLOGÍA, 2019-2028 (MILLONES DE USD)

CUADRO 567 MERCADO DE VERRUGAS GENITALES EN AMÉRICA DEL SUR, POR PAÍS, 2019-2028 (MILLONES DE USD)

CUADRO 568 MERCADO DE VERRUGAS GENITALES EN AMÉRICA DEL SUR, POR MORFOLOGÍA, 2019-2028 (MILLONES DE USD)

TABLA 569 MERCADO DE VERRUGAS GENITALES EN AMÉRICA DEL SUR, POR TIPO, 2019-2028 (MILLONES DE USD)

TABLA 570 DIAGNÓSTICOS DEL MERCADO DE VERRUGAS GENITALES EN AMÉRICA DEL SUR, POR TIPO, 2019-2028 (MILLONES DE USD)

CUADRO 571 MERCADO DE TRATAMIENTO DE LAS VERRUGAS GENITALES EN AMÉRICA DEL SUR, POR TIPO, 2019-2028 (MILLONES DE USD)

CUADRO 572 MERCADO DE TRATAMIENTO DE LAS VERRUGAS GENITALES EN AMÉRICA DEL SUR, POR TIPO, 2019-2028 (MILLONES DE USD)

CUADRO 573 MERCADO DE VERRUGAS GENITALES EN AMÉRICA DEL SUR, POR TRATAMIENTO, 2019-2028 (MILLONES DE USD)

CUADRO 574 MERCADO DE GARDASIL EN VERRUGAS GENITALES EN AMÉRICA DEL SUR, POR PAÍS, 2019-2028 (MILLONES DE USD)

CUADRO 575 MERCADO DE CERVARIX EN VERRUGAS GENITALES DE AMÉRICA DEL SUR, POR PAÍS, 2019-2028 (MILLONES DE USD)

CUADRO 576 MERCADO DE TRATAMIENTOS NO FARMACOLÓGICOS DE VERRUGAS GENITALES EN AMÉRICA DEL SUR, POR TIPO, 2019-2028 (MILLONES DE USD)

CUADRO 577 MERCADO DE VERRUGAS GENITALES EN AMÉRICA DEL SUR, POR CAUSA, 2019-2028 (MILLONES DE USD)

CUADRO 578 MERCADO DE VERRUGAS GENITALES EN AMÉRICA DEL SUR, POR UBICACIÓN, 2019-2028 (MILLONES DE USD)

CUADRO 579 MERCADO DE VERRUGAS GENITALES EN AMÉRICA DEL SUR, POR GÉNERO, 2019-2028 (MILLONES DE USD)

CUADRO 580 MERCADO DE VERRUGAS GENITALES EN AMÉRICA DEL SUR, POR FORMA DE DOSIFICACIÓN, 2019-2028 (MILLONES DE USD)

CUADRO 581 MERCADO DE VERRUGAS GENITALES EN AMÉRICA DEL SUR, POR USUARIO FINAL, 2019-2028 (MILLONES DE USD)

CUADRO 582 MERCADO DE VERRUGAS GENITALES EN AMÉRICA DEL SUR, POR CANAL DE DISTRIBUCIÓN, 2019-2028 (MILLONES DE USD)

CUADRO 583 MERCADO DE VERRUGAS GENITALES EN BRASIL, POR MORFOLOGÍA, 2019-2028 (MILLONES DE USD)

TABLA 584 MERCADO DE VERRUGAS GENITALES EN BRASIL, POR TIPO, 2019-2028 (MILLONES DE USD)

TABLA 585 MERCADO DE DIAGNÓSTICO DE VERRUGAS GENITALES EN BRASIL, POR TIPO, 2019-2028 (MILLONES DE USD)

CUADRO 586 MERCADO DE TRATAMIENTO DE LAS VERRUGAS GENITALES EN BRASIL, POR TIPO, 2019-2028 (MILLONES DE USD)

CUADRO 587 MERCADO DE TRATAMIENTO FARMACOLÓGICO DE LAS VERRUGAS GENITALES EN BRASIL, POR TIPO, 2019-2028 (MILLONES DE USD)

CUADRO 588 MERCADO DE VERRUGAS GENITALES EN BRASIL, POR TRATAMIENTO, 2019-2028 (MILLONES DE USD)

CUADRO 589 MERCADO DE TRATAMIENTOS NO FARMACOLÓGICOS DE LAS VERRUGAS GENITALES EN BRASIL, POR TIPO, 2019-2028 (MILLONES DE USD)

CUADRO 590 MERCADO DE VERRUGAS GENITALES EN BRASIL, POR CAUSA, 2019-2028 (MILLONES DE USD)

TABLA 591 MERCADO DE VERRUGAS GENITALES EN BRASIL, POR UBICACIÓN, 2019-2028 (MILLONES DE USD)

CUADRO 592 MERCADO DE VERRUGAS GENITALES EN BRASIL, POR GÉNERO, 2019-2028 (MILLONES DE USD)

CUADRO 593 MERCADO DE VERRUGAS GENITALES EN BRASIL, POR FORMA DE DOSIFICACIÓN, 2019-2028 (MILLONES DE USD)

TABLA 594 MERCADO DE VERRUGAS GENITALES DE BRASIL, POR USUARIO FINAL, 2019-2028 (MILLONES DE USD)

CUADRO 595 MERCADO DE VERRUGAS GENITALES EN BRASIL, POR CANAL DE DISTRIBUCIÓN, 2019-2028 (MILLONES DE USD)

CUADRO 596 MERCADO ARGENTINO DE VERRUGAS GENITALES, POR MORFOLOGÍA, 2019-2028 (MILLONES DE USD)

CUADRO 597 MERCADO ARGENTINO DE VERRUGAS GENITALES, POR TIPO, 2019-2028 (MILLONES DE USD)

TABLA 598 MERCADO DIAGNÓSTICO DE VERRUGAS GENITALES EN ARGENTINA, POR TIPO, 2019-2028 (MILLONES DE USD)

CUADRO 599 MERCADO ARGENTINO DE TRATAMIENTO DE LAS VERRUGAS GENITALES, POR TIPO, 2019-2028 (MILLONES DE USD)

CUADRO 600 MERCADO DE TRATAMIENTO FARMACOLÓGICO DE LAS VERRUGAS GENITALES EN ARGENTINA, POR TIPO, 2019-2028 (MILLONES DE USD)

CUADRO 601 MERCADO ARGENTINO DE VERRUGAS GENITALES, POR TRATAMIENTO, 2019-2028 (MILLONES DE USD)

CUADRO 602 MERCADO ARGENTINO DE TRATAMIENTO DE LAS VERRUGAS GENITALES, POR TIPO, 2019-2028 (MILLONES DE USD)

CUADRO 603 MERCADO ARGENTINO DE VERRUGAS GENITALES, POR CAUSA, 2019-2028 (MILLONES DE USD)

CUADRO 604 MERCADO DE VERRUGAS GENITALES EN ARGENTINA, POR UBICACIÓN, 2019-2028 (MILLONES DE USD)

CUADRO 605 MERCADO ARGENTINO DE VERRUGAS GENITALES, POR GÉNERO, 2019-2028 (MILLONES DE USD)

CUADRO 606 MERCADO ARGENTINO DE VERRUGAS GENITALES, POR FORMA DE DOSIFICACIÓN, 2019-2028 (MILLONES DE USD)

CUADRO 607 MERCADO DE VERRUGAS GENITALES EN ARGENTINA, POR USUARIO FINAL, 2019-2028 (MILLONES DE USD)

CUADRO 608 MERCADO ARGENTINO DE VERRUGAS GENITALES, POR CANAL DE DISTRIBUCIÓN, 2019-2028 (MILLONES DE USD)

CUADRO 609 MERCADO DE VERRUGAS GENITALES EN PERÚ, POR MORFOLOGÍA, 2019-2028 (MILLONES DE USD)

TABLA 610 MERCADO DE VERRUGAS GENITALES EN PERÚ, POR TIPO, 2019-2028 (MILLONES DE USD)

CUADRO 611 PERÚ DIAGNÓSTICO EN EL MERCADO DE VERRUGAS GENITALES, POR TIPO, 2019-2028 (MILLONES DE USD)

CUADRO 612 MERCADO DE TRATAMIENTO DE VERRUGAS GENITALES EN PERÚ, POR TIPO, 2019-2028 (MILLONES DE USD)

CUADRO 613 MERCADO DE TRATAMIENTO FARMACOLÓGICO DE LAS VERRUGAS GENITALES EN PERÚ, POR TIPO, 2019-2028 (MILLONES DE USD)

CUADRO 614 MERCADO DE VERRUGAS GENITALES EN PERÚ, POR TRATAMIENTO, 2019-2028 (MILLONES DE USD)

CUADRO 615 MERCADO DE TRATAMIENTO DE VERRUGAS GENITALES EN PERÚ, POR TIPO, 2019-2028 (MILLONES DE USD)

CUADRO 616 MERCADO DE VERRUGAS GENITALES EN PERÚ, POR CAUSA, 2019-2028 (MILLONES DE USD)

CUADRO 617 MERCADO DE VERRUGAS GENITALES EN PERÚ, POR UBICACIÓN, 2019-2028 (MILLONES DE USD)

CUADRO 618 MERCADO DE VERRUGAS GENITALES EN PERÚ, POR GÉNERO, 2019-2028 (MILLONES DE USD)

CUADRO 619 MERCADO DE VERRUGAS GENITALES EN PERÚ, POR FORMA DE DOSIFICACIÓN, 2019-2028 (MILLONES DE USD)

CUADRO 620 MERCADO DE VERRUGAS GENITALES EN PERÚ, POR USUARIO FINAL, 2019-2028 (MILLONES DE USD)

CUADRO 621 MERCADO DE VERRUGAS GENITALES EN PERÚ, POR CANAL DE DISTRIBUCIÓN, 2019-2028 (MILLONES DE USD)

CUADRO 622 MERCADO MUNDIAL DE VERRUGAS GENITALES DEL RESTO DE SUDAMÉRICA, POR MORFOLOGÍA, 2019-2028 (MILLONES DE USD)


Por favor complete el siguiente formulario para Infografías

Al hacer clic en el botón "Enviar", usted acepta la investigación de mercado de Data Bridge. política de privacidad y Términos y condiciones

Metodología de investigación:

La recopilación de datos y el análisis del año base se realizan mediante módulos de recopilación de datos con muestras de gran tamaño. La etapa incluye la obtención de información de mercado o datos relacionados a través de diversas fuentes y estrategias. Incluye examinar y planificar de antemano todos los datos adquiridos del pasado. Asimismo, abarca el examen de las inconsistencias de la información observadas en diferentes fuentes de información. Los datos de mercado se analizan y estiman utilizando modelos estadísticos y coherentes de mercado. Además, el análisis de la cuota de mercado y el análisis de tendencias clave son los principales factores de éxito en el informe de mercado. Para saber más, solicite una llamada de analista o envíe su consulta.

La metodología de investigación clave utilizada por el equipo de investigación de DBMR es la triangulación de datos, que implica extracción de datos, análisis del impacto de las variables de datos en el mercado y validación primaria (experto de la industria). Los modelos de datos incluyen cuadrícula de posicionamiento de proveedores, análisis de la línea de tiempo del mercado, descripción general y guía del mercado, cuadrícula de posicionamiento de la empresa, análisis de patentes, análisis de precios, análisis de participación de mercado de la empresa, estándares de medición, análisis global versus regional y de participación de proveedores. Para saber más sobre la metodología de investigación, envíe una consulta para hablar con nuestros expertos de la industria.

Por favor complete el siguiente formulario para Metodología de Investigación

Al hacer clic en el botón "Enviar", usted acepta la investigación de mercado de Data Bridge. política de privacidad y Términos y condiciones

Personalización disponible:

Data Bridge Market Research es líder en investigación formativa avanzada. Estamos orgullosos de brindar servicios a nuestros clientes nuevos y existentes con datos y análisis que coinciden y se adaptan a sus objetivos. El informe se puede personalizar para incluir análisis de tendencias de precios de marcas objetivo que comprendan el mercado de países adicionales (solicite la lista de países), datos de resultados de ensayos clínicos, revisión de literatura, mercado renovado y análisis de la base de productos. El análisis de mercado de los competidores objetivo se puede analizar desde análisis basados ​​en tecnología hasta estrategias de cartera de mercado. Podemos agregar tantos competidores sobre los que necesite datos en el formato y estilo de datos que esté buscando. Nuestro equipo de analistas también puede proporcionarle datos en tablas dinámicas de archivos de Excel sin procesar (libro de datos) o puede ayudarlo a crear presentaciones a partir de los conjuntos de datos disponibles en el informe.

Complete el siguiente formulario para personalizar disponible

Al hacer clic en el botón "Enviar", usted acepta la investigación de mercado de Data Bridge. política de privacidad y Términos y condiciones

HAGA PREGUNTAS FRECUENTES

El mercado de verrugas genitales crecerá a una tasa compuesta anual del 6,8% para el año previsto 2028.
El valor de mercado de las verrugas genitales alcanzará los 10.607,81 millones de dólares según las previsiones para 2028.
Los países cubiertos en el informe del mercado de las verrugas genitales son EE. UU., Canadá, México, Alemania, Francia, Reino Unido, Italia, España, Rusia, Polonia, Turquía, Suiza, Países Bajos, Hungría, Austria, Noruega, Irlanda, Lituania y el resto de Europa. en Europa, China, Japón, India, Australia, Corea del Sur, Singapur, Tailandia, Malasia, Indonesia, Filipinas, Vietnam, resto de Asia-Pacífico (APAC) en Asia-Pacífico (APAC) Brasil, Argentina, Perú, resto de Sur América en Sudamérica, Sudáfrica, Arabia Saudita, Emiratos Árabes Unidos, Israel, Egipto, Kuwait y resto de Medio Oriente y África en Medio Oriente y África (MEA).
Las principales empresas que ofrecen tratamiento mundial para las verrugas genitales son Bausch Health Companies Inc., CryoSurgery, Inc., Merck Sharpe & Dohme Corp., una subsidiaria de Merck & Co., Inc., Taro Pharmaceutical Industries Ltd., Glenmark Pharmaceutical Inc., EE. UU. (una subsidiaria de Glenmark Pharmaceuticals Ltd.), Edge Pharma, CryoConcepts LP, CryoIQ, GlaxoSmithKline plc, ANI Pharmaceuticals, Inc., Cassiopea, Inc., Verrica Pharmaceuticals, Novan, Inc., BioNTech SE, Serum Institute of India Pvt. Limitado. Ltd., Fotona, Orgenesis Inc., Perrigo Company plc.
Informe de muestra gratuito

ELEGIR TIPO DE LICENCIA

  • 7000.00
  • 4800.00
  • 3000.00
  • 8000.00
  • 12000.00

Por qué elegirnos

Cobertura de la industria

DBMR trabaja en todo el mundo en múltiples industrias, lo que nos brinda conocimiento en todos los sectores verticales y brinda a nuestros clientes información no solo de su industria sino también de cómo otras industrias afectarán su ecosistema.

Cobertura Regional

La cobertura de Data Bridge no se limita a las economías desarrolladas o emergentes. Trabajamos en todo el mundo cubriendo la mayor variedad de países donde ninguna otra firma de investigación de mercado o consultoría de negocios ha realizado investigaciones; creando oportunidades de crecimiento para nuestros clientes en áreas aún desconocidas.

Cobertura Tecnológica

En el mundo actual, la tecnología impulsa el sentimiento del mercado, por lo que nuestra visión es brindar a nuestros clientes información no solo sobre las tecnologías desarrolladas, sino también sobre los cambios tecnológicos futuros e disruptivos a lo largo del ciclo de vida del producto, brindándoles oportunidades imprevistas en el mercado que crearán disrupciones en su industria. . Esto lleva a la innovación y a que nuestros clientes salgan ganadores.

Soluciones orientadas a objetivos

El objetivo de DBMR es ayudar a nuestros clientes a alcanzar sus objetivos a través de nuestras soluciones; por lo tanto, creamos de manera formativa las soluciones más adecuadas para las necesidades de nuestros clientes, ahorrándoles tiempo y esfuerzos para impulsar sus grandes estrategias.

Soporte de analista incomparable

Nuestros analistas se enorgullecen del éxito de nuestros clientes. A diferencia de otros, creemos en trabajar junto a nuestros clientes para lograr sus objetivos con soporte de analistas las 24 horas para determinar las necesidades correctas e inspirar la innovación a través del servicio.

Banner

testimonios de clientes