

Mercado mundial de adhesivos flocados, por producto (poliuretano, acrílico, epoxi y otros), fuente (a base de disolvente y a base de agua), sustrato (textil, plástico, metal, vidrio, madera y otros), aplicación (automotriz, textiles técnicos y prendas de vestir, impresión, papel y embalaje, y otros), país (EE. UU., Canadá, México, Alemania, Francia, Italia, Reino Unido, Bélgica, España, Rusia, Turquía, Países Bajos, Suiza y resto de Europa, Japón, China, India, Corea del Sur, Australia, Nueva Zelanda, Singapur, Malasia, Tailandia, Indonesia, Filipinas y resto de Asia-Pacífico, Emiratos Árabes Unidos, Arabia Saudita, Egipto, Israel, Sudáfrica, resto de Oriente Medio y África) Tendencias de la industria y pronóstico hasta 2029.
 Análisis y perspectivas del mercado: mercado mundial de adhesivos flocados
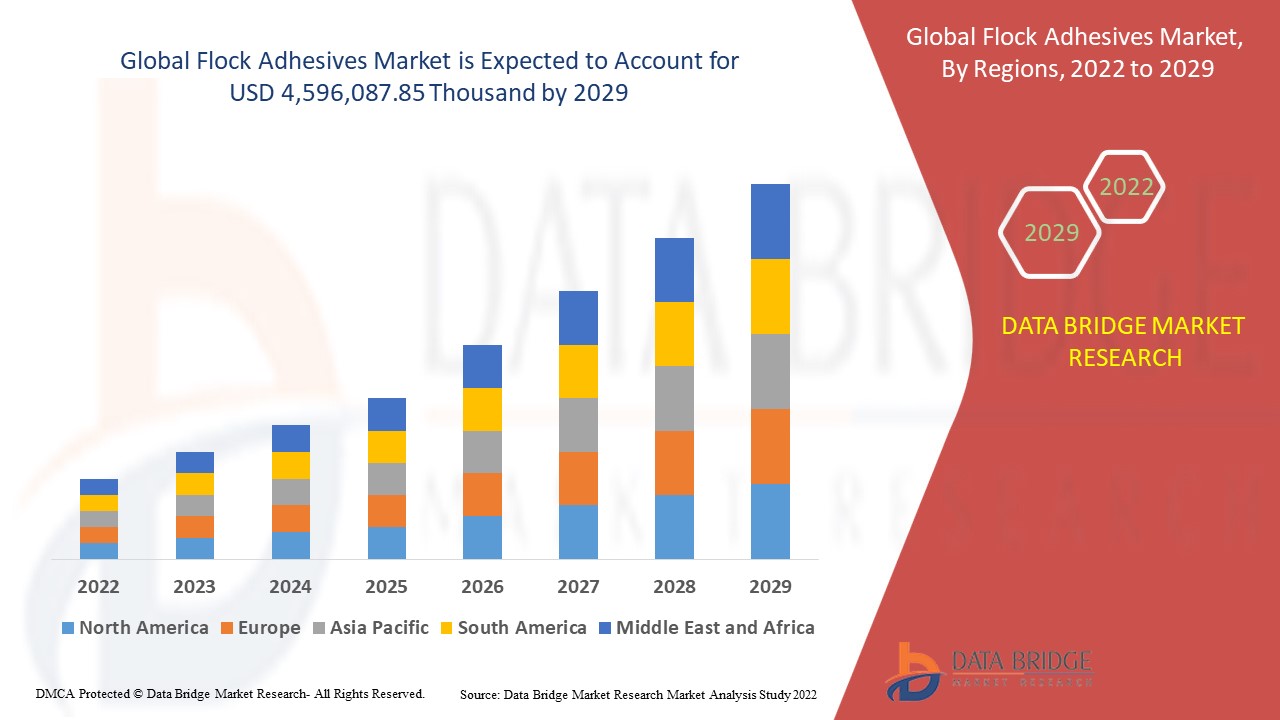
Se espera que el mercado mundial de adhesivos flocados gane crecimiento de mercado en el período de pronóstico de 2022 a 2029. Data Bridge Market Research analiza que el mercado está creciendo a una CAGR del 5,5% en el período de pronóstico de 2022 a 2029 y se espera que alcance los USD 4.596.087,85 mil para 2029. La creciente tendencia de vehículos livianos y con bajas emisiones de carbono puede impulsar el mercado mundial de adhesivos flocados.
Los adhesivos flocados son materiales aglutinantes que se utilizan para unir diversos sustratos , como caucho, plástico y metal. El flocado adhesivo se produce cuando las partículas de fibra se incorporan electrostáticamente a la capa adhesiva. La mayoría de los flocados utilizan fibras naturales o sintéticas finamente picadas. El exterior flocado le da a la superficie propiedades decorativas y funcionales.
La creciente adopción de adhesivos flocados en la fabricación de aislamiento térmico y el cambio en las preferencias de los consumidores por el nivel de calidad del interior del automóvil son algunos de los determinantes clave que pueden favorecer el crecimiento del mercado mundial de adhesivos flocados durante el período de pronóstico.
Sin embargo, la volatilidad de los precios de las materias primas y la reacción de las diferentes estructuras de composición pueden actuar como restricciones importantes en la tasa de crecimiento del mercado mundial de adhesivos flocados. Además, las estrictas regulaciones asociadas con el proceso de aprobación de la comercialización pueden desafiar el crecimiento del mercado durante el período de pronóstico.
El aumento en la utilización de adhesivos flocados en los sectores de impresión y embalaje puede crear oportunidades lucrativas para el mercado.
Este informe de mercado global de adhesivos flocados proporciona detalles de la participación de mercado, nuevos desarrollos y análisis de la cartera de productos, el impacto de los actores del mercado nacional y localizado, analiza las oportunidades en términos de bolsillos de ingresos emergentes, cambios en las regulaciones del mercado, aprobaciones de productos, decisiones estratégicas, lanzamientos de productos, expansiones geográficas e innovaciones tecnológicas en el mercado. Para comprender el análisis y el escenario del mercado, contáctenos para obtener un resumen de analista; nuestro equipo lo ayudará a crear una solución de impacto en los ingresos para lograr su objetivo deseado.
 Alcance y tamaño del mercado mundial de adhesivos flocados
El mercado mundial de adhesivos flocados se divide en cuatro segmentos importantes según la fuente, el sustrato, el producto y la aplicación. El crecimiento entre segmentos le ayuda a analizar nichos de crecimiento y estrategias para abordar el mercado y determinar sus principales áreas de aplicación y la diferencia en sus mercados objetivo.
- Según la fuente, el mercado mundial de adhesivos flocados se segmenta en adhesivos a base de solventes y adhesivos a base de agua. En 2022, se espera que el segmento a base de agua domine el mercado, ya que estos últimos tienen un alto poder de resistencia, lo que aumenta su demanda a nivel mundial.
- En función del sustrato, el mercado mundial de adhesivos flocados se segmenta en textiles, plásticos, metales, vidrios, maderas y otros. En 2022, se espera que el segmento de plásticos domine el mercado, ya que el plástico tiene una alta durabilidad, lo que aumenta su demanda global.
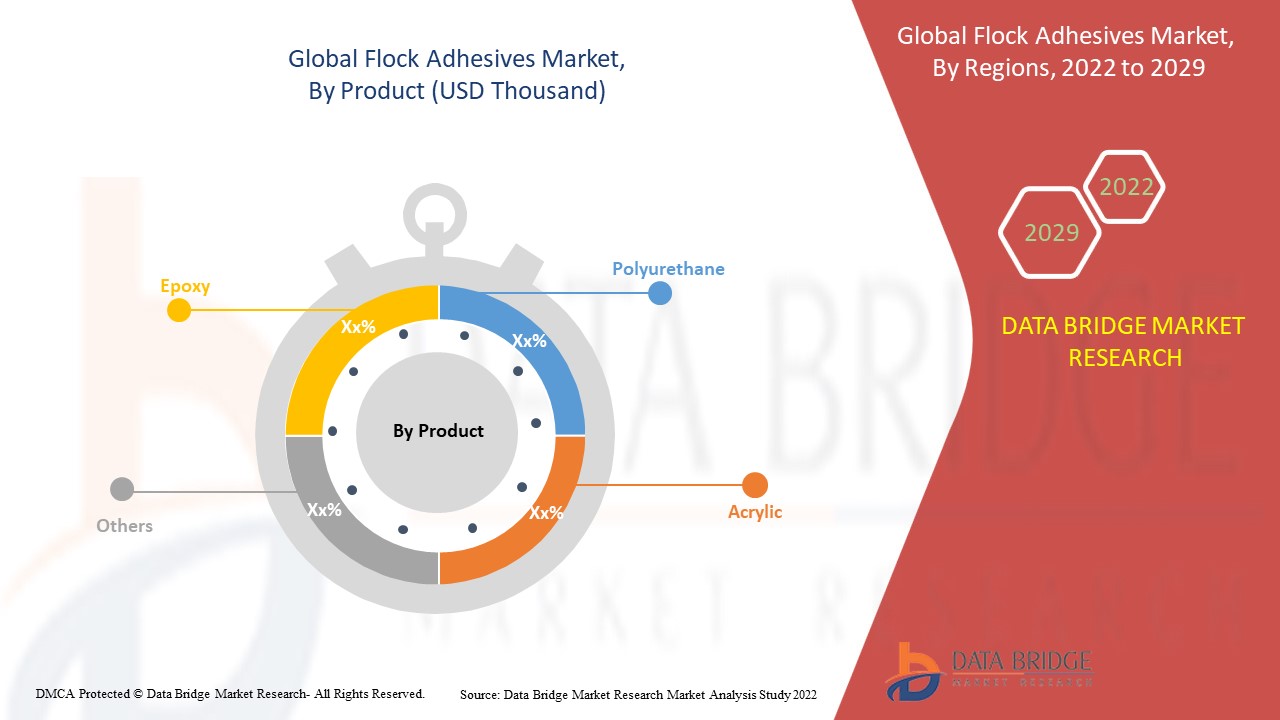
- En función del producto, el mercado mundial de adhesivos flocados se segmenta en poliuretano, acrílico, epoxi y otros. En 2022, se espera que el segmento acrílico domine el mercado, ya que los adhesivos acrílicos tienen una buena compatibilidad, lo que aumenta su demanda global.
- En función de la aplicación, el mercado mundial de adhesivos flocados se segmenta en automoción, textiles técnicos y prendas de vestir, impresión, papel y embalaje, entre otros. En 2022, se espera que el segmento de la automoción domine el mercado, ya que los adhesivos flocados proporcionan un buen efecto aislante para producir piezas de automoción, lo que aumenta su demanda a nivel mundial.
 Análisis a nivel de país del mercado mundial de adhesivos para flocado
El mercado global de adhesivos flocados está segmentado en cuatro segmentos notables según la fuente, el sustrato, el producto y la aplicación.
Los países cubiertos en el informe del mercado global de adhesivos flocados son EE. UU., Canadá, México, Alemania, Francia, Italia, Reino Unido, Bélgica, España, Rusia, Turquía, Países Bajos, Suiza, resto de Europa, Japón, China, India, Corea del Sur, Australia, Nueva Zelanda, Singapur, Malasia, Tailandia, Indonesia, Filipinas, resto de Asia-Pacífico, Emiratos Árabes Unidos, Arabia Saudita, Egipto, Israel, Sudáfrica, resto de Medio Oriente y África.
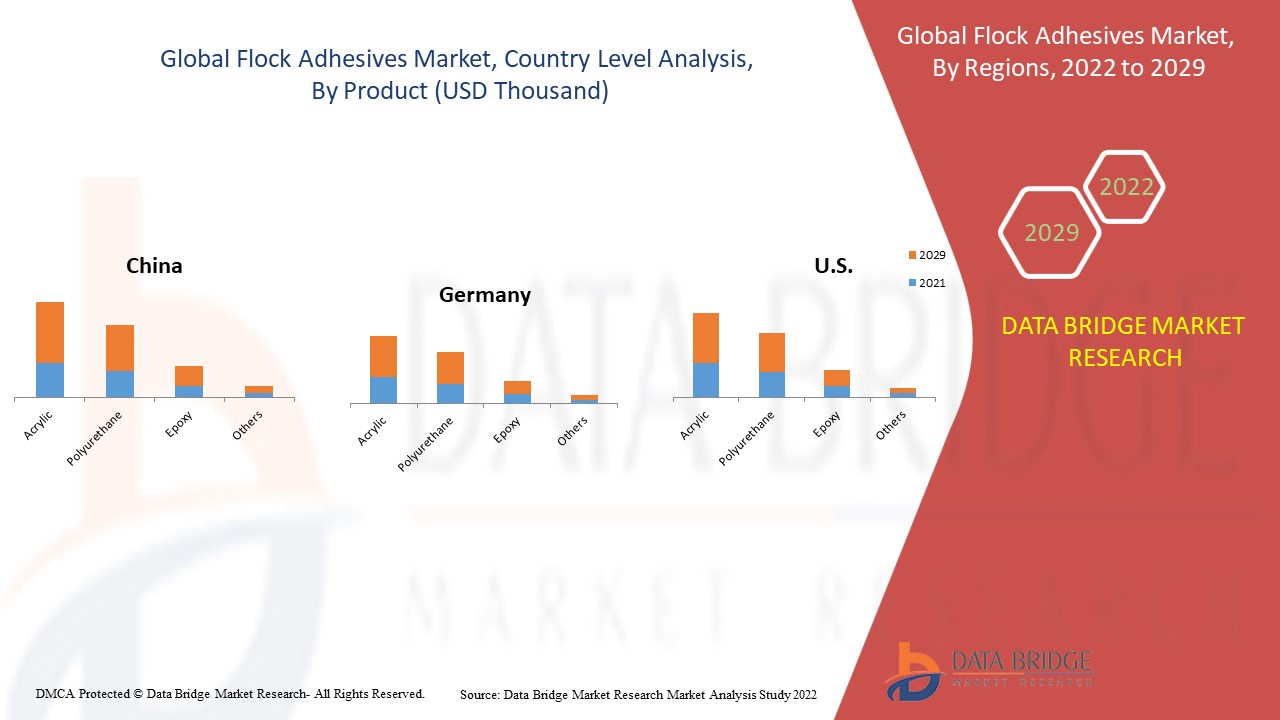
Se prevé que la región de Asia-Pacífico domine el mercado mundial de adhesivos flocados, ya que ha aumentado la demanda de vehículos ligeros y con bajas emisiones de carbono. Se espera que China lidere el crecimiento del mercado de Asia-Pacífico debido a la producción fácil y avanzada de adhesivos flocados con material de alta calidad. Se espera que Estados Unidos domine el mercado norteamericano debido al aumento del uso de adhesivos flocados en el sector automotriz de la región, mientras que se espera que Alemania domine el mercado europeo debido al cambio en la preferencia de los consumidores por el nivel de calidad del interior de los automóviles, lo que aumenta la demanda de adhesivos flocados en la región.
La sección de países del informe también proporciona factores de impacto de mercado individuales y cambios en la regulación del mercado que afectan las tendencias actuales y futuras del mercado. Los puntos de datos como nuevas ventas, ventas de reemplazo, demografía del país, leyes regulatorias y aranceles de importación y exportación son algunos de los principales indicadores utilizados para pronosticar el escenario del mercado para países individuales. Además, la presencia y disponibilidad de marcas globales y sus desafíos enfrentados debido a la competencia grande o escasa de las marcas locales y nacionales, el impacto de los canales de venta se consideran al proporcionar un análisis de pronóstico de los datos del país.
Tendencia creciente de vehículos ligeros y con bajas emisiones de carbono
Los materiales ligeros utilizados en la fabricación de automóviles ofrecen grandes oportunidades de reducción de peso y otros beneficios cuando se utilizan en acero estructural y hierro fundido en aplicaciones automotrices. Los vehículos eléctricos tienen el impacto más significativo en la reducción de las emisiones de gases de efecto invernadero en la mayoría de los países, y los vehículos de gasolina ligeros logran reducciones significativas. Una reducción del 10% en el peso del vehículo puede mejorar el consumo de combustible en un 6% y un 8%.
Los materiales avanzados para la fabricación de vehículos eléctricos son esenciales para impulsar el mercado automotriz y, al mismo tiempo, mantener la seguridad y el rendimiento. Los materiales livianos ofrecen un gran potencial para aumentar la eficiencia del vehículo, ya que los objetos más livianos requieren menos energía para acelerar que los más pesados. Reemplazar las piezas de hierro fundido y de acero tradicionales por materiales livianos como acero de alta resistencia y aleaciones de magnesio puede reducir el peso de la carrocería y el chasis del vehículo hasta en un 50%, lo que reduce el consumo de combustible.
- En conclusión, los vehículos ligeros están fabricados principalmente de aluminio o acero ligero especial y emiten menos gases contaminantes que otros vehículos. Por este motivo, se espera que la creciente tendencia de los vehículos ligeros y con bajas emisiones de carbono actúe como un factor impulsor de la demanda del mercado mundial de adhesivos flocados.
El mercado mundial de adhesivos flocados también le proporciona un análisis detallado del mercado para el crecimiento de cada país en un mercado en particular. Además, proporciona información detallada sobre la estrategia de los actores del mercado y su presencia geográfica. Los datos están disponibles para el período histórico de 2012 a 2020.
Análisis del panorama competitivo y de la cuota de mercado global de adhesivos flocados
El panorama competitivo del mercado global de adhesivos flocados proporciona detalles por competidor. Los detalles incluidos son una descripción general de la empresa, las finanzas de la empresa, los ingresos generados, el potencial de mercado, la inversión en investigación y desarrollo, las nuevas iniciativas de mercado, la presencia global, los sitios e instalaciones de producción, las fortalezas y debilidades de la empresa, el lanzamiento de productos, los procesos de ensayos clínicos, el análisis de la marca, las aprobaciones de productos, las patentes, la amplitud y la extensión del producto, el dominio de la aplicación y la curva de la línea de vida de la tecnología. Los puntos de datos anteriores proporcionados solo están relacionados con el enfoque de la empresa en el mercado global de adhesivos flocados.
Algunos de los principales actores del mercado global de adhesivos flocados son Sika AG, CHT Group, NYATEX, SwissFlock AG, Arkema, HB Fuller Company, Dow, PARKER HANNIFIN CORP, Henkel AG & Co. KGaA, Stahl Holdings BV, Avient Corporation, Kissel + Wolf GmbH y NANPAO RESINS CHEMICAL GROUP, entre otros actores nacionales. Los analistas de DBMR comprenden las fortalezas competitivas y brindan un análisis competitivo para cada competidor por separado.
Las empresas también inician numerosos contratos y acuerdos, lo que acelera el mercado de adhesivos flocados en Asia-Pacífico.
Por ejemplo,
- En julio de 2021, HB Fuller Company se asoció con Covestro, uno de los proveedores de polímeros más grandes del mundo, para ofrecer un adhesivo con un impacto climático reducido para las industrias de la carpintería, los materiales compuestos, los textiles y la automoción. Esto ha permitido a la empresa producir productos adhesivos ecológicos.
- En noviembre de 2020, NANPAO RESINS CHEMICAL GROUP recibió el premio “Good Deeds Award” en la 18.ª Exposición de Oro celebrada por el Ministerio de Trabajo de Taiwán. Esto ha fortalecido la posición de la empresa en la región de Asia y el Pacífico.
SKU-
Obtenga acceso en línea al informe sobre la primera nube de inteligencia de mercado del mundo

- Panel de análisis de datos interactivo
- Panel de análisis de empresas para oportunidades con alto potencial de crecimiento
- Acceso de analista de investigación para personalización y consultas
- Análisis de la competencia con panel interactivo
- Últimas noticias, actualizaciones y análisis de tendencias
- Aproveche el poder del análisis de referencia para un seguimiento integral de la competencia
Tabla de contenido
- introduction
- OBJECTIVES OF THE STUDY
- MARKET DEFINITION
- OVERVIEW of GLOBAL FLOCK ADHESIVES MARKET
- LIMITATIONS
- MARKETS COVERED
- MARKET SEGMENTATION
- MARKETS COVERED
- geographicAL scope
- years considered for the study
- currency and pricing
- DBMR TRIPOD DATA VALIDATION MODEL
- The product LIFE LINE CURVE
- MULTIVARIATE MODELING
- primary interviews with key opinion leaders
- DBMR MARKET POSITION GRID
- MARKET application COVERAGE GRID
- DBMR MARKET CHALLENGE MATRIX
- vendor share analysis
- IMPORT-EXPORT DATA
- secondary sourcEs
- assumptions
- EXECUTIVE SUMMARY
- premium insights
- Regional Summary
- Global
- NORTH AMERICA
- Asia-Pacific
- Europe
- South America
- Middle East and Africa
- market overview
- drivers
- Growing trend of lightweight and low carbon-emitting vehicles
- Positive outlook towards flock adhesives in automotive and textile sectors
- Rising adoption of flock adhesives to manufacturE thermal insulation
- Shifting consumer preference towards quality level of automotive interior
- restraints
- Volatility in Raw Material Prices
- Reaction of different composition structure
- Restricted supply of raw materials for producing flock adhesives
- opportunities
- Increasing R&D activities investments for the development of new products
- Upsurge in utilization of flock adhesives in printing and packaging sectors
- Flame retarding and high washability qualities based flock adhesives products creates lucrative opportunities
- challenges
- Stringent regulations associateD with the commercialization approval process
- Lack of awareness regarding Flock Adhesives in several emerging economies
- IMPACT OF COVID 19 IMPACT ON THE Global flock adhesives market
- ANALYSIS ON IMPACT OF COVID-19 ON THE Global flock adhesives market
- AFTERMATH OF COVID-19 AND GOVERNMENT INITIATIVE TO BOOST THE GLOBAL FLOCK ADHESIVES MARKET
- STRATEGIC DECISIONS FOR MANUFACTURERS AFTER COVID-19 TO GAIN COMPETITIVE MARKET SHARE
- IMPACT on PRICE
- IMPACT ON DEMAND
- IMPACT ON SUPPLY CHAIN
- CONCLUSION
- Global Flock Adhesives Market, BY PRODUCT
- overview
- acrylic
- POLYURETHANE
- EPOXY
- others
- Global Flock Adhesives Market, source
- OVERVIEW
- water-borne
- solvent-borne
- Global Flock Adhesives Market, BY substrate
- overview
- plastic
- metal
- textile
- wood
- glass
- OTHERS
- Global Flock Adhesives Market, BY application
- overview
- automotive
- acrylic
- polyurethane
- epoxy
- others
- Technical Textile & Clothing
- acrylic
- polyurethane
- epoxy
- others
- Paper & Packaging
- acrylic
- polyurethane
- epoxy
- others
- Printing
- acrylic
- polyurethane
- epoxy
- others
- others
- acrylic
- polyurethane
- epoxy
- others
- GLOBAL Flock adhesive market, BY region
- overview
- Asia-Pacific
- CHIna
- india
- japan
- south korea
- australia & new zealand
- indonesia
- thailand
- malaysia
- singapore
- philippines
- rest of asia-pacific
- Europe
- germany
- u.k
- russia
- france
- italy
- turkey
- spain
- netherlands
- belgium
- switzerland
- rest of europe
- South America
- brazil
- Argentina
- rest of south america
- Middle East & Africa
- U.A.E
- Saudi Arabia
- South africa
- israel
- egypt
- rest of Middle East & Africa
- North America
- U.S.
- Canada
- Mexico
- GLOBAL FLOCK ADHESIVES MARKET: COMPANY landscape
- company share analysis: GLOBAL
- company share analysis: north america
- company share analysis: EUROPE
- company share analysis: Asia-pacific
- MergerS, partnershipS & AcquisitionS
- EXPANSIONS
- new product developments
- swot analysis
- company profiles
- Dow
- COMPANY SNAPSHOT
- revenue analysis
- company share analysis
- Product Portfolio
- RECENT update
- Sika AG
- COMPANY SNAPSHOT
- revenue analysis
- company share analysis
- Product Portfolio
- RECENT updates
- Henkel AG & Co. KGaA
- COMPANY SNAPSHOT
- revenue analysis
- company share analysis
- Product Portfolio
- RECENT update
- PARKER HANNIFIN CORP
- COMPANY SNAPSHOT
- revenue analysis
- company share analysis
- Product Portfolio
- RECENT update
- Arkema
- COMPANY SNAPSHOT
- revenue analysis
- company share analysis
- Product Portfolio
- RECENT updates
- Avient Corporation
- COMPANY SNAPSHOT
- REVENUE ANALYSIS
- PRODUCT PORTFOLIO
- RECENT UPDATE
- H.B. Fuller Company
- COMPANY SNAPSHOT
- revenue analysis
- Product Portfolio
- RECENT updates
- CHT Group
- COMPANY SNAPSHOT
- Product Portfolio
- RECENT UPdates
- Kissel + Wolf Gmbh
- COMPANY SNAPSHOT
- PRODUCT PORTFOLIO
- RECENT UPDATE
- NANPAO RESINS CHEMICAL GROUP
- COMPANY SNAPSHOT
- revenue analysis
- Product Portfolio
- RECENT update
- NYATEX
- COMPANY SNAPSHOT
- Product Portfolio
- RECENT UPdate
- Stahl Holdings B.V
- COMPANY SNAPSHOT
- Product Portfolio
- RECENT Update
- SwissFlock AG
- COMPANY SNAPSHOT
- Product Portfolio
- RECENT UPdate
- QUESTIONNAIRE
- related reports
Lista de Tablas
TABLE 1 export DATA of Glues, prepared, and other prepared adhesives, n.e.s., HS 350699 (USD Thousand)
TABLE 2 import DATA OF GLUES, PREPARED, AND OTHER PREPARED ADHESIVES, N.E.S., HS 350699 (USD THOUSAND)
TABLE 3 Global Flock adhesives Market, By product, 2020-2029 (usd thousand)
TABLE 4 Global Flock adhesives Market, By product, 2020-2029 (tons)
TABLE 5 Global Acrylic in FLOCK ADHESIVES market, BY region, 2020-2029 (USD thousand)
TABLE 6 Global acrylic in FLOCK ADHESIVES market, BY region, 2020-2029 (Tons)
TABLE 7 Global Polyurethane in FLOCK ADHESIVES market, BY region, 2020-2029 (USD thousand)
TABLE 8 Global Polyurethane in FLOCK ADHESIVES market, BY region, 2020-2029 (TONS)
TABLE 9 Global Epoxy in FLOCK ADHESIVES market, BY region, 2020-2029 (USD thousand)
TABLE 10 Global Epoxy in FLOCK ADHESIVES market, BY region, 2020-2029 (tons)
TABLE 11 Global others in FLOCK ADHESIVES market, BY region, 2020-2029 (USD thousand)
TABLE 12 Global others in FLOCK ADHESIVES market, BY region, 2020-2029 (Tons)
TABLE 13 Global FLOCK ADHESIVES market, BY SOurce, 2022-2029 (USD Thousand)
TABLE 14 Global water-borne IN FLOCK ADHESIVES market, BY REGION, 2020-2029 (USD THOUSAND)
TABLE 15 Global Solvent-borne IN FLOCK ADHESIVES market, BY region, 2020-2029 (USD thousand)
TABLE 16 Global Flock adhesives Market, By Substrate, 2020-2029 (usd thousand)
TABLE 17 Global plastic in FLOCK ADHESIVES market, BY region, 2020-2029 (USD thousand)
TABLE 18 Global metal in FLOCK ADHESIVES market, BY region, 2020-2029 (USD thousand)
TABLE 19 Global textile in FLOCK ADHESIVES market, BY region, 2020-2029 (USD thousand)
TABLE 20 Global wood in FLOCK ADHESIVES market, BY region, 2020-2029 (USD thousand)
TABLE 21 Global glass in FLOCK ADHESIVES market, BY region, 2020-2029 (USD thousand)
TABLE 22 Global others in FLOCK ADHESIVES market, BY region, 2020-2029 (USD thousand)
TABLE 23 Global Flock adhesives Market, By application, 2020-2029 (usd thousand)
TABLE 24 Global Automotive in FLOCK ADHESIVES market, BY region, 2020-2029 (USD thousand)
TABLE 25 Global Automotive in FLOCK ADHESIVES market, BY Product, 2020-2029 (USD thousand)
TABLE 26 Global Technical Textile & Clothing in FLOCK ADHESIVES market, BY region, 2020-2029 (USD thousand)
TABLE 27 Global Technical Textile & Clothing in FLOCK ADHESIVES market, BY Product, 2020-2029 (USD thousand)
TABLE 28 Global Paper & Packaging in FLOCK ADHESIVES market, BY region, 2020-2029 (USD thousand)
TABLE 29 Global Paper & Packaging in FLOCK ADHESIVES market, BY Product, 2020-2029 (USD thousand)
TABLE 30 Global Printing in FLOCK ADHESIVES market, BY region, 2020-2029 (USD thousand)
TABLE 31 Global Printing in FLOCK ADHESIVES market, BY Product, 2020-2029 (USD thousand)
TABLE 32 Global others in FLOCK ADHESIVES market, BY region, 2020-2029 (USD thousand)
TABLE 33 Global OTHERS in FLOCK ADHESIVES market, BY Product, 2020-2029 (USD thousand)
TABLE 34 GLOBAL flock adhesive market, By region, 2020-2029 (USD thousand)
TABLE 35 GLOBAL flock adhesive market, By region, 2020-2029 (TONS)
TABLE 36 Asia-Pacific Flock Adhesives Market, BY COUNTRY, 2020-2029 (USD Thousand)
TABLE 37 Asia-Pacific Flock Adhesives Market, BY COUNTRY, 2020-2029 (Tons)
TABLE 38 Asia-Pacific Flock Adhesives Market, By product, 2020-2029 (USD THOUSAND)
TABLE 39 Asia-Pacific Flock Adhesives Market, By product, 2020-2029 (Tons)
TABLE 40 Asia-Pacific Flock Adhesives Market, BY source, 2020-2029 (USD Thousand)
TABLE 41 Asia-Pacific Flock Adhesives Market, By substrate, 2020-2029 (USD Thousand)
TABLE 42 Asia-Pacific Flock Adhesives Market, BY application, 2020-2029 (USD Thousand)
TABLE 43 Asia-Pacific automotive in Flock Adhesives Market, BY product, 2020-2029 (USD Thousand)
TABLE 44 Asia-Pacific technical textile & clothing in Flock Adhesives Market, By product, 2020-2029 (usd thousand)
TABLE 45 Asia-Pacific paper & packaging in Flock Adhesives Market, By product, 2020-2029 (usd thousand)
TABLE 46 Asia-Pacific printing in Flock Adhesives Market, By product, 2020-2029 (usd thousand)
TABLE 47 Asia-Pacific others in Flock Adhesives Market, By product, 2020-2029 (usd thousand)
TABLE 48 china Flock Adhesives Market, By product, 2020-2029 (USD THOUSAND)
TABLE 49 china Flock Adhesives Market, By product, 2020-2029 (Tons)
TABLE 50 china Flock Adhesives Market, BY source, 2020-2029 (USD Thousand)
TABLE 51 china Flock Adhesives Market, By substrate, 2020-2029 (USD Thousand)
TABLE 52 china Flock Adhesives Market, BY application, 2020-2029 (USD Thousand)
TABLE 53 china automotive in Flock Adhesives Market, BY product, 2020-2029 (USD Thousand)
TABLE 54 china technical textile & clothing in Flock Adhesives Market, By product, 2020-2029 (usd thousand)
TABLE 55 china paper & packaging in Flock Adhesives Market, By product, 2020-2029 (usd thousand)
TABLE 56 china printing in Flock Adhesives Market, By product, 2020-2029 (usd thousand)
TABLE 57 china others in Flock Adhesives Market, By product, 2020-2029 (usd thousand)
TABLE 58 india Flock Adhesives Market, By product, 2020-2029 (USD THOUSAND)
TABLE 59 india Flock Adhesives Market, By product, 2020-2029 (Tons)
TABLE 60 india Flock Adhesives Market, BY source, 2020-2029 (USD Thousand)
TABLE 61 india Flock Adhesives Market, By substrate, 2020-2029 (USD Thousand)
TABLE 62 india Flock Adhesives Market, BY application, 2020-2029 (USD Thousand)
TABLE 63 india automotive in Flock Adhesives Market, BY product, 2020-2029 (USD Thousand)
TABLE 64 india technical textile & clothing in Flock Adhesives Market, By product, 2020-2029 (usd thousand)
TABLE 65 india paper & packaging in Flock Adhesives Market, By product, 2020-2029 (usd thousand)
TABLE 66 india printing in Flock Adhesives Market, By product, 2020-2029 (usd thousand)
TABLE 67 india others in Flock Adhesives Market, By product, 2020-2029 (usd thousand)
TABLE 68 japan Flock Adhesives Market, By product, 2020-2029 (USD THOUSAND)
TABLE 69 japan Flock Adhesives Market, By product, 2020-2029 (Tons)
TABLE 70 japan Flock Adhesives Market, BY source, 2020-2029 (USD Thousand)
TABLE 71 japan Flock Adhesives Market, By substrate, 2020-2029 (USD Thousand)
TABLE 72 japan Flock Adhesives Market, BY application, 2020-2029 (USD Thousand)
TABLE 73 japan automotive in Flock Adhesives Market, BY product, 2020-2029 (USD Thousand)
TABLE 74 japan technical textile & clothing in Flock Adhesives Market, By product, 2020-2029 (usd thousand)
TABLE 75 japan paper & packaging in Flock Adhesives Market, By product, 2020-2029 (usd thousand)
TABLE 76 japan printing in Flock Adhesives Market, By product, 2020-2029 (usd thousand)
TABLE 77 japan others in Flock Adhesives Market, By product, 2020-2029 (usd thousand)
TABLE 78 South korea Flock Adhesives Market, By product, 2020-2029 (USD THOUSAND)
TABLE 79 South korea Flock Adhesives Market, By product, 2020-2029 (Tons)
TABLE 80 South korea Flock Adhesives Market, BY source, 2020-2029 (USD Thousand)
TABLE 81 South korea Flock Adhesives Market, By substrate, 2020-2029 (USD Thousand)
TABLE 82 South korea Flock Adhesives Market, BY application, 2020-2029 (USD Thousand)
TABLE 83 South korea automotive in Flock Adhesives Market, BY product, 2020-2029 (USD Thousand)
TABLE 84 South korea technical textile & clothing in Flock Adhesives Market, By product, 2020-2029 (usd thousand)
TABLE 85 South korea paper & packaging in Flock Adhesives Market, By product, 2020-2029 (usd thousand)
TABLE 86 South korea printing in Flock Adhesives Market, By product, 2020-2029 (usd thousand)
TABLE 87 South korea others in Flock Adhesives Market, By product, 2020-2029 (usd thousand)
TABLE 88 Australia & new zealand Flock Adhesives Market, By product, 2020-2029 (USD THOUSAND)
TABLE 89 Australia & new zealand Flock Adhesives Market, By product, 2020-2029 (Tons)
TABLE 90 Australia & new zealand Flock Adhesives Market, BY source, 2020-2029 (USD Thousand)
TABLE 91 Australia & new zealand Flock Adhesives Market, By substrate, 2020-2029 (USD Thousand)
TABLE 92 Australia & new zealand Flock Adhesives Market, BY application, 2020-2029 (USD Thousand)
TABLE 93 Australia & new zealand automotive in Flock Adhesives Market, BY product, 2020-2029 (USD Thousand)
TABLE 94 Australia & new zealand technical textile & clothing in Flock Adhesives Market, By product, 2020-2029 (usd thousand)
TABLE 95 Australia & new zealand paper & packaging in Flock Adhesives Market, By product, 2020-2029 (usd thousand)
TABLE 96 Australia & new zealand printing in Flock Adhesives Market, By product, 2020-2029 (usd thousand)
TABLE 97 Australia & new zealand others in Flock Adhesives Market, By product, 2020-2029 (usd thousand)
TABLE 98 indonesia Flock Adhesives Market, By product, 2020-2029 (USD THOUSAND)
TABLE 99 indonesia Flock Adhesives Market, By product, 2020-2029 (Tons)
TABLE 100 indonesia Flock Adhesives Market, BY source, 2020-2029 (USD Thousand)
TABLE 101 indonesia Flock Adhesives Market, By substrate, 2020-2029 (USD Thousand)
TABLE 102 indonesia Flock Adhesives Market, BY application, 2020-2029 (USD Thousand)
TABLE 103 indonesia automotive in Flock Adhesives Market, BY product, 2020-2029 (USD Thousand)
TABLE 104 indonesia technical textile & clothing in Flock Adhesives Market, By product, 2020-2029 (usd thousand)
TABLE 105 indonesia paper & packaging in Flock Adhesives Market, By product, 2020-2029 (usd thousand)
TABLE 106 indonesia printing in Flock Adhesives Market, By product, 2020-2029 (usd thousand)
TABLE 107 indonesia others in Flock Adhesives Market, By product, 2020-2029 (usd thousand)
TABLE 108 thailand Flock Adhesives Market, By product, 2020-2029 (USD THOUSAND)
TABLE 109 thailand Flock Adhesives Market, By product, 2020-2029 (Tons)
TABLE 110 thailand Flock Adhesives Market, BY source, 2020-2029 (USD Thousand)
TABLE 111 thailand Flock Adhesives Market, By substrate, 2020-2029 (USD Thousand)
TABLE 112 thailand Flock Adhesives Market, BY application, 2020-2029 (USD Thousand)
TABLE 113 thailand automotive in Flock Adhesives Market, BY product, 2020-2029 (USD Thousand)
TABLE 114 thailand technical textile & clothing in Flock Adhesives Market, By product, 2020-2029 (usd thousand)
TABLE 115 thailand paper & packaging in Flock Adhesives Market, By product, 2020-2029 (usd thousand)
TABLE 116 thailand printing in Flock Adhesives Market, By product, 2020-2029 (usd thousand)
TABLE 117 thailand others in Flock Adhesives Market, By product, 2020-2029 (usd thousand)
TABLE 118 malaysia Flock Adhesives Market, By product, 2020-2029 (USD THOUSAND)
TABLE 119 malaysia Flock Adhesives Market, By product, 2020-2029 (Tons)
TABLE 120 malaysia Flock Adhesives Market, BY source, 2020-2029 (USD Thousand)
TABLE 121 malaysia Flock Adhesives Market, By substrate, 2020-2029 (USD Thousand)
TABLE 122 malaysia Flock Adhesives Market, BY application, 2020-2029 (USD Thousand)
TABLE 123 malaysia automotive in Flock Adhesives Market, BY product, 2020-2029 (USD Thousand)
TABLE 124 malaysia technical textile & clothing in Flock Adhesives Market, By product, 2020-2029 (usd thousand)
TABLE 125 malaysia paper & packaging in Flock Adhesives Market, By product, 2020-2029 (usd thousand)
TABLE 126 malaysia printing in Flock Adhesives Market, By product, 2020-2029 (usd thousand)
TABLE 127 malaysia others in Flock Adhesives Market, By product, 2020-2029 (usd thousand)
TABLE 128 singapore Flock Adhesives Market, By product, 2020-2029 (USD THOUSAND)
TABLE 129 singapore Flock Adhesives Market, By product, 2020-2029 (Tons)
TABLE 130 singapore Flock Adhesives Market, BY source, 2020-2029 (USD Thousand
TABLE 131 singapore Flock Adhesives Market, By substrate, 2020-2029 (USD Thousand)
TABLE 132 singapore Flock Adhesives Market, BY application, 2020-2029 (USD Thousand)
TABLE 133 singapore automotive in Flock Adhesives Market, BY product, 2020-2029 (USD Thousand)
TABLE 134 singapore technical textile & clothing in Flock Adhesives Market, By product, 2020-2029 (usd thousand)
TABLE 135 singapore paper & packaging in Flock Adhesives Market, By product, 2020-2029 (usd thousand)
TABLE 136 singapore printing in Flock Adhesives Market, By product, 2020-2029 (usd thousand)
TABLE 137 singapore others in Flock Adhesives Market, By product, 2020-2029 (usd thousand)
TABLE 138 philippines Flock Adhesives Market, By product, 2020-2029 (USD THOUSAND)
TABLE 139 philippines Flock Adhesives Market, By product, 2020-2029 (Tons)
TABLE 140 philippines Flock Adhesives Market, BY source, 2020-2029 (USD Thousand
TABLE 141 philippines Flock Adhesives Market, By substrate, 2020-2029 (USD Thousand)
TABLE 142 philippines Flock Adhesives Market, BY application, 2020-2029 (USD Thousand)
TABLE 143 philippines automotive in Flock Adhesives Market, BY product, 2020-2029 (USD Thousand)
TABLE 144 philippines technical textile & clothing in Flock Adhesives Market, By product, 2020-2029 (usd thousand)
TABLE 145 philippines paper & packaging in Flock Adhesives Market, By product, 2020-2029 (usd thousand)
TABLE 146 philippines printing in Flock Adhesives Market, By product, 2020-2029 (usd thousand)
TABLE 147 philippines others in Flock Adhesives Market, By product, 2020-2029 (usd thousand)
TABLE 148 rest of Asia-Pacific Flock Adhesives Market, By product, 2020-2029 (USD THOUSAND)
TABLE 149 rest of Asia-Pacific Flock Adhesives Market, By product, 2020-2029 (Tons)
TABLE 150 Europe Flock Adhesives Market, BY COUNTRY, 2020-2029 (USD Thousand)
TABLE 151 Europe Flock Adhesives Market, BY COUNTRY, 2020-2029 (tons)
TABLE 152 Europe Flock Adhesives Market, By Product, 2020-2029 (USD THOUSAND)
TABLE 153 Europe Flock Adhesives Market, By Product, 2020-2029 (Tons)
TABLE 154 Europe flock adhesives Market, BY SOURCE, 2020-2029 (USD Thousand)
TABLE 155 Europe flock adhesives Market, By Substrate, 2020-2029 (USD Thousand)
TABLE 156 Europe Flock Adhesives Market, BY application, 2020-2029 (USD Thousand)
TABLE 157 EUROPE AUTOMOTIVE in Flock Adhesives Market, BY product, 2020-2029 (USD Thousand)
TABLE 158 EUROPE Technical Textile and Clothing in Flock Adhesives Market, BY product, 2020-2029 (USD Thousand)
TABLE 159 EUROPE Paper and packaging in Flock Adhesives Market, BY product, 2020-2029 (USD Thousand)
TABLE 160 EUROPE printing in Flock Adhesives Market, BY product, 2020-2029 (USD Thousand)
TABLE 161 EUROPE others in Flock Adhesives Market, BY product, 2020-2029 (USD Thousand)
TABLE 162 germany Flock Adhesives Market, By product, 2020-2029 (usd thousand)
TABLE 163 germany Flock Adhesives Market, By product, 2020-2029 (tons)
TABLE 164 germany Flock Adhesives Market, By source, 2020-2029 (usd thousand)
TABLE 165 germany Flock Adhesives Market, By substrate, 2020-2029 (usd thousand)
TABLE 166 germany Flock Adhesives Market, By application, 2020-2029 (usd thousand)
TABLE 167 germany AUTOMOTIVE in Flock Adhesives Market, BY product, 2020-2029 (USD Thousand)
TABLE 168 germany Technical Textile and Clothing in Flock Adhesives Market, BY product, 2020-2029 (USD Thousand)
TABLE 169 germany Paper and packaging in Flock Adhesives Market, BY product, 2020-2029 (USD Thousand)
TABLE 170 germany printing in Flock Adhesives Market, BY product, 2020-2029 (USD Thousand)
TABLE 171 germany others in Flock Adhesives Market, BY product, 2020-2029 (USD Thousand)
TABLE 172 U.K. Flock Adhesives Market, BY product, 2020-2029 (USD Thousand)
TABLE 173 U.K. Flock Adhesives Market, BY product, 2020-2029 (tons)
TABLE 174 U.K. Flock Adhesives Market, By source, 2020-2029 (usd thousand)
TABLE 175 U.K. Flock Adhesives Market, By substrate, 2020-2029 (usd thousand)
TABLE 176 U.K. Flock Adhesives Market, By application, 2020-2029 (usd thousand)
TABLE 177 U.K. AUTOMOTIVE in Flock Adhesives Market, BY product, 2020-2029 (USD Thousand)
TABLE 178 U.K. Technical Textile and Clothing in Flock Adhesives Market, BY product, 2020-2029 (USD Thousand)
TABLE 179 U.K. Paper and packaging in Flock Adhesives Market, BY product, 2020-2029 (USD Thousand)
TABLE 180 U.K. printing in Flock Adhesives Market, BY product, 2020-2029 (USD Thousand)
TABLE 181 U.K. others in Flock Adhesives Market, BY product, 2020-2029 (USD Thousand)
TABLE 182 Russia Flock Adhesives Market, By product, 2020-2029 (usd thousand)
TABLE 183 Russia Flock Adhesives Market, By product, 2020-2029 (tons)
TABLE 184 Russia Flock Adhesives Market, By source, 2020-2029 (usd thousand)
TABLE 185 Russia Flock Adhesives Market, By substrate, 2020-2029 (usd thousand)
TABLE 186 Russia Flock Adhesives Market, By application, 2020-2029 (usd thousand)
TABLE 187 Russia AUTOMOTIVE in Flock Adhesives Market, BY product, 2020-2029 (USD Thousand)
TABLE 188 Russia Technical Textile and Clothing in Flock Adhesives Market, BY product, 2020-2029 (USD Thousand)
TABLE 189 Russia Paper and packaging in Flock Adhesives Market, BY product, 2020-2029 (USD Thousand)
TABLE 190 Russia printing in Flock Adhesives Market, BY product, 2020-2029 (USD Thousand)
TABLE 191 Russia others in Flock Adhesives Market, BY product, 2020-2029 (USD Thousand)
TABLE 192 France Flock Adhesives Market, By product, 2020-2029 (usd thousand)
TABLE 193 France Flock Adhesives Market, By product, 2020-2029 (tons)
TABLE 194 France Flock Adhesives Market, By source, 2020-2029 (usd thousand)
TABLE 195 France Flock Adhesives Market, By substrate, 2020-2029 (usd thousand)
TABLE 196 France Flock Adhesives Market, By application, 2020-2029 (usd thousand)
TABLE 197 France AUTOMOTIVE in Flock Adhesives Market, BY product, 2020-2029 (USD Thousand)
TABLE 198 France Technical Textile and Clothing in Flock Adhesives Market, BY product, 2020-2029 (USD Thousand)
TABLE 199 France Paper and packaging in Flock Adhesives Market, BY product, 2020-2029 (USD Thousand)
TABLE 200 France printing in Flock Adhesives Market, BY product, 2020-2029 (USD Thousand)
TABLE 201 France others in Flock Adhesives Market, BY product, 2020-2029 (USD Thousand)
TABLE 202 Italy Flock Adhesives Market, By product, 2020-2029 (usd thousand)
TABLE 203 Italy Flock Adhesives Market, By product, 2020-2029 (tons)
TABLE 204 Italy Flock Adhesives Market, By source, 2020-2029 (usd thousand)
TABLE 205 Italy Flock Adhesives Market, By substrate, 2020-2029 (usd thousand)
TABLE 206 Italy Flock Adhesives Market, By application, 2020-2029 (usd thousand)
TABLE 207 Italy AUTOMOTIVE in Flock Adhesives Market, BY product, 2020-2029 (USD Thousand)
TABLE 208 Italy Technical Textile and Clothing in Flock Adhesives Market, BY product, 2020-2029 (USD Thousand)
TABLE 209 Italy Paper and packaging in Flock Adhesives Market, BY product, 2020-2029 (USD Thousand)
TABLE 210 Italy printing in Flock Adhesives Market, BY product, 2020-2029 (USD Thousand)
TABLE 211 Italy others in Flock Adhesives Market, BY product, 2020-2029 (USD Thousand)
TABLE 212 Turkey Flock Adhesives Market, By product, 2020-2029 (usd thousand)
TABLE 213 Turkey Flock Adhesives Market, By product, 2020-2029 (tons)
TABLE 214 Turkey Flock Adhesives Market, By source, 2020-2029 (usd thousand)
TABLE 215 Turkey Flock Adhesives Market, By substrate, 2020-2029 (usd thousand)
TABLE 216 Turkey Flock Adhesives Market, By application, 2020-2029 (usd thousand)
TABLE 217 Turkey AUTOMOTIVE in Flock Adhesives Market, BY product, 2020-2029 (USD Thousand)
TABLE 218 Turkey Technical Textile and Clothing in Flock Adhesives Market, BY product, 2020-2029 (USD Thousand)
TABLE 219 Turkey Paper and packaging in Flock Adhesives Market, BY product, 2020-2029 (USD Thousand)
TABLE 220 Turkey printing in Flock Adhesives Market, BY product, 2020-2029 (USD Thousand)
TABLE 221 Turkey others in Flock Adhesives Market, BY product, 2020-2029 (USD Thousand)
TABLE 222 Spain Flock Adhesives Market, By product, 2020-2029 (usd thousand)
TABLE 223 Spain Flock Adhesives Market, By product, 2020-2029 (tons)
TABLE 224 Spain Flock Adhesives Market, By source, 2020-2029 (usd thousand)
TABLE 225 Spain Flock Adhesives Market, By substrate, 2020-2029 (usd thousand)
TABLE 226 Spain Flock Adhesives Market, By application, 2020-2029 (usd thousand)
TABLE 227 Spain AUTOMOTIVE in Flock Adhesives Market, BY product, 2020-2029 (USD Thousand)
TABLE 228 Spain Technical Textile and Clothing in Flock Adhesives Market, BY product, 2020-2029 (USD Thousand)
TABLE 229 Spain Paper and packaging in Flock Adhesives Market, BY product, 2020-2029 (USD Thousand)
TABLE 230 Spain printing in Flock Adhesives Market, BY product, 2020-2029 (USD Thousand)
TABLE 231 Spain others in Flock Adhesives Market, BY product, 2020-2029 (USD Thousand)
TABLE 232 Netherlands Flock Adhesives Market, By product, 2020-2029 (usd thousand)
TABLE 233 Netherlands Flock Adhesives Market, By product, 2020-2029 (tons)
TABLE 234 Netherlands Flock Adhesives Market, By source, 2020-2029 (usd thousand)
TABLE 235 Netherlands Flock Adhesives Market, By substrate, 2020-2029 (usd thousand)
TABLE 236 Netherlands Flock Adhesives Market, By application, 2020-2029 (usd thousand)
TABLE 237 Netherlands AUTOMOTIVE in Flock Adhesives Market, BY product, 2020-2029 (USD Thousand)
TABLE 238 Netherlands Technical Textile and Clothing in Flock Adhesives Market, BY product, 2020-2029 (USD Thousand)
TABLE 239 Netherlands Paper and packaging in Flock Adhesives Market, BY product, 2020-2029 (USD Thousand)
TABLE 240 Netherlands printing in Flock Adhesives Market, BY product, 2020-2029 (USD Thousand)
TABLE 241 Netherlands others in Flock Adhesives Market, BY product, 2020-2029 (USD Thousand)
TABLE 242 Belgium Flock Adhesives Market, By product, 2020-2029 (usd thousand)
TABLE 243 Belgium Flock Adhesives Market, By product, 2020-2029 (tons)
TABLE 244 Belgium Flock Adhesives Market, By source, 2020-2029 (usd thousand)
TABLE 245 Belgium Flock Adhesives Market, By substrate, 2020-2029 (usd thousand)
TABLE 246 Belgium Flock Adhesives Market, By application, 2020-2029 (usd thousand)
TABLE 247 Belgium AUTOMOTIVE in Flock Adhesives Market, BY product, 2020-2029 (USD Thousand)
TABLE 248 Belgium Technical Textile and Clothing in Flock Adhesives Market, BY product, 2020-2029 (USD Thousand)
TABLE 249 Belgium Paper and packaging in Flock Adhesives Market, BY product, 2020-2029 (USD Thousand)
TABLE 250 Belgium printing in Flock Adhesives Market, BY product, 2020-2029 (USD Thousand)
TABLE 251 Belgium others in Flock Adhesives Market, BY product, 2020-2029 (USD Thousand)
TABLE 252 Switzerland Flock Adhesives Market, By product, 2020-2029 (usd thousand)
TABLE 253 Switzerland Flock Adhesives Market, By product, 2020-2029 (tons)
TABLE 254 Switzerland Flock Adhesives Market, By source, 2020-2029 (usd thousand)
TABLE 255 Switzerland Flock Adhesives Market, By substrate, 2020-2029 (usd thousand)
TABLE 256 Switzerland Flock Adhesives Market, By application, 2020-2029 (usd thousand)
TABLE 257 Switzerland AUTOMOTIVE in Flock Adhesives Market, BY product, 2020-2029 (USD Thousand)
TABLE 258 Switzerland Technical Textile and Clothing in Flock Adhesives Market, BY product, 2020-2029 (USD Thousand)
TABLE 259 Switzerland Paper and packaging in Flock Adhesives Market, BY product, 2020-2029 (USD Thousand)
TABLE 260 Switzerland printing in Flock Adhesives Market, BY product, 2020-2029 (USD Thousand)
TABLE 261 Switzerland others in Flock Adhesives Market, BY product, 2020-2029 (USD Thousand)
TABLE 262 Rest of Europe Flock Adhesives Market, By product, 2020-2029 (usd thousand)
TABLE 263 Rest of Europe Flock Adhesives Market, By product, 2020-2029 (tons)
TABLE 264 South America Flock Adhesives Market, BY COUNTRY, 2020-2029 (USD Thousand)
TABLE 265 South America Flock Adhesives Market, BY COUNTRY, 2020-2029 (tons)
TABLE 266 South America Flock Adhesives Market, By Product, 2020-2029 (USD THOUSAND)
TABLE 267 South America Flock Adhesives Market, By Product, 2020-2029 (Tons)
TABLE 268 South America flock adhesives Market, BY SOURCE, 2020-2029 (USD Thousand)
TABLE 269 South America flock adhesives Market, By Substrate, 2020-2029 (USD Thousand)
TABLE 270 South America Flock Adhesives Market, BY application, 2020-2029 (USD Thousand)
TABLE 271 South America AUTOMOTIVE in Flock Adhesives Market, BY product, 2020-2029 (USD Thousand)
TABLE 272 South America Technical Textile and Clothing in Flock Adhesives Market, BY product, 2020-2029 (USD Thousand)
TABLE 273 South America Paper and packaging in Flock Adhesives Market, BY product, 2020-2029 (USD Thousand)
TABLE 274 South America printing in Flock Adhesives Market, BY product, 2020-2029 (USD Thousand)
TABLE 275 South America others in Flock Adhesives Market, BY product, 2020-2029 (USD Thousand)
TABLE 276 Brazil Flock Adhesives Market, By product, 2020-2029 (usd thousand)
TABLE 277 Brazil Flock Adhesives Market, By product, 2020-2029 (tons)
TABLE 278 Brazil Flock Adhesives Market, By source, 2020-2029 (usd thousand)
TABLE 279 Brazil Flock Adhesives Market, By substrate, 2020-2029 (usd thousand)
TABLE 280 Brazil Flock Adhesives Market, By application, 2020-2029 (usd thousand)
TABLE 281 Brazil AUTOMOTIVE in Flock Adhesives Market, BY product, 2020-2029 (USD Thousand)
TABLE 282 Brazil Technical Textile and Clothing in Flock Adhesives Market, BY product, 2020-2029 (USD Thousand)
TABLE 283 Brazil Paper and packaging in Flock Adhesives Market, BY product, 2020-2029 (USD Thousand)
TABLE 284 Brazil printing in Flock Adhesives Market, BY product, 2020-2029 (USD Thousand)
TABLE 285 Brazil others in Flock Adhesives Market, BY product, 2020-2029 (USD Thousand)
TABLE 286 Argentina Flock Adhesives Market, BY product, 2020-2029 (USD Thousand)
TABLE 287 Argentina Flock Adhesives Market, BY product, 2020-2029 (tons)
TABLE 288 Argentina Flock Adhesives Market, By source, 2020-2029 (usd thousand)
TABLE 289 Argentina Flock Adhesives Market, By substrate, 2020-2029 (usd thousand)
TABLE 290 Argentina Flock Adhesives Market, By application, 2020-2029 (usd thousand)
TABLE 291 Argentina AUTOMOTIVE in Flock Adhesives Market, BY product, 2020-2029 (USD Thousand)
TABLE 292 Argentina Technical Textile and Clothing in Flock Adhesives Market, BY product, 2020-2029 (USD Thousand)
TABLE 293 Argentina Paper and packaging in Flock Adhesives Market, BY product, 2020-2029 (USD Thousand)
TABLE 294 Argentina printing in Flock Adhesives Market, BY product, 2020-2029 (USD Thousand)
TABLE 295 Argentina others in Flock Adhesives Market, BY product, 2020-2029 (USD Thousand)
TABLE 296 Rest of South America Flock Adhesives Market, By product, 2020-2029 (usd thousand)
TABLE 297 Rest of South America Flock Adhesives Market, By product, 2020-2029 (tons)
TABLE 298 Middle East & Africa Flock Adhesives Market, BY COUNTRY, 2020-2029 (USD Thousand)
TABLE 299 Middle East & Africa Flock Adhesives Market, BY COUNTRY, 2020-2029 (Tons)
TABLE 300 Middle East & Africa Flock Adhesives Market, By product, 2020-2029 (USD THOUSAND)
TABLE 301 Middle East & Africa Flock Adhesives Market, By product, 2020-2029 (Tons)
TABLE 302 Middle East & Africa Flock Adhesives Market, BY source, 2020-2029 (USD Thousand)
TABLE 303 Middle East & Africa Flock Adhesives Market, By substrate, 2020-2029 (USD Thousand)
TABLE 304 Middle East & Africa Flock Adhesives Market, BY application, 2020-2029 (USD Thousand)
TABLE 305 Middle East & Africa automotive in Flock Adhesives Market, BY product, 2020-2029 (USD Thousand)
TABLE 306 Middle East & Africa technical textile & clothing in Flock Adhesives Market, By product, 2020-2029 (usd thousand)
TABLE 307 Middle East & Africa paper & packaging in Flock Adhesives Market, By product, 2020-2029 (usd thousand)
TABLE 308 Middle East & Africa printing in Flock Adhesives Market, By product, 2020-2029 (usd thousand)
TABLE 309 Middle East & Africa others in Flock Adhesives Market, By product, 2020-2029 (usd thousand)
TABLE 310 U.A.E Flock Adhesives Market, By product, 2020-2029 (USD THOUSAND)
TABLE 311 U.A.E Flock Adhesives Market, By product, 2020-2029 (Tons)
TABLE 312 U.A.E Flock Adhesives Market, BY source, 2020-2029 (USD Thousand)
TABLE 313 U.A.E Flock Adhesives Market, By substrate, 2020-2029 (USD Thousand)
TABLE 314 U.A.E Flock Adhesives Market, BY application, 2020-2029 (USD Thousand)
TABLE 315 U.A.E automotive in Flock Adhesives Market, BY product, 2020-2029 (USD Thousand)
TABLE 316 U.A.E technical textile & clothing in Flock Adhesives Market, By product, 2020-2029 (usd thousand)
TABLE 317 U.A.E paper & packaging in Flock Adhesives Market, By product, 2020-2029 (usd thousand)
TABLE 318 U.A.E printing in Flock Adhesives Market, By product, 2020-2029 (usd thousand)
TABLE 319 U.A.E others in Flock Adhesives Market, By product, 2020-2029 (usd thousand)
TABLE 320 Saudi Arabia Flock Adhesives Market, By product, 2020-2029 (USD THOUSAND)
TABLE 321 Saudi Arabia Flock Adhesives Market, By product, 2020-2029 (Tons)
TABLE 322 Saudi Arabia Flock Adhesives Market, BY source, 2020-2029 (USD Thousand)
TABLE 323 Saudi Arabia Flock Adhesives Market, By substrate, 2020-2029 (USD Thousand)
TABLE 324 Saudi Arabia Flock Adhesives Market, BY application, 2020-2029 (USD Thousand)
TABLE 325 Saudi Arabia automotive in Flock Adhesives Market, BY product, 2020-2029 (USD Thousand)
TABLE 326 Saudi Arabia technical textile & clothing in Flock Adhesives Market, By product, 2020-2029 (usd thousand)
TABLE 327 Saudi Arabia paper & packaging in Flock Adhesives Market, By product, 2020-2029 (usd thousand)
TABLE 328 Saudi Arabia printing in Flock Adhesives Market, By product, 2020-2029 (usd thousand)
TABLE 329 Saudi Arabia others in Flock Adhesives Market, By product, 2020-2029 (usd thousand)
TABLE 330 South Africa Flock Adhesives Market, By product, 2020-2029 (USD THOUSAND)
TABLE 331 South Africa Flock Adhesives Market, By product, 2020-2029 (Tons)
TABLE 332 South Africa Flock Adhesives Market, BY source, 2020-2029 (USD Thousand)
TABLE 333 South Africa Flock Adhesives Market, By substrate, 2020-2029 (USD Thousand)
TABLE 334 South Africa Flock Adhesives Market, BY application, 2020-2029 (USD Thousand)
TABLE 335 South Africa automotive in Flock Adhesives Market, BY product, 2020-2029 (USD Thousand)
TABLE 336 South Africa technical textile & clothing in Flock Adhesives Market, By product, 2020-2029 (usd thousand)
TABLE 337 South Africa paper & packaging in Flock Adhesives Market, By product, 2020-2029 (usd thousand)
TABLE 338 South Africa printing in Flock Adhesives Market, By product, 2020-2029 (usd thousand)
TABLE 339 South Africa others in Flock Adhesives Market, By product, 2020-2029 (usd thousand)
TABLE 340 Israel Flock Adhesives Market, By product, 2020-2029 (USD THOUSAND)
TABLE 341 Israel Flock Adhesives Market, By product, 2020-2029 (Tons)
TABLE 342 Israel Flock Adhesives Market, BY source, 2020-2029 (USD Thousand)
TABLE 343 Israel Flock Adhesives Market, By substrate, 2020-2029 (USD Thousand)
TABLE 344 Israel Flock Adhesives Market, BY application, 2020-2029 (USD Thousand)
TABLE 345 Israel automotive in Flock Adhesives Market, BY product, 2020-2029 (USD Thousand)
TABLE 346 Israel technical textile & clothing in Flock Adhesives Market, By product, 2020-2029 (usd thousand)
TABLE 347 Israel paper & packaging in Flock Adhesives Market, By product, 2020-2029 (usd thousand)
TABLE 348 Israel printing in Flock Adhesives Market, By product, 2020-2029 (usd thousand)
TABLE 349 Israel others in Flock Adhesives Market, By product, 2020-2029 (usd thousand)
TABLE 350 Egypt Flock Adhesives Market, By product, 2020-2029 (USD THOUSAND)
TABLE 351 Egypt Flock Adhesives Market, By product, 2020-2029 (Tons)
TABLE 352 Egypt Flock Adhesives Market, BY source, 2020-2029 (USD Thousand)
TABLE 353 Egypt Flock Adhesives Market, By substrate, 2020-2029 (USD Thousand)
TABLE 354 Egypt Flock Adhesives Market, BY application, 2020-2029 (USD Thousand)
TABLE 355 Egypt automotive in Flock Adhesives Market, BY product, 2020-2029 (USD Thousand)
TABLE 356 Egypt technical textile & clothing in Flock Adhesives Market, By product, 2020-2029 (usd thousand)
TABLE 357 Egypt paper & packaging in Flock Adhesives Market, By product, 2020-2029 (usd thousand)
TABLE 358 Egypt printing in Flock Adhesives Market, By product, 2020-2029 (usd thousand)
TABLE 359 Egypt others in Flock Adhesives Market, By product, 2020-2029 (usd thousand)
TABLE 360 rest of Middle East & Africa Flock Adhesives Market, By product, 2020-2029 (USD THOUSAND)
TABLE 361 rest of Middle East & Africa Flock Adhesives Market, By product, 2020-2029 (Tons)
TABLE 362 North America Flock Adhesives Market, BY COUNTRY, 2020-2029 (USD Thousand)
TABLE 363 North America Flock Adhesives Market, BY COUNTRY, 2020-2029 (Tons)
TABLE 364 North America Flock Adhesives Market, By product, 2020-2029 (USD THOUSAND)
TABLE 365 North America Flock Adhesives Market, By product, 2020-2029 (Tons)
TABLE 366 North America Flock Adhesives Market, BY source, 2020-2029 (USD Thousand)
TABLE 367 North America Flock Adhesives Market, By substrate, 2020-2029 (USD Thousand)
TABLE 368 North America Flock Adhesives Market, BY application, 2020-2029 (USD Thousand)
TABLE 369 North America automotive in Flock Adhesives Market, BY product, 2020-2029 (USD Thousand)
TABLE 370 North America technical textile & clothing in Flock Adhesives Market, By product, 2020-2029 (usd thousand)
TABLE 371 North America paper & packaging in Flock Adhesives Market, By product, 2020-2029 (usd thousand)
TABLE 372 North America printing in Flock Adhesives Market, By product, 2020-2029 (usd thousand)
TABLE 373 North America others in Flock Adhesives Market, By product, 2020-2029 (usd thousand)
TABLE 374 U.S. Flock Adhesives Market, By product, 2020-2029 (USD THOUSAND)
TABLE 375 US Flock Adhesives Market, By product, 2020-2029 (Tons)
TABLE 376 US Flock Adhesives Market, BY source, 2020-2029 (USD Thousand)
TABLE 377 US Flock Adhesives Market, By substrate, 2020-2029 (USD Thousand)
TABLE 378 US Flock Adhesives Market, BY application, 2020-2029 (USD Thousand)
TABLE 379 US automotive in Flock Adhesives Market, BY product, 2020-2029 (USD Thousand)
TABLE 380 US technical textile & clothing in Flock Adhesives Market, By product, 2020-2029 (usd thousand)
TABLE 381 US paper & packaging in Flock Adhesives Market, By product, 2020-2029 (usd thousand)
TABLE 382 US printing in Flock Adhesives Market, By product, 2020-2029 (usd thousand)
TABLE 383 US others in Flock Adhesives Market, By product, 2020-2029 (usd thousand)
TABLE 384 Canada Flock Adhesives Market, By product, 2020-2029 (USD THOUSAND)
TABLE 385 Canada Flock Adhesives Market, By product, 2020-2029 (Tons)
TABLE 386 Canada Flock Adhesives Market, BY SOURCE, 2020-2029 (USD Thousand)
TABLE 387 Canada Flock Adhesives Market, By substrate, 2020-2029 (USD Thousand)
TABLE 388 Canada Flock Adhesives Market, BY application, 2020-2029 (USD Thousand)
TABLE 389 Canada automotive in Flock Adhesives Market, BY product, 2020-2029 (USD Thousand)
TABLE 390 Canada technical textile & clothing in Flock Adhesives Market, By product, 2020-2029 (usd thousand)
TABLE 391 Canada paper & packaging in Flock Adhesives Market, By product, 2020-2029 (usd thousand)
TABLE 392 Canada printing in Flock Adhesives Market, By product, 2020-2029 (usd thousand)
TABLE 393 Canada others in Flock Adhesives Market, By product, 2020-2029 (usd thousand)
TABLE 394 Mexico Flock Adhesives Market, By product, 2020-2029 (USD THOUSAND)
TABLE 395 Mexico Flock Adhesives Market, By product, 2020-2029 (Tons)
TABLE 396 Mexico Flock Adhesives Market, BY source, 2020-2029 (USD Thousand)
TABLE 397 Mexico Flock Adhesives Market, By substrate, 2020-2029 (USD Thousand)
TABLE 398 Mexico Flock Adhesives Market, BY application, 2020-2029 (USD Thousand)
TABLE 399 Mexico automotive in Flock Adhesives Market, BY product, 2020-2029 (USD Thousand)
TABLE 400 Mexico technical textile & clothing in Flock Adhesives Market, By product, 2020-2029 (usd thousand)
TABLE 401 Mexico paper & packaging in Flock Adhesives Market, By product, 2020-2029 (usd thousand)
TABLE 402 Mexico printing in Flock Adhesives Market, By product, 2020-2029 (usd thousand)
TABLE 403 Mexico others in Flock Adhesives Market, By product, 2020-2029 (usd thousand)
Lista de figuras
FIGURE 1 GLOBAL FLOCK ADHESIVES MARKET: segmentation
FIGURE 2 GLOBAL FLOCK ADHESIVES MARKET: data triangulation
FIGURE 3 GLOBAL FLOCK ADHESIVES MARKET: DROC ANALYSIS
FIGURE 4 GLOBAL FLOCK ADHESIVES MARKET: global VS regional MARKET analysis
FIGURE 5 GLOBAL FLOCK ADHESIVES MARKET: company research analysis
FIGURE 6 GLOBAL FLOCK ADHESIVES MARKET: THE product LIFE LINE CURVE
FIGURE 7 GLOBAL FLOCK ADHESIVES MARKET: MULTIVARIATE MODELLING
FIGURE 8 GLOBAL FLOCK ADHESIVES MARKET: INTERVIEW DEMOGRAPHICS
FIGURE 9 GLOBAL FLOCK ADHESIVES MARKET: DBMR MARKET POSITION GRID
FIGURE 10 GLOBAL FLOCK ADHESIVES MARKET: MARKET application COVERAGE GRID
FIGURE 11 GLOBAL FLOCK ADHESIVES MARKET: THE MARKET CHALLENGE MATRIX
FIGURE 12 GLOBAL FLOCK ADHESIVES MARKET: vendor share analysis
FIGURE 13 GLOBAL FLOCK ADHESIVES MARKET: SEGMENTATION
FIGURE 14 Asia-PAcific is expected to DOMINATE THE GLOBAL FLOCK ADHESIVES MARKET and IS EXPECTED TO GROW WITH THE HIGHEST CAGR IN the forecast period of 2022 to 2029
FIGURE 15 A Positive outlook towards flock adhesives in THE automotive and textile sectors is EXPECTED TO DRIVE the GLOBAL FLOCK ADHESIVES MARKET in the forecast period of 2022 to 2029
FIGURE 16 Acrylic SEGMENT is expected to account for the largest share of the GLOBAL FLOCK ADHESIVES MARKET in 2022 & 2029
FIGURE 17 Asia-Pacific is the fastest-growing market for FLOCK ADHESIVES MARKET in the forecast period of 2022 to 2029
FIGURE 18 DRIVERS, RESTRAINTs, OPPORTUNITies, AND CHALLENGEs OF global Flock Adhesives Market
FIGURE 19 Percentage of Lightweight Materials Present In Typical Vehicles (Approximate Value)
FIGURE 20 Global FLOCK ADHESIVES market, BY product, 2021
FIGURE 21 Global FLOCK ADHESIVES MARKET, BY source, 2021
FIGURE 22 Global FLOCK ADHESIVES market, BY substrate, 2021
FIGURE 23 Global FLOCK ADHESIVES market, BY application, 2021
FIGURE 24 GLOBAL flock adhesive market: SNAPSHOT (2021)
FIGURE 25 GLOBAL flock adhesive market: by REgion (2021)
FIGURE 26 GLOBAL flock adhesive market: by REgion (2022 & 2029)
FIGURE 27 GLOBAL flock adhesive market: by REgion (2021 & 2029)
FIGURE 28 GLOBAL flock adhesive market: by PRODUCT (2022-2029)
FIGURE 29 Asia-Pacific Flock Adhesives Market: SNAPSHOT (2021)
FIGURE 30 Asia-Pacific Flock Adhesives Market: by COUNTRY (2021)
FIGURE 31 Asia-Pacific Flock Adhesives Market: by COUNTRY (2022 & 2029)
FIGURE 32 Asia-Pacific Flock Adhesives Market: by COUNTRY (2021 & 2029)
FIGURE 33 Asia-Pacific Flock Adhesives Market: by PRODUCT (2022-2029)
FIGURE 34 Europe Flock Adhesives Market: SNAPSHOT (2021)
FIGURE 35 Europe Flock Adhesives Market: by COUNTRY (2021)
FIGURE 36 Europe Flock Adhesives Market: by COUNTRY (2022 & 2029)
FIGURE 37 Europe Flock Adhesives Market: by COUNTRY (2021 & 2029)
FIGURE 38 Europe Flock Adhesives Market: by PRODUCT (2022-2029)
FIGURE 39 SOUTH AMERICA FLOCK ADHESIVES MARKET: SNAPSHOT (2021)
FIGURE 40 SOUTH AMERICA FLOCK ADHESIVES MARKET: BY COUNTRY (2021)
FIGURE 41 SOUTH AMERICA FLOCK ADHESIVES MARKET: BY COUNTRY (2022 & 2029)
FIGURE 42 SOUTH AMERICA FLOCK ADHESIVES MARKET: BY COUNTRY (2021 & 2029)
FIGURE 43 SOUTH AMERICA FLOCK ADHESIVES MARKET: BY PRODUCT (2022-2029)
FIGURE 44 Middle East & Africa Flock Adhesives Market: SNAPSHOT (2021)
FIGURE 45 Middle East & Africa Flock Adhesives Market: by COUNTRY (2021)
FIGURE 46 Middle East & Africa Flock Adhesives Market: by COUNTRY (2022 & 2029)
FIGURE 47 Middle East & Africa Flock Adhesives Market: by COUNTRY (2021 & 2029)
FIGURE 48 Middle East & Africa Flock Adhesives Market: by PRODUCT (2022-2029)
FIGURE 49 North America Flock Adhesives Market: SNAPSHOT (2021)
FIGURE 50 North America Flock Adhesives Market: by COUNTRY (2021)
FIGURE 51 North America Flock Adhesives Market: by COUNTRY (2022 & 2029)
FIGURE 52 North America Flock Adhesives Market: by COUNTRY (2021 & 2029)
FIGURE 53 North America Flock Adhesives Market: by PRODUCT (2022-2029)
FIGURE 54 GLOBAL FLOCK ADHESIVES MARKET: company share 2021 (%)
FIGURE 55 north AMERICA FLOCK ADHESIVES MARKET: COMPANY SHARE 2021 (%)
FIGURE 56 EUROPE FLOCK ADHESIVES MARKET: company share 2021 (%)
FIGURE 57 Asia-Pacific FLOCK ADHESIVES MARKET: COMPANY SHARE 2021 (%)
Metodología de investigación
La recopilación de datos y el análisis del año base se realizan utilizando módulos de recopilación de datos con muestras de gran tamaño. La etapa incluye la obtención de información de mercado o datos relacionados a través de varias fuentes y estrategias. Incluye el examen y la planificación de todos los datos adquiridos del pasado con antelación. Asimismo, abarca el examen de las inconsistencias de información observadas en diferentes fuentes de información. Los datos de mercado se analizan y estiman utilizando modelos estadísticos y coherentes de mercado. Además, el análisis de la participación de mercado y el análisis de tendencias clave son los principales factores de éxito en el informe de mercado. Para obtener más información, solicite una llamada de un analista o envíe su consulta.
La metodología de investigación clave utilizada por el equipo de investigación de DBMR es la triangulación de datos, que implica la extracción de datos, el análisis del impacto de las variables de datos en el mercado y la validación primaria (experto en la industria). Los modelos de datos incluyen cuadrícula de posicionamiento de proveedores, análisis de línea de tiempo de mercado, descripción general y guía del mercado, cuadrícula de posicionamiento de la empresa, análisis de patentes, análisis de precios, análisis de participación de mercado de la empresa, estándares de medición, análisis global versus regional y de participación de proveedores. Para obtener más información sobre la metodología de investigación, envíe una consulta para hablar con nuestros expertos de la industria.
Personalización disponible
Data Bridge Market Research es líder en investigación formativa avanzada. Nos enorgullecemos de brindar servicios a nuestros clientes existentes y nuevos con datos y análisis que coinciden y se adaptan a sus objetivos. El informe se puede personalizar para incluir análisis de tendencias de precios de marcas objetivo, comprensión del mercado de países adicionales (solicite la lista de países), datos de resultados de ensayos clínicos, revisión de literatura, análisis de mercado renovado y base de productos. El análisis de mercado de competidores objetivo se puede analizar desde análisis basados en tecnología hasta estrategias de cartera de mercado. Podemos agregar tantos competidores sobre los que necesite datos en el formato y estilo de datos que esté buscando. Nuestro equipo de analistas también puede proporcionarle datos en archivos de Excel sin procesar, tablas dinámicas (libro de datos) o puede ayudarlo a crear presentaciones a partir de los conjuntos de datos disponibles en el informe.

