Global Contract Manufacturing Market
Tamaño del mercado en miles de millones de dólares
Tasa de crecimiento anual compuesta (CAGR) :
% 
 USD
23.17 Billion
USD
37.49 Billion
2024
2032
USD
23.17 Billion
USD
37.49 Billion
2024
2032
| 2025 –2032 | |
| USD 23.17 Billion | |
| USD 37.49 Billion | |
| % | |
|
Segmentación del mercado global de fabricación por contrato, por producto (fabricación de productos farmacéuticos y dispositivos médicos ), usuario final (empresas farmacéuticas, empresas de biotecnología , empresas biofarmacéuticas, empresas de dispositivos médicos, fabricantes de equipos originales e institutos de investigación), canal de distribución (venta minorista, licitación directa y otros): tendencias de la industria y pronóstico hasta 2032.
Tamaño del mercado de fabricación por contrato
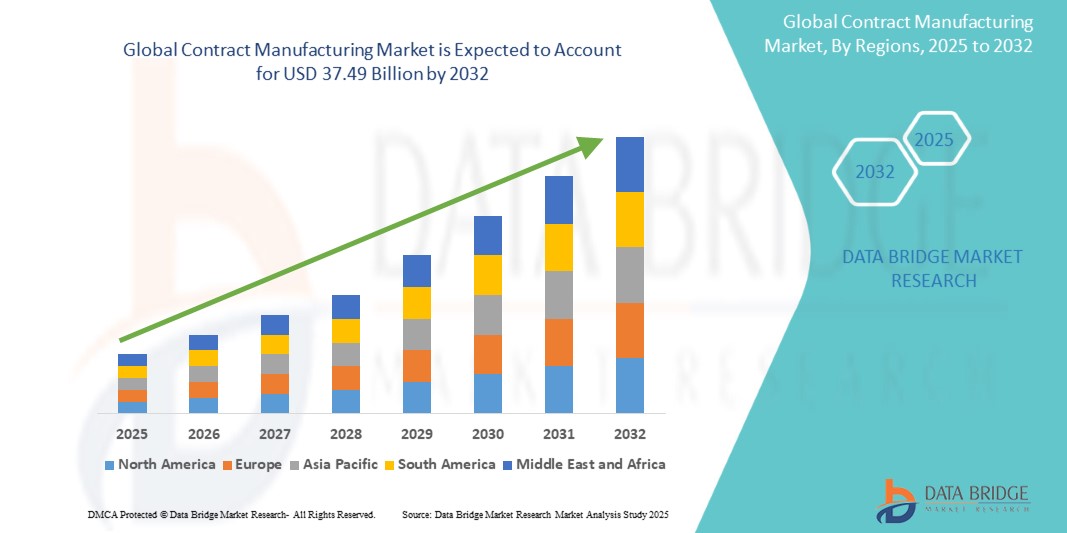
- El tamaño del mercado global de fabricación por contrato se valoró en USD 23,17 mil millones en 2024 y se espera que alcance los USD 37,49 mil millones para 2032 , con una CAGR del 6,20% durante el período de pronóstico.
- El crecimiento del mercado está impulsado en gran medida por la creciente adopción de la subcontratación y los avances tecnológicos en los procesos de fabricación, lo que conduce a una mayor eficiencia y optimización de costos en varias industrias.
- Además, la creciente demanda de las empresas de soluciones de producción flexibles, escalables y especializadas está impulsando la adopción de servicios de fabricación por contrato, lo que aumenta significativamente el crecimiento de la industria.
Análisis del mercado de fabricación por contrato
- La fabricación por contrato, que ofrece producción subcontratada y servicios especializados, es cada vez más vital para las empresas de los sectores farmacéutico, de dispositivos médicos y de otras industrias debido a la rentabilidad, el acceso a la experiencia y un tiempo de comercialización más rápido.
- La creciente demanda de fabricación por contrato se ve impulsada principalmente por las crecientes tendencias de subcontratación, la necesidad de capacidades de producción escalables y el creciente énfasis en la calidad y el cumplimiento normativo.
- Asia-Pacífico dominó el mercado de fabricación por contrato con una participación en los ingresos del 45,67 % en 2024, impulsada por la rápida industrialización, el crecimiento de los sectores de la salud y farmacéutico y el aumento de las inversiones en infraestructura de fabricación.
- Se espera que Norteamérica registre la tasa de crecimiento anual compuesta (TCAC) de mayor crecimiento en el mercado de fabricación por contrato, impulsada por la creciente demanda de tecnologías de fabricación avanzadas, soluciones de externalización y producción de alta calidad en los sectores farmacéutico, de dispositivos médicos e industrial. La sólida capacidad de I+D de la región, su experiencia tecnológica y su sólido marco regulatorio respaldan la rápida adopción de los servicios de fabricación por contrato.
- El segmento de fabricación de productos farmacéuticos dominó el mercado con una participación en los ingresos del 46,5 % en 2024, principalmente debido a la creciente tendencia a subcontratar la producción de medicamentos a fabricantes contratados especializados.
Alcance del informe y segmentación del mercado de fabricación por contrato
|
Atributos |
Perspectivas clave del mercado de la fabricación por contrato |
|
Segmentos cubiertos |
|
|
Países cubiertos |
América del norte
Europa
Asia-Pacífico
Oriente Medio y África
Sudamerica
|
|
Actores clave del mercado |
|
|
Oportunidades de mercado |
|
|
Conjuntos de información de datos de valor añadido |
Además de los conocimientos sobre escenarios de mercado como valor de mercado, tasa de crecimiento, segmentación, cobertura geográfica y actores principales, los informes de mercado seleccionados por Data Bridge Market Research también incluyen análisis de expertos en profundidad, análisis de precios, análisis de participación de marca, encuesta de consumidores, análisis demográfico, análisis de la cadena de suministro, análisis de la cadena de valor, descripción general de materias primas/consumibles, criterios de selección de proveedores, análisis PESTLE, análisis de Porter y marco regulatorio. |
Tendencias del mercado de fabricación por contrato
Mayor eficiencia y alianzas estratégicas en la fabricación por contrato
- Una tendencia significativa y en auge en el mercado global de fabricación por contrato es el creciente enfoque en la eficiencia operativa y las colaboraciones estratégicas con los líderes del sector. Las empresas están optimizando sus procesos de producción, las cadenas de suministro y ampliando sus capacidades para satisfacer las crecientes demandas de los clientes.
- Por ejemplo, los principales fabricantes por contrato están mejorando sus redes de producción multisitio, lo que permite plazos de entrega más rápidos y una mayor flexibilidad para gestionar volúmenes de pedidos variables. De igual manera, las empresas especializadas están invirtiendo en equipos de fabricación de precisión y sistemas de gestión de calidad para garantizar la consistencia de los estándares de sus productos.
- La integración de servicios de fabricación de extremo a extremo, desde la creación de prototipos y la producción hasta el embalaje y la logística, permite a los clientes consolidar su cadena de suministro, reducir los costos operativos y mejorar el tiempo de comercialización de nuevos productos.
- Las asociaciones estratégicas con proveedores de materias primas, proveedores de tecnología y canales de distribución están ayudando a los fabricantes contratados a ampliar sus ofertas de servicios, aumentar la escalabilidad y adaptarse a los requisitos dinámicos del mercado.
- Esta tendencia hacia operaciones de fabricación más eficientes, flexibles y centradas en el cliente está transformando las expectativas en la industria de la fabricación por contrato. En consecuencia, las empresas están desarrollando soluciones integrales para respaldar la producción personalizada, el cumplimiento normativo y la entrega rápida en diversos sectores.
- La demanda de servicios de fabricación por contrato confiables, de alta calidad y escalables está creciendo rápidamente en industrias como la farmacéutica, la electrónica, los bienes de consumo y la automotriz, a medida que las empresas buscan cada vez más centrarse en las competencias centrales y al mismo tiempo aprovechar la experiencia de fabricación externa.
Dinámica del mercado de fabricación por contrato
Conductor
La creciente demanda impulsada por la subcontratación y la eficiencia operativa
- El mercado global de fabricación por contrato está experimentando un sólido crecimiento a medida que las empresas subcontratan cada vez más la producción a fabricantes especializados para mejorar la eficiencia, reducir costos y centrarse en las funciones comerciales principales.
- Por ejemplo, en abril de 2024, Onity, Inc. (Honeywell International, Inc.) amplió sus capacidades de fabricación por contrato para incluir la producción de componentes de precisión para sistemas de almacenamiento avanzados. Se espera que estas iniciativas estratégicas de las principales empresas contribuyan significativamente al crecimiento del mercado durante el período de pronóstico.
- A medida que las empresas buscan acelerar el tiempo de comercialización y mantener una calidad constante del producto, los fabricantes contratados brindan servicios integrales que incluyen soporte de diseño, creación de prototipos, producción a gran escala, ensamblaje y empaquetado.
- Además, industrias como la farmacéutica, la electrónica, la automotriz y los bienes de consumo están aprovechando cada vez más la fabricación por contrato para satisfacer la demanda fluctuante, acceder a tecnologías especializadas y escalar las operaciones de manera eficiente.
- La capacidad de utilizar maquinaria avanzada, mano de obra calificada y redes de producción en múltiples sitios permite a los fabricantes entregar productos de alta calidad y al mismo tiempo optimizar los costos de producción, lo que hace que la fabricación por contrato sea una solución preferida para las empresas globales.
Restricción/Desafío
Desafíos relacionados con la alta inversión inicial y el cumplimiento de la calidad
- El mercado de la fabricación por contrato se enfrenta a importantes desafíos debido a las sustanciales inversiones iniciales necesarias para establecer instalaciones de producción avanzadas, adquirir maquinaria de última generación y mantener sólidos sistemas de control de calidad. Estos costos pueden ser especialmente onerosos para las pequeñas y medianas empresas manufactureras, lo que limita las oportunidades de entrada y expansión en el mercado.
- Las empresas que ofrecen servicios especializados de fabricación por contrato también deben cumplir con estrictas normas regulatorias y obtener las certificaciones necesarias, lo que añade complejidad operativa y costos continuos. Garantizar una calidad constante del producto en múltiples plantas de producción incrementa aún más la carga de gestión y supervisión de los fabricantes por contrato.
- Además, en mercados sensibles a los precios, algunas empresas perciben la externalización de la producción como más cara que la fabricación interna, lo que puede ralentizar la adopción y limitar el crecimiento. Equilibrar la rentabilidad con resultados de alta calidad sigue siendo un desafío crucial.
- La naturaleza dinámica de las demandas de los clientes, incluidas las variaciones en los volúmenes de pedidos, las especificaciones de los productos y los plazos de entrega, requiere que los fabricantes contratados mantengan la flexibilidad sin comprometer la calidad, lo que crea una mayor presión operativa.
- Superar estos desafíos mediante inversiones en infraestructura escalable, procesos de producción optimizados, adhesión a estándares de calidad globales y estrategias de precios competitivos será esencial para el crecimiento sostenido y el éxito a largo plazo en el mercado de fabricación por contrato.
Alcance del mercado de fabricación por contrato
El mercado global de fabricación por contrato está segmentado en función del producto, el usuario final y el canal de distribución.
• Por producto
En función del producto, el mercado se segmenta en fabricación de productos farmacéuticos y fabricación de dispositivos médicos. El segmento de fabricación de productos farmacéuticos dominó el mercado con una participación en los ingresos del 46,5 % en 2024, debido principalmente a la creciente tendencia a externalizar la producción de medicamentos a fabricantes por contrato especializados. Esto se debe a la necesidad de eficiencia operativa, optimización de costos y cumplimiento de estrictas normas regulatorias. Los fabricantes por contrato ofrecen capacidades avanzadas, como formulación a gran escala, control de calidad, documentación regulatoria y soluciones de envasado, lo que los convierte en un socio preferente para las compañías farmacéuticas que buscan acelerar el lanzamiento de productos y mantener altos estándares de calidad.
Se prevé que el segmento de fabricación de dispositivos médicos experimente el crecimiento más rápido, con una tasa de crecimiento anual compuesta (TCAC) del 22,3 % entre 2025 y 2032, impulsado por la creciente demanda de dispositivos médicos tecnológicamente avanzados, como monitores de salud portátiles, dispositivos implantables y herramientas quirúrgicas mínimamente invasivas. Las colaboraciones estratégicas con fabricantes contratados permiten a las empresas de dispositivos médicos escalar la producción rápidamente, integrar tecnologías innovadoras y cumplir con los requisitos globales de calidad de forma eficiente.
• Por el usuario final
Según el usuario final, el mercado se segmenta en compañías farmacéuticas, biotecnológicas, biofarmacéuticas, de dispositivos médicos, fabricantes de equipos originales (OEM) e institutos de investigación. El segmento de compañías farmacéuticas alcanzó la mayor cuota de mercado, con un 42,7 %, en 2024, impulsado por la alta demanda de producción subcontratada de medicamentos. Esta medida permite a las compañías centrarse en la investigación y el desarrollo, optimizar los costos de fabricación y garantizar la entrega puntual de los productos, cumpliendo con estrictas normas regulatorias. La fabricación por contrato permite a las compañías farmacéuticas escalar la producción de forma eficiente, aprovechar la experiencia especializada y satisfacer la creciente demanda mundial de atención médica.
Se espera que el segmento de empresas biofarmacéuticas registre la tasa de crecimiento anual compuesta (TCAC) más rápida, del 23,1 %, durante el período de pronóstico, impulsada por la creciente producción de productos biológicos, medicamentos personalizados y terapias avanzadas. La colaboración con fabricantes especializados por contrato permite a las empresas biofarmacéuticas integrar tecnologías de vanguardia, mantener altos estándares de calidad y responder con rapidez a las cambiantes necesidades de la atención médica.
• Por canal de distribución
Según el canal de distribución, el mercado se segmenta en ventas minoristas, licitación directa y otros. El segmento de licitación directa representó la mayor participación en los ingresos, con un 48,3 %, en 2024, debido principalmente a los acuerdos a largo plazo entre fabricantes contratados y las principales empresas farmacéuticas, biotecnológicas y de dispositivos médicos. Estos acuerdos garantizan la continuidad del suministro, optimizan la planificación de la producción y reducen los riesgos operativos, lo que convierte a la licitación directa en el método de distribución preferido para productos sanitarios críticos y de gran volumen.
Se prevé que el segmento de ventas minoristas experimente el crecimiento más rápido, con una tasa de crecimiento anual compuesta (TCAC) del 20,8 % entre 2025 y 2032, impulsado por la creciente disponibilidad de productos farmacéuticos sin receta, el crecimiento de las redes de farmacias en línea y físicas, y el mayor acceso de los consumidores a productos médicos y de salud. La creciente concienciación sobre la salud, el aumento de los ingresos disponibles y la tendencia hacia soluciones de autocuidado y atención médica domiciliaria contribuyen aún más a la rápida adopción de los canales de distribución minoristas.
Análisis regional del mercado de fabricación por contrato
- Asia-Pacífico dominó el mercado de fabricación por contrato con una participación en los ingresos del 45,67 % en 2024, impulsada por la rápida industrialización, la expansión de los sectores de la salud y farmacéutico, y las importantes inversiones en infraestructura de fabricación.
- La región se beneficia de una fuerza laboral numerosa y calificada, una adopción de tecnología avanzada y políticas gubernamentales favorables que incentivan la producción y la innovación locales. Países como China, Japón e India se están consolidando como importantes centros de fabricación por contrato, ofreciendo soluciones de producción rentables, productos de alta calidad y la capacidad de satisfacer eficientemente la demanda nacional e internacional.
- La creciente urbanización, el aumento de los ingresos disponibles y el enfoque en la fabricación inteligente y la digitalización aceleran aún más el crecimiento del mercado en Asia-Pacífico.
Perspectiva del mercado de fabricación por contrato en China
El mercado chino de fabricación por contrato captó la mayor participación en Asia-Pacífico en 2024, impulsado por el rápido crecimiento industrial, una clase media en expansión y la adopción generalizada de tecnologías avanzadas. La sólida capacidad de fabricación nacional, sumada al apoyo gubernamental y las continuas inversiones en los sectores sanitario, farmacéutico y de alta tecnología, impulsan la expansión del mercado. China también funciona como un importante centro de exportación, ofreciendo soluciones de fabricación por contrato competitivas, escalables y de alta calidad que cumplen con los estándares internacionales.
Perspectiva del mercado de fabricación por contrato en Japón
El mercado japonés de fabricación por contrato experimenta un crecimiento constante gracias a su experiencia en fabricación de alta tecnología, su sólido sector sanitario y su enfoque en la precisión y la calidad. La creciente automatización, la urbanización y la demanda de soluciones de producción eficientes son factores clave. La adopción de tecnologías de vanguardia, prácticas ecológicas y procesos orientados a la innovación consolidan la posición de Japón como centro líder en fabricación por contrato en la región, atendiendo tanto las necesidades nacionales como las cadenas de suministro globales.
Perspectiva del mercado de fabricación por contrato en América del Norte
El mercado de fabricación por contrato de América del Norte tuvo una participación en los ingresos del 38,47% en 2024, respaldado por una fuerte presencia de empresas farmacéuticas y de dispositivos médicos, tecnologías de fabricación avanzadas y una adopción generalizada de soluciones de subcontratación. Se espera que América del Norte registre la CAGR de más rápido crecimiento en el mercado de fabricación por contrato, impulsada por la creciente demanda de tecnologías de fabricación avanzadas, soluciones de subcontratación y producción de alta calidad en los sectores farmacéutico, de dispositivos médicos e industrial. Las sólidas capacidades de I+D de la región, la experiencia tecnológica y el marco regulatorio establecido respaldan la rápida adopción de los servicios de fabricación por contrato. La infraestructura bien establecida de la región, la fuerza laboral altamente calificada y el estricto cumplimiento normativo brindan un entorno favorable para la fabricación por contrato. Tanto el sector residencial como el comercial aprovechan la subcontratación para mejorar la eficiencia operativa, reducir costos y obtener acceso a experiencia especializada. La creciente demanda de productos de ingeniería de precisión, soluciones de fabricación escalables y estrategias de rápida comercialización impulsan aún más el crecimiento del mercado en América del Norte.
Perspectiva del mercado de fabricación por contrato de EE. UU.
El mercado estadounidense de fabricación por contrato captó la mayor participación en los ingresos de Norteamérica en 2024, impulsado por la fuerte demanda de productos farmacéuticos, dispositivos médicos y componentes industriales. La adopción de tecnologías avanzadas, automatización e ingeniería de precisión está muy extendida. La fabricación por contrato permite a las empresas escalar eficientemente la producción, optimizar costos y acelerar el lanzamiento de productos, convirtiendo a EE. UU. en un importante centro de soluciones de fabricación externalizada de alta calidad.
Perspectivas del mercado de fabricación por contrato de Canadá
El mercado canadiense de fabricación por contrato se encuentra en constante expansión, impulsado por el crecimiento de los sectores de la salud, la biotecnología y las ciencias de la vida. El énfasis en la innovación, los altos estándares de fabricación y los incentivos gubernamentales fomentan las colaboraciones para la subcontratación. Las empresas canadienses recurren cada vez más a la fabricación por contrato para satisfacer la demanda nacional e internacional, en particular de dispositivos médicos, componentes de alta tecnología y producción especializada, lo que refuerza la importancia estratégica del país en el ecosistema manufacturero de Norteamérica.
Perspectivas del mercado europeo de fabricación por contrato
El mercado europeo de fabricación por contrato está experimentando un crecimiento sustancial, impulsado por los estrictos requisitos regulatorios, la creciente demanda de servicios de fabricación de alta calidad en los sectores sanitario y farmacéutico, y el aumento de la automatización industrial. La sólida infraestructura de la región, su mano de obra cualificada y el énfasis en la ingeniería de precisión son factores clave. La adopción de la fabricación por contrato está en aumento en los sectores farmacéutico, de dispositivos médicos y de bienes de consumo, y tanto el desarrollo de nuevos productos como la producción a gran escala se benefician de las soluciones de externalización.
Perspectivas del mercado de fabricación por contrato en Alemania
El mercado alemán de fabricación por contrato se está expandiendo a un ritmo significativo gracias a su sólida industrialización, los avances tecnológicos y los altos estándares regulatorios. El enfoque de Alemania en la innovación, la sostenibilidad y el control de calidad atrae a empresas nacionales e internacionales a asociarse con fabricantes por contrato locales. La sólida infraestructura y la experiencia del país en productos farmacéuticos, dispositivos médicos y fabricación de alta tecnología respaldan una producción eficiente a gran escala, lo que lo convierte en un centro líder en Europa.
Perspectivas del mercado de fabricación por contrato del Reino Unido
Se proyecta que el mercado británico de fabricación por contrato crecerá a una tasa de crecimiento anual compuesta (TCAC) notable, impulsado por la creciente demanda de soluciones de externalización en los sectores farmacéutico, biotecnológico y de fabricación de dispositivos médicos. La región se beneficia de un sólido ecosistema de investigación y desarrollo, una mano de obra cualificada y un marco regulatorio consolidado. El aumento de las necesidades del sector sanitario, junto con la tendencia a la optimización de costes y la eficiencia operativa, anima a empresas nacionales e internacionales a aprovechar los servicios de fabricación por contrato del Reino Unido. Además, la infraestructura de comercio electrónico y logística del Reino Unido facilita la fluidez de la cadena de suministro, impulsando la expansión del mercado.
Cuota de mercado de fabricación por contrato
La industria de fabricación por contrato está liderada principalmente por empresas bien establecidas, entre las que se incluyen:
- Grupo Aenova (Alemania)
- Thermo Fisher Scientific Inc. (EE. UU.)
- Evonik Industries AG (Alemania)
- Lonza Group AG (Suiza)
- Boehringer Ingelheim Biopharmaceuticals GmbH (Alemania)
- Catalent, Inc. (EE. UU.)
- Recipharm AB (Suecia)
- Wuxi AppTec (China)
- Samsung Biologics (Corea del Sur)
- Pfizer CentreOne (EE. UU.)
- Grupo CMIC (Japón)
- Patheon (EE. UU.)
Últimos avances en el mercado global de fabricación por contrato
- En diciembre de 2024, la Sociedad de Fabricantes y Afiliados de Productos Químicos (SOCMA) publicó su Informe de Perspectivas de Fabricación por Contrato para 2025, que destaca cómo los fabricantes de productos químicos especializados se están adaptando y fortaleciendo sus operaciones mientras enfrentan las presiones económicas y los desafíos del mercado. El informe enfatiza la resiliencia estratégica de la industria ante las presiones económicas y del mercado, mostrando la capacidad del sector para innovar y mantener sus operaciones a pesar de los desafíos externos.
- En agosto de 2025, BCC Research informó que el mercado global de fabricación por contrato alcanzaría los 968.700 millones de dólares estadounidenses para 2030. El informe ofrece un análisis detallado del mercado, analizándolo por tipo de contrato, canal de distribución e industria de uso final. Explora los avances tecnológicos, los factores regulatorios y la dinámica competitiva, junto con las tendencias económicas que influyen en el mercado.
- En agosto de 2025, T1 Energy y Corning firmaron un acuerdo para crear una cadena de suministro solar totalmente nacional en Estados Unidos, que abarca la producción de polisilicio, obleas, células solares y paneles. Esta iniciativa se alinea con la "One Big Beautiful Bill Act" del presidente Donald Trump, que exige que los proyectos solares contengan la mínima cantidad de materiales procedentes de entidades extranjeras preocupantes, como China, para poder optar a créditos fiscales federales para energías limpias. Corning comenzará a suministrar obleas solares desde su fábrica de Michigan en el segundo semestre de 2026, lo que respaldará la producción de células de T1 en Austin, Texas, y el ensamblaje de paneles cerca de Dallas. El acuerdo impulsará la seguridad energética de EE. UU., reducirá la dependencia de las cadenas de suministro chinas y creará aproximadamente 6000 empleos en Michigan y Texas.
SKU-
Obtenga acceso en línea al informe sobre la primera nube de inteligencia de mercado del mundo
- Panel de análisis de datos interactivo
- Panel de análisis de empresas para oportunidades con alto potencial de crecimiento
- Acceso de analista de investigación para personalización y consultas
- Análisis de la competencia con panel interactivo
- Últimas noticias, actualizaciones y análisis de tendencias
- Aproveche el poder del análisis de referencia para un seguimiento integral de la competencia
Metodología de investigación
La recopilación de datos y el análisis del año base se realizan utilizando módulos de recopilación de datos con muestras de gran tamaño. La etapa incluye la obtención de información de mercado o datos relacionados a través de varias fuentes y estrategias. Incluye el examen y la planificación de todos los datos adquiridos del pasado con antelación. Asimismo, abarca el examen de las inconsistencias de información observadas en diferentes fuentes de información. Los datos de mercado se analizan y estiman utilizando modelos estadísticos y coherentes de mercado. Además, el análisis de la participación de mercado y el análisis de tendencias clave son los principales factores de éxito en el informe de mercado. Para obtener más información, solicite una llamada de un analista o envíe su consulta.
La metodología de investigación clave utilizada por el equipo de investigación de DBMR es la triangulación de datos, que implica la extracción de datos, el análisis del impacto de las variables de datos en el mercado y la validación primaria (experto en la industria). Los modelos de datos incluyen cuadrícula de posicionamiento de proveedores, análisis de línea de tiempo de mercado, descripción general y guía del mercado, cuadrícula de posicionamiento de la empresa, análisis de patentes, análisis de precios, análisis de participación de mercado de la empresa, estándares de medición, análisis global versus regional y de participación de proveedores. Para obtener más información sobre la metodología de investigación, envíe una consulta para hablar con nuestros expertos de la industria.
Personalización disponible
Data Bridge Market Research es líder en investigación formativa avanzada. Nos enorgullecemos de brindar servicios a nuestros clientes existentes y nuevos con datos y análisis que coinciden y se adaptan a sus objetivos. El informe se puede personalizar para incluir análisis de tendencias de precios de marcas objetivo, comprensión del mercado de países adicionales (solicite la lista de países), datos de resultados de ensayos clínicos, revisión de literatura, análisis de mercado renovado y base de productos. El análisis de mercado de competidores objetivo se puede analizar desde análisis basados en tecnología hasta estrategias de cartera de mercado. Podemos agregar tantos competidores sobre los que necesite datos en el formato y estilo de datos que esté buscando. Nuestro equipo de analistas también puede proporcionarle datos en archivos de Excel sin procesar, tablas dinámicas (libro de datos) o puede ayudarlo a crear presentaciones a partir de los conjuntos de datos disponibles en el informe.