
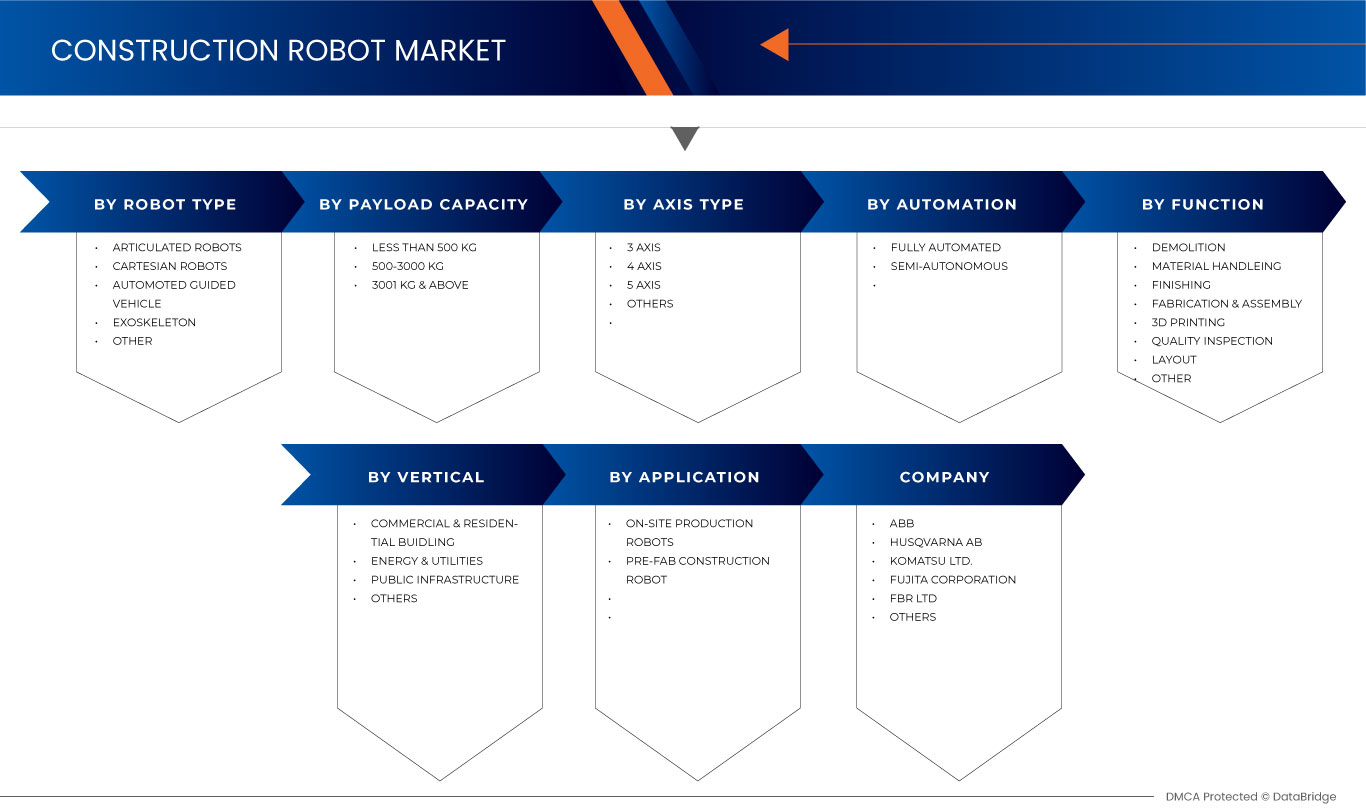
Mercado global de robots de construcción, por tipo de robots ( robots articulados , exoesqueleto, robot cartesiano, vehículo guiado automatizado y otros), capacidad de carga útil (menos de 500 kg, 500-3000 kg y 3001 kg y más), tipo de eje (3 ejes, 4 ejes, 5 ejes y otros), automatización (totalmente autónoma y semiautónoma), función (demolición, procesos de estructura, manipulación de materiales, acabado y ensamblaje, impresión 3D, inspección de calidad, diseño y otros), vertical (infraestructura comercial y residencial, infraestructura pública, energía y servicios públicos y otros), tipo de producto (robot de producción en el sitio y robot de construcción prefabricada) - Tendencias de la industria y pronóstico hasta 2030.
Análisis y tamaño del mercado de robots de construcción
Los principales factores que se espera que impulsen el crecimiento del mercado de robots de construcción en el período de pronóstico son el aumento de varias aplicaciones industriales, incluidas la aeroespacial, el acero, la energía, la química y otras. Además, la mayor resistencia a las variaciones de carga es el beneficio del robot de construcción, que se prevé que impulse aún más el crecimiento del mercado de robots de construcción.
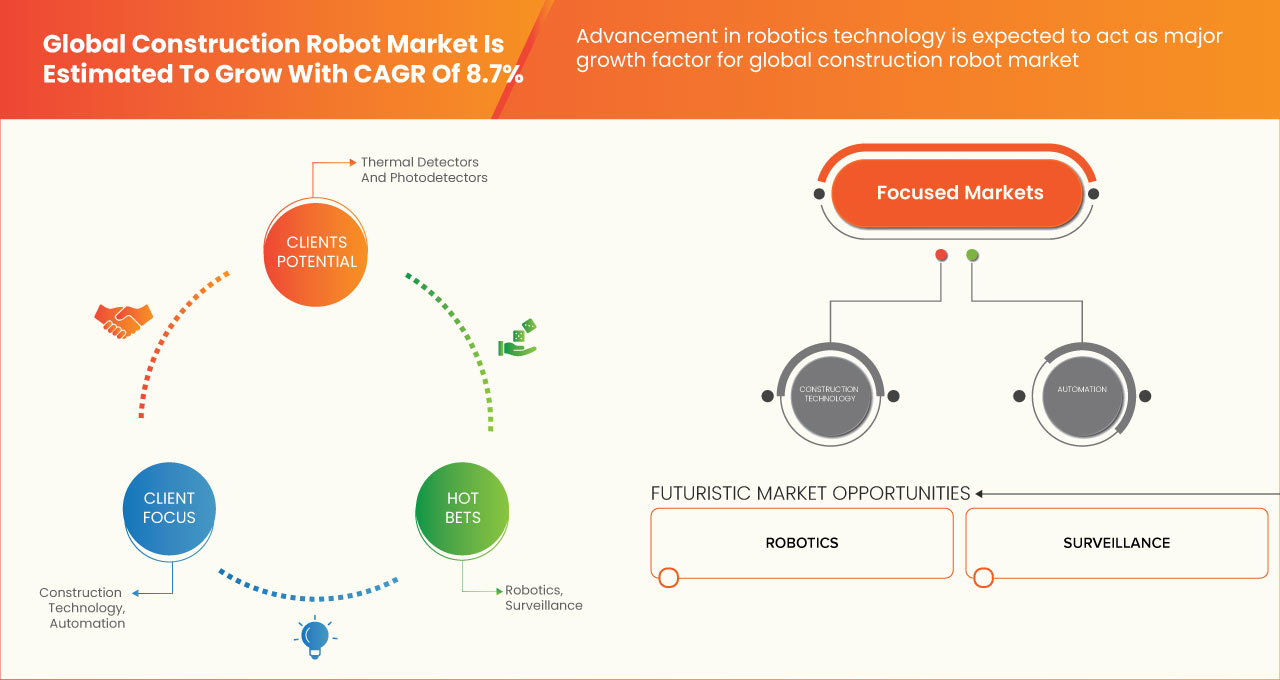
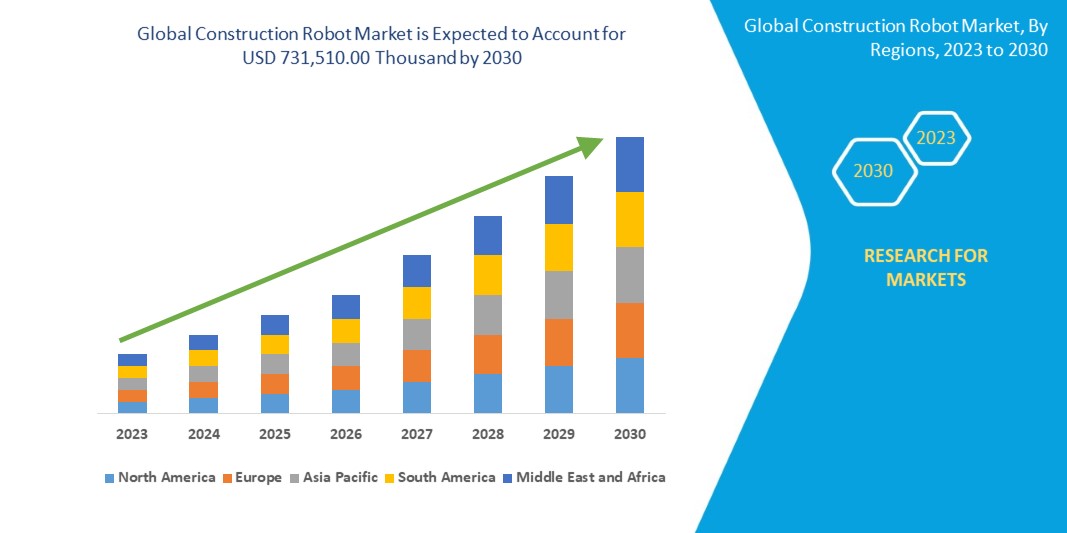
Data Bridge Market Research analiza que se espera que el mercado mundial de robots de construcción alcance un valor de USD 731 510,00 mil para 2030, con una CAGR del 8,7 % durante el período de pronóstico. El informe del mercado de robots de construcción también cubre en profundidad el análisis de precios, el análisis de patentes y los avances tecnológicos.
|
Métrica del informe |
Detalles |
|
Período de pronóstico |
2023 a 2030 |
|
Año base |
2022 |
|
Años históricos |
2021 (Personalizable para 2015-2020) |
|
Unidades cuantitativas |
Ingresos en miles de USD, precios en USD |
|
Segmentos cubiertos |
Por tipo de robot (robots articulados, exoesqueleto, robot cartesiano, vehículo guiado automático y otros), capacidad de carga útil (MENOS DE 500 KG, 500-3000 KG y 3001 KG Y MÁS), tipo de eje (3 ejes, 4 ejes y 5 ejes), automatización (totalmente autónoma y semiautónoma), función (demolición, procesos estructurales, manipulación de materiales, acabado y ensamblaje, impresión 3D, inspección de calidad, diseño y otros), VERTICAL (infraestructura COMERCIAL y RESIDENCIAL, infraestructura pública, energía y servicios públicos y otros), tipo de producto (robot de producción en el sitio y robot de construcción prefabricada) |
|
Países cubiertos |
EE. UU., Canadá y México en América del Norte, Alemania, Francia, Reino Unido, Italia, España, Rusia, Turquía, Bélgica, Países Bajos, Suiza y el resto de Europa en Europa, Japón, China, Corea del Sur, India, Australia, Singapur, Tailandia, Malasia, Indonesia, Filipinas y el resto de Asia Pacífico en Asia-Pacífico (APAC), Sudáfrica, Egipto, Arabia Saudita, Emiratos Árabes Unidos, Israel y el resto de Medio Oriente y África (MEA) como parte de Medio Oriente y África (MEA), Brasil, Argentina y el resto de América del Sur como parte de América del Sur. |
|
Actores del mercado cubiertos |
Entre ellos se encuentran: ABB, Husqvarna AB, Komatsu Ltd., Fujita Corporation, FBR Ltd, Conjet, Contour Crafting Corporation, MX3D, CyBe Construction, KEWAZO BROKK GLOBAL, RobotWorx, Built Robotics, ICON Technology, inc., Dusty Robotics, MUDBOTS 3D CONCRETE PRINTING, LLC, Advanced Construction Robotics, Inc., NASKA.AI, nLink AS, Okibo, entre otros. |
Definición de mercado
Los robots de construcción son máquinas automatizadas diseñadas para ayudar con diversas tareas en los sitios de construcción. Estos robots están equipados con sensores, cámaras y otras tecnologías avanzadas que les permiten realizar tareas como albañilería, vertido de hormigón, soldadura y demolición. El mercado mundial de robots de construcción se refiere al mercado de tecnología robótica utilizada en la industria de la construcción. Este mercado incluye una amplia gama de tipos de robots, incluidos robots industriales tradicionales, robots con exoesqueleto y robots móviles diseñados específicamente para aplicaciones de construcción. El mercado de robots de construcción ha estado creciendo rápidamente en los últimos años, ya que los avances en la tecnología robótica han hecho posible que los robots realicen una gama más amplia de tareas en los sitios de construcción. Estas tareas incluyen tareas como demolición, albañilería, soldadura, pintura y manipulación de materiales.
Dinámica del mercado de robots de construcción
En esta sección se aborda la comprensión de los factores impulsores del mercado, las ventajas, las oportunidades, las limitaciones y los desafíos. Todo esto se analiza en detalle a continuación:
Conductores
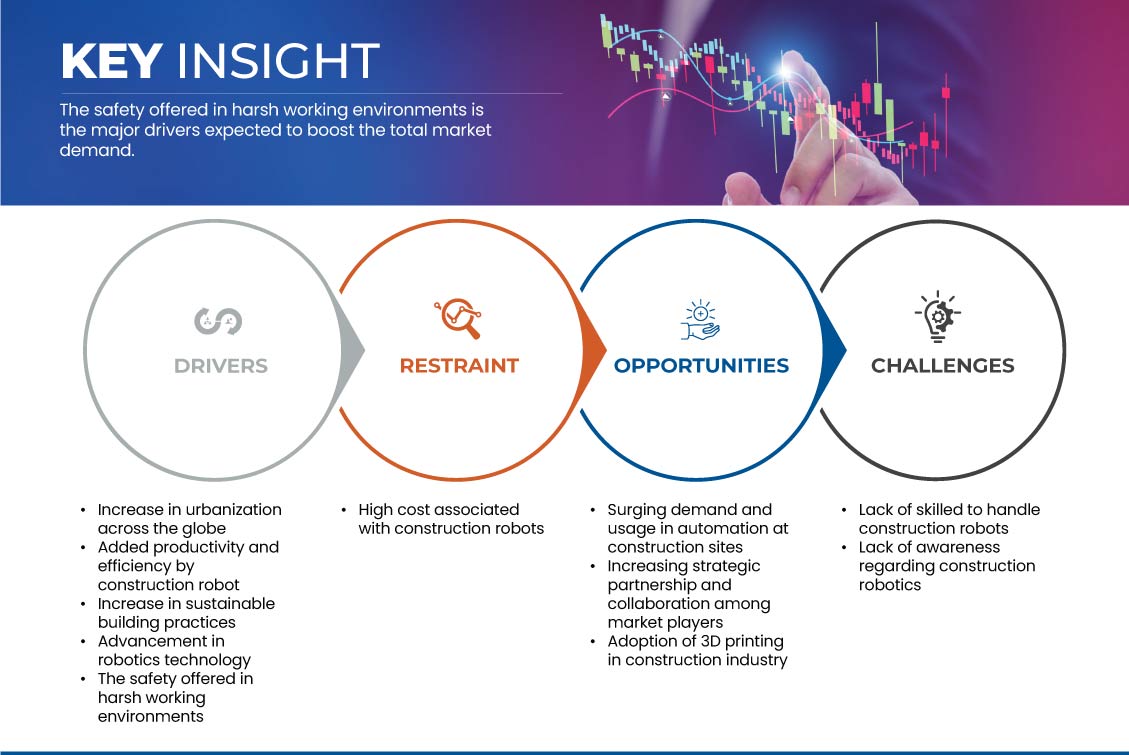
- Aumento de la urbanización en todo el mundo
Los robots de construcción son máquinas automatizadas diseñadas para ayudar con diversas tareas en los sitios de construcción. Estos robots están equipados con sensores, cámaras y otras tecnologías avanzadas que les permiten realizar tareas de albañilería, vertido de hormigón, soldadura y demolición. Los robots de construcción vienen en muchas formas diferentes, desde vehículos autónomos que transportan materiales por el sitio hasta drones aéreos que pueden supervisar el progreso de un proyecto desde arriba. También se pueden utilizar para realizar tareas peligrosas o difíciles para los humanos, como trabajar en alturas o en entornos peligrosos. Los robots de construcción son cada vez más populares en la industria de la construcción, ya que pueden ayudar a aumentar la productividad, mejorar la seguridad y reducir los costos laborales. La urbanización se refiere al crecimiento de las áreas urbanas a medida que las personas migran de las áreas rurales a las ciudades en busca de mejores oportunidades. Se espera que esta rápida urbanización impulse el mercado mundial de robots de construcción a medida que aumenta la demanda de métodos de construcción eficientes, rentables y seguros.
- Mayor productividad y eficiencia gracias al robot de construcción
Los robots de construcción tienen el potencial de reducir significativamente el tiempo y los costos involucrados en los proyectos de construcción. Los robots de construcción están diseñados para realizar tareas repetitivas y que consumen mucho tiempo de manera más rápida y precisa que los trabajadores humanos. Pueden trabajar las 24 horas del día sin cansarse ni necesitar descansos. Los robots de construcción son útiles en una variedad de tareas de construcción, que incluyen albañilería, soldadura, pintura y demolición.
Oportunidades
- Aumento de la demanda y el uso de la automatización en las obras de construcción
En los últimos años, ha habido una tendencia creciente hacia el uso de robots en las obras de construcción. Varios factores, incluidos los avances tecnológicos, los crecientes costos laborales y la escasez de mano de obra calificada en algunas áreas, pueden reconocer esto. Los robots se pueden utilizar para diversas tareas en las obras de construcción, como excavación, demolición, manipulación de materiales e impresión 3D. Pueden trabajar 24 horas al día, 7 días a la semana, sin interrupciones, y pueden programarse para realizar tareas de manera precisa y eficiente. Esto puede conducir a una mayor productividad, menores costos laborales y una mayor seguridad en el lugar de trabajo. Un ejemplo importante de un robot de construcción es el sistema de construcción robótica autónoma (ARCS), que fue desarrollado por investigadores del Instituto Tecnológico de Massachusetts (MIT). ARCS es un sistema autónomo que puede construir estructuras de forma autónoma sin necesidad de intervención humana.
Restricciones/Desafíos
- Altos costos asociados con los robots de construcción
Los robots de construcción suelen ser más caros que los equipos de construcción tradicionales y requieren capacitación y mantenimiento especializados. Esto puede generar mayores costos iniciales para las empresas de construcción que desean adoptar estas tecnologías. Además, algunas empresas de construcción pueden dudar en invertir en nuevas tecnologías debido a las preocupaciones sobre el retorno de la inversión y los riesgos asociados con la implementación de nuevos procesos y sistemas. Un factor que podría restringir el mercado mundial de robots de construcción es el alto costo asociado con los robots de construcción y la alta inversión inicial requerida para adoptar estas tecnologías. La inversión inicial para implementar robots de construcción puede ser significativa, y esto puede ser una barrera para algunas empresas, especialmente las más pequeñas. Además, los costos de mantenimiento y reparación de estos robots también pueden ser altos, lo que se suma al costo total de propiedad.
Impacto posterior al COVID-19 en el mercado mundial de robots de construcción
La COVID-19 generó un impacto negativo en el mercado de robots de construcción debido a las regulaciones y reglas de bloqueo en las instalaciones de fabricación.
La pandemia de COVID-19 ha afectado al mercado de robots de construcción de manera negativa. Sin embargo, la creciente adopción de robots de construcción en el sector de la aviación ha ayudado al mercado a crecer después de la pandemia. Además, el crecimiento ha sido alto después de la apertura del mercado después de COVID-19, y se espera que haya un crecimiento considerable en el sector.
Los fabricantes están tomando diversas decisiones estratégicas para recuperarse tras la COVID-19. Los actores están llevando a cabo múltiples actividades de investigación y desarrollo para mejorar la tecnología involucrada en el robot de construcción. Con esto, las empresas traerán tecnologías avanzadas al mercado. Además, las iniciativas gubernamentales para el uso de la tecnología de automatización han llevado al crecimiento del mercado.
Desarrollo reciente
- En marzo de 2023, FBR Ltd anunció el acuerdo estratégico con la empresa británica M & G Investment Management, en virtud del cual fabricarán tres robots Hadrian X de última generación para EE. UU. Utilizando la tecnología de estabilización dinámica primaria de la empresa, estos robots están hechos para trabajar en exteriores (DST). Este desarrollo ayuda a la empresa a ganar reconocimiento internacional.
- En septiembre de 2022, Conjet y Doornbos Equipment BV se asociaron con Doornbos Equipment BV, que actúa como socio de distribución para Bélgica, Luxemburgo y los Países Bajos (BENELUX). Doornbos asumirá la distribución de Overmat Industries. Estas asociaciones ayudan a la empresa a aumentar su presencia a nivel mundial.
Alcance del mercado de robots de construcción
El mercado de robots de construcción está segmentado en función del tipo de robot, la capacidad de carga, el tipo de eje, la automatización, la función, la vertical y el tipo de producto. El crecimiento entre estos segmentos le ayudará a analizar los segmentos de crecimiento reducidos en las industrias y brindará a los usuarios una valiosa descripción general del mercado y conocimientos del mercado para ayudarlos a tomar decisiones estratégicas para identificar las principales aplicaciones del mercado.
Tipo de robot
- Robots articulados
- Robots cartesianos
- Vehículo guiado automático
- Exoesqueleto
- Otros
Según el tipo de robot, el mercado de robots de construcción se segmenta en robots articulados, robots cartesianos, vehículos guiados automatizados, exoesqueletos y otros .
Capacidad de carga útil
- Menos de 500 kg
- 500-3000 kilogramos
- 3001 kg y más
Sobre la base de la capacidad de carga útil, el mercado de robots de construcción se segmenta en menos de 500 kg, 500-3000 kg y 3001 kg y más.
Tipo de eje
- 3 ejes
- 4 ejes
- 5 ejes
- Otros
Según el tipo de eje, el mercado de robots de construcción se segmenta en 3 ejes, 4 ejes, 5 ejes y otros.
Automatización
- Completamente automatizado
- Semiautónomo
Sobre la base de la automatización, el mercado de robots de construcción se segmenta en totalmente automatizados y semiautónomos.
Función
- Demolición
- Proceso estructural
- Manipulación de materiales
- Procesos de acabado
- Fabricación y montaje
- Impresión 3D
- Inspección de calidad
- Disposición
- Otro
Sobre la base de la función, el mercado de robots de construcción se segmenta en demolición, proceso estructural, manipulación de materiales, procesos de acabado, fabricación y ensamblaje, impresión 3D, inspección de calidad, diseño y otros.
Vertical
- Edificios comerciales y residenciales
- Energía y servicios públicos
- Infraestructura pública
- Otros
Sobre la base vertical, el mercado de robots de construcción está segmentado en edificios comerciales y residenciales, energía y servicios públicos, infraestructura pública y otros.
Análisis y perspectivas regionales del mercado de robots de construcción
Se analiza el mercado de robots de construcción y se proporcionan información y tendencias del tamaño del mercado por país, tipo de robot, capacidad de carga útil, tipo de eje, automatización, función, vertical y tipo de producto como se menciona anteriormente.
Los países cubiertos en el informe del mercado de robots de construcción son EE. UU., Canadá y México en América del Norte, Alemania, Francia, Reino Unido, Italia, España, Rusia, Turquía, Bélgica, Países Bajos, Suiza y el resto de Europa en Europa, Japón, China, Corea del Sur, India, Australia, Singapur, Tailandia, Malasia, Indonesia, Filipinas y el resto de Asia Pacífico en Asia-Pacífico (APAC), Sudáfrica, Egipto, Arabia Saudita, Emiratos Árabes Unidos, Israel y el resto de Medio Oriente y África (MEA) como parte de Medio Oriente y África (MEA), Brasil, Argentina y el resto de América del Sur como parte de América del Sur.
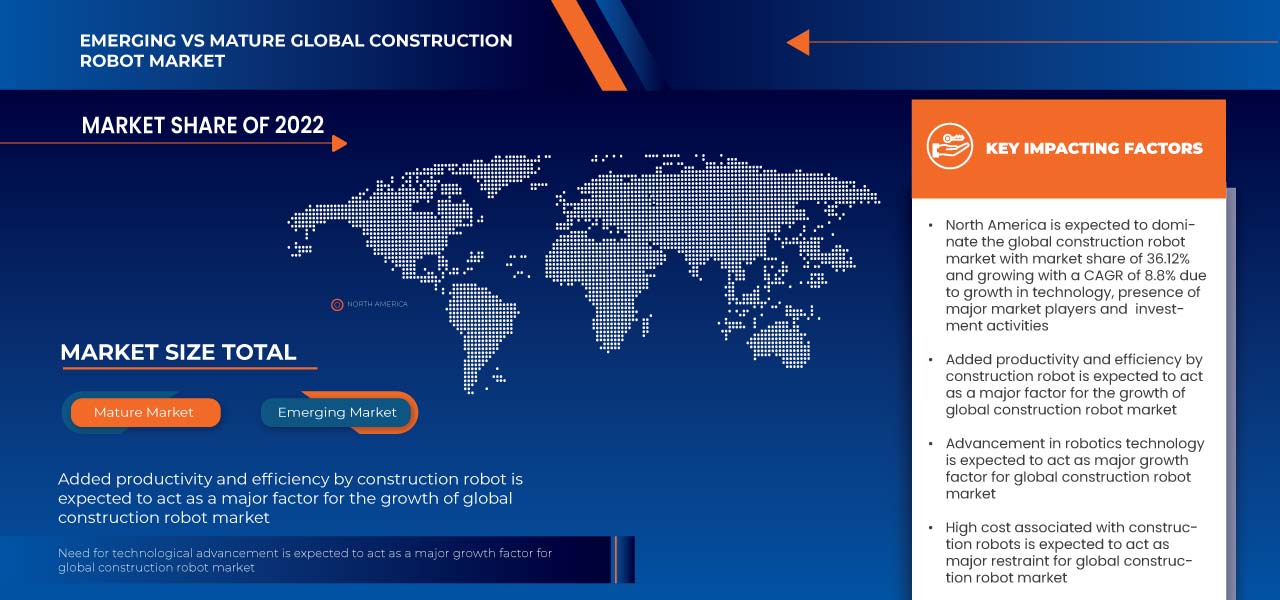
América del Norte domina el mercado de robots de construcción debido a la creciente adopción de la urbanización en toda América del Norte. Estados Unidos es un país dominante, ya que alberga a muchos actores gigantes del mercado de robots de construcción. Alemania domina en la región de Europa debido al aumento de las actividades de investigación y desarrollo, junto con los avances tecnológicos. China domina en la región de Asia y el Pacífico debido a la creciente adopción de la automatización en la fabricación y la robótica industrial.
La sección de países del informe también proporciona factores de impacto de mercado individuales y cambios en la regulación del mercado que afectan las tendencias actuales y futuras del mercado. Los puntos de datos como el análisis de la cadena de valor ascendente y descendente, las tendencias técnicas y el análisis de las cinco fuerzas de Porter, los estudios de casos son algunos de los indicadores utilizados para pronosticar el escenario del mercado para países individuales. Además, la presencia y disponibilidad de marcas globales y sus desafíos enfrentados debido a la competencia grande o escasa de las marcas locales y nacionales, el impacto de los aranceles nacionales y las rutas comerciales se consideran al proporcionar un análisis de pronóstico de los datos del país.

Análisis del panorama competitivo y de la cuota de mercado de los robots de construcción
El panorama competitivo del mercado de robots de construcción proporciona detalles por competidor. Los detalles incluidos son una descripción general de la empresa, las finanzas de la empresa, los ingresos generados, el potencial de mercado, la inversión en investigación y desarrollo, las nuevas iniciativas de mercado, la presencia global, los sitios e instalaciones de producción, las capacidades de producción, las fortalezas y debilidades de la empresa, el lanzamiento de productos, la amplitud y la variedad de productos, el dominio de las aplicaciones. Los puntos de datos anteriores proporcionados solo están relacionados con el enfoque de las empresas en relación con el mercado de ROBOTS DE CONSTRUCCIÓN.
Algunos de los principales actores que operan en el mercado son ABB, Husqvarna AB, Komatsu Ltd., Fujita Corporation, FBR Ltd, Conjet, Contour Crafting Corporation, MX3D, CyBe Construction, KEWAZO BROKK GLOBAL, RobotWorx, Built Robotics, ICON Technology, inc., Dusty Robotics, MUDBOTS 3D CONCRETE PRINTING, LLC, Advanced Construction Robotics, Inc., NASKA.AI, nLink AS, Okibo entre otros.
SKU-
Obtenga acceso en línea al informe sobre la primera nube de inteligencia de mercado del mundo

- Panel de análisis de datos interactivo
- Panel de análisis de empresas para oportunidades con alto potencial de crecimiento
- Acceso de analista de investigación para personalización y consultas
- Análisis de la competencia con panel interactivo
- Últimas noticias, actualizaciones y análisis de tendencias
- Aproveche el poder del análisis de referencia para un seguimiento integral de la competencia
Tabla de contenido
1 INTRODUCTION
1.1 OBJECTIVES OF THE STUDY
1.2 MARKET DEFINITION
1.3 OVERVIEW OF THE GLOBAL CONSTRUCTION ROBOT MARKET
1.4 CURRENCY AND PRICING
1.5 LIMITATIONS
1.6 MARKETS COVERED
2 MARKET SEGMENTATION
2.1 MARKETS COVERED
2.2 YEARS CONSIDERED FOR THE STUDY
2.3 GEOGRAPHIC SCOPE
2.4 DBMR TRIPOD DATA VALIDATION MODEL
2.5 PRIMARY INTERVIEWS WITH KEY OPINION LEADERS
2.6 DBMR MARKET POSITION GRID
2.7 VENDOR SHARE ANALYSIS
2.8 MULTIVARIATE MODELLING
2.9 ROBOTS TYPES CURVE
2.1 MARKET PLATFORM COVERAGE GRID
2.11 SECONDARY SOURCES
2.12 ASSUMPTIONS
3 EXECUTIVE SUMMARY
4 PREMIUM INSIGHT
5 MARKET OVERVIEW
5.1 DRIVERS
5.1.1 INCREASE IN URBANIZATION ACROSS THE GLOBE
5.1.2 ADDED PRODUCTIVITY AND EFFICIENCY BY CONSTRUCTION ROBOT
5.1.3 INCREASE IN SUSTAINABLE BUILDING PRACTICES
5.1.4 ADVANCEMENT IN ROBOTICS TECHNOLOGY
5.1.5 SAFETY OFFERED IN HARSH WORKING ENVIRONMENTS
5.2 RESTRAINT
5.2.1 HIGH COST ASSOCIATED WITH CONSTRUCTION ROBOTS
5.3 OPPORTUNITIES
5.3.1 SURGING DEMAND AND USAGE IN AUTOMATION AT CONSTRUCTION SITES
5.3.2 INCREASING STRATEGIC PARTNERSHIPS AND COLLABORATION AMONG MARKET PLAYERS
5.3.3 ADOPTION OF 3D PRINTING IN THE CONSTRUCTION INDUSTRY
5.4 CHALLENGES
5.4.1 LACK OF SKILLED LABOR TO HANDLE CONSTRUCTION ROBOTS
5.4.2 LACK OF AWARENESS REGARDING CONSTRUCTION ROBOTICS
6 GLOBAL CONSTRUCTION ROBOT MARKET, BY ROBOTS TYPE
6.1 OVERVIEW
6.2 ARTICULATED ROBOTS
6.3 EXOSKELETON
6.4 CARTESIAN ROBOTS
6.5 AUTOMATED GUIDED VEHICLE
6.6 OTHERS
7 GLOBAL CONSTRUCTION ROBOT MARKET, BY PAYLOAD CAPACITY
7.1 OVERVIEW
7.2 LESS THAN 500 KG
7.3 500-3000 KG
7.4 3001 KG & ABOVE
8 GLOBAL CONSTRUCTION ROBOT MARKET, BY AXIS TYPE
8.1 OVERVIEW
8.2 4 AXIS
8.3 5 AXIS
8.4 3 AXIS
8.5 OTHERS
9 GLOBAL CONSTRUCTION ROBOT MARKET, BY AUTOMATION
9.1 OVERVIEW
9.2 SEMI-AUTONOMOUS
9.3 FULLY AUTOMATED
10 GLOBAL CONSTRUCTION ROBOT MARKET, BY FUNCTION
10.1 OVERVIEW
10.2 DEMOLITION
10.3 STRUCTURAL PROCESSES
10.3.1 BRICKLAYING
10.3.2 WELDING
10.3.3 FASTENING
10.3.4 CONCRETE STRUCTURAL ERECTION
10.3.5 OTHERS
10.4 MATERIAL HANDLING
10.5 FINISHING PROCESSES
10.5.1 DRILLING
10.5.2 PAINTING
10.5.3 CLEANING
10.5.4 OTHERS
10.6 FABRICATION & ASSEMBLING
10.7 3D PRINTING
10.8 QUALITY INSPECTION
10.9 LAYOUT
10.1 OTHERS
11 GLOBAL CONSTRUCTION ROBOT MARKET, BY VERTICAL
11.1 OVERVIEW
11.2 COMMERCIAL & RESIDENTIAL INFRASTRUCTURE
11.2.1 ARTICULATED ROBOTS
11.2.2 EXOSKELETON
11.2.3 CARTESIAN
11.2.4 AUTOMATED GUIDED VEHICLE
11.2.5 OTHERS
11.3 PUBLIC INFRASTRUCTURE
11.3.1 ARTICULATED ROBOTS
11.3.2 EXOSKELETON
11.3.3 CARTESIAN
11.3.4 AUTOMATED GUIDED VEHICLE
11.3.5 OTHERS
11.4 ENERGY & UTILITY
11.4.1 ARTICULATED ROBOTS
11.4.2 EXOSKELETON
11.4.3 CARTESIAN
11.4.4 AUTOMATED GUIDED VEHICLE
11.4.5 OTHERS
11.5 OTHERS
12 GLOBAL CONSTRUCTION ROBOT MARKET, BY PRODUCT TYPE
12.1 OVERVIEW
12.2 ON-SITE PRODUCTION ROBOTS
12.3 PRE-FAB CONSTRUCTION ROBOTS
13 GLOBAL CONSTRUCTION ROBOT MARKET, BY REGION
13.1 OVERVIEW
13.2 NORTH AMERICA
13.2.1 U.S.
13.2.2 CANADA
13.2.3 MEXICO
13.3 ASIA-PACIFIC
13.3.1 CHINA
13.3.2 JAPAN
13.3.3 INDIA
13.3.4 SOUTH KOREA
13.3.5 AUSTRALIA
13.3.6 SINGAPORE
13.3.7 MALAYSIA
13.3.8 THAILAND
13.3.9 INDONESIA
13.3.10 PHILIPPINES
13.3.11 REST OF ASIA-PACIFIC
13.4 EUROPE
13.4.1 GERMANY
13.4.2 U.K.
13.4.3 FRANCE
13.4.4 ITALY
13.4.5 SPAIN
13.4.6 TURKEY
13.4.7 RUSSIA
13.4.8 NETHERLAND
13.4.9 BELGIUM
13.4.10 SWITZERLAND
13.4.11 REST OF EUROPE
13.5 MIDDLE EAST AND AFRICA
13.5.1 U.A.E.
13.5.2 SAUDI ARABIA
13.5.3 SOUTH AFRICA
13.5.4 EGYPT
13.5.5 ISRAEL
13.5.6 REST OF MIDDLE EAST AND AFRICA
13.6 SOUTH AMERICA
13.6.1 BRAZIL
13.6.2 ARGENTINA
13.6.3 REST OF SOUTH AMERICA
14 GLOBAL CONSTRUCTION ROBOT MARKET: COMPANY LANDSCAPE
14.1 COMPANY SHARE ANALYSIS: GLOBAL
14.2 COMPANY SHARE ANALYSIS: NORTH AMERICA
14.3 COMPANY SHARE ANALYSIS: ASIA-PACIFIC
14.4 COMPANY SHARE ANALYSIS: EUROPE
15 SWOT ANALYSIS
16 COMPANY PROFILE
16.1 HUSQVARNA AB
16.1.1 COMPANY SNAPSHOT
16.1.2 REVENUE ANALYSIS
16.1.3 COMPANY SHARE ANALYSIS
16.1.4 PRODUCT PORTFOLIO
16.1.5 RECENT DEVELOPMENTS
16.2 KOMATSU LTD.
16.2.1 COMPANY SNAPSHOT
16.2.2 REVENUE ANALYSIS
16.2.3 COMPANY SHARE ANALYSIS
16.2.4 SOLUTION PORTFOLIO
16.2.5 RECENT DEVELOPMENTS
16.3 ABB
16.3.1 COMPANY SNAPSHOT
16.3.2 REVENUE ANALYSIS
16.3.3 COMPANY SHARE ANALYSIS
16.3.4 PRODUCT PORTFOLIO
16.3.5 RECENT DEVELOPMENTS
16.4 BROKK GLOBAL
16.4.1 COMPANY SNAPSHOT
16.4.2 COMPANY SHARE ANALYSIS
16.4.3 PRODUCT PORTFOLIO
16.4.4 RECENT DEVELOPMENTS
16.5 ICON TECHNOLOGY, INC
16.5.1 COMPANY SNAPSHOT
16.5.2 COMPANY SHARE ANALYSIS
16.5.3 SOLUTION PORTFOLIO
16.5.4 RECENT DEVELOPMENTS
16.6 ADVANCED CONSTRUCTION ROBOTICS, INC.
16.6.1 COMPANY SNAPSHOT
16.6.2 PRODUCT PORTFOLIO
16.6.3 RECENT DEVELOPMENTS
16.7 BUILT ROBOTICS
16.7.1 COMPANY SNAPSHOT
16.7.2 SOLUTION PORTFOLIO
16.7.3 RECENT DEVELOPMENTS
16.8 CONJET
16.8.1 COMPANY SNAPSHOT
16.8.2 PRODUCT PORTFOLIO
16.8.3 RECENT DEVELOPMENTS
16.9 CONTOUR CRAFTING CORPORATION
16.9.1 COMPANY SNAPSHOT
16.9.2 PRODUCT PORTFOLIO
16.9.3 RECENT DEVELOPMENT
16.1 CYBE CONSTRUCTION
16.10.1 COMPANY SNAPSHOT
16.10.2 PRODUCT PORTFOLIO
16.10.3 RECENT DEVELOPMENTS
16.11 DUSTY ROBOTICS
16.11.1 COMPANY SNAPSHOT
16.11.2 PRODUCT PORTFOLIO
16.11.3 RECENT DEVELOPMENTS
16.12 FBR LTD
16.12.1 COMPANY SNAPSHOT
16.12.2 REVENUE ANALYSIS
16.12.3 PRODUCT PORTFOLIO
16.12.4 RECENT DEVELOPMENTS
16.13 FUJITA CORPORATION
16.13.1 COMPANY SNAPSHOT
16.13.2 REVENUE ANALYSIS
16.13.3 PRODUCT PORTFOLIO
16.13.4 RECENT DEVELOPMENTS
16.14 KEWAZO
16.14.1 COMPANY SNAPSHOT
16.14.2 PRODUCT PORTFOLIO
16.14.3 RECENT DEVELOPMENTS
16.15 MUDBOTS 3D CONCRETE PRINTING, LLC
16.15.1 COMPANY SNAPSHOT
16.15.2 PRODUCT PORTFOLIO
16.15.3 RECENT DEVELOPMENT
16.16 MX3D
16.16.1 COMPANY SNAPSHOT
16.16.2 PRODUCT PORTFOLIO
16.16.3 RECENT DEVELOPMENTS
16.17 NASKA.AI
16.17.1 COMPANY SNAPSHOT
16.17.2 SOLUTION PORTFOLIO
16.17.3 RECENT DEVELOPMENTS
16.18 NLINK AS
16.18.1 COMPANY SNAPSHOT
16.18.2 PRODUCT PORTFOLIO
16.18.3 RECENT DEVELOPMENTS
16.19 OKIBO
16.19.1 COMPANY SNAPSHOT
16.19.2 PRODUCT PORTFOLIO
16.19.3 RECENT DEVELOPMENTS
16.2 ROBOTWORX
16.20.1 COMPANY SNAPSHOT
16.20.2 PRODUCT PORTFOLIO
16.20.3 RECENT DEVELOPMENT
17 QUESTIONNAIRE
18 RELATED REPORTS
Lista de Tablas
TABLE 1 GLOBAL CONSTRUCTION ROBOT MARKET, BY ROBOTS TYPE, 2021-2030 (USD THOUSAND)
TABLE 2 GLOBAL ARTICULATED ROBOTS IN CONSTRUCTION ROBOT MARKET, BY REGION, 2021-2030 (USD THOUSAND)
TABLE 3 GLOBAL EXOSKELETON IN CONSTRUCTION ROBOT MARKET, BY REGION, 2021-2030 (USD THOUSAND)
TABLE 4 GLOBAL CARTESIAN ROBOTS IN CONSTRUCTION ROBOT MARKET, BY REGION, 2021-2030 (USD THOUSAND)
TABLE 5 GLOBAL AUTOMATED GUIDED VEHICLE IN CONSTRUCTION ROBOT MARKET, BY REGION, 2021-2030 (USD THOUSAND)
TABLE 6 GLOBAL OTHERS IN CONSTRUCTION ROBOT MARKET, BY REGION, 2021-2030 (USD THOUSAND)
TABLE 7 GLOBAL CONSTRUCTION ROBOT MARKET, BY PAYLOAD CAPACITY, 2021-2030 (USD THOUSAND)
TABLE 8 GLOBAL LESS THAN 500 KG IN CONSTRUCTION ROBOT MARKET, BY REGION, 2021-2030 (USD THOUSAND)
TABLE 9 GLOBAL 500-3000 KG IN CONSTRUCTION ROBOT MARKET, BY REGION, 2021-2030 (USD THOUSAND)
TABLE 10 GLOBAL 3001 KG & ABOVE IN CONSTRUCTION ROBOT MARKET, BY REGION, 2021-2030 (USD THOUSAND)
TABLE 11 GLOBAL CONSTRUCTION ROBOT MARKET, BY AXIS TYPE, 2021-2030 (USD THOUSAND)
TABLE 12 GLOBAL 4 AXIS IN CONSTRUCTION ROBOT MARKET, BY REGION, 2021-2030 (USD THOUSAND)
TABLE 13 GLOBAL 5 AXIS IN CONSTRUCTION ROBOT MARKET, BY REGION, 2021-2030 (USD THOUSAND)
TABLE 14 GLOBAL 3 AXIS IN CONSTRUCTION ROBOT MARKET, BY REGION, 2021-2030 (USD THOUSAND)
TABLE 15 GLOBAL OTHERS IN CONSTRUCTION ROBOT MARKET, BY REGION, 2021-2030 (USD THOUSAND)
TABLE 16 GLOBAL CONSTRUCTION ROBOT MARKET, BY AUTOMATION, 2021-2030 (USD THOUSAND)
TABLE 17 GLOBAL SEMI-AUTONOMOUS IN CONSTRUCTION ROBOT MARKET, BY REGION, 2021-2030 (USD THOUSAND)
TABLE 18 GLOBAL FULLY AUTOMATED IN CONSTRUCTION ROBOT MARKET, BY REGION, 2021-2030 (USD THOUSAND)
TABLE 19 GLOBAL CONSTRUCTION ROBOT MARKET, BY FUNCTION, 2021-2030 (USD THOUSAND)
TABLE 20 GLOBAL DEMOLITION IN CONSTRUCTION ROBOT MARKET, BY REGION, 2021-2030 (USD THOUSAND)
TABLE 21 GLOBAL STRUCTURAL PROCESSES IN CONSTRUCTION ROBOT MARKET, BY REGION, 2021-2030 (USD THOUSAND)
TABLE 22 GLOBAL STRUCTURAL PROCESSES IN CONSTRUCTION ROBOT MARKET, BY TYPE, 2021-2030 (USD THOUSAND)
TABLE 23 GLOBAL MATERIAL HANDLING IN CONSTRUCTION ROBOT MARKET, BY REGION, 2021-2030 (USD THOUSAND)
TABLE 24 GLOBAL FINISHING PROCESSES IN CONSTRUCTION ROBOT MARKET, BY REGION, 2021-2030 (USD THOUSAND)
TABLE 25 GLOBAL FINISHING PROCESSES IN CONSTRUCTION ROBOT MARKET, BY APPLICATION, 2021-2030 (USD THOUSAND)
TABLE 26 GLOBAL FABRICATION & ASSEMBLING IN CONSTRUCTION ROBOT MARKET, BY REGION, 2021-2030 (USD THOUSAND)
TABLE 27 GLOBAL 3D PRINTING IN CONSTRUCTION ROBOT MARKET, BY REGION, 2021-2030 (USD THOUSAND)
TABLE 28 GLOBAL QUALITY INSPECTION IN CONSTRUCTION ROBOT MARKET, BY REGION, 2021-2030 (USD THOUSAND)
TABLE 29 GLOBAL LAYOUT IN CONSTRUCTION ROBOT MARKET, BY REGION, 2021-2030 (USD THOUSAND)
TABLE 30 GLOBAL OTHERS IN CONSTRUCTION ROBOT MARKET, BY REGION, 2021-2030 (USD THOUSAND)
TABLE 31 GLOBAL CONSTRUCTION ROBOT MARKET, BY VERTICAL, 2021-2030 (USD THOUSAND)
TABLE 32 GLOBAL COMMERCIAL & RESIDENTIAL INFRASTRUCTURE IN CONSTRUCTION ROBOT MARKET, BY REGION, 2021-2030 (USD THOUSAND)
TABLE 33 GLOBAL COMMERCIAL & RESIDENTIAL INFRASTRUCTURE IN CONSTRUCTION ROBOT MARKET, BY ROBOTS TYPES, 2021-2030 (USD THOUSAND)
TABLE 34 GLOBAL PUBLIC INFRASTRUCTURE IN CONSTRUCTION ROBOT MARKET, BY REGION, 2021-2030 (USD THOUSAND)
TABLE 35 GLOBAL PUBLIC INFRASTRUCTURE IN CONSTRUCTION ROBOT MARKET, BY ROBOTS TYPE, 2021-2030 (USD THOUSAND)
TABLE 36 GLOBAL ENERGY & UTILITY IN CONSTRUCTION ROBOT MARKET, BY REGION, 2021-2030 (USD THOUSAND)
TABLE 37 GLOBAL ENERGY & UTILITY IN CONSTRUCTION ROBOT MARKET, BY ROBOTS TYPES, 2021-2030 (USD THOUSAND)
TABLE 38 GLOBAL OTHERS IN CONSTRUCTION ROBOT MARKET, BY REGION, 2021-2030 (USD THOUSAND)
TABLE 39 GLOBAL CONSTRUCTION ROBOT MARKET, BY PRODUCT TYPE, 2021-2030 (USD THOUSAND)
TABLE 40 GLOBAL CONSTRUCTION ROBOT MARKET, BY PRODUCT TYPE, 2021-2030 (UNITS)
TABLE 41 GLOBAL ON-SITE PRODUCTION ROBOTS IN CONSTRUCTION ROBOT MARKET, BY REGION, 2021-2030 (USD THOUSAND)
TABLE 42 GLOBAL PRE-FAB CONSTRUCTION ROBOTS IN CONSTRUCTION ROBOT MARKET, BY REGION, 2021-2030 (USD THOUSAND)
TABLE 43 GLOBAL CONSTRUCTION ROBOT MARKET, BY REGION, 2021-2030 (USD THOUSAND)
TABLE 44 NORTH AMERICA CONSTRUCTION ROBOT MARKET, BY COUNTRY, 2021-2030 (USD THOUSAND)
TABLE 45 NORTH AMERICA CONSTRUCTION ROBOT MARKET, BY ROBOTS TYPE, 2021-2030 (USD THOUSAND)
TABLE 46 NORTH AMERICA CONSTRUCTION ROBOT MARKET, BY PAYLOAD CAPACITY, 2021-2030 (USD THOUSAND)
TABLE 47 NORTH AMERICA CONSTRUCTION ROBOT MARKET, BY AXIS TYPE, 2021-2030 (USD THOUSAND)
TABLE 48 NORTH AMERICA CONSTRUCTION ROBOT MARKET, BY AUTOMATION, 2021-2030 (USD THOUSAND)
TABLE 49 NORTH AMERICA CONSTRUCTION ROBOT MARKET, BY FUNCTION, 2021-2030 (USD THOUSAND)
TABLE 50 NORTH AMERICA STRUCTURAL PROCESSES IN CONSTRUCTION ROBOT MARKET, BY TYPE, 2021-2030 (USD THOUSAND)
TABLE 51 NORTH AMERICA FINISHING PROCESSES IN CONSTRUCTION ROBOT MARKET, BY APPLICATION, 2021-2030 (USD THOUSAND)
TABLE 52 NORTH AMERICA CONSTRUCTION ROBOT MARKET, BY VERTICAL, 2021-2030 (USD THOUSAND)
TABLE 53 NORTH AMERICA COMMERCIAL & RESIDENTIAL INFRASTRUCTURE IN CONSTRUCTION ROBOT MARKET, BY ROBOTS TYPE, 2021-2030 (USD THOUSAND)
TABLE 54 NORTH AMERICA PUBLIC INFRASTRUCTURE IN CONSTRUCTION ROBOT MARKET, BY ROBOTS TYPE, 2021-2030 (USD THOUSAND)
TABLE 55 NORTH AMERICA ENERGY & UTILITY IN CONSTRUCTION ROBOT MARKET, BY ROBOTS TYPE, 2021-2030 (USD THOUSAND)
TABLE 56 NORTH AMERICA CONSTRUCTION ROBOT MARKET, BY PRODUCT TYPE, 2021-2030 (USD THOUSAND)
TABLE 57 NORTH AMERICA CONSTRUCTION ROBOT MARKET, BY PRODUCT TYPE, 2021-2030 (UNITS)
TABLE 58 U.S. CONSTRUCTION ROBOT MARKET, BY ROBOTS TYPE, 2021-2030 (USD THOUSAND)
TABLE 59 U.S. CONSTRUCTION ROBOT MARKET, BY PAYLOAD CAPACITY, 2021-2030 (USD THOUSAND)
TABLE 60 U.S. CONSTRUCTION ROBOT MARKET, BY AXIS TYPE, 2021-2030 (USD THOUSAND)
TABLE 61 U.S. CONSTRUCTION ROBOT MARKET, BY AUTOMATION, 2021-2030 (USD THOUSAND)
TABLE 62 U.S. CONSTRUCTION ROBOT MARKET, BY FUNCTION, 2021-2030 (USD THOUSAND)
TABLE 63 U.S. STRUCTURAL PROCESSES IN CONSTRUCTION ROBOT MARKET, BY TYPE, 2021-2030 (USD THOUSAND)
TABLE 64 U.S. FINISHING PROCESSES IN CONSTRUCTION ROBOT MARKET, BY APPLICATION, 2021-2030 (USD THOUSAND)
TABLE 65 U.S. CONSTRUCTION ROBOT MARKET, BY VERTICAL, 2021-2030 (USD THOUSAND)
TABLE 66 U.S. COMMERCIAL & RESIDENTIAL INFRASTRUCTURE IN CONSTRUCTION ROBOT MARKET, BY ROBOTS TYPE, 2021-2030 (USD THOUSAND)
TABLE 67 U.S. PUBLIC INFRASTRUCTURE IN CONSTRUCTION ROBOT MARKET, BY ROBOTS TYPE, 2021-2030 (USD THOUSAND)
TABLE 68 U.S. ENERGY & UTILITY IN CONSTRUCTION ROBOT MARKET, BY ROBOTS TYPE, 2021-2030 (USD THOUSAND)
TABLE 69 U.S. CONSTRUCTION ROBOT MARKET, BY PRODUCT TYPE, 2021-2030 (USD THOUSAND)
TABLE 70 CANADA CONSTRUCTION ROBOT MARKET, BY ROBOTS TYPE, 2021-2030 (USD THOUSAND)
TABLE 71 CANADA CONSTRUCTION ROBOT MARKET, BY PAYLOAD CAPACITY, 2021-2030 (USD THOUSAND)
TABLE 72 CANADA CONSTRUCTION ROBOT MARKET, BY AXIS TYPE, 2021-2030 (USD THOUSAND)
TABLE 73 CANADA CONSTRUCTION ROBOT MARKET, BY AUTOMATION, 2021-2030 (USD THOUSAND)
TABLE 74 CANADA CONSTRUCTION ROBOT MARKET, BY FUNCTION, 2021-2030 (USD THOUSAND)
TABLE 75 CANADA STRUCTURAL PROCESSES IN CONSTRUCTION ROBOT MARKET, BY TYPE, 2021-2030 (USD THOUSAND)
TABLE 76 CANADA FINISHING PROCESSES IN CONSTRUCTION ROBOT MARKET, BY APPLICATION, 2021-2030 (USD THOUSAND)
TABLE 77 CANADA CONSTRUCTION ROBOT MARKET, BY VERTICAL, 2021-2030 (USD THOUSAND)
TABLE 78 CANADA COMMERCIAL & RESIDENTIAL INFRASTRUCTURE IN CONSTRUCTION ROBOT MARKET, BY ROBOTS TYPE, 2021-2030 (USD THOUSAND)
TABLE 79 CANADA PUBLIC INFRASTRUCTURE IN CONSTRUCTION ROBOT MARKET, BY ROBOTS TYPE, 2021-2030 (USD THOUSAND)
TABLE 80 CANADA ENERGY & UTILITY IN CONSTRUCTION ROBOT MARKET, BY ROBOTS TYPE, 2021-2030 (USD THOUSAND)
TABLE 81 CANADA CONSTRUCTION ROBOT MARKET, BY PRODUCT TYPE, 2021-2030 (USD THOUSAND)
TABLE 82 MEXICO CONSTRUCTION ROBOT MARKET, BY ROBOTS TYPE, 2021-2030 (USD THOUSAND)
TABLE 83 MEXICO CONSTRUCTION ROBOT MARKET, BY PAYLOAD CAPACITY, 2021-2030 (USD THOUSAND)
TABLE 84 MEXICO CONSTRUCTION ROBOT MARKET, BY AXIS TYPE, 2021-2030 (USD THOUSAND)
TABLE 85 MEXICO CONSTRUCTION ROBOT MARKET, BY AUTOMATION, 2021-2030 (USD THOUSAND)
TABLE 86 MEXICO CONSTRUCTION ROBOT MARKET, BY FUNCTION, 2021-2030 (USD THOUSAND)
TABLE 87 MEXICO STRUCTURAL PROCESSES IN CONSTRUCTION ROBOT MARKET, BY TYPE, 2021-2030 (USD THOUSAND)
TABLE 88 MEXICO FINISHING PROCESSES IN CONSTRUCTION ROBOT MARKET, BY APPLICATION, 2021-2030 (USD THOUSAND)
TABLE 89 MEXICO CONSTRUCTION ROBOT MARKET, BY VERTICAL, 2021-2030 (USD THOUSAND)
TABLE 90 MEXICO COMMERCIAL & RESIDENTIAL INFRASTRUCTURE IN CONSTRUCTION ROBOT MARKET, BY ROBOTS TYPE, 2021-2030 (USD THOUSAND)
TABLE 91 MEXICO PUBLIC INFRASTRUCTURE IN CONSTRUCTION ROBOT MARKET, BY ROBOTS TYPE, 2021-2030 (USD THOUSAND)
TABLE 92 MEXICO ENERGY & UTILITY IN CONSTRUCTION ROBOT MARKET, BY ROBOTS TYPE, 2021-2030 (USD THOUSAND)
TABLE 93 MEXICO CONSTRUCTION ROBOT MARKET, BY PRODUCT TYPE, 2021-2030 (USD THOUSAND)
TABLE 94 ASIA-PACIFIC CONSTRUCTION ROBOT MARKET, BY COUNTRY, 2021-2030 (USD THOUSAND)
TABLE 95 ASIA-PACIFIC CONSTRUCTION ROBOT MARKET, BY ROBOTS TYPE, 2021-2030 (USD THOUSAND)
TABLE 96 ASIA-PACIFIC CONSTRUCTION ROBOT MARKET, BY PAYLOAD CAPACITY, 2021-2030 (USD THOUSAND)
TABLE 97 ASIA-PACIFIC CONSTRUCTION ROBOT MARKET, BY AXIS TYPE, 2021-2030 (USD THOUSAND)
TABLE 98 ASIA-PACIFIC CONSTRUCTION ROBOT MARKET, BY AUTOMATION, 2021-2030 (USD THOUSAND)
TABLE 99 ASIA-PACIFIC CONSTRUCTION ROBOT MARKET, BY FUNCTION, 2021-2030 (USD THOUSAND)
TABLE 100 ASIA-PACIFIC STRUCTURAL PROCESSES IN CONSTRUCTION ROBOT MARKET, BY TYPE, 2021-2030 (USD THOUSAND)
TABLE 101 ASIA-PACIFIC FINISHING PROCESSES IN CONSTRUCTION ROBOT MARKET, BY APPLICATION, 2021-2030 (USD THOUSAND)
TABLE 102 ASIA-PACIFIC CONSTRUCTION ROBOT MARKET, BY VERTICAL, 2021-2030 (USD THOUSAND)
TABLE 103 ASIA-PACIFIC COMMERCIAL & RESIDENTIAL INFRASTRUCTURE IN CONSTRUCTION ROBOT MARKET, BY ROBOTS TYPE, 2021-2030 (USD THOUSAND)
TABLE 104 ASIA-PACIFIC PUBLIC INFRASTRUCTURE IN CONSTRUCTION ROBOT MARKET, BY ROBOTS TYPE, 2021-2030 (USD THOUSAND)
TABLE 105 ASIA-PACIFIC ENERGY & UTILITY IN CONSTRUCTION ROBOT MARKET, BY ROBOTS TYPE, 2021-2030 (USD THOUSAND)
TABLE 106 ASIA-PACIFIC CONSTRUCTION ROBOT MARKET, BY PRODUCT TYPE, 2021-2030 (USD THOUSAND)
TABLE 107 ASIA-PACIFIC CONSTRUCTION ROBOT MARKET, BY PRODUCT TYPE, 2021-2030 (UNITS)
TABLE 108 CHINA CONSTRUCTION ROBOT MARKET, BY ROBOTS TYPE, 2021-2030 (USD THOUSAND)
TABLE 109 CHINA CONSTRUCTION ROBOT MARKET, BY PAYLOAD CAPACITY, 2021-2030 (USD THOUSAND)
TABLE 110 CHINA CONSTRUCTION ROBOT MARKET, BY AXIS TYPE, 2021-2030 (USD THOUSAND)
TABLE 111 CHINA CONSTRUCTION ROBOT MARKET, BY AUTOMATION, 2021-2030 (USD THOUSAND)
TABLE 112 CHINA CONSTRUCTION ROBOT MARKET, BY FUNCTION, 2021-2030 (USD THOUSAND)
TABLE 113 CHINA STRUCTURAL PROCESSES IN CONSTRUCTION ROBOT MARKET, BY TYPE, 2021-2030 (USD THOUSAND)
TABLE 114 CHINA FINISHING PROCESSES IN CONSTRUCTION ROBOT MARKET, BY APPLICATION, 2021-2030 (USD THOUSAND)
TABLE 115 CHINA CONSTRUCTION ROBOT MARKET, BY VERTICAL, 2021-2030 (USD THOUSAND)
TABLE 116 CHINA COMMERCIAL & RESIDENTIAL INFRASTRUCTURE IN CONSTRUCTION ROBOT MARKET, BY ROBOTS TYPE, 2021-2030 (USD THOUSAND)
TABLE 117 CHINA PUBLIC INFRASTRUCTURE IN CONSTRUCTION ROBOT MARKET, BY ROBOTS TYPE, 2021-2030 (USD THOUSAND)
TABLE 118 CHINA ENERGY & UTILITY IN CONSTRUCTION ROBOT MARKET, BY ROBOTS TYPE, 2021-2030 (USD THOUSAND)
TABLE 119 CHINA CONSTRUCTION ROBOT MARKET, BY PRODUCT TYPE, 2021-2030 (USD THOUSAND)
TABLE 120 JAPAN CONSTRUCTION ROBOT MARKET, BY ROBOTS TYPE, 2021-2030 (USD THOUSAND)
TABLE 121 JAPAN CONSTRUCTION ROBOT MARKET, BY PAYLOAD CAPACITY, 2021-2030 (USD THOUSAND)
TABLE 122 JAPAN CONSTRUCTION ROBOT MARKET, BY AXIS TYPE, 2021-2030 (USD THOUSAND)
TABLE 123 JAPAN CONSTRUCTION ROBOT MARKET, BY AUTOMATION, 2021-2030 (USD THOUSAND)
TABLE 124 JAPAN CONSTRUCTION ROBOT MARKET, BY FUNCTION, 2021-2030 (USD THOUSAND)
TABLE 125 JAPAN STRUCTURAL PROCESSES IN CONSTRUCTION ROBOT MARKET, BY TYPE, 2021-2030 (USD THOUSAND)
TABLE 126 JAPAN FINISHING PROCESSES IN CONSTRUCTION ROBOT MARKET, BY APPLICATION, 2021-2030 (USD THOUSAND)
TABLE 127 JAPAN CONSTRUCTION ROBOT MARKET, BY VERTICAL, 2021-2030 (USD THOUSAND)
TABLE 128 JAPAN COMMERCIAL & RESIDENTIAL INFRASTRUCTURE IN CONSTRUCTION ROBOT MARKET, BY ROBOTS TYPE, 2021-2030 (USD THOUSAND)
TABLE 129 JAPAN PUBLIC INFRASTRUCTURE IN CONSTRUCTION ROBOT MARKET, BY ROBOTS TYPE, 2021-2030 (USD THOUSAND)
TABLE 130 JAPAN ENERGY & UTILITY IN CONSTRUCTION ROBOT MARKET, BY ROBOTS TYPE, 2021-2030 (USD THOUSAND)
TABLE 131 JAPAN CONSTRUCTION ROBOT MARKET, BY PRODUCT TYPE, 2021-2030 (USD THOUSAND)
TABLE 132 INDIA CONSTRUCTION ROBOT MARKET, BY ROBOTS TYPE, 2021-2030 (USD THOUSAND)
TABLE 133 INDIA CONSTRUCTION ROBOT MARKET, BY PAYLOAD CAPACITY, 2021-2030 (USD THOUSAND)
TABLE 134 INDIA CONSTRUCTION ROBOT MARKET, BY AXIS TYPE, 2021-2030 (USD THOUSAND)
TABLE 135 INDIA CONSTRUCTION ROBOT MARKET, BY AUTOMATION, 2021-2030 (USD THOUSAND)
TABLE 136 INDIA CONSTRUCTION ROBOT MARKET, BY FUNCTION, 2021-2030 (USD THOUSAND)
TABLE 137 INDIA STRUCTURAL PROCESSES IN CONSTRUCTION ROBOT MARKET, BY TYPE, 2021-2030 (USD THOUSAND)
TABLE 138 INDIA FINISHING PROCESSES IN CONSTRUCTION ROBOT MARKET, BY APPLICATION, 2021-2030 (USD THOUSAND)
TABLE 139 INDIA CONSTRUCTION ROBOT MARKET, BY VERTICAL, 2021-2030 (USD THOUSAND)
TABLE 140 INDIA COMMERCIAL & RESIDENTIAL INFRASTRUCTURE IN CONSTRUCTION ROBOT MARKET, BY ROBOTS TYPE, 2021-2030 (USD THOUSAND)
TABLE 141 INDIA PUBLIC INFRASTRUCTURE IN CONSTRUCTION ROBOT MARKET, BY ROBOTS TYPE, 2021-2030 (USD THOUSAND)
TABLE 142 INDIA ENERGY & UTILITY IN CONSTRUCTION ROBOT MARKET, BY ROBOTS TYPE, 2021-2030 (USD THOUSAND)
TABLE 143 INDIA CONSTRUCTION ROBOT MARKET, BY PRODUCT TYPE, 2021-2030 (USD THOUSAND)
TABLE 144 SOUTH KOREA CONSTRUCTION ROBOT MARKET, BY ROBOTS TYPE, 2021-2030 (USD THOUSAND)
TABLE 145 SOUTH KOREA CONSTRUCTION ROBOT MARKET, BY PAYLOAD CAPACITY, 2021-2030 (USD THOUSAND)
TABLE 146 SOUTH KOREA CONSTRUCTION ROBOT MARKET, BY AXIS TYPE, 2021-2030 (USD THOUSAND)
TABLE 147 SOUTH KOREA CONSTRUCTION ROBOT MARKET, BY AUTOMATION, 2021-2030 (USD THOUSAND)
TABLE 148 SOUTH KOREA CONSTRUCTION ROBOT MARKET, BY FUNCTION, 2021-2030 (USD THOUSAND)
TABLE 149 SOUTH KOREA STRUCTURAL PROCESSES IN CONSTRUCTION ROBOT MARKET, BY TYPE, 2021-2030 (USD THOUSAND)
TABLE 150 SOUTH KOREA FINISHING PROCESSES IN CONSTRUCTION ROBOT MARKET, BY APPLICATION, 2021-2030 (USD THOUSAND)
TABLE 151 SOUTH KOREA CONSTRUCTION ROBOT MARKET, BY VERTICAL, 2021-2030 (USD THOUSAND)
TABLE 152 SOUTH KOREA COMMERCIAL & RESIDENTIAL INFRASTRUCTURE IN CONSTRUCTION ROBOT MARKET, BY ROBOTS TYPE, 2021-2030 (USD THOUSAND)
TABLE 153 SOUTH KOREA PUBLIC INFRASTRUCTURE IN CONSTRUCTION ROBOT MARKET, BY ROBOTS TYPE, 2021-2030 (USD THOUSAND)
TABLE 154 SOUTH KOREA ENERGY & UTILITY IN CONSTRUCTION ROBOT MARKET, BY ROBOTS TYPE, 2021-2030 (USD THOUSAND)
TABLE 155 SOUTH KOREA CONSTRUCTION ROBOT MARKET, BY PRODUCT TYPE, 2021-2030 (USD THOUSAND)
TABLE 156 AUSTRALIA CONSTRUCTION ROBOT MARKET, BY ROBOTS TYPE, 2021-2030 (USD THOUSAND)
TABLE 157 AUSTRALIA CONSTRUCTION ROBOT MARKET, BY PAYLOAD CAPACITY, 2021-2030 (USD THOUSAND)
TABLE 158 AUSTRALIA CONSTRUCTION ROBOT MARKET, BY AXIS TYPE, 2021-2030 (USD THOUSAND)
TABLE 159 AUSTRALIA CONSTRUCTION ROBOT MARKET, BY AUTOMATION, 2021-2030 (USD THOUSAND)
TABLE 160 AUSTRALIA CONSTRUCTION ROBOT MARKET, BY FUNCTION, 2021-2030 (USD THOUSAND)
TABLE 161 AUSTRALIA STRUCTURAL PROCESSES IN CONSTRUCTION ROBOT MARKET, BY TYPE, 2021-2030 (USD THOUSAND)
TABLE 162 AUSTRALIA FINISHING PROCESSES IN CONSTRUCTION ROBOT MARKET, BY APPLICATION, 2021-2030 (USD THOUSAND)
TABLE 163 AUSTRALIA CONSTRUCTION ROBOT MARKET, BY VERTICAL, 2021-2030 (USD THOUSAND)
TABLE 164 AUSTRALIA COMMERCIAL & RESIDENTIAL INFRASTRUCTURE IN CONSTRUCTION ROBOT MARKET, BY ROBOTS TYPE, 2021-2030 (USD THOUSAND)
TABLE 165 AUSTRALIA PUBLIC INFRASTRUCTURE IN CONSTRUCTION ROBOT MARKET, BY ROBOTS TYPE, 2021-2030 (USD THOUSAND)
TABLE 166 AUSTRALIA ENERGY & UTILITY IN CONSTRUCTION ROBOT MARKET, BY ROBOTS TYPE, 2021-2030 (USD THOUSAND)
TABLE 167 AUSTRALIA CONSTRUCTION ROBOT MARKET, BY PRODUCT TYPE, 2021-2030 (USD THOUSAND)
TABLE 168 SINGAPORE CONSTRUCTION ROBOT MARKET, BY ROBOTS TYPE, 2021-2030 (USD THOUSAND)
TABLE 169 SINGAPORE CONSTRUCTION ROBOT MARKET, BY PAYLOAD CAPACITY, 2021-2030 (USD THOUSAND)
TABLE 170 SINGAPORE CONSTRUCTION ROBOT MARKET, BY AXIS TYPE, 2021-2030 (USD THOUSAND)
TABLE 171 SINGAPORE CONSTRUCTION ROBOT MARKET, BY AUTOMATION, 2021-2030 (USD THOUSAND)
TABLE 172 SINGAPORE CONSTRUCTION ROBOT MARKET, BY FUNCTION, 2021-2030 (USD THOUSAND)
TABLE 173 SINGAPORE STRUCTURAL PROCESSES IN CONSTRUCTION ROBOT MARKET, BY TYPE, 2021-2030 (USD THOUSAND)
TABLE 174 SINGAPORE FINISHING PROCESSES IN CONSTRUCTION ROBOT MARKET, BY APPLICATION, 2021-2030 (USD THOUSAND)
TABLE 175 SINGAPORE CONSTRUCTION ROBOT MARKET, BY VERTICAL, 2021-2030 (USD THOUSAND)
TABLE 176 SINGAPORE COMMERCIAL & RESIDENTIAL INFRASTRUCTURE IN CONSTRUCTION ROBOT MARKET, BY ROBOTS TYPE, 2021-2030 (USD THOUSAND)
TABLE 177 SINGAPORE PUBLIC INFRASTRUCTURE IN CONSTRUCTION ROBOT MARKET, BY ROBOTS TYPE, 2021-2030 (USD THOUSAND)
TABLE 178 SINGAPORE ENERGY & UTILITY IN CONSTRUCTION ROBOT MARKET, BY ROBOTS TYPE, 2021-2030 (USD THOUSAND)
TABLE 179 SINGAPORE CONSTRUCTION ROBOT MARKET, BY PRODUCT TYPE, 2021-2030 (USD THOUSAND)
TABLE 180 MALAYSIA CONSTRUCTION ROBOT MARKET, BY ROBOTS TYPE, 2021-2030 (USD THOUSAND)
TABLE 181 MALAYSIA CONSTRUCTION ROBOT MARKET, BY PAYLOAD CAPACITY, 2021-2030 (USD THOUSAND)
TABLE 182 MALAYSIA CONSTRUCTION ROBOT MARKET, BY AXIS TYPE, 2021-2030 (USD THOUSAND)
TABLE 183 MALAYSIA CONSTRUCTION ROBOT MARKET, BY AUTOMATION, 2021-2030 (USD THOUSAND)
TABLE 184 MALAYSIA CONSTRUCTION ROBOT MARKET, BY FUNCTION, 2021-2030 (USD THOUSAND)
TABLE 185 MALAYSIA STRUCTURAL PROCESSES IN CONSTRUCTION ROBOT MARKET, BY TYPE, 2021-2030 (USD THOUSAND)
TABLE 186 MALAYSIA FINISHING PROCESSES IN CONSTRUCTION ROBOT MARKET, BY APPLICATION, 2021-2030 (USD THOUSAND)
TABLE 187 MALAYSIA CONSTRUCTION ROBOT MARKET, BY VERTICAL, 2021-2030 (USD THOUSAND)
TABLE 188 MALAYSIA COMMERCIAL & RESIDENTIAL INFRASTRUCTURE IN CONSTRUCTION ROBOT MARKET, BY ROBOTS TYPE, 2021-2030 (USD THOUSAND)
TABLE 189 MALAYSIA PUBLIC INFRASTRUCTURE IN CONSTRUCTION ROBOT MARKET, BY ROBOTS TYPE, 2021-2030 (USD THOUSAND)
TABLE 190 MALAYSIA ENERGY & UTILITY IN CONSTRUCTION ROBOT MARKET, BY ROBOTS TYPE, 2021-2030 (USD THOUSAND)
TABLE 191 MALAYSIA CONSTRUCTION ROBOT MARKET, BY PRODUCT TYPE, 2021-2030 (USD THOUSAND)
TABLE 192 THAILAND CONSTRUCTION ROBOT MARKET, BY ROBOTS TYPE, 2021-2030 (USD THOUSAND)
TABLE 193 THAILAND CONSTRUCTION ROBOT MARKET, BY PAYLOAD CAPACITY, 2021-2030 (USD THOUSAND)
TABLE 194 THAILAND CONSTRUCTION ROBOT MARKET, BY AXIS TYPE, 2021-2030 (USD THOUSAND)
TABLE 195 THAILAND CONSTRUCTION ROBOT MARKET, BY AUTOMATION, 2021-2030 (USD THOUSAND)
TABLE 196 THAILAND CONSTRUCTION ROBOT MARKET, BY FUNCTION, 2021-2030 (USD THOUSAND)
TABLE 197 THAILAND STRUCTURAL PROCESSES IN CONSTRUCTION ROBOT MARKET, BY TYPE, 2021-2030 (USD THOUSAND)
TABLE 198 THAILAND FINISHING PROCESSES IN CONSTRUCTION ROBOT MARKET, BY APPLICATION, 2021-2030 (USD THOUSAND)
TABLE 199 THAILAND CONSTRUCTION ROBOT MARKET, BY VERTICAL, 2021-2030 (USD THOUSAND)
TABLE 200 THAILAND COMMERCIAL & RESIDENTIAL INFRASTRUCTURE IN CONSTRUCTION ROBOT MARKET, BY ROBOTS TYPE, 2021-2030 (USD THOUSAND)
TABLE 201 THAILAND PUBLIC INFRASTRUCTURE IN CONSTRUCTION ROBOT MARKET, BY ROBOTS TYPE, 2021-2030 (USD THOUSAND)
TABLE 202 THAILAND ENERGY & UTILITY IN CONSTRUCTION ROBOT MARKET, BY ROBOTS TYPE, 2021-2030 (USD THOUSAND)
TABLE 203 THAILAND CONSTRUCTION ROBOT MARKET, BY PRODUCT TYPE, 2021-2030 (USD THOUSAND)
TABLE 204 INDONESIA CONSTRUCTION ROBOT MARKET, BY ROBOTS TYPE, 2021-2030 (USD THOUSAND)
TABLE 205 INDONESIA CONSTRUCTION ROBOT MARKET, BY PAYLOAD CAPACITY, 2021-2030 (USD THOUSAND)
TABLE 206 INDONESIA CONSTRUCTION ROBOT MARKET, BY AXIS TYPE, 2021-2030 (USD THOUSAND)
TABLE 207 INDONESIA CONSTRUCTION ROBOT MARKET, BY AUTOMATION, 2021-2030 (USD THOUSAND)
TABLE 208 INDONESIA CONSTRUCTION ROBOT MARKET, BY FUNCTION, 2021-2030 (USD THOUSAND)
TABLE 209 INDONESIA STRUCTURAL PROCESSES IN CONSTRUCTION ROBOT MARKET, BY TYPE, 2021-2030 (USD THOUSAND)
TABLE 210 INDONESIA FINISHING PROCESSES IN CONSTRUCTION ROBOT MARKET, BY APPLICATION, 2021-2030 (USD THOUSAND)
TABLE 211 INDONESIA CONSTRUCTION ROBOT MARKET, BY VERTICAL, 2021-2030 (USD THOUSAND)
TABLE 212 INDONESIA COMMERCIAL & RESIDENTIAL INFRASTRUCTURE IN CONSTRUCTION ROBOT MARKET, BY ROBOTS TYPE, 2021-2030 (USD THOUSAND)
TABLE 213 INDONESIA PUBLIC INFRASTRUCTURE IN CONSTRUCTION ROBOT MARKET, BY ROBOTS TYPE, 2021-2030 (USD THOUSAND)
TABLE 214 INDONESIA ENERGY & UTILITY IN CONSTRUCTION ROBOT MARKET, BY ROBOTS TYPE, 2021-2030 (USD THOUSAND)
TABLE 215 INDONESIA CONSTRUCTION ROBOT MARKET, BY PRODUCT TYPE, 2021-2030 (USD THOUSAND)
TABLE 216 PHILIPPINES CONSTRUCTION ROBOT MARKET, BY ROBOTS TYPE, 2021-2030 (USD THOUSAND)
TABLE 217 PHILIPPINES CONSTRUCTION ROBOT MARKET, BY PAYLOAD CAPACITY, 2021-2030 (USD THOUSAND)
TABLE 218 PHILIPPINES CONSTRUCTION ROBOT MARKET, BY AXIS TYPE, 2021-2030 (USD THOUSAND)
TABLE 219 PHILIPPINES CONSTRUCTION ROBOT MARKET, BY AUTOMATION, 2021-2030 (USD THOUSAND)
TABLE 220 PHILIPPINES CONSTRUCTION ROBOT MARKET, BY FUNCTION, 2021-2030 (USD THOUSAND)
TABLE 221 PHILIPPINES STRUCTURAL PROCESSES IN CONSTRUCTION ROBOT MARKET, BY TYPE, 2021-2030 (USD THOUSAND)
TABLE 222 PHILIPPINES FINISHING PROCESSES IN CONSTRUCTION ROBOT MARKET, BY APPLICATION, 2021-2030 (USD THOUSAND)
TABLE 223 PHILIPPINES CONSTRUCTION ROBOT MARKET, BY VERTICAL, 2021-2030 (USD THOUSAND)
TABLE 224 PHILIPPINES COMMERCIAL & RESIDENTIAL INFRASTRUCTURE IN CONSTRUCTION ROBOT MARKET, BY ROBOTS TYPE, 2021-2030 (USD THOUSAND)
TABLE 225 PHILIPPINES PUBLIC INFRASTRUCTURE IN CONSTRUCTION ROBOT MARKET, BY ROBOTS TYPE, 2021-2030 (USD THOUSAND)
TABLE 226 PHILIPPINES ENERGY & UTILITY IN CONSTRUCTION ROBOT MARKET, BY ROBOTS TYPE, 2021-2030 (USD THOUSAND)
TABLE 227 PHILIPPINES CONSTRUCTION ROBOT MARKET, BY PRODUCT TYPE, 2021-2030 (USD THOUSAND)
TABLE 228 REST OF ASIA-PACIFIC CONSTRUCTION ROBOT MARKET, BY ROBOTS TYPE, 2021-2030 (USD THOUSAND)
TABLE 229 EUROPE CONSTRUCTION ROBOT MARKET, BY COUNTRY, 2021-2030 (USD THOUSAND)
TABLE 230 EUROPE CONSTRUCTION ROBOT MARKET, BY ROBOTS TYPE, 2021-2030 (USD THOUSAND)
TABLE 231 EUROPE CONSTRUCTION ROBOT MARKET, BY PAYLOAD CAPACITY, 2021-2030 (USD THOUSAND)
TABLE 232 EUROPE CONSTRUCTION ROBOT MARKET, BY AXIS TYPE, 2021-2030 (USD THOUSAND)
TABLE 233 EUROPE CONSTRUCTION ROBOT MARKET, BY AUTOMATION, 2021-2030 (USD THOUSAND)
TABLE 234 EUROPE CONSTRUCTION ROBOT MARKET, BY FUNCTION, 2021-2030 (USD THOUSAND)
TABLE 235 EUROPE STRUCTURAL PROCESSES IN CONSTRUCTION ROBOT MARKET, BY TYPE, 2021-2030 (USD THOUSAND)
TABLE 236 EUROPE FINISHING PROCESSES IN CONSTRUCTION ROBOT MARKET, BY APPLICATION, 2021-2030 (USD THOUSAND)
TABLE 237 EUROPE CONSTRUCTION ROBOT MARKET, BY VERTICAL, 2021-2030 (USD THOUSAND)
TABLE 238 EUROPE COMMERCIAL & RESIDENTIAL INFRASTRUCTURE IN CONSTRUCTION ROBOT MARKET, BY ROBOTS TYPE, 2021-2030 (USD THOUSAND)
TABLE 239 EUROPE PUBLIC INFRASTRUCTURE IN CONSTRUCTION ROBOT MARKET, BY ROBOTS TYPE, 2021-2030 (USD THOUSAND)
TABLE 240 EUROPE ENERGY & UTILITY IN CONSTRUCTION ROBOT MARKET, BY ROBOTS TYPE, 2021-2030 (USD THOUSAND)
TABLE 241 EUROPE CONSTRUCTION ROBOT MARKET, BY PRODUCT TYPE, 2021-2030 (USD THOUSAND)
TABLE 242 EUROPE CONSTRUCTION ROBOT MARKET, BY PRODUCT TYPE, 2021-2030 (UNITS)
TABLE 243 GERMANY CONSTRUCTION ROBOT MARKET, BY ROBOTS TYPE, 2021-2030 (USD THOUSAND)
TABLE 244 GERMANY CONSTRUCTION ROBOT MARKET, BY PAYLOAD CAPACITY, 2021-2030 (USD THOUSAND)
TABLE 245 GERMANY CONSTRUCTION ROBOT MARKET, BY AXIS TYPE, 2021-2030 (USD THOUSAND)
TABLE 246 GERMANY CONSTRUCTION ROBOT MARKET, BY AUTOMATION, 2021-2030 (USD THOUSAND)
TABLE 247 GERMANY CONSTRUCTION ROBOT MARKET, BY FUNCTION, 2021-2030 (USD THOUSAND)
TABLE 248 GERMANY STRUCTURAL PROCESSES IN CONSTRUCTION ROBOT MARKET, BY TYPE, 2021-2030 (USD THOUSAND)
TABLE 249 GERMANY FINISHING PROCESSES IN CONSTRUCTION ROBOT MARKET, BY APPLICATION, 2021-2030 (USD THOUSAND)
TABLE 250 GERMANY CONSTRUCTION ROBOT MARKET, BY VERTICAL, 2021-2030 (USD THOUSAND)
TABLE 251 GERMANY COMMERCIAL & RESIDENTIAL INFRASTRUCTURE IN CONSTRUCTION ROBOT MARKET, BY ROBOTS TYPE, 2021-2030 (USD THOUSAND)
TABLE 252 GERMANY PUBLIC INFRASTRUCTURE IN CONSTRUCTION ROBOT MARKET, BY ROBOTS TYPE, 2021-2030 (USD THOUSAND)
TABLE 253 GERMANY ENERGY & UTILITY IN CONSTRUCTION ROBOT MARKET, BY ROBOTS TYPE, 2021-2030 (USD THOUSAND)
TABLE 254 GERMANY CONSTRUCTION ROBOT MARKET, BY PRODUCT TYPE, 2021-2030 (USD THOUSAND)
TABLE 255 U.K. CONSTRUCTION ROBOT MARKET, BY ROBOTS TYPE, 2021-2030 (USD THOUSAND)
TABLE 256 U.K. CONSTRUCTION ROBOT MARKET, BY PAYLOAD CAPACITY, 2021-2030 (USD THOUSAND)
TABLE 257 U.K. CONSTRUCTION ROBOT MARKET, BY AXIS TYPE, 2021-2030 (USD THOUSAND)
TABLE 258 U.K. CONSTRUCTION ROBOT MARKET, BY AUTOMATION, 2021-2030 (USD THOUSAND)
TABLE 259 U.K. CONSTRUCTION ROBOT MARKET, BY FUNCTION, 2021-2030 (USD THOUSAND)
TABLE 260 U.K. STRUCTURAL PROCESSES IN CONSTRUCTION ROBOT MARKET, BY TYPE, 2021-2030 (USD THOUSAND)
TABLE 261 U.K. FINISHING PROCESSES IN CONSTRUCTION ROBOT MARKET, BY APPLICATION, 2021-2030 (USD THOUSAND)
TABLE 262 U.K. CONSTRUCTION ROBOT MARKET, BY VERTICAL, 2021-2030 (USD THOUSAND)
TABLE 263 U.K. COMMERCIAL & RESIDENTIAL INFRASTRUCTURE IN CONSTRUCTION ROBOT MARKET, BY ROBOTS TYPE, 2021-2030 (USD THOUSAND)
TABLE 264 U.K. PUBLIC INFRASTRUCTURE IN CONSTRUCTION ROBOT MARKET, BY ROBOTS TYPE, 2021-2030 (USD THOUSAND)
TABLE 265 U.K. ENERGY & UTILITY IN CONSTRUCTION ROBOT MARKET, BY ROBOTS TYPE, 2021-2030 (USD THOUSAND)
TABLE 266 U.K. CONSTRUCTION ROBOT MARKET, BY PRODUCT TYPE, 2021-2030 (USD THOUSAND)
TABLE 267 FRANCE CONSTRUCTION ROBOT MARKET, BY ROBOTS TYPE, 2021-2030 (USD THOUSAND)
TABLE 268 FRANCE CONSTRUCTION ROBOT MARKET, BY PAYLOAD CAPACITY, 2021-2030 (USD THOUSAND)
TABLE 269 FRANCE CONSTRUCTION ROBOT MARKET, BY AXIS TYPE, 2021-2030 (USD THOUSAND)
TABLE 270 FRANCE CONSTRUCTION ROBOT MARKET, BY AUTOMATION, 2021-2030 (USD THOUSAND)
TABLE 271 FRANCE CONSTRUCTION ROBOT MARKET, BY FUNCTION, 2021-2030 (USD THOUSAND)
TABLE 272 FRANCE STRUCTURAL PROCESSES IN CONSTRUCTION ROBOT MARKET, BY TYPE, 2021-2030 (USD THOUSAND)
TABLE 273 FRANCE FINISHING PROCESSES IN CONSTRUCTION ROBOT MARKET, BY APPLICATION, 2021-2030 (USD THOUSAND)
TABLE 274 FRANCE CONSTRUCTION ROBOT MARKET, BY VERTICAL, 2021-2030 (USD THOUSAND)
TABLE 275 FRANCE COMMERCIAL & RESIDENTIAL INFRASTRUCTURE IN CONSTRUCTION ROBOT MARKET, BY ROBOTS TYPE, 2021-2030 (USD THOUSAND)
TABLE 276 FRANCE PUBLIC INFRASTRUCTURE IN CONSTRUCTION ROBOT MARKET, BY ROBOTS TYPE, 2021-2030 (USD THOUSAND)
TABLE 277 FRANCE ENERGY & UTILITY IN CONSTRUCTION ROBOT MARKET, BY ROBOTS TYPE, 2021-2030 (USD THOUSAND)
TABLE 278 FRANCE CONSTRUCTION ROBOT MARKET, BY PRODUCT TYPE, 2021-2030 (USD THOUSAND)
TABLE 279 ITALY CONSTRUCTION ROBOT MARKET, BY ROBOTS TYPE, 2021-2030 (USD THOUSAND)
TABLE 280 ITALY CONSTRUCTION ROBOT MARKET, BY PAYLOAD CAPACITY, 2021-2030 (USD THOUSAND)
TABLE 281 ITALY CONSTRUCTION ROBOT MARKET, BY AXIS TYPE, 2021-2030 (USD THOUSAND)
TABLE 282 ITALY CONSTRUCTION ROBOT MARKET, BY AUTOMATION, 2021-2030 (USD THOUSAND)
TABLE 283 ITALY CONSTRUCTION ROBOT MARKET, BY FUNCTION, 2021-2030 (USD THOUSAND)
TABLE 284 ITALY STRUCTURAL PROCESSES IN CONSTRUCTION ROBOT MARKET, BY TYPE, 2021-2030 (USD THOUSAND)
TABLE 285 ITALY FINISHING PROCESSES IN CONSTRUCTION ROBOT MARKET, BY APPLICATION, 2021-2030 (USD THOUSAND)
TABLE 286 ITALY CONSTRUCTION ROBOT MARKET, BY VERTICAL, 2021-2030 (USD THOUSAND)
TABLE 287 ITALY COMMERCIAL & RESIDENTIAL INFRASTRUCTURE IN CONSTRUCTION ROBOT MARKET, BY ROBOTS TYPE, 2021-2030 (USD THOUSAND)
TABLE 288 ITALY PUBLIC INFRASTRUCTURE IN CONSTRUCTION ROBOT MARKET, BY ROBOTS TYPE, 2021-2030 (USD THOUSAND)
TABLE 289 ITALY ENERGY & UTILITY IN CONSTRUCTION ROBOT MARKET, BY ROBOTS TYPE, 2021-2030 (USD THOUSAND)
TABLE 290 ITALY CONSTRUCTION ROBOT MARKET, BY PRODUCT TYPE, 2021-2030 (USD THOUSAND)
TABLE 291 SPAIN CONSTRUCTION ROBOT MARKET, BY ROBOTS TYPE, 2021-2030 (USD THOUSAND)
TABLE 292 SPAIN CONSTRUCTION ROBOT MARKET, BY PAYLOAD CAPACITY, 2021-2030 (USD THOUSAND)
TABLE 293 SPAIN CONSTRUCTION ROBOT MARKET, BY AXIS TYPE, 2021-2030 (USD THOUSAND)
TABLE 294 SPAIN CONSTRUCTION ROBOT MARKET, BY AUTOMATION, 2021-2030 (USD THOUSAND)
TABLE 295 SPAIN CONSTRUCTION ROBOT MARKET, BY FUNCTION, 2021-2030 (USD THOUSAND)
TABLE 296 SPAIN STRUCTURAL PROCESSES IN CONSTRUCTION ROBOT MARKET, BY TYPE, 2021-2030 (USD THOUSAND)
TABLE 297 SPAIN FINISHING PROCESSES IN CONSTRUCTION ROBOT MARKET, BY APPLICATION, 2021-2030 (USD THOUSAND)
TABLE 298 SPAIN CONSTRUCTION ROBOT MARKET, BY VERTICAL, 2021-2030 (USD THOUSAND)
TABLE 299 SPAIN COMMERCIAL & RESIDENTIAL INFRASTRUCTURE IN CONSTRUCTION ROBOT MARKET, BY ROBOTS TYPE, 2021-2030 (USD THOUSAND)
TABLE 300 SPAIN PUBLIC INFRASTRUCTURE IN CONSTRUCTION ROBOT MARKET, BY ROBOTS TYPE, 2021-2030 (USD THOUSAND)
TABLE 301 SPAIN ENERGY & UTILITY IN CONSTRUCTION ROBOT MARKET, BY ROBOTS TYPE, 2021-2030 (USD THOUSAND)
TABLE 302 SPAIN CONSTRUCTION ROBOT MARKET, BY PRODUCT TYPE, 2021-2030 (USD THOUSAND)
TABLE 303 TURKEY CONSTRUCTION ROBOT MARKET, BY ROBOTS TYPE, 2021-2030 (USD THOUSAND)
TABLE 304 TURKEY CONSTRUCTION ROBOT MARKET, BY PAYLOAD CAPACITY, 2021-2030 (USD THOUSAND)
TABLE 305 TURKEY CONSTRUCTION ROBOT MARKET, BY AXIS TYPE, 2021-2030 (USD THOUSAND)
TABLE 306 TURKEY CONSTRUCTION ROBOT MARKET, BY AUTOMATION, 2021-2030 (USD THOUSAND)
TABLE 307 TURKEY CONSTRUCTION ROBOT MARKET, BY FUNCTION, 2021-2030 (USD THOUSAND)
TABLE 308 TURKEY STRUCTURAL PROCESSES IN CONSTRUCTION ROBOT MARKET, BY TYPE, 2021-2030 (USD THOUSAND)
TABLE 309 TURKEY FINISHING PROCESSES IN CONSTRUCTION ROBOT MARKET, BY APPLICATION, 2021-2030 (USD THOUSAND)
TABLE 310 TURKEY CONSTRUCTION ROBOT MARKET, BY VERTICAL, 2021-2030 (USD THOUSAND)
TABLE 311 TURKEY COMMERCIAL & RESIDENTIAL INFRASTRUCTURE IN CONSTRUCTION ROBOT MARKET, BY ROBOTS TYPE, 2021-2030 (USD THOUSAND)
TABLE 312 TURKEY PUBLIC INFRASTRUCTURE IN CONSTRUCTION ROBOT MARKET, BY ROBOTS TYPE, 2021-2030 (USD THOUSAND)
TABLE 313 TURKEY ENERGY & UTILITY IN CONSTRUCTION ROBOT MARKET, BY ROBOTS TYPE, 2021-2030 (USD THOUSAND)
TABLE 314 TURKEY CONSTRUCTION ROBOT MARKET, BY PRODUCT TYPE, 2021-2030 (USD THOUSAND)
TABLE 315 RUSSIA CONSTRUCTION ROBOT MARKET, BY ROBOTS TYPE, 2021-2030 (USD THOUSAND)
TABLE 316 RUSSIA CONSTRUCTION ROBOT MARKET, BY PAYLOAD CAPACITY, 2021-2030 (USD THOUSAND)
TABLE 317 RUSSIA CONSTRUCTION ROBOT MARKET, BY AXIS TYPE, 2021-2030 (USD THOUSAND)
TABLE 318 RUSSIA CONSTRUCTION ROBOT MARKET, BY AUTOMATION, 2021-2030 (USD THOUSAND)
TABLE 319 RUSSIA CONSTRUCTION ROBOT MARKET, BY FUNCTION, 2021-2030 (USD THOUSAND)
TABLE 320 RUSSIA STRUCTURAL PROCESSES IN CONSTRUCTION ROBOT MARKET, BY TYPE, 2021-2030 (USD THOUSAND)
TABLE 321 RUSSIA FINISHING PROCESSES IN CONSTRUCTION ROBOT MARKET, BY APPLICATION, 2021-2030 (USD THOUSAND)
TABLE 322 RUSSIA CONSTRUCTION ROBOT MARKET, BY VERTICAL, 2021-2030 (USD THOUSAND)
TABLE 323 RUSSIA COMMERCIAL & RESIDENTIAL INFRASTRUCTURE IN CONSTRUCTION ROBOT MARKET, BY ROBOTS TYPE, 2021-2030 (USD THOUSAND)
TABLE 324 RUSSIA PUBLIC INFRASTRUCTURE IN CONSTRUCTION ROBOT MARKET, BY ROBOTS TYPE, 2021-2030 (USD THOUSAND)
TABLE 325 RUSSIA ENERGY & UTILITY IN CONSTRUCTION ROBOT MARKET, BY ROBOTS TYPE, 2021-2030 (USD THOUSAND)
TABLE 326 RUSSIA CONSTRUCTION ROBOT MARKET, BY PRODUCT TYPE, 2021-2030 (USD THOUSAND)
TABLE 327 NETHERLANDS CONSTRUCTION ROBOT MARKET, BY ROBOTS TYPE, 2021-2030 (USD THOUSAND)
TABLE 328 NETHERLANDS CONSTRUCTION ROBOT MARKET, BY PAYLOAD CAPACITY, 2021-2030 (USD THOUSAND)
TABLE 329 NETHERLANDS CONSTRUCTION ROBOT MARKET, BY AXIS TYPE, 2021-2030 (USD THOUSAND)
TABLE 330 NETHERLANDS CONSTRUCTION ROBOT MARKET, BY AUTOMATION, 2021-2030 (USD THOUSAND)
TABLE 331 NETHERLANDS CONSTRUCTION ROBOT MARKET, BY FUNCTION, 2021-2030 (USD THOUSAND)
TABLE 332 NETHERLANDS STRUCTURAL PROCESSES IN CONSTRUCTION ROBOT MARKET, BY TYPE, 2021-2030 (USD THOUSAND)
TABLE 333 NETHERLANDS FINISHING PROCESSES IN CONSTRUCTION ROBOT MARKET, BY APPLICATION, 2021-2030 (USD THOUSAND)
TABLE 334 NETHERLANDS CONSTRUCTION ROBOT MARKET, BY VERTICAL, 2021-2030 (USD THOUSAND)
TABLE 335 NETHERLANDS COMMERCIAL & RESIDENTIAL INFRASTRUCTURE IN CONSTRUCTION ROBOT MARKET, BY ROBOTS TYPE, 2021-2030 (USD THOUSAND)
TABLE 336 NETHERLANDS PUBLIC INFRASTRUCTURE IN CONSTRUCTION ROBOT MARKET, BY ROBOTS TYPE, 2021-2030 (USD THOUSAND)
TABLE 337 NETHERLANDS ENERGY & UTILITY IN CONSTRUCTION ROBOT MARKET, BY ROBOTS TYPE, 2021-2030 (USD THOUSAND)
TABLE 338 NETHERLANDS CONSTRUCTION ROBOT MARKET, BY PRODUCT TYPE, 2021-2030 (USD THOUSAND)
TABLE 339 BELGIUM CONSTRUCTION ROBOT MARKET, BY ROBOTS TYPE, 2021-2030 (USD THOUSAND)
TABLE 340 BELGIUM CONSTRUCTION ROBOT MARKET, BY PAYLOAD CAPACITY, 2021-2030 (USD THOUSAND)
TABLE 341 BELGIUM CONSTRUCTION ROBOT MARKET, BY AXIS TYPE, 2021-2030 (USD THOUSAND)
TABLE 342 BELGIUM CONSTRUCTION ROBOT MARKET, BY AUTOMATION, 2021-2030 (USD THOUSAND)
TABLE 343 BELGIUM CONSTRUCTION ROBOT MARKET, BY FUNCTION, 2021-2030 (USD THOUSAND)
TABLE 344 BELGIUM STRUCTURAL PROCESSES IN CONSTRUCTION ROBOT MARKET, BY TYPE, 2021-2030 (USD THOUSAND)
TABLE 345 BELGIUM FINISHING PROCESSES IN CONSTRUCTION ROBOT MARKET, BY APPLICATION, 2021-2030 (USD THOUSAND)
TABLE 346 BELGIUM CONSTRUCTION ROBOT MARKET, BY VERTICAL, 2021-2030 (USD THOUSAND)
TABLE 347 BELGIUM COMMERCIAL & RESIDENTIAL INFRASTRUCTURE IN CONSTRUCTION ROBOT MARKET, BY ROBOTS TYPE, 2021-2030 (USD THOUSAND)
TABLE 348 BELGIUM PUBLIC INFRASTRUCTURE IN CONSTRUCTION ROBOT MARKET, BY ROBOTS TYPE, 2021-2030 (USD THOUSAND)
TABLE 349 BELGIUM ENERGY & UTILITY IN CONSTRUCTION ROBOT MARKET, BY ROBOTS TYPE, 2021-2030 (USD THOUSAND)
TABLE 350 BELGIUM CONSTRUCTION ROBOT MARKET, BY PRODUCT TYPE, 2021-2030 (USD THOUSAND)
TABLE 351 SWITZERLAND CONSTRUCTION ROBOT MARKET, BY ROBOTS TYPE, 2021-2030 (USD THOUSAND)
TABLE 352 SWITZERLAND CONSTRUCTION ROBOT MARKET, BY PAYLOAD CAPACITY, 2021-2030 (USD THOUSAND)
TABLE 353 SWITZERLAND CONSTRUCTION ROBOT MARKET, BY AXIS TYPE, 2021-2030 (USD THOUSAND)
TABLE 354 SWITZERLAND CONSTRUCTION ROBOT MARKET, BY AUTOMATION, 2021-2030 (USD THOUSAND)
TABLE 355 SWITZERLAND CONSTRUCTION ROBOT MARKET, BY FUNCTION, 2021-2030 (USD THOUSAND)
TABLE 356 SWITZERLAND STRUCTURAL PROCESSES IN CONSTRUCTION ROBOT MARKET, BY TYPE, 2021-2030 (USD THOUSAND)
TABLE 357 SWITZERLAND FINISHING PROCESSES IN CONSTRUCTION ROBOT MARKET, BY APPLICATION, 2021-2030 (USD THOUSAND)
TABLE 358 SWITZERLAND CONSTRUCTION ROBOT MARKET, BY VERTICAL, 2021-2030 (USD THOUSAND)
TABLE 359 SWITZERLAND COMMERCIAL & RESIDENTIAL INFRASTRUCTURE IN CONSTRUCTION ROBOT MARKET, BY ROBOTS TYPE, 2021-2030 (USD THOUSAND)
TABLE 360 SWITZERLAND PUBLIC INFRASTRUCTURE IN CONSTRUCTION ROBOT MARKET, BY ROBOTS TYPE, 2021-2030 (USD THOUSAND)
TABLE 361 SWITZERLAND ENERGY & UTILITY IN CONSTRUCTION ROBOT MARKET, BY ROBOTS TYPE, 2021-2030 (USD THOUSAND)
TABLE 362 SWITZERLAND CONSTRUCTION ROBOT MARKET, BY PRODUCT TYPE, 2021-2030 (USD THOUSAND)
TABLE 363 REST OF EUROPE CONSTRUCTION ROBOT MARKET, BY ROBOTS TYPE, 2021-2030 (USD THOUSAND)
TABLE 364 MIDDLE EAST AND AFRICA CONSTRUCTION ROBOT MARKET, BY COUNTRY, 2021-2030 (USD THOUSAND)
TABLE 365 MIDDLE EAST AND AFRICA CONSTRUCTION ROBOT MARKET, BY ROBOTS TYPE, 2021-2030 (USD THOUSAND)
TABLE 366 MIDDLE EAST AND AFRICA CONSTRUCTION ROBOT MARKET, BY PAYLOAD CAPACITY, 2021-2030 (USD THOUSAND)
TABLE 367 MIDDLE EAST AND AFRICA CONSTRUCTION ROBOT MARKET, BY AXIS TYPE, 2021-2030 (USD THOUSAND)
TABLE 368 MIDDLE EAST AND AFRICA CONSTRUCTION ROBOT MARKET, BY AUTOMATION, 2021-2030 (USD THOUSAND)
TABLE 369 MIDDLE EAST AND AFRICA CONSTRUCTION ROBOT MARKET, BY FUNCTION, 2021-2030 (USD THOUSAND)
TABLE 370 MIDDLE EAST AND AFRICA STRUCTURAL PROCESSES IN CONSTRUCTION ROBOT MARKET, BY TYPE, 2021-2030 (USD THOUSAND)
TABLE 371 MIDDLE EAST AND AFRICA FINISHING PROCESSES IN CONSTRUCTION ROBOT MARKET, BY APPLICATION, 2021-2030 (USD THOUSAND)
TABLE 372 MIDDLE EAST AND AFRICA CONSTRUCTION ROBOT MARKET, BY VERTICAL, 2021-2030 (USD THOUSAND)
TABLE 373 MIDDLE EAST AND AFRICA COMMERCIAL & RESIDENTIAL INFRASTRUCTURE IN CONSTRUCTION ROBOT MARKET, BY ROBOTS TYPE, 2021-2030 (USD THOUSAND)
TABLE 374 MIDDLE EAST AND AFRICA PUBLIC INFRASTRUCTURE IN CONSTRUCTION ROBOT MARKET, BY ROBOTS TYPE, 2021-2030 (USD THOUSAND)
TABLE 375 MIDDLE EAST AND AFRICA ENERGY & UTILITY IN CONSTRUCTION ROBOT MARKET, BY ROBOTS TYPE, 2021-2030 (USD THOUSAND)
TABLE 376 MIDDLE EAST AND AFRICA CONSTRUCTION ROBOT MARKET, BY PRODUCT TYPE, 2021-2030 (USD THOUSAND)
TABLE 377 MIDDLE EAST AND AFRICA CONSTRUCTION ROBOT MARKET, BY PRODUCT TYPE, 2021-2030 (UNITS)
TABLE 378 U.A.E. CONSTRUCTION ROBOT MARKET, BY ROBOTS TYPE, 2021-2030 (USD THOUSAND)
TABLE 379 U.A.E. CONSTRUCTION ROBOT MARKET, BY PAYLOAD CAPACITY, 2021-2030 (USD THOUSAND)
TABLE 380 U.A.E. CONSTRUCTION ROBOT MARKET, BY AXIS TYPE, 2021-2030 (USD THOUSAND)
TABLE 381 U.A.E. CONSTRUCTION ROBOT MARKET, BY AUTOMATION, 2021-2030 (USD THOUSAND)
TABLE 382 U.A.E. CONSTRUCTION ROBOT MARKET, BY FUNCTION, 2021-2030 (USD THOUSAND)
TABLE 383 U.A.E. STRUCTURAL PROCESSES IN CONSTRUCTION ROBOT MARKET, BY TYPE, 2021-2030 (USD THOUSAND)
TABLE 384 U.A.E. FINISHING PROCESSES IN CONSTRUCTION ROBOT MARKET, BY APPLICATION, 2021-2030 (USD THOUSAND)
TABLE 385 U.A.E. CONSTRUCTION ROBOT MARKET, BY VERTICAL, 2021-2030 (USD THOUSAND)
TABLE 386 U.A.E. COMMERCIAL & RESIDENTIAL INFRASTRUCTURE IN CONSTRUCTION ROBOT MARKET, BY ROBOTS TYPE, 2021-2030 (USD THOUSAND)
TABLE 387 U.A.E. PUBLIC INFRASTRUCTURE IN CONSTRUCTION ROBOT MARKET, BY ROBOTS TYPE, 2021-2030 (USD THOUSAND)
TABLE 388 U.A.E. ENERGY & UTILITY IN CONSTRUCTION ROBOT MARKET, BY ROBOTS TYPE, 2021-2030 (USD THOUSAND)
TABLE 389 U.A.E. CONSTRUCTION ROBOT MARKET, BY PRODUCT TYPE, 2021-2030 (USD THOUSAND)
TABLE 390 SAUDI ARABIA CONSTRUCTION ROBOT MARKET, BY PAYLOAD CAPACITY, 2021-2030 (USD THOUSAND)
TABLE 391 SAUDI ARABIA CONSTRUCTION ROBOT MARKET, BY AXIS TYPE, 2021-2030 (USD THOUSAND)
TABLE 392 SAUDI ARABIA CONSTRUCTION ROBOT MARKET, BY AUTOMATION, 2021-2030 (USD THOUSAND)
TABLE 393 SAUDI ARABIA CONSTRUCTION ROBOT MARKET, BY FUNCTION, 2021-2030 (USD THOUSAND)
TABLE 394 SAUDI ARABIA STRUCTURAL PROCESSES IN CONSTRUCTION ROBOT MARKET, BY TYPE, 2021-2030 (USD THOUSAND)
TABLE 395 SAUDI ARABIA FINISHING PROCESSES IN CONSTRUCTION ROBOT MARKET, BY APPLICATION, 2021-2030 (USD THOUSAND)
TABLE 396 SAUDI ARABIA CONSTRUCTION ROBOT MARKET, BY VERTICAL, 2021-2030 (USD THOUSAND)
TABLE 397 SAUDI ARABIA COMMERCIAL & RESIDENTIAL INFRASTRUCTURE IN CONSTRUCTION ROBOT MARKET, BY ROBOTS TYPE, 2021-2030 (USD THOUSAND)
TABLE 398 SAUDI ARABIA PUBLIC INFRASTRUCTURE IN CONSTRUCTION ROBOT MARKET, BY ROBOTS TYPE, 2021-2030 (USD THOUSAND)
TABLE 399 SAUDI ARABIA ENERGY & UTILITY IN CONSTRUCTION ROBOT MARKET, BY ROBOTS TYPE, 2021-2030 (USD THOUSAND)
TABLE 400 SAUDI ARABIA CONSTRUCTION ROBOT MARKET, BY PRODUCT TYPE, 2021-2030 (USD THOUSAND)
TABLE 401 SOUTH AFRICA CONSTRUCTION ROBOT MARKET, BY ROBOTS TYPE, 2021-2030 (USD THOUSAND)
TABLE 402 SOUTH AFRICA CONSTRUCTION ROBOT MARKET, BY PAYLOAD CAPACITY, 2021-2030 (USD THOUSAND)
TABLE 403 SOUTH AFRICA CONSTRUCTION ROBOT MARKET, BY AXIS TYPE, 2021-2030 (USD THOUSAND)
TABLE 404 SOUTH AFRICA CONSTRUCTION ROBOT MARKET, BY AUTOMATION, 2021-2030 (USD THOUSAND)
TABLE 405 SOUTH AFRICA CONSTRUCTION ROBOT MARKET, BY FUNCTION, 2021-2030 (USD THOUSAND)
TABLE 406 SOUTH AFRICA STRUCTURAL PROCESSES IN CONSTRUCTION ROBOT MARKET, BY TYPE, 2021-2030 (USD THOUSAND)
TABLE 407 SOUTH AFRICA FINISHING PROCESSES IN CONSTRUCTION ROBOT MARKET, BY APPLICATION, 2021-2030 (USD THOUSAND)
TABLE 408 SOUTH AFRICA CONSTRUCTION ROBOT MARKET, BY VERTICAL, 2021-2030 (USD THOUSAND)
TABLE 409 SOUTH AFRICA COMMERCIAL & RESIDENTIAL INFRASTRUCTURE IN CONSTRUCTION ROBOT MARKET, BY ROBOTS TYPE, 2021-2030 (USD THOUSAND)
TABLE 410 SOUTH AFRICA PUBLIC INFRASTRUCTURE IN CONSTRUCTION ROBOT MARKET, BY ROBOTS TYPE, 2021-2030 (USD THOUSAND)
TABLE 411 SOUTH AFRICA ENERGY & UTILITY IN CONSTRUCTION ROBOT MARKET, BY ROBOTS TYPE, 2021-2030 (USD THOUSAND)
TABLE 412 SOUTH AFRICA CONSTRUCTION ROBOT MARKET, BY PRODUCT TYPE, 2021-2030 (USD THOUSAND)
TABLE 413 EGYPT CONSTRUCTION ROBOT MARKET, BY ROBOTS TYPE, 2021-2030 (USD THOUSAND)
TABLE 414 EGYPT CONSTRUCTION ROBOT MARKET, BY PAYLOAD CAPACITY, 2021-2030 (USD THOUSAND)
TABLE 415 EGYPT CONSTRUCTION ROBOT MARKET, BY AXIS TYPE, 2021-2030 (USD THOUSAND)
TABLE 416 EGYPT CONSTRUCTION ROBOT MARKET, BY AUTOMATION, 2021-2030 (USD THOUSAND)
TABLE 417 EGYPT CONSTRUCTION ROBOT MARKET, BY FUNCTION, 2021-2030 (USD THOUSAND)
TABLE 418 EGYPT STRUCTURAL PROCESSES IN CONSTRUCTION ROBOT MARKET, BY TYPE, 2021-2030 (USD THOUSAND)
TABLE 419 EGYPT FINISHING PROCESSES IN CONSTRUCTION ROBOT MARKET, BY APPLICATION, 2021-2030 (USD THOUSAND)
TABLE 420 EGYPT CONSTRUCTION ROBOT MARKET, BY VERTICAL, 2021-2030 (USD THOUSAND)
TABLE 421 EGYPT COMMERCIAL & RESIDENTIAL INFRASTRUCTURE IN CONSTRUCTION ROBOT MARKET, BY ROBOTS TYPE, 2021-2030 (USD THOUSAND)
TABLE 422 EGYPT PUBLIC INFRASTRUCTURE IN CONSTRUCTION ROBOT MARKET, BY ROBOTS TYPE, 2021-2030 (USD THOUSAND)
TABLE 423 EGYPT ENERGY & UTILITY IN CONSTRUCTION ROBOT MARKET, BY ROBOTS TYPE, 2021-2030 (USD THOUSAND)
TABLE 424 EGYPT CONSTRUCTION ROBOT MARKET, BY PRODUCT TYPE, 2021-2030 (USD THOUSAND)
TABLE 425 ISRAEL CONSTRUCTION ROBOT MARKET, BY ROBOTS TYPE, 2021-2030 (USD THOUSAND)
TABLE 426 ISRAEL CONSTRUCTION ROBOT MARKET, BY PAYLOAD CAPACITY, 2021-2030 (USD THOUSAND)
TABLE 427 ISRAEL CONSTRUCTION ROBOT MARKET, BY AXIS TYPE, 2021-2030 (USD THOUSAND)
TABLE 428 ISRAEL CONSTRUCTION ROBOT MARKET, BY AUTOMATION, 2021-2030 (USD THOUSAND)
TABLE 429 ISRAEL CONSTRUCTION ROBOT MARKET, BY FUNCTION, 2021-2030 (USD THOUSAND)
TABLE 430 ISRAEL STRUCTURAL PROCESSES IN CONSTRUCTION ROBOT MARKET, BY TYPE, 2021-2030 (USD THOUSAND)
TABLE 431 ISRAEL FINISHING PROCESSES IN CONSTRUCTION ROBOT MARKET, BY APPLICATION, 2021-2030 (USD THOUSAND)
TABLE 432 ISRAEL CONSTRUCTION ROBOT MARKET, BY VERTICAL, 2021-2030 (USD THOUSAND)
TABLE 433 ISRAEL COMMERCIAL & RESIDENTIAL INFRASTRUCTURE IN CONSTRUCTION ROBOT MARKET, BY ROBOTS TYPE, 2021-2030 (USD THOUSAND)
TABLE 434 ISRAEL PUBLIC INFRASTRUCTURE IN CONSTRUCTION ROBOT MARKET, BY ROBOTS TYPE, 2021-2030 (USD THOUSAND)
TABLE 435 ISRAEL ENERGY & UTILITY IN CONSTRUCTION ROBOT MARKET, BY ROBOTS TYPE, 2021-2030 (USD THOUSAND)
TABLE 436 ISRAEL CONSTRUCTION ROBOT MARKET, BY PRODUCT TYPE, 2021-2030 (USD THOUSAND)
TABLE 437 REST OF MIDDLE EAST AND AFRICA CONSTRUCTION ROBOT MARKET, BY ROBOTS TYPE, 2021-2030 (USD THOUSAND)
TABLE 438 SOUTH AMERICA CONSTRUCTION ROBOT MARKET, BY COUNTRY, 2021-2030 (USD THOUSAND)
TABLE 439 SOUTH AMERICA CONSTRUCTION ROBOT MARKET, BY ROBOTS TYPE, 2021-2030 (USD THOUSAND)
TABLE 440 SOUTH AMERICA CONSTRUCTION ROBOT MARKET, BY PAYLOAD CAPACITY, 2021-2030 (USD THOUSAND)
TABLE 441 SOUTH AMERICA CONSTRUCTION ROBOT MARKET, BY AXIS TYPE, 2021-2030 (USD THOUSAND)
TABLE 442 SOUTH AMERICA CONSTRUCTION ROBOT MARKET, BY AUTOMATION, 2021-2030 (USD THOUSAND)
TABLE 443 SOUTH AMERICA CONSTRUCTION ROBOT MARKET, BY FUNCTION, 2021-2030 (USD THOUSAND)
TABLE 444 SOUTH AMERICA STRUCTURAL PROCESSES IN CONSTRUCTION ROBOT MARKET, BY TYPE, 2021-2030 (USD THOUSAND)
TABLE 445 SOUTH AMERICA FINISHING PROCESSES IN CONSTRUCTION ROBOT MARKET, BY APPLICATION, 2021-2030 (USD THOUSAND)
TABLE 446 SOUTH AMERICA CONSTRUCTION ROBOT MARKET, BY VERTICAL, 2021-2030 (USD THOUSAND)
TABLE 447 SOUTH AMERICA COMMERCIAL & RESIDENTIAL INFRASTRUCTURE IN CONSTRUCTION ROBOT MARKET, BY ROBOTS TYPE, 2021-2030 (USD THOUSAND)
TABLE 448 SOUTH AMERICA PUBLIC INFRASTRUCTURE IN CONSTRUCTION ROBOT MARKET, BY ROBOTS TYPE, 2021-2030 (USD THOUSAND)
TABLE 449 SOUTH AMERICA ENERGY & UTILITY IN CONSTRUCTION ROBOT MARKET, BY ROBOTS TYPE, 2021-2030 (USD THOUSAND)
TABLE 450 SOUTH AMERICA CONSTRUCTION ROBOT MARKET, BY PRODUCT TYPE, 2021-2030 (USD THOUSAND)
TABLE 451 SOUTH AMERICA CONSTRUCTION ROBOT MARKET, BY PRODUCT TYPE, 2021-2030 (UNITS)
TABLE 452 BRAZIL CONSTRUCTION ROBOT MARKET, BY ROBOTS TYPE, 2021-2030 (USD THOUSAND)
TABLE 453 BRAZIL CONSTRUCTION ROBOT MARKET, BY PAYLOAD CAPACITY, 2021-2030 (USD THOUSAND)
TABLE 454 BRAZIL CONSTRUCTION ROBOT MARKET, BY AXIS TYPE, 2021-2030 (USD THOUSAND)
TABLE 455 BRAZIL CONSTRUCTION ROBOT MARKET, BY AUTOMATION, 2021-2030 (USD THOUSAND)
TABLE 456 BRAZIL CONSTRUCTION ROBOT MARKET, BY FUNCTION, 2021-2030 (USD THOUSAND)
TABLE 457 BRAZIL STRUCTURAL PROCESSES IN CONSTRUCTION ROBOT MARKET, BY TYPE, 2021-2030 (USD THOUSAND)
TABLE 458 BRAZIL FINISHING PROCESSES IN CONSTRUCTION ROBOT MARKET, BY APPLICATION, 2021-2030 (USD THOUSAND)
TABLE 459 BRAZIL CONSTRUCTION ROBOT MARKET, BY VERTICAL, 2021-2030 (USD THOUSAND)
TABLE 460 BRAZIL COMMERCIAL & RESIDENTIAL INFRASTRUCTURE IN CONSTRUCTION ROBOT MARKET, BY ROBOTS TYPE, 2021-2030 (USD THOUSAND)
TABLE 461 BRAZIL PUBLIC INFRASTRUCTURE IN CONSTRUCTION ROBOT MARKET, BY ROBOTS TYPE, 2021-2030 (USD THOUSAND)
TABLE 462 BRAZIL ENERGY & UTILITY IN CONSTRUCTION ROBOT MARKET, BY ROBOTS TYPE, 2021-2030 (USD THOUSAND)
TABLE 463 BRAZIL CONSTRUCTION ROBOT MARKET, BY PRODUCT TYPE, 2021-2030 (USD THOUSAND)
TABLE 464 ARGENTINA CONSTRUCTION ROBOT MARKET, BY ROBOTS TYPE, 2021-2030 (USD THOUSAND)
TABLE 465 ARGENTINA CONSTRUCTION ROBOT MARKET, BY PAYLOAD CAPACITY, 2021-2030 (USD THOUSAND)
TABLE 466 ARGENTINA CONSTRUCTION ROBOT MARKET, BY AXIS TYPE, 2021-2030 (USD THOUSAND)
TABLE 467 ARGENTINA CONSTRUCTION ROBOT MARKET, BY AUTOMATION, 2021-2030 (USD THOUSAND)
TABLE 468 ARGENTINA CONSTRUCTION ROBOT MARKET, BY FUNCTION, 2021-2030 (USD THOUSAND)
TABLE 469 ARGENTINA STRUCTURAL PROCESSES IN CONSTRUCTION ROBOT MARKET, BY TYPE, 2021-2030 (USD THOUSAND)
TABLE 470 ARGENTINA FINISHING PROCESSES IN CONSTRUCTION ROBOT MARKET, BY APPLICATION, 2021-2030 (USD THOUSAND)
TABLE 471 ARGENTINA CONSTRUCTION ROBOT MARKET, BY VERTICAL, 2021-2030 (USD THOUSAND)
TABLE 472 ARGENTINA COMMERCIAL & RESIDENTIAL INFRASTRUCTURE IN CONSTRUCTION ROBOT MARKET, BY ROBOTS TYPE, 2021-2030 (USD THOUSAND)
TABLE 473 ARGENTINA PUBLIC INFRASTRUCTURE IN CONSTRUCTION ROBOT MARKET, BY ROBOTS TYPE, 2021-2030 (USD THOUSAND)
TABLE 474 ARGENTINA ENERGY & UTILITY IN CONSTRUCTION ROBOT MARKET, BY ROBOTS TYPE, 2021-2030 (USD THOUSAND)
TABLE 475 ARGENTINA CONSTRUCTION ROBOT MARKET, BY PRODUCT TYPE, 2021-2030 (USD THOUSAND)
TABLE 476 REST OF SOUTH AMERICA CONSTRUCTION ROBOT MARKET, BY ROBOTS TYPE, 2021-2030 (USD THOUSAND)
Lista de figuras
FIGURE 1 GLOBAL CONSTRUCTION ROBOT MARKET: SEGMENTATION
FIGURE 2 GLOBAL CONSTRUCTION ROBOT MARKET: DATA TRIANGULATION
FIGURE 3 GLOBAL CONSTRUCTION ROBOT MARKET: DROC ANALYSIS
FIGURE 4 GLOBAL CONSTRUCTION ROBOT MARKET: GLOBAL VS REGIONAL MARKET ANALYSIS
FIGURE 5 GLOBAL CONSTRUCTION ROBOT MARKET: COMPANY RESEARCH ANALYSIS
FIGURE 6 GLOBAL CONSTRUCTION ROBOT MARKET: INTERVIEW DEMOGRAPHICS
FIGURE 7 GLOBAL CONSTRUCTION ROBOT MARKET: DBMR MARKET POSITION GRID
FIGURE 8 GLOBAL CONSTRUCTION ROBOT MARKET: VENDOR SHARE ANALYSIS
FIGURE 9 GLOBAL CONSTRUCTION ROBOT MARKET: MULTIVARIATE MODELLING
FIGURE 10 GLOBAL CONSTRUCTION ROBOT MARKET: MULTIVARIATE MODELLING
FIGURE 11 GLOBAL CONSTRUCTION ROBOT MARKET: MARKET PLATFORM COVERAGE GRID
FIGURE 12 GLOBAL CONSTRUCTION ROBOT MARKET: SEGMENTATION
FIGURE 13 NORTH AMERICA IS EXPECTED TO DOMINATE AND ASIA-PACIFIC IS FASTEST-GROWING REGION IN THE GLOBAL CONSTRUCTION ROBOT MARKET IN THE FORECAST PERIOD OF 2023 TO 2030
FIGURE 14 ASIA-PACIFIC IS THE FASTEST GROWING MARKET FOR GLOBAL CONSTRUCTION ROBOT MARKET MANUFACTURERS IN THE FORECAST PERIOD OF 2023 TO 2030
FIGURE 15 INCREASE IN SUSTAINABLE BUILDING PRACTICES IS EXPECTED TO BE KEY DRIVER FOR THE GLOBAL CONSTRUCTION ROBOT MARKET IN THE FORECAST PERIOD OF 2023 TO 2030
FIGURE 16 ARTICULATED ROBOT IS EXPECTED TO ACCOUNT FOR THE LARGEST SHARE OF GLOBAL CONSTRUCTION ROBOT MARKET IN 2023 TO 2030
FIGURE 17 DRIVERS, RESTRAINTS, OPPORTUNITIES, AND CHALLENGES OF THE GLOBAL CONSTRUCTION ROBOT MARKET
FIGURE 18 GLOBAL CONSTRUCTION ROBOT MARKET: BY ROBOTS TYPE, 2022
FIGURE 19 GLOBAL CONSTRUCTION ROBOT MARKET: BY PAYLOAD CAPACITY, 2022
FIGURE 20 GLOBAL CONSTRUCTION ROBOT MARKET: BY AXIS TYPE, 2022
FIGURE 21 GLOBAL CONSTRUCTION ROBOT MARKET: BY AUTOMATION, 2022
FIGURE 22 GLOBAL CONSTRUCTION ROBOT MARKET: BY FUNCTION, 2022
FIGURE 23 GLOBAL CONSTRUCTION ROBOT MARKET: BY VERTICAL, 2022
FIGURE 24 GLOBAL CONSTRUCTION ROBOT MARKET: BY PRODUCT TYPE, 2022
FIGURE 25 GLOBAL CONSTRUCTION ROBOT MARKET: SNAPSHOT (2022)
FIGURE 26 GLOBAL CONSTRUCTION ROBOT MARKET: BY REGION (2022)
FIGURE 27 GLOBAL CONSTRUCTION ROBOT MARKET: BY REGION (2023 & 2030)
FIGURE 28 GLOBAL CONSTRUCTION ROBOT MARKET: BY REGION (2022 & 2030)
FIGURE 29 GLOBAL CONSTRUCTION ROBOT MARKET: BY ROBOTS TYPE (2023-2030)
FIGURE 30 NORTH AMERICA CONSTRUCTION ROBOT MARKET: SNAPSHOT (2022)
FIGURE 31 NORTH AMERICA CONSTRUCTION ROBOT MARKET: BY COUNTRY (2022)
FIGURE 32 NORTH AMERICA CONSTRUCTION ROBOT MARKET: BY COUNTRY (2023 & 2030)
FIGURE 33 NORTH AMERICA CONSTRUCTION ROBOT MARKET: BY COUNTRY (2022 & 2030)
FIGURE 34 NORTH AMERICA CONSTRUCTION ROBOT MARKET: BY ROBOTS TYPE (2023-2030)
FIGURE 35 ASIA-PACIFIC CONSTRUCTION ROBOT MARKET: SNAPSHOT (2022)
FIGURE 36 ASIA-PACIFIC CONSTRUCTION ROBOT MARKET: BY COUNTRY (2022)
FIGURE 37 ASIA-PACIFIC CONSTRUCTION ROBOT MARKET: BY COUNTRY (2023 & 2030)
FIGURE 38 ASIA-PACIFIC CONSTRUCTION ROBOT MARKET: BY COUNTRY (2022 & 2030)
FIGURE 39 ASIA-PACIFIC CONSTRUCTION ROBOT MARKET: BY ROBOTS TYPE (2023-2030)
FIGURE 40 EUROPE CONSTRUCTION ROBOT MARKET: SNAPSHOT (2022)
FIGURE 41 EUROPE CONSTRUCTION ROBOT MARKET: BY COUNTRY (2022)
FIGURE 42 EUROPE CONSTRUCTION ROBOT MARKET: BY COUNTRY (2023 & 2030)
FIGURE 43 EUROPE CONSTRUCTION ROBOT MARKET: BY COUNTRY (2022 & 2030)
FIGURE 44 EUROPE CONSTRUCTION ROBOT MARKET: BY ROBOTS TYPE (2023-2030)
FIGURE 45 MIDDLE EAST AND AFRICA CONSTRUCTION ROBOT MARKET: SNAPSHOT (2022)
FIGURE 46 MIDDLE EAST AND AFRICA CONSTRUCTION ROBOT MARKET: BY COUNTRY (2022)
FIGURE 47 MIDDLE EAST AND AFRICA CONSTRUCTION ROBOT MARKET: BY COUNTRY (2023 & 2030)
FIGURE 48 MIDDLE EAST AND AFRICA CONSTRUCTION ROBOT MARKET: BY COUNTRY (2022 & 2030)
FIGURE 49 MIDDLE EAST AND AFRICA CONSTRUCTION ROBOT MARKET: BY ROBOTS TYPE (2023-2030)
FIGURE 50 SOUTH AMERICA CONSTRUCTION ROBOT MARKET: SNAPSHOT (2022)
FIGURE 51 SOUTH AMERICA CONSTRUCTION ROBOT MARKET: BY COUNTRY (2022)
FIGURE 52 SOUTH AMERICA CONSTRUCTION ROBOT MARKET: BY COUNTRY (2023 & 2030)
FIGURE 53 SOUTH AMERICA CONSTRUCTION ROBOT MARKET: BY COUNTRY (2022 & 2030)
FIGURE 54 SOUTH AMERICA CONSTRUCTION ROBOT MARKET: BY ROBOTS TYPE (2023-2030)
FIGURE 55 GLOBAL CONSTRUCTION ROBOT MARKET: COMPANY SHARE 2022 (%)
FIGURE 56 NORTH AMERICA CONSTRUCTION ROBOT MARKET: COMPANY SHARE 2022 (%)
FIGURE 57 ASIA-PACIFIC CONSTRUCTION ROBOT MARKET: COMPANY SHARE 2022 (%)
FIGURE 58 EUROPE CONSTRUCTION ROBOT MARKET: COMPANY SHARE 2022 (%)
Metodología de investigación
La recopilación de datos y el análisis del año base se realizan utilizando módulos de recopilación de datos con muestras de gran tamaño. La etapa incluye la obtención de información de mercado o datos relacionados a través de varias fuentes y estrategias. Incluye el examen y la planificación de todos los datos adquiridos del pasado con antelación. Asimismo, abarca el examen de las inconsistencias de información observadas en diferentes fuentes de información. Los datos de mercado se analizan y estiman utilizando modelos estadísticos y coherentes de mercado. Además, el análisis de la participación de mercado y el análisis de tendencias clave son los principales factores de éxito en el informe de mercado. Para obtener más información, solicite una llamada de un analista o envíe su consulta.
La metodología de investigación clave utilizada por el equipo de investigación de DBMR es la triangulación de datos, que implica la extracción de datos, el análisis del impacto de las variables de datos en el mercado y la validación primaria (experto en la industria). Los modelos de datos incluyen cuadrícula de posicionamiento de proveedores, análisis de línea de tiempo de mercado, descripción general y guía del mercado, cuadrícula de posicionamiento de la empresa, análisis de patentes, análisis de precios, análisis de participación de mercado de la empresa, estándares de medición, análisis global versus regional y de participación de proveedores. Para obtener más información sobre la metodología de investigación, envíe una consulta para hablar con nuestros expertos de la industria.
Personalización disponible
Data Bridge Market Research es líder en investigación formativa avanzada. Nos enorgullecemos de brindar servicios a nuestros clientes existentes y nuevos con datos y análisis que coinciden y se adaptan a sus objetivos. El informe se puede personalizar para incluir análisis de tendencias de precios de marcas objetivo, comprensión del mercado de países adicionales (solicite la lista de países), datos de resultados de ensayos clínicos, revisión de literatura, análisis de mercado renovado y base de productos. El análisis de mercado de competidores objetivo se puede analizar desde análisis basados en tecnología hasta estrategias de cartera de mercado. Podemos agregar tantos competidores sobre los que necesite datos en el formato y estilo de datos que esté buscando. Nuestro equipo de analistas también puede proporcionarle datos en archivos de Excel sin procesar, tablas dinámicas (libro de datos) o puede ayudarlo a crear presentaciones a partir de los conjuntos de datos disponibles en el informe.

