
Global Cleanroom Particle Counters Market
Tamaño del mercado en miles de millones de dólares
Tasa de crecimiento anual compuesta (CAGR) :
% 
 USD
445.96 Million
USD
652.52 Million
2020
2028
USD
445.96 Million
USD
652.52 Million
2020
2028
| 2021 –2028 | |
| USD 445.96 Million | |
| USD 652.52 Million | |
| % | |
|
Mercado global de contadores de partículas para salas blancas, por tipo (contador de partículas portátil, contador de partículas de mano y contador de partículas remoto), tamaño de partícula (0,1 µm – 0,2 µm, 0,2 µm – 0,3 µm, 0,3 µm – 0,5 µm, 0,5 µm – 5 µm y más de 5 µm), capacidad de caudal (caudal bajo, caudal estándar y caudal alto), instalación (pequeña, grande), usuario final ( industria farmacéutica y biotecnológica , industria de semiconductores y electrónica, industria química y otras), canal de distribución (licitaciones directas y distribuidores externos), país (EE. UU., Canadá, México, Alemania, Francia, Reino Unido, Italia, España, Rusia, Bélgica, Turquía, Suiza, Países Bajos y resto de Europa, Japón, China, Australia, Corea del Sur, India, Singapur, Tailandia, Indonesia, Malasia, Filipinas, resto de Asia-Pacífico, Brasil, Argentina, resto de Sudamérica, Sudáfrica, Arabia Saudita, Emiratos Árabes Unidos, Israel, Egipto, resto de Medio Oriente y África) Tendencias de la industria y pronóstico hasta 2028.
 Análisis y perspectivas del mercado: mercado global de contadores de partículas para salas blancas
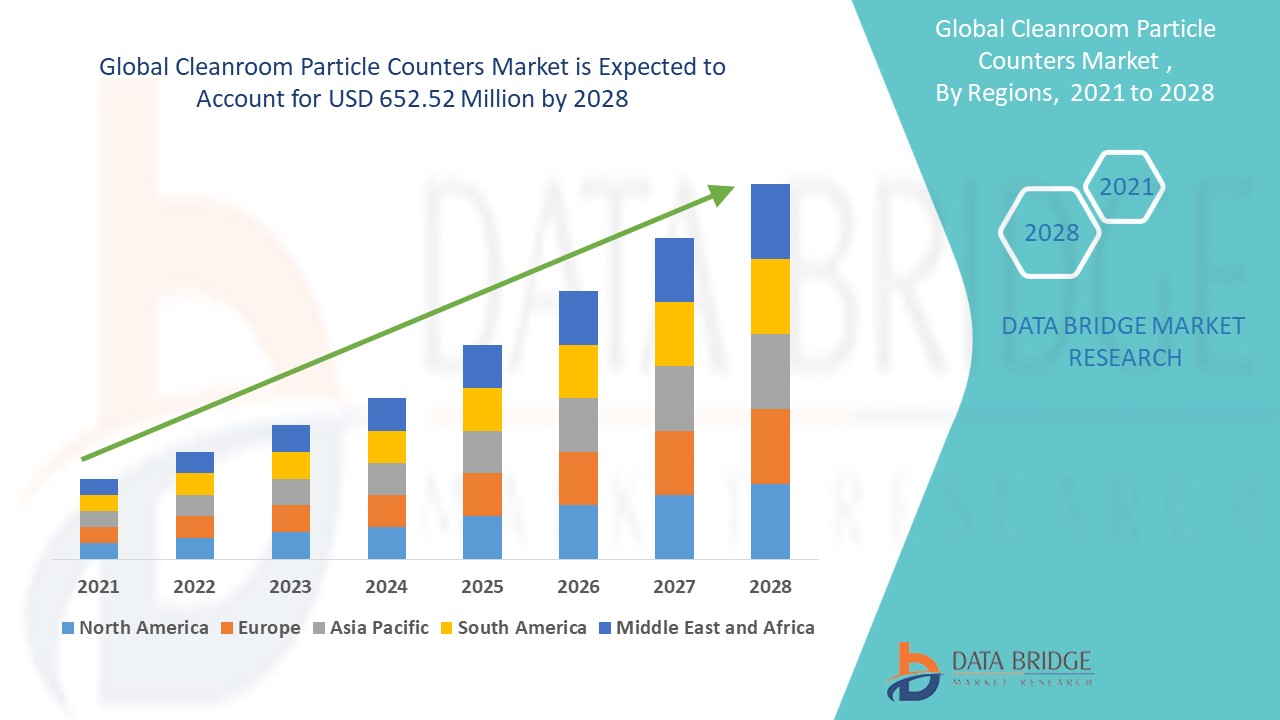
Se espera que el mercado mundial de contadores de partículas para salas blancas gane crecimiento de mercado en el período de pronóstico de 2021 a 2028. Data Bridge Market Research analiza que el mercado está creciendo con una CAGR del 5,1% en el período de pronóstico de 2021 a 2028 y se espera que alcance los USD 652,52 millones para 2028 desde USD 445,96 millones en 2020. Se espera que el aumento de las enfermedades de la piel y el mayor uso de contadores de partículas portátiles impulsen el crecimiento del mercado.
Un contador de partículas para salas blancas es un instrumento que detecta, mide y cuenta las partículas una a una. Los contadores de partículas para salas blancas varían ampliamente en función del umbral de partículas, el costo y las características. La función importante del contador de partículas para salas blancas es determinar y medir la calidad del aire mediante la enumeración y el tamaño de las partículas en el aire. Dado que las salas blancas tienen límites de recuento de partículas definidos, se utilizan para probar y clasificar las salas blancas para garantizar que cumplan con la norma estándar. La primera prioridad a considerar al seleccionar un contador de partículas para salas blancas es observar el tamaño de las partículas que necesitamos monitorear. La Organización Internacional de Normalización (ISO) y las Buenas Prácticas de Fabricación (GMP).
Existen tres tipos de contadores de partículas para salas blancas: portátiles, de mano y remotos. Los contadores de partículas portátiles para salas blancas son fáciles de usar y se pueden llevar de un lugar a otro. Los contadores de partículas de mano para salas blancas están diseñados para operarse mientras se sostienen en la mano. Los contadores de partículas remotos se utilizan para monitorear continuamente los niveles de partículas en el aire en tiempo real. Estos tres tipos de contadores de partículas para salas blancas están diseñados para una fácil integración en el procedimiento operativo estándar (SOP) para el monitoreo de limpieza para llenado aséptico, monitoreo ambiental de rutina y salas blancas.
Los factores impulsores responsables del crecimiento del mercado de contadores de partículas para salas blancas en Oriente Medio y África son la prevalencia de enfermedades de la piel y la creciente concienciación sobre la necesidad de controlar la contaminación del aire en las salas blancas. Sin embargo, los factores que se espera que limiten el mercado son el aumento del coste de los contadores de partículas para salas blancas y los problemas técnicos a los que se enfrenta el uso de los contadores de partículas para salas blancas. Además, el potencial de crecimiento de los contadores de partículas para salas blancas en las economías emergentes refuerza el crecimiento del mercado de contadores de partículas para salas blancas. Sin embargo, el aumento del coste, las estrictas regulaciones impuestas y la inaccesibilidad de los contadores de partículas para salas blancas a los países en desarrollo son las restricciones que pueden obstaculizar el crecimiento del mercado. El aumento del coste de los productos para el desbridamiento de heridas, las inconsistencias en el material utilizado y las leyes regulatorias impuestas son las restricciones que pueden obstaculizar el crecimiento del mercado.
El informe de mercado global de contadores de partículas para salas blancas proporciona detalles de la participación de mercado, nuevos desarrollos y análisis de la cartera de productos, el impacto de los actores del mercado nacional y localizado, analiza las oportunidades en términos de bolsillos de ingresos emergentes, cambios en las regulaciones del mercado, aprobaciones de productos, decisiones estratégicas, lanzamientos de productos, expansiones geográficas e innovaciones tecnológicas en el mercado. Para comprender el análisis y el escenario del mercado, contáctenos para obtener un resumen de analistas; nuestro equipo lo ayudará a crear una solución de impacto en los ingresos para lograr su objetivo deseado.
 Alcance y tamaño del mercado mundial de contadores de partículas para salas blancas
El mercado mundial de contadores de partículas para salas blancas está segmentado en función del tipo, el tamaño de las partículas, la capacidad de caudal, el tipo de instalación, el usuario final y el canal de distribución. El crecimiento entre segmentos le ayuda a analizar nichos de crecimiento y estrategias para abordar el mercado y determinar sus áreas de aplicación principales y la diferencia en sus mercados objetivo.
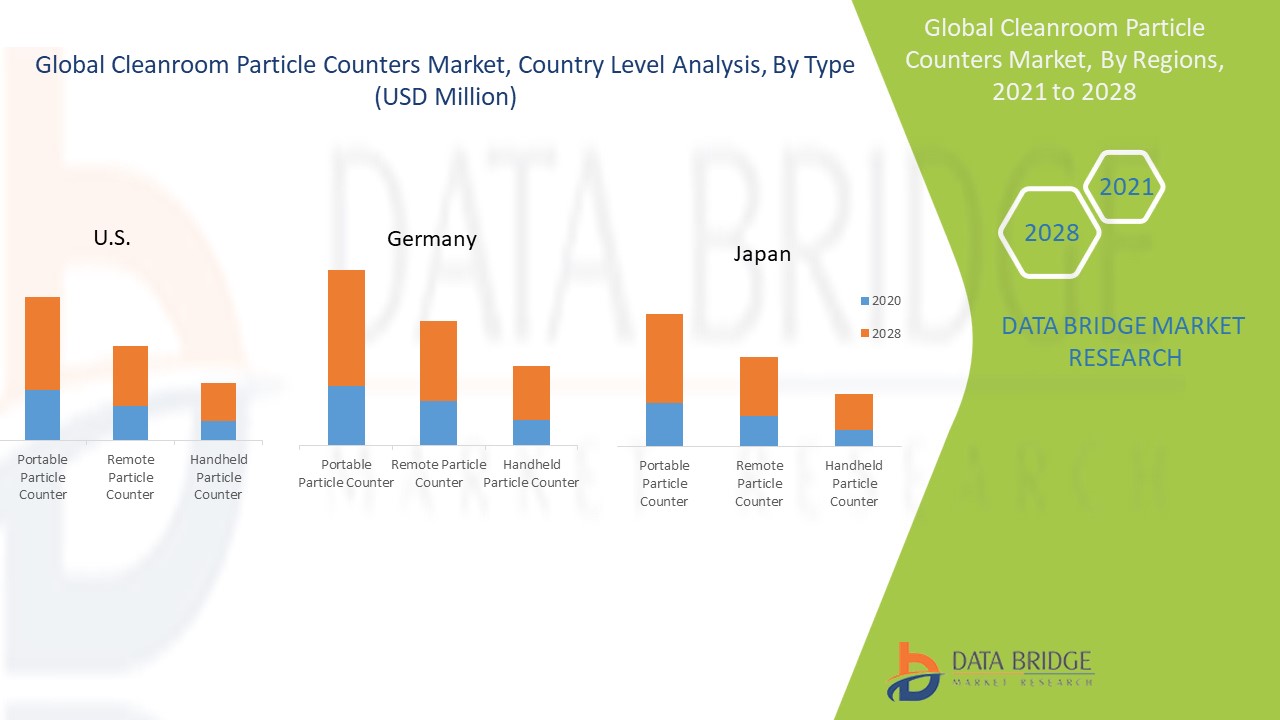
- Según el tipo, el mercado mundial de contadores de partículas para salas blancas se segmenta en contadores de partículas portátiles, contadores de partículas de mano y contadores de partículas remotos. En 2021, se espera que el segmento portátil domine el mercado mundial de contadores de partículas para salas blancas debido al amplio uso del contador de partículas portátil en laboratorios de investigación y empresas de biotecnología en los EE. UU.
- En función del tamaño de las partículas, el mercado mundial de contadores de partículas para salas blancas se segmenta en 0,1 µm – 0,2 µm, 0,2 µm – 0,3 µm, 0,3 µm – 0,5 µm, 0,5 µm – 5 µm y más de 5 µm. En 2021, se espera que el segmento de 0,3 µm – 0,5 µm domine el mercado mundial de contadores de partículas para salas blancas debido a la penetración máxima de partículas de 0,3 µm – 0,5 µm.
- En función de la capacidad de caudal, el mercado mundial de contadores de partículas para salas blancas se segmenta en caudal bajo, caudal estándar y caudal alto. En 2021, se espera que el segmento de caudal estándar domine el mercado mundial de contadores de partículas para salas blancas debido a la presencia de una amplia gama de productos.
- Según el tipo de instalación, el mercado mundial de contadores de partículas para salas blancas se segmenta en pequeños y grandes. En 2021, se espera que el segmento pequeño domine el mercado mundial de contadores de partículas para salas blancas debido a la presencia de pequeños experimentos de investigación realizados en las pequeñas instalaciones de salas blancas.
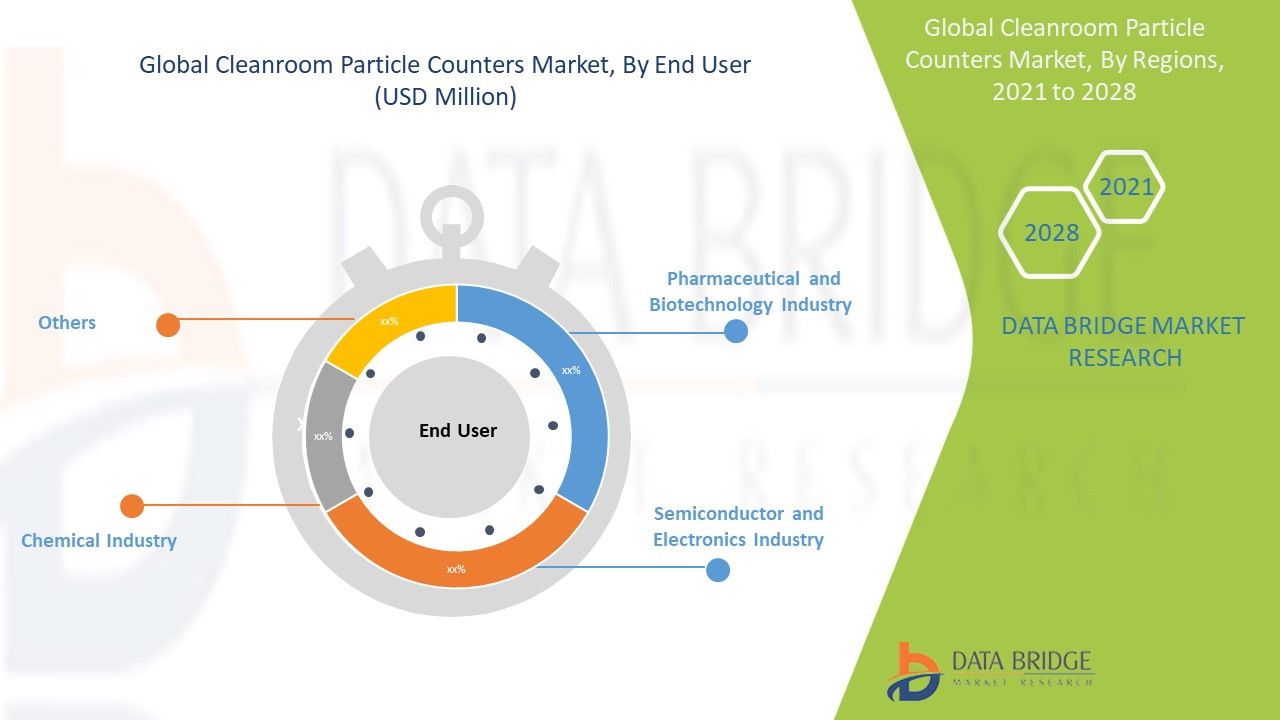
- En función del usuario final, el mercado mundial de contadores de partículas para salas blancas se segmenta en la industria farmacéutica y biotecnológica, la industria de semiconductores y electrónica, la industria química y otras. En 2021, se espera que el segmento de la industria farmacéutica y biotecnológica domine el mercado mundial de contadores de partículas para salas blancas, debido al crecimiento de la industria farmacéutica y se prevé que el uso de contadores de partículas portátiles para medir la cantidad de aire en los laboratorios farmacéuticos domine el mercado.
- Sobre la base del canal de distribución, el mercado global de contadores de partículas para salas blancas se segmenta en licitaciones directas y distribuidores externos. En 2021, se espera que el segmento de licitaciones directas domine el mercado global de contadores de partículas para salas blancas debido al pago garantizado en el sector público y al aumento de los contratos públicos y privados para contadores de partículas para salas blancas en América del Norte.
 Análisis a nivel de país del mercado mundial de contadores de partículas para salas blancas
El mercado global de contadores de partículas para salas blancas está segmentado según el tipo, el tamaño de las partículas, la capacidad de caudal, el tipo de instalación, el usuario final y el canal de distribución.
Los países cubiertos en el informe de mercado de contadores de partículas para salas blancas son EE. UU., Canadá, México, Alemania, Francia, Reino Unido, Italia, España, Rusia, Polonia, Turquía, Suiza, Países Bajos, Hungría, Austria, Noruega, Irlanda, Lituania, resto de Europa en Europa, China, Japón, India, Australia, Corea del Sur, Singapur, Tailandia, Malasia, Indonesia, Filipinas, Vietnam, resto de Asia-Pacífico (APAC) en Asia-Pacífico (APAC) Brasil, Argentina, Perú, resto de Sudamérica en Sudamérica, Sudáfrica, Arabia Saudita, Emiratos Árabes Unidos, Israel, Egipto, Kuwait y resto de Medio Oriente y África en Medio Oriente y África (MEA).
Estados Unidos domina el mercado mundial de contadores de partículas para salas blancas debido a la presencia de dispositivos de desbridamiento de heridas aprobados por la FDA, la presencia de políticas de remuneración de la salud, el aumento de las heridas crónicas y el aumento de la población de edad avanzada. Mientras que Alemania domina los contadores de partículas para salas blancas globales en la región de Europa debido a la presencia de oportunidades sin explotar en Alemania para contadores de partículas para salas blancas y al aumento de casos de prevalencia de úlceras del pie diabético en Alemania. Malasia domina los contadores de partículas para salas blancas globales debido a una mayor conciencia sobre el tratamiento para el cuidado de heridas y un escenario de reembolso favorable en Malasia.
La sección de países del informe también proporciona factores de impacto de mercado individuales y cambios en la regulación en el mercado a nivel nacional que afectan las tendencias actuales y futuras del mercado. Los puntos de datos como nuevas ventas, ventas de reemplazo, demografía del país, leyes regulatorias y aranceles de importación y exportación son algunos de los principales indicadores utilizados para pronosticar el escenario del mercado para países individuales. Además, la presencia y disponibilidad de marcas globales y sus desafíos enfrentados debido a la competencia grande o escasa de las marcas locales y nacionales, el impacto de los canales de venta se consideran al proporcionar un análisis de pronóstico de los datos del país.
Potencial de crecimiento de los contadores de partículas en salas blancas en economías emergentes e iniciativas estratégicas de los actores del mercado
El mercado de contadores de partículas para salas blancas también le proporciona un análisis detallado del mercado para el crecimiento de cada país en una industria en particular con ventas de dispositivos de desbridamiento de heridas, impacto del avance en los contadores de partículas para salas blancas y cambios en los escenarios regulatorios con su apoyo al mercado de contadores de partículas para salas blancas. Los datos están disponibles para el período histórico de 2019 a 2020.
Análisis del panorama competitivo y de la cuota de mercado global de los contadores de partículas para salas blancas
El panorama competitivo del mercado global de contadores de partículas para salas blancas proporciona detalles por competidor. Los detalles incluidos son una descripción general de la empresa, las finanzas de la empresa, los ingresos generados, el potencial de mercado, la inversión en investigación y desarrollo, las nuevas iniciativas de mercado, los sitios e instalaciones de producción, las fortalezas y debilidades de la empresa, el lanzamiento de productos, los procesos de prueba de productos, las aprobaciones de productos, las patentes, la amplitud y amplitud de los productos, el dominio de las aplicaciones y la curva de vida de la tecnología. Los puntos de datos anteriores proporcionados solo están relacionados con el enfoque de la empresa relacionado con el mercado de contadores de partículas para salas blancas.
Las principales empresas que abastecen el mercado global de contadores de partículas para salas blancas son TSI, IQAir, Particle Measuring Systems, Beckman Coulter, Inc, RION, Co. Ltd, Lighthouse Worldwide Solutions, Kanomax USA, Inc, FLUKE, GRIMM Aerosol Technik Ainring GmbH & Co. KG, PCE Instruments, Climet Instruments Company, TOPAS, Zhejiang FUXIA Medical Technology Co.,Ltd. Entre otros se encuentran: Particles Plus, Inc., Suzhou Sujing Automation Instrument Equipment Co., Ltd, Honri Airclean Technology Co. Ltd, Setra Systems, PAMAS PARTIKELMESS- UND ANALYSESYSTEME GMBH, Merck KGaA, Met One Instruments Inc., Sentry Air Systems, Inc, Cubic Sensor and Instrument Co., Ltd., TROTEC, DylosCorporation.com, Temtop Inc, Markus Klotz GmbH, HIYI, GRAYWOLF SENSING SOLUTIONS, LLC, TERA Sensor, HYDAC, Veltek Associates, Inc.
Las iniciativas estratégicas de los actores del mercado junto con los nuevos avances tecnológicos para los contadores de partículas para salas limpias están cerrando la brecha en el mercado de contadores de partículas para salas limpias.
Por ejemplo,
- En febrero de 2021, Beckman Coulter Inc. recibió un premio por el contador de partículas en el aire MET ONE 3400+. El premio se recibió porque el producto había aportado valor e innovación potenciales a la industria farmacéutica y de la salud. El premio recibido daría como resultado el reconocimiento mundial de la empresa y un aumento de los ingresos y las ventas netas.
La colaboración, las empresas conjuntas y otras estrategias de los actores del mercado están mejorando el mercado de la empresa en el mercado global de contadores de partículas para salas limpias, lo que también proporciona el beneficio para que la organización mejore su oferta para el mercado de contadores de partículas para salas limpias.
SKU-
Obtenga acceso en línea al informe sobre la primera nube de inteligencia de mercado del mundo

- Panel de análisis de datos interactivo
- Panel de análisis de empresas para oportunidades con alto potencial de crecimiento
- Acceso de analista de investigación para personalización y consultas
- Análisis de la competencia con panel interactivo
- Últimas noticias, actualizaciones y análisis de tendencias
- Aproveche el poder del análisis de referencia para un seguimiento integral de la competencia
Tabla de contenido
1 INTRODUCTION
1.1 OBJECTIVES OF THE STUDY
1.2 MARKET DEFINITION
1.3 OVERVIEW OF THE GLOBAL CLEANROOM PARTICLE COUNTERS MARKET
1.4 CURRENCY AND PRICING
1.5 LIMITATIONS
1.6 MARKETS COVERED
2 GLOBAL CLEANROOM PARTICLE COUNTERS MARKET: SEGMENTATION
2.1 MARKETS COVERED
2.2 GEOGRAPHICAL SCOPE
2.3 YEARS CONSIDERED FOR THE STUDY
2.4 DBMR TRIPOD DATA VALIDATION MODEL
2.5 PRIMARY INTERVIEWS WITH KEY OPINION LEADERS
2.6 MULTIVARIATE MODELLING
2.7 TYPE SEGMENT LIFELINE CURVE
2.8 DBMR MARKET POSITION GRID
2.9 VENDOR SHARE ANALYSIS
2.1 MARKET END USER COVERAGE GRID
2.11 SECONDARY SOURCES
2.12 ASSUMPTIONS
3 EXECUTIVE SUMMARY
4 PREMIUM INSIGHTS
5 GLOBAL CLEANROOM PARTICLE COUNTERS MARKET: REGULATIONS
6 MARKET OVERVIEW
6.1 DRIVERS
6.1.1 RISE IN PREVALENCE OF SKIN DISEASES
6.1.2 RISE IN RESEARCH AND DEVELOPMENT ACTIVITIES
6.1.3 THE INCREASED USE OF PORTABLE CLEANROOM PARTICLE COUNTER
6.1.4 THE RISE IN THE GOVERNMENT INITIATIVES
6.1.5 RISE IN AWARENESS FOR MONITORING THE COMTAMINATION IN THE CLEANROOM
6.2 RESTRAINTS
6.2.1 INCREASE IN COST OF THE CLEANROOM PARTICLE COUNTER
6.2.2 LESS SENSITIVITY OF THE DEVICES
6.2.3 TECHNICAL HINDRANCE FACED IN THE PARTICLE COUNTERS
6.2.4 THE RISE IN PRODUCT RECALL
6.3 OPPORTUNITIES
6.3.1 THE GROWTH OF THE PHARMACEUTICAL AND BIOTECHNOLOGY INDUSTRY
6.3.2 STRATEGIC INITIATIVES BY MARKET PLAYERS
6.3.3 RISE IN HEALTHCARE EXPENDITURE
6.4 CHALLENGES
6.4.1 LACK OF SKILLED EXPERTISE
6.4.2 LATE APPROVAL ASSOCIATED WITH PRODUCT LAUNCHES
7 IMPACT OF COVID-19 ON GLOBAL CLEANROOM PARTICLE COUNTERS MARKET
7.1 IMPACT ON PRICE
7.2 IMPACT ON DEMAND
7.3 IMPACT ON SUPPLY CHAIN
7.4 STRATEGIC DECISIONS BY MANUFACTURERS
7.5 CONCLUSION
8 GLOBAL CLEANROOM PARTICLE COUNTERS MARKET, BY TYPE
8.1 OVERVIEW
8.2 PORTABLE PARTICLE COUNTER
8.2.1 STANDARD FLOW
8.2.2 LOW FLOW
8.2.3 HIGH FLOW
8.3 HANDHELD PARTICLE COUNTER
8.3.1 LOW FLOW
8.3.2 STANDARD FLOW
8.4 REMOTE PARTICLE COUNTER
8.4.1 STANDARD FLOW
8.4.2 LOW FLOW
8.4.3 HIGH FLOW
9 GLOBAL CLEANROOM PARTICLE COUNTERS MARKET, BY PARTICLE SIZE
9.1 OVERVIEW
9.2 0.3-0.5 µM
9.3 0.5 µM - 5 µM
9.4 MORE THAN 5 µM
9.5 0.2-0.3 µM
9.6 0.1-0.2 µM
10 GLOBAL CLEANROOM PARTICLE COUNTERS MARKET, BY FLOW RATE
10.1 OVERVIEW
10.2 STANDARD FLOW
10.3 LOW FLOW
10.4 HIIGH FLOW
11 GLOBAL CLEANROOM PARTICLE COUNTERS MARKET, BY FACILITY TYPE
11.1 OVERVIEW
11.2 SMALL
11.3 LARGE
12 GLOBAL CLEANROOM PARTICLE COUNTERS MARKET, BY END USER
12.1 OVERVIEW
12.2 PHARMACEUTICAL AND BIOTECHNOLOGY INDUSTRY
12.3 SEMICONDUCTOR AND ELLECTRONICS INDUSTRY
12.4 CHEMICAL INDUSTRY
12.5 OTHERS
13 GLOBAL CLEANROOM PARTICLE COUNTERS MARKET, BY DISTRIBUTION CHANNEL
13.1 OVERVIEW
13.2 DIRECT TENDER
13.3 THIRD PARTY DISTRIBUTORS
14 GLOBAL CLEANROOM PARTICLE COUNTERS MARKET, BY REGION
KEY FINDINGS 110
14.1 OVERVIEW
14.2 NORTH AMERICA
14.2.1 U.S.
14.2.2 CANADA
14.2.3 MEXICO
14.3 EUROPE
14.3.1 GERMANY
14.3.2 FRANCE
14.3.3 U.K.
14.3.4 ITALY
14.3.5 SPAIN
14.3.6 RUSSIA
14.3.7 SWITZERLAND
14.3.8 TURKEY
14.3.9 IRELAND
14.3.10 BELGIUM
14.3.11 NETHERLANDS
14.3.12 REST OF EUROPE
14.4 ASIA-PACIFIC
14.4.1 CHINA
14.4.2 JAPAN
14.4.3 SOUTH KOREA
14.4.4 INDIA
14.4.5 AUSTRALIA
14.4.6 SINGAPORE
14.4.7 THAILAND
14.4.8 MALAYSIA
14.4.9 INDONESIA
14.4.10 PHILIPPINES
14.4.11 REST OF ASIA-PACIFIC
14.5 MIDDLE EAST AND AFRICA
14.5.1 SOUTH AFRICA
14.5.2 SAUDI ARABIA
14.5.3 U.A.E
14.5.4 EGYPT
14.5.5 ISRAEL
14.5.6 REST OF MIDDLE EAST AND AFRICA
14.6 SOUTH AMERICA
14.6.1 BRAZIL
14.6.2 ARGENTINA
14.6.3 REST OF SOUTH AMERICA
15 GLOBAL CLEANROOM PARTICLE COUNTER MARKET: COMPANY LANDSCAPE
15.1 COMPANY SHARE ANALYSIS: GLOBAL
15.2 COMPANY SHARE ANALYSIS: NORTH AMERICA
15.3 COMPANY SHARE ANALYSIS: EUROPE
15.4 COMPANY SHARE ANALYSIS: ASIA-PACIFIC
16 SWOT ANALYSIS
17 COMPANY PROFILE
17.1 BECKMAN COULTER (A SUBSIDIARY OF DANANER CORPORATION)
17.1.1 COMPANY SNAPSHOT
17.1.2 REVENUE ANALYSIS
17.1.3 COMPANY SHARE ANALYSIS
17.1.4 PRODUCT MAPPING
17.1.5 RECENT DEVELOPMENTS
17.2 SETRA SYSTEMS (A SUBSIDARY OF FORTIVE)
17.2.1 COMPANY SNAPSHOT
17.2.2 REVENUE ANALYSIS
17.2.3 COMPANY SHARE ANALYSIS
17.2.4 PRODUCT PORTFOLIO
17.2.5 RECENT DEVELOPMENTS
17.3 TSI
17.3.1 COMPANY SNAPSHOT
17.3.2 COMPANY SHARE ANALYSIS
17.3.3 PRODUCT PORTFOLIO
17.3.4 RECENT DEVELOPMENTS
17.4 RION, CO, LTD
17.4.1 COMPANY SNAPSHOT
17.4.2 REVENUE ANALYSIS
17.4.3 COMPANY SHARE ANALYSIS
17.4.4 PRODUCT PORTFOLIO
17.4.5 RECENT DEVELOPMENTS
17.5 PARTICLE MEASURING SYSTEMS (A SUBSIDIARY OF SPECTRIS)
17.5.1 COMPANY SNAPSHOT
17.5.2 REVENUE ANALYSIS
17.5.3 COMPANY SHARE ANALYSIS
17.5.4 PRODUCT PORTFOLIO
17.6 LIGHTHOUSE WORLDWIDE SOLUTIONS
17.6.1 COMPANY SNAPSHOT
17.6.2 PRODUCT PORTFOLIO
17.6.3 RECENT DEVELOPMENTS
17.7 MERCK KGAA
17.7.1 COMPANY SNAPSHOT
17.7.2 REVENUE ANALYSIS
17.7.3 PRODUCT PORTFOLIO
17.7.4 RECENT DEVELOPMENTS
17.8 CUBIC SENSOR AND INSTRUMENT CO, LTD
17.8.1 COMPANY SNAPSHOT
17.8.2 PRODUCT PORTFOLIO
17.8.3 RECENT DEVELOPMENTS
17.9 CLIMET INSTRUMENTS COMPANY, A DIVISION OF VENTUREDYNE LTD
17.9.1 COMPANY SNAPSHOT
17.9.2 PRODUCT PORTFOLIO
17.9.3 RECENT DEVELOPMENTS
17.1 DYLOSCORPORATION.COM
17.10.1 COMPANY SNAPSHOT
17.10.2 PRODUCT PORTFOLIO
17.11 FLUKE CORPORATION
17.11.1 COMPANY SNAPSHOT
17.11.2 PRODUCT PORTFOLIO
17.12 GRAYWOLF SENSING SOLUTIONS
17.12.1 COMPANY SNAPSHOT
17.12.2 PRODUCT PORTFOLIO
17.12.3 RECENT DEVELOPMENTS
17.13 GRIMM AEROSOL TECHNIK AINRING GMBH & CO. KG
17.13.1 COMPANY SNAPSHOT
17.13.2 PRODUCT PORTFOLIO
17.13.3 RECENT DEVELOPMENTS
17.14 HONRI AIRCLEAN TECHNOLOGY, CO. LTD
17.14.1 COMPANY SNAPSHOT
17.14.2 PRODUCT PORTFOLIO
17.14.3 RECENT DEVELOPMENTS
17.15 HYDAC
17.15.1 COMPANY SNAPSHOT
17.15.2 PRODUCT PORTFOLIO
17.16 HIYI
17.16.1 COMPANY SNAPSHOT
17.16.2 PRODUCT PORTFOLIO
17.16.3 RECENT DEVELOPMENTS
17.17 IQAIR
17.17.1 COMPANY SNAPSHOT
17.17.2 PRODUCT PORTFOLIO
17.18 KANOMAX, U.S.A, INC
17.18.1 COMPANY SNAPSHOT
17.18.2 PRODUCT PORTFOLIO
17.18.3 RECENT DEVELOPMENTS
17.19 MARKUS KLOTZ GMBH .
17.19.1 COMPANY SNAPSHOT
17.19.2 PRODUCT PORTFOLIO
17.2 MET ONE INSTRUMENTS INC
17.20.1 COMPANY SNAPSHOT
17.20.2 PRODUCT PORTFOLIO
17.20.3 RECENT DEVELOPMENTS
17.21 PCE DEUTSCHLAND GMBH
17.21.1 COMPANY SNAPSHOT
17.21.2 PRODUCT PORTFOLIO
17.22 PAMAS PARTIKELMESS- UND ANALYSESYSTEME GMBH
17.22.1 COMPANY SNAPSHOT
17.22.2 PRODUCT PORTFOLIO
17.23 PARTICLE PLUS INC
17.23.1 COMPANY SNAPSHOT
17.23.2 PRODUCT PORTFOLIO
17.23.3 RECENT DEVELOPMENTS
17.24 SUZHOU SUJING AUTOMATION INSTRUMENT EQUIPMENT CO., LTD
17.24.1 COMPANY SNAPSHOT
17.24.2 PRODUCT PORTFOLIO
17.24.3 RECENT DEVELOPMENTS
17.25 SENTRY AIR SYSTEMS, INC
17.25.1 COMPANY SNAPSHOT
17.25.2 PRODUCT PORTFOLIO
17.26 TOPAS GMBH
17.26.1 COMPANY SNAPSHOT
17.26.2 PRODUCT PORTFOLIO
17.26.3 RECENT DEVELOPMENTS
17.27 TROTEC GMBH
17.27.1 COMPANY SNAPSHOT
17.27.2 PRODUCT PORTFOLIO
17.27.3 RECENT DEVELOPMENTS
17.28 TERA SENSOR
17.28.1 OMPANY SNAPSHOT
17.28.2 PRODUCT PORTFOLIO
1.28.2 .RECENT DEVELOPMENTS
17.29 TEMPTOP (A SUBSIDIARY OF ELITECH TECHNOLOGY INC)
17.29.1 COMPANY SNAPSHOT
17.29.2 PRODUCT PORTFOLIO
17.29.3 RECENT DEVELOPMENTS
17.3 VELTEK ASSOCIATES, INC
17.30.1 COMPANY SNAPSHOT
17.30.2 PRODUCT PORTFOLIO
17.30.3 RECENT DEVELOPMENTS
17.31 ZHEJIANG FUXIA MEDICAL TECHNOLOGY CO, LTD
17.31.1 COMPANY SNAPSHOT
17.31.2 PRODUCT PORTFOLIO
17.31.3 RECENT DEVELOPMENTS
18 QUESTIONNAIRE
19 RELATED REPORTS
Lista de Tablas
TABLE 1 MAXIMUM PERMITTED NUMBER OF PARTICLES
TABLE 1 GLOBAL CLEANROOM PARTICLE COUNTERS MARKET, BY TYPE, 2019-2028 (USD MILLION)
TABLE 2 GLOBAL PORTABLE PARTICLE COUNTER IN CLEANROOM PARTICLE COUNTERS MARKET, BY REGION, 2019-2028 (USD MILLION)
TABLE 3 GLOBAL PORTABLE PARTICLE COUNTER IN CLEANROOM PARTICLE COUNTERS MARKET, BY TYPE, 2019-2028 (USD MILLION)
TABLE 4 GLOBAL HANDHELD PARTICLE COUNTER IN CLEANROOM PARTICLE COUNTERS MARKET, BY REGION, 2019-2028 (USD MILLION)
TABLE 5 GLOBAL HANDHELD PARTICLE COUNTER IN CLEANROOM PARTICLE COUNTERS MARKET, BY TYPE, 2019-2028 (USD MILLION)
TABLE 6 GLOBAL REMOTE PARTICLE COUNTER IN CLEANROOM PARTICLE COUNTERS MARKET, BY REGION, 2019-2028 (USD MILLION)
TABLE 7 GLOBAL REMOTE PARTICLE COUNTER IN CLEANROOM PARTICLE COUNTERS MARKET, BY TYPE, 2019-2028 (USD MILLION)
TABLE 8 GLOBAL CLEANROOM PARTICLE COUNTERS MARKET, BY PARTICLE SIZE, 2019-2028 (USD MILLION)
TABLE 9 GLOBAL 0.3µM – 0.5 µM IN CLEANROOM PARTICLE COUNTERS MARKET, BY REGION, 2019-2028 (USD MILLION)
TABLE 10 GLOBAL 0.5 µM- 5µM IN CLEANROOM PARTICLE COUNTERS MARKET, BY REGION, 2019-2028 (USD MILLION)
TABLE 11 GLOBAL MORE THAN 5 µM IN CLEANROOM PARTICLE COUNTERS MARKET, BY REGION, 2019-2028 (USD MILLION)
TABLE 12 GLOBAL 0.2µM – 0.3 µM IN CLEANROOM PARTICLE COUNTERS MARKET, BY REGION, 2019-2028 (USD MILLION)
TABLE 13 GLOBAL 0.1µM – 0.2 µM IN CLEANROOM PARTICLE COUNTERS MARKET, BY REGION, 2019-2028 (USD MILLION)
TABLE 14 GLOBAL CLEANROOM PARTICLE COUNTERS MARKET, BY FLOW RATE CAPACITY, 2019-2028 (USD MILLION)
TABLE 15 GLOBAL STANDARD FLOW IN CLEANROOM PARTICLE COUNTERS MARKET, BY REGION, 2019-2028 (USD MILLION)
TABLE 16 GLOBAL LOW FLOW IN CLEANROOM PARTICLE COUNTERS MARKET, BY REGION, 2019-2028 (USD MILLION)
TABLE 17 GLOBAL HIGH FLOW IN CLEANROOM PARTICLE COUNTERS MARKET, BY REGION, 2019-2028 (USD MILLION)
TABLE 18 GLOBAL CLEANROOM PARTICLE COUNTERS MARKET, BY FACILITY TYPE, 2019-2028 (USD MILLION)
TABLE 19 GLOBAL SMALL IN CLEANROOM PARTICLE COUNTERS MARKET, BY REGION, 2019-2028 (USD MILLION)
TABLE 20 GLOBAL LARGE IN CLEANROOM PARTICLE COUNTERS MARKET, BY REGION, 2019-2028 (USD MILLION)
TABLE 21 GLOBAL CLEANROOM PARTICLE COUNTERS MARKET, BY END USER, 2019-2028 (USD MILLION)
TABLE 22 GLOBAL PHARMACEUTICAL AND BIOTECHNOLOGY INDUSTRY IN CLEANROOM PARTICLE COUNTERS MARKET, BY REGION, 2019-2028 (USD MILLION)
TABLE 23 GLOBAL SEMICONDUCTOR AND ELECTRONICS INDUSTRY IN CLEANROOM PARTICLE COUNTERS MARKET, BY REGION, 2019-2028 (USD MILLION)
TABLE 24 GLOBAL CHEMICAL INDUSTRY IN CLEANROOM PARTICLE COUNTERS MARKET, BY REGION, 2019-2028 (USD MILLION)
TABLE 25 GLOBAL OTHERS IN CLEANROOM PARTICLE COUNTERS MARKET, BY REGION, 2019-2028 (USD MILLION)
TABLE 26 GLOBAL CLEANROOM PARTICLE COUNTERS MARKET, BY DISTRIBUTION CHANNEL, 2019-2028 (USD MILLION)
TABLE 27 GLOBAL DIRECT TENDER IN CLEANROOM PARTICLE COUNTERS MARKET, BY REGION, 2019-2028 (USD MILLION)
TABLE 28 GLOBAL THIRD PARTY DISTRIBUTORS IN CLEANROOM PARTICLE COUNTERS MARKET, BY REGION, 2019-2028 (USD MILLION)
TABLE 29 GLOBAL CLEANROOM PARTICLE COUNTERS MARKET, BY REGION, 2019-2028 (USD MILLION)
TABLE 30 NORTH AMERICA CLEANROOM PARTICLE COUNTERS MARKET, BY COUNTRY, 2019-2028 (USD MILLION)
TABLE 31 NORTH AMERICA CLEANROOM PARTICLE COUNTERS MARKET, BY TYPE, 2019-2028 (USD MILLION)
TABLE 32 NORTH AMERICA PORTABLE PARTICLE COUNTER IN CLEANROOM PARTICLE COUNTERS MARKET, BY TYPE, 2019-2028 (USD MILLION)
TABLE 33 NORTH AMERICA HANDHELD PARTICLE COUNTER IN CLEANROOM PARTICLE COUNTERS MARKET, BY TYPE, 2019-2028 (USD MILLION)
TABLE 34 NORTH AMERICA REMOTE PARTICLE COUNTER IN CLEANROOM PARTICLE COUNTERS MARKET, BY TYPE, 2019-2028 (USD MILLION)
TABLE 35 NORTH AMERICA CLEANROOM PARTICLE COUNTERS MARKET, BY PARTICLE SIZE, 2019-2028 (USD MILLION)
TABLE 36 NORTH AMERICA CLEANROOM PARTICLE COUNTERS MARKET, BY FLOW RATE CAPACITY, 2019-2028 (USD MILLION)
TABLE 37 NORTH AMERICA CLEANROOM PARTICLE COUNTERS MARKET, BY FACILITY TYPE, 2021-2028 (USD MILLION)
TABLE 38 NORTH AMERICA CLEANROOM PARTICLE COUNTERS MARKET, BY END USER, 2019-2028 (USD MILLION)
TABLE 39 NORTH AMERICA CLEANROOM PARTICLE COUNTERS MARKET, BY DISTRIBUTION CHANNEL, 2019-2028 (USD MILLION)
TABLE 40 U.S. CLEANROOM PARTICLE COUNTERS MARKET, BY TYPE, 2019-2028 (USD MILLION)
TABLE 41 U.S. PORTABLE PARTICLE COUNTER IN CLEANROOM PARTICLE COUNTERS MARKET, BY TYPE, 2019-2028 (USD MILLION)
TABLE 42 U.S. HANDHELD PARTICLE COUNTER IN CLEANROOM PARTICLE COUNTERS MARKET, BY TYPE, 2019-2028 (USD MILLION)
TABLE 43 U.S. REMOTE PARTICLE COUNTER IN CLEANROOM PARTICLE COUNTERS MARKET, BY TYPE, 2019-2028 (USD MILLION)
TABLE 44 U.S. CLEANROOM PARTICLE COUNTERS MARKET, BY PARTICLE SIZE, 2019-2028 (USD MILLION)
TABLE 45 U.S. CLEANROOM PARTICLE COUNTERS MARKET, BY FLOW RATE CAPACITY, 2019-2028 (USD MILLION)
TABLE 46 U.S. CLEANROOM PARTICLE COUNTERS MARKET, BY FACILITY TYPE, 2021-2028 (USD MILLION)
TABLE 47 U.S. CLEANROOM PARTICLE COUNTERS MARKET, BY END USER, 2019-2028 (USD MILLION)
TABLE 48 U.S. CLEANROOM PARTICLE COUNTERS MARKET, BY DISTRIBUTION CHANNEL, 2019-2028 (USD MILLION)
TABLE 49 CANADA CLEANROOM PARTICLE COUNTERS MARKET, BY TYPE, 2019-2028 (USD MILLION)
TABLE 50 CANADA PORTABLE PARTICLE COUNTER IN CLEANROOM PARTICLE COUNTERS MARKET, BY TYPE, 2019-2028 (USD MILLION)
TABLE 51 CANADA HANDHELD PARTICLE COUNTER IN CLEANROOM PARTICLE COUNTERS MARKET, BY TYPE, 2019-2028 (USD MILLION)
TABLE 52 CANADA REMOTE PARTICLE COUNTER IN CLEANROOM PARTICLE COUNTERS MARKET, BY TYPE, 2019-2028 (USD MILLION)
TABLE 53 CANADA CLEANROOM PARTICLE COUNTERS MARKET, BY PARTICLE SIZE, 2019-2028 (USD MILLION)
TABLE 54 CANADA CLEANROOM PARTICLE COUNTERS MARKET, BY FLOW RATE CAPACITY, 2019-2028 (USD MILLION)
TABLE 55 CANADA CLEANROOM PARTICLE COUNTERS MARKET, BY FACILITY TYPE, 2021-2028 (USD MILLION)
TABLE 56 CANADA CLEANROOM PARTICLE COUNTERS MARKET, BY END USER, 2019-2028 (USD MILLION)
TABLE 57 CANADA CLEANROOM PARTICLE COUNTERS MARKET, BY DISTRIBUTION CHANNEL, 2019-2028 (USD MILLION)
TABLE 58 MEXICO CLEANROOM PARTICLE COUNTERS MARKET, BY TYPE, 2019-2028 (USD MILLION)
TABLE 59 MEXICO PORTABLE PARTICLE COUNTER IN CLEANROOM PARTICLE COUNTERS MARKET, BY TYPE, 2019-2028 (USD MILLION)
TABLE 60 MEXICO HANDHELD PARTICLE COUNTER IN CLEANROOM PARTICLE COUNTERS MARKET, BY TYPE, 2019-2028 (USD MILLION)
TABLE 61 MEXICO REMOTE PARTICLE COUNTER IN CLEANROOM PARTICLE COUNTERS MARKET, BY TYPE, 2019-2028 (USD MILLION)
TABLE 62 MEXICO CLEANROOM PARTICLE COUNTERS MARKET, BY PARTICLE SIZE, 2019-2028 (USD MILLION)
TABLE 63 MEXICO CLEANROOM PARTICLE COUNTERS MARKET, BY FLOW RATE CAPACITY, 2019-2028 (USD MILLION)
TABLE 64 MEXICO CLEANROOM PARTICLE COUNTERS MARKET, BY FACILITY TYPE, 2021-2028 (USD MILLION)
TABLE 65 MEXICO CLEANROOM PARTICLE COUNTERS MARKET, BY END USER, 2019-2028 (USD MILLION)
TABLE 66 MEXICO CLEANROOM PARTICLE COUNTERS MARKET, BY DISTRIBUTION CHANNEL, 2019-2028 (USD MILLION)
TABLE 67 EUROPE CLEANROOM PARTICLE COUNTERS MARKET, BY COUNTRY, 2019-2028 (USD MILLION)
TABLE 68 EUROPE CLEANROOM PARTICLE COUNTERS MARKET, BY TYPE, 2019-2028 (USD MILLION)
TABLE 69 EUROPE PORTABLE PARTICLE COUNTER IN CLEANROOM PARTICLE COUNTERS MARKET, BY TYPE, 2019-2028 (USD MILLION)
TABLE 70 EUROPE HANDHELD PARTICLE COUNTER IN CLEANROOM PARTICLE COUNTERS MARKET, BY TYPE, 2019-2028 (USD MILLION)
TABLE 71 EUROPE REMOTE PARTICLE COUNTER IN CLEANROOM PARTICLE COUNTERS MARKET, BY TYPE, 2019-2028 (USD MILLION)
TABLE 72 EUROPE CLEANROOM PARTICLE COUNTERS MARKET, BY PARTICLE SIZE, 2019-2028 (USD MILLION)
TABLE 73 EUROPE CLEANROOM PARTICLE COUNTERS MARKET, BY FLOW RATE CAPACITY, 2019-2028 (USD MILLION)
TABLE 74 EUROPE CLEANROOM PARTICLE COUNTERS MARKET, BY FACILITY TYPE, 2019-2028 (USD MILLION)
TABLE 75 EUROPE CLEANROOM PARTICLE COUNTERS MARKET, BY END USER, 2019-2028 (USD MILLION)
TABLE 76 EUROPE CLEANROOM PARTICLE COUNTERS MARKET, BY DISTRIBUTION CHANNEL, 2019-2028 (USD MILLION)
TABLE 77 GERMANY CLEANROOM PARTICLE COUNTERS MARKET, BY TYPE, 2019-2028 (USD MILLION)
TABLE 78 GERMANY PORTABLE PARTICLE COUNTER IN CLEANROOM PARTICLE COUNTERS MARKET, BY TYPE, 2019-2028 (USD MILLION)
TABLE 79 GERMANY HANDHELD PARTICLE COUNTER IN CLEANROOM PARTICLE COUNTERS MARKET, BY TYPE, 2019-2028 (USD MILLION)
TABLE 80 GERMANY REMOTE PARTICLE COUNTER IN CLEANROOM PARTICLE COUNTERS MARKET, BY TYPE, 2019-2028 (USD MILLION)
TABLE 81 GERMANY CLEANROOM PARTICLE COUNTERS MARKET, BY PARTICLE SIZE, 2019-2028 (USD MILLION)
TABLE 82 GERMANY CLEANROOM PARTICLE COUNTERS MARKET, BY FLOW RATE CAPACITY, 2019-2028 (USD MILLION)
TABLE 83 GERMANY CLEANROOM PARTICLE COUNTERS MARKET, BY FACILITY TYPE, 2019-2028 (USD MILLION)
TABLE 84 GERMANY CLEANROOM PARTICLE COUNTERS MARKET, BY END USER, 2019-2028 (USD MILLION)
TABLE 85 GERMANY CLEANROOM PARTICLE COUNTERS MARKET, BY DISTRIBUTION CHANNEL, 2019-2028 (USD MILLION)
TABLE 86 FRANCE CLEANROOM PARTICLE COUNTERS MARKET, BY TYPE, 2019-2028 (USD MILLION)
TABLE 87 FRANCE PORTABLE PARTICLE COUNTER IN CLEANROOM PARTICLE COUNTERS MARKET, BY TYPE, 2019-2028 (USD MILLION)
TABLE 88 FRANCE HANDHELD PARTICLE COUNTER IN CLEANROOM PARTICLE COUNTERS MARKET, BY TYPE, 2019-2028 (USD MILLION)
TABLE 89 FRANCE REMOTE PARTICLE COUNTER IN CLEANROOM PARTICLE COUNTERS MARKET, BY TYPE, 2019-2028 (USD MILLION)
TABLE 90 FRANCE CLEANROOM PARTICLE COUNTERS MARKET, BY PARTICLE SIZE, 2019-2028 (USD MILLION)
TABLE 91 FRANCE CLEANROOM PARTICLE COUNTERS MARKET, BY FLOW RATE CAPACITY, 2019-2028 (USD MILLION)
TABLE 92 FRANCE CLEANROOM PARTICLE COUNTERS MARKET, BY FACILITY TYPE, 2019-2028 (USD MILLION)
TABLE 93 FRANCE CLEANROOM PARTICLE COUNTERS MARKET, BY END USER, 2019-2028 (USD MILLION)
TABLE 94 FRANCE CLEANROOM PARTICLE COUNTERS MARKET, BY DISTRIBUTION CHANNEL, 2019-2028 (USD MILLION)
TABLE 95 U.K. CLEANROOM PARTICLE COUNTERS MARKET, BY TYPE, 2019-2028 (USD MILLION)
TABLE 96 U.K. PORTABLE PARTICLE COUNTER IN CLEANROOM PARTICLE COUNTERS MARKET, BY TYPE, 2019-2028 (USD MILLION)
TABLE 97 U.K. HANDHELD PARTICLE COUNTER IN CLEANROOM PARTICLE COUNTERS MARKET, BY TYPE, 2019-2028 (USD MILLION)
TABLE 98 U.K. REMOTE PARTICLE COUNTER IN CLEANROOM PARTICLE COUNTERS MARKET, BY TYPE, 2019-2028 (USD MILLION)
TABLE 99 U.K. CLEANROOM PARTICLE COUNTERS MARKET, BY PARTICLE SIZE, 2019-2028 (USD MILLION)
TABLE 100 U.K. CLEANROOM PARTICLE COUNTERS MARKET, BY FLOW RATE CAPACITY, 2019-2028 (USD MILLION)
TABLE 101 U.K. CLEANROOM PARTICLE COUNTERS MARKET, BY FACILITY TYPE, 2019-2028 (USD MILLION)
TABLE 102 U.K. CLEANROOM PARTICLE COUNTERS MARKET, BY END USER, 2019-2028 (USD MILLION)
TABLE 103 U.K. CLEANROOM PARTICLE COUNTERS MARKET, BY DISTRIBUTION CHANNEL, 2019-2028 (USD MILLION)
TABLE 104 ITALY CLEANROOM PARTICLE COUNTERS MARKET, BY TYPE, 2019-2028 (USD MILLION)
TABLE 105 ITALY PORTABLE PARTICLE COUNTER IN CLEANROOM PARTICLE COUNTERS MARKET, BY TYPE, 2019-2028 (USD MILLION)
TABLE 106 ITALY HANDHELD PARTICLE COUNTER IN CLEANROOM PARTICLE COUNTERS MARKET, BY TYPE, 2019-2028 (USD MILLION)
TABLE 107 ITALY REMOTE PARTICLE COUNTER IN CLEANROOM PARTICLE COUNTERS MARKET, BY TYPE, 2019-2028 (USD MILLION)
TABLE 108 ITALY CLEANROOM PARTICLE COUNTERS MARKET, BY PARTICLE SIZE, 2019-2028 (USD MILLION)
TABLE 109 ITALY CLEANROOM PARTICLE COUNTERS MARKET, BY FLOW RATE CAPACITY, 2019-2028 (USD MILLION)
TABLE 110 ITALY CLEANROOM PARTICLE COUNTERS MARKET, BY FACILITY TYPE, 2019-2028 (USD MILLION)
TABLE 111 ITALY CLEANROOM PARTICLE COUNTERS MARKET, BY END USER, 2019-2028 (USD MILLION)
TABLE 112 ITALY CLEANROOM PARTICLE COUNTERS MARKET, BY DISTRIBUTION CHANNEL, 2019-2028 (USD MILLION)
TABLE 113 SPAIN CLEANROOM PARTICLE COUNTERS MARKET, BY TYPE, 2019-2028 (USD MILLION)
TABLE 114 SPAIN PORTABLE PARTICLE COUNTER IN CLEANROOM PARTICLE COUNTERS MARKET, BY TYPE, 2019-2028 (USD MILLION)
TABLE 115 SPAIN HANDHELD PARTICLE COUNTER IN CLEANROOM PARTICLE COUNTERS MARKET, BY TYPE, 2019-2028 (USD MILLION)
TABLE 116 SPAIN REMOTE PARTICLE COUNTER IN CLEANROOM PARTICLE COUNTERS MARKET, BY TYPE, 2019-2028 (USD MILLION)
TABLE 117 SPAIN CLEANROOM PARTICLE COUNTERS MARKET, BY PARTICLE SIZE, 2019-2028 (USD MILLION)
TABLE 118 SPAIN CLEANROOM PARTICLE COUNTERS MARKET, BY FLOW RATE CAPACITY, 2019-2028 (USD MILLION)
TABLE 119 SPAIN CLEANROOM PARTICLE COUNTERS MARKET, BY FACILITY TYPE, 2019-2028 (USD MILLION)
TABLE 120 SPAIN CLEANROOM PARTICLE COUNTERS MARKET, BY END USER, 2019-2028 (USD MILLION)
TABLE 121 SPAIN CLEANROOM PARTICLE COUNTERS MARKET, BY DISTRIBUTION CHANNEL, 2019-2028 (USD MILLION)
TABLE 122 RUSSIA CLEANROOM PARTICLE COUNTERS MARKET, BY TYPE, 2019-2028 (USD MILLION)
TABLE 123 RUSSIA PORTABLE PARTICLE COUNTER IN CLEANROOM PARTICLE COUNTERS MARKET, BY TYPE, 2019-2028 (USD MILLION)
TABLE 124 RUSSIA HANDHELD PARTICLE COUNTER IN CLEANROOM PARTICLE COUNTERS MARKET, BY TYPE, 2019-2028 (USD MILLION)
TABLE 125 RUSSIA REMOTE PARTICLE COUNTER IN CLEANROOM PARTICLE COUNTERS MARKET, BY TYPE, 2019-2028 (USD MILLION)
TABLE 126 RUSSIA CLEANROOM PARTICLE COUNTERS MARKET, BY PARTICLE SIZE, 2019-2028 (USD MILLION)
TABLE 127 RUSSIA CLEANROOM PARTICLE COUNTERS MARKET, BY FLOW RATE CAPACITY, 2019-2028 (USD MILLION)
TABLE 128 RUSSIA CLEANROOM PARTICLE COUNTERS MARKET, BY FACILITY TYPE, 2019-2028 (USD MILLION)
TABLE 129 RUSSIA CLEANROOM PARTICLE COUNTERS MARKET, BY END USER, 2019-2028 (USD MILLION)
TABLE 130 RUSSIA CLEANROOM PARTICLE COUNTERS MARKET, BY DISTRIBUTION CHANNEL, 2019-2028 (USD MILLION)
TABLE 131 SWITZERLAND CLEANROOM PARTICLE COUNTERS MARKET, BY TYPE, 2019-2028 (USD MILLION)
TABLE 132 SWITZERLAND PORTABLE PARTICLE COUNTER IN CLEANROOM PARTICLE COUNTERS MARKET, BY TYPE, 2019-2028 (USD MILLION)
TABLE 133 SWITZERLAND HANDHELD PARTICLE COUNTER IN CLEANROOM PARTICLE COUNTERS MARKET, BY TYPE, 2019-2028 (USD MILLION)
TABLE 134 SWITZERLAND REMOTE PARTICLE COUNTER IN CLEANROOM PARTICLE COUNTERS MARKET, BY TYPE, 2019-2028 (USD MILLION)
TABLE 135 SWITZERLAND CLEANROOM PARTICLE COUNTERS MARKET, BY PARTICLE SIZE, 2019-2028 (USD MILLION)
TABLE 136 SWITZERLAND CLEANROOM PARTICLE COUNTERS MARKET, BY FLOW RATE CAPACITY, 2019-2028 (USD MILLION)
TABLE 137 SWITZERLAND CLEANROOM PARTICLE COUNTERS MARKET, BY FACILITY TYPE, 2019-2028 (USD MILLION)
TABLE 138 SWITZERLAND CLEANROOM PARTICLE COUNTERS MARKET, BY END USER, 2019-2028 (USD MILLION)
TABLE 139 SWITZERLAND CLEANROOM PARTICLE COUNTERS MARKET, BY DISTRIBUTION CHANNEL, 2019-2028 (USD MILLION)
TABLE 140 TURKEY CLEANROOM PARTICLE COUNTERS MARKET, BY TYPE, 2019-2028 (USD MILLION)
TABLE 141 TURKEY PORTABLE PARTICLE COUNTER IN CLEANROOM PARTICLE COUNTERS MARKET, BY TYPE, 2019-2028 (USD MILLION)
TABLE 142 TURKEY HANDHELD PARTICLE COUNTER IN CLEANROOM PARTICLE COUNTERS MARKET, BY TYPE, 2019-2028 (USD MILLION)
TABLE 143 TURKEY REMOTE PARTICLE COUNTER IN CLEANROOM PARTICLE COUNTERS MARKET, BY TYPE, 2019-2028 (USD MILLION)
TABLE 144 TURKEY CLEANROOM PARTICLE COUNTERS MARKET, BY PARTICLE SIZE, 2019-2028 (USD MILLION)
TABLE 145 TURKEY CLEANROOM PARTICLE COUNTERS MARKET, BY FLOW RATE CAPACITY, 2019-2028 (USD MILLION)
TABLE 146 TURKEY CLEANROOM PARTICLE COUNTERS MARKET, BY FACILITY TYPE, 2019-2028 (USD MILLION)
TABLE 147 TURKEY CLEANROOM PARTICLE COUNTERS MARKET, BY END USER, 2019-2028 (USD MILLION)
TABLE 148 TURKEY CLEANROOM PARTICLE COUNTERS MARKET, BY DISTRIBUTION CHANNEL, 2019-2028 (USD MILLION)
TABLE 149 IRELAND CLEANROOM PARTICLE COUNTERS MARKET, BY TYPE, 2019-2028 (USD MILLION)
TABLE 150 IRELAND PORTABLE PARTICLE COUNTER IN CLEANROOM PARTICLE COUNTERS MARKET, BY TYPE, 2019-2028 (USD MILLION)
TABLE 151 IRELAND HANDHELD PARTICLE COUNTER IN CLEANROOM PARTICLE COUNTERS MARKET, BY TYPE, 2019-2028 (USD MILLION)
TABLE 152 IRELAND REMOTE PARTICLE COUNTER IN CLEANROOM PARTICLE COUNTERS MARKET, BY TYPE, 2019-2028 (USD MILLION)
TABLE 153 IRELAND CLEANROOM PARTICLE COUNTERS MARKET, BY PARTICLE SIZE, 2019-2028 (USD MILLION)
TABLE 154 IRELAND CLEANROOM PARTICLE COUNTERS MARKET, BY FLOW RATE CAPACITY, 2019-2028 (USD MILLION)
TABLE 155 IRELAND CLEANROOM PARTICLE COUNTERS MARKET, BY FACILITY TYPE, 2019-2028 (USD MILLION)
TABLE 156 IRELAND CLEANROOM PARTICLE COUNTERS MARKET, BY END USER, 2019-2028 (USD MILLION)
TABLE 157 IRELAND CLEANROOM PARTICLE COUNTERS MARKET, BY DISTRIBUTION CHANNEL, 2019-2028 (USD MILLION)
TABLE 158 BELGIUM CLEANROOM PARTICLE COUNTERS MARKET, BY TYPE, 2019-2028 (USD MILLION)
TABLE 159 BELGIUM PORTABLE PARTICLE COUNTER IN CLEANROOM PARTICLE COUNTERS MARKET, BY TYPE, 2019-2028 (USD MILLION)
TABLE 160 BELGIUM HANDHELD PARTICLE COUNTER IN CLEANROOM PARTICLE COUNTERS MARKET, BY TYPE, 2019-2028 (USD MILLION)
TABLE 161 BELGIUM REMOTE PARTICLE COUNTER IN CLEANROOM PARTICLE COUNTERS MARKET, BY TYPE, 2019-2028 (USD MILLION)
TABLE 162 BELGIUM CLEANROOM PARTICLE COUNTERS MARKET, BY PARTICLE SIZE, 2019-2028 (USD MILLION)
TABLE 163 BELGIUM CLEANROOM PARTICLE COUNTERS MARKET, BY FLOW RATE CAPACITY, 2019-2028 (USD MILLION)
TABLE 164 BELGIUM CLEANROOM PARTICLE COUNTERS MARKET, BY FACILITY TYPE, 2019-2028 (USD MILLION)
TABLE 165 BELGIUM CLEANROOM PARTICLE COUNTERS MARKET, BY END USER, 2019-2028 (USD MILLION)
TABLE 166 BELGIUM CLEANROOM PARTICLE COUNTERS MARKET, BY DISTRIBUTION CHANNEL, 2019-2028 (USD MILLION)
TABLE 167 NETHERLANDS CLEANROOM PARTICLE COUNTERS MARKET, BY TYPE, 2019-2028 (USD MILLION)
TABLE 168 NETHERLANDS PORTABLE PARTICLE COUNTER IN CLEANROOM PARTICLE COUNTERS MARKET, BY TYPE, 2019-2028 (USD MILLION)
TABLE 169 NETHERLANDS HANDHELD PARTICLE COUNTER IN CLEANROOM PARTICLE COUNTERS MARKET, BY TYPE, 2019-2028 (USD MILLION)
TABLE 170 NETHERLANDS REMOTE PARTICLE COUNTER IN CLEANROOM PARTICLE COUNTERS MARKET, BY TYPE, 2019-2028 (USD MILLION)
TABLE 171 NETHERLANDS CLEANROOM PARTICLE COUNTERS MARKET, BY PARTICLE SIZE, 2019-2028 (USD MILLION)
TABLE 172 NETHERLANDS CLEANROOM PARTICLE COUNTERS MARKET, BY FLOW RATE CAPACITY, 2019-2028 (USD MILLION)
TABLE 173 NETHERLANDS CLEANROOM PARTICLE COUNTERS MARKET, BY FACILITY TYPE, 2019-2028 (USD MILLION)
TABLE 174 NETHERLANDS CLEANROOM PARTICLE COUNTERS MARKET, BY END USER, 2019-2028 (USD MILLION)
TABLE 175 NETHERLANDS CLEANROOM PARTICLE COUNTERS MARKET, BY DISTRIBUTION CHANNEL, 2019-2028 (USD MILLION)
TABLE 176 REST OF EUROPE CLEANROOM PARTICLE COUNTERS MARKET, BY TYPE, 2019-2028 (USD MILLION)
TABLE 177 ASIA-PACIFIC CLEANROOM PARTICLE COUNTERS MARKET, BY COUNTRY, 2019-2028 (USD MILLION)
TABLE 178 ASIA-PACIFIC CLEANROOM PARTICLE COUNTERS MARKET, BY TYPE, 2019-2028 (USD MILLION)
TABLE 179 ASIA-PACIFIC PORTABLE PARTICLE COUNTER IN CLEANROOM PARTICLE COUNTERS MARKET, BY TYPE, 2019-2028 (USD MILLION)
TABLE 180 ASIA-PACIFIC HANDHELD PARTICLE COUNTER IN CLEANROOM PARTICLE COUNTERS MARKET, BY TYPE, 2019-2028 (USD MILLION)
TABLE 181 ASIA-PACIFIC REMOTE PARTICLE COUNTER IN CLEANROOM PARTICLE COUNTERS MARKET, BY TYPE, 2019-2028 (USD MILLION)
TABLE 182 ASIA-PACIFIC CLEANROOM PARTICLE COUNTERS MARKET, BY PARTICLE SIZE, 2019-2028 (USD MILLION)
TABLE 183 ASIA-PACIFIC CLEANROOM PARTICLE COUNTERS MARKET, BY FLOW RATE CAPACITY, 2019-2028 (USD MILLION)
TABLE 184 ASIA-PACIFIC CLEANROOM PARTICLE COUNTERS MARKET, BY FACILITY TYPE, 2019-2028 (USD MILLION)
TABLE 185 ASIA-PACIFIC CLEANROOM PARTICLE COUNTERS MARKET, BY END USER, 2019-2028 (USD MILLION)
TABLE 186 ASIA-PACIFIC CLEANROOM PARTICLE COUNTERS MARKET, BY DISTRIBUTION CHANNEL, 2019-2028 (USD MILLION)
TABLE 187 CHINA CLEANROOM PARTICLE COUNTERS MARKET, BY TYPE, 2019-2028 (USD MILLION)
TABLE 188 CHINA PORTABLE PARTICLE COUNTER IN CLEANROOM PARTICLE COUNTERS MARKET, BY TYPE, 2019-2028 (USD MILLION)
TABLE 189 CHINA HANDHELD PARTICLE COUNTER IN CLEANROOM PARTICLE COUNTERS MARKET, BY TYPE, 2019-2028 (USD MILLION)
TABLE 190 CHINA REMOTE PARTICLE COUNTER IN CLEANROOM PARTICLE COUNTERS MARKET, BY TYPE, 2019-2028 (USD MILLION)
TABLE 191 CHINA CLEANROOM PARTICLE COUNTERS MARKET, BY PARTICLE SIZE, 2019-2028 (USD MILLION)
TABLE 192 CHINA CLEANROOM PARTICLE COUNTERS MARKET, BY FLOW RATE CAPACITY, 2019-2028 (USD MILLION)
TABLE 193 CHINA CLEANROOM PARTICLE COUNTERS MARKET, BY FACILITY TYPE, 2019-2028 (USD MILLION)
TABLE 194 CHINA CLEANROOM PARTICLE COUNTERS MARKET, BY END USER, 2019-2028 (USD MILLION)
TABLE 195 CHINA CLEANROOM PARTICLE COUNTERS MARKET, BY DISTRIBUTION CHANNEL, 2019-2028 (USD MILLION)
TABLE 196 JAPAN CLEANROOM PARTICLE COUNTERS MARKET, BY TYPE, 2019-2028 (USD MILLION)
TABLE 197 JAPAN PORTABLE PARTICLE COUNTER IN CLEANROOM PARTICLE COUNTERS MARKET, BY TYPE, 2019-2028 (USD MILLION)
TABLE 198 JAPAN HANDHELD PARTICLE COUNTER IN CLEANROOM PARTICLE COUNTERS MARKET, BY TYPE, 2019-2028 (USD MILLION)
TABLE 199 JAPAN REMOTE PARTICLE COUNTER IN CLEANROOM PARTICLE COUNTERS MARKET, BY TYPE, 2019-2028 (USD MILLION)
TABLE 200 JAPAN CLEANROOM PARTICLE COUNTERS MARKET, BY PARTICLE SIZE, 2019-2028 (USD MILLION)
TABLE 201 JAPAN CLEANROOM PARTICLE COUNTERS MARKET, BY FLOW RATE CAPACITY, 2019-2028 (USD MILLION)
TABLE 202 JAPAN CLEANROOM PARTICLE COUNTERS MARKET, BY FACILITY TYPE, 2019-2028 (USD MILLION)
TABLE 203 JAPAN CLEANROOM PARTICLE COUNTERS MARKET, BY END USER, 2019-2028 (USD MILLION)
TABLE 204 JAPAN CLEANROOM PARTICLE COUNTERS MARKET, BY DISTRIBUTION CHANNEL, 2019-2028 (USD MILLION)
TABLE 205 SOUTH KOREA CLEANROOM PARTICLE COUNTERS MARKET, BY TYPE, 2019-2028 (USD MILLION)
TABLE 206 SOUTH KOREA PORTABLE PARTICLE COUNTER IN CLEANROOM PARTICLE COUNTERS MARKET, BY TYPE, 2019-2028 (USD MILLION)
TABLE 207 SOUTH KOREA HANDHELD PARTICLE COUNTER IN CLEANROOM PARTICLE COUNTERS MARKET, BY TYPE, 2019-2028 (USD MILLION)
TABLE 208 SOUTH KOREA REMOTE PARTICLE COUNTER IN CLEANROOM PARTICLE COUNTERS MARKET, BY TYPE, 2019-2028 (USD MILLION)
TABLE 209 SOUTH KOREA CLEANROOM PARTICLE COUNTERS MARKET, BY PARTICLE SIZE, 2019-2028 (USD MILLION)
TABLE 210 SOUTH KOREA CLEANROOM PARTICLE COUNTERS MARKET, BY FLOW RATE CAPACITY, 2019-2028 (USD MILLION)
TABLE 211 SOUTH KOREA CLEANROOM PARTICLE COUNTERS MARKET, BY FACILITY TYPE, 2019-2028 (USD MILLION)
TABLE 212 SOUTH KOREA CLEANROOM PARTICLE COUNTERS MARKET, BY END USER, 2019-2028 (USD MILLION)
TABLE 213 SOUTH KOREA CLEANROOM PARTICLE COUNTERS MARKET, BY DISTRIBUTION CHANNEL, 2019-2028 (USD MILLION)
TABLE 214 INDIA CLEANROOM PARTICLE COUNTERS MARKET, BY TYPE, 2019-2028 (USD MILLION)
TABLE 215 INDIA PORTABLE PARTICLE COUNTER IN CLEANROOM PARTICLE COUNTERS MARKET, BY TYPE, 2019-2028 (USD MILLION)
TABLE 216 INDIA HANDHELD PARTICLE COUNTER IN CLEANROOM PARTICLE COUNTERS MARKET, BY TYPE, 2019-2028 (USD MILLION)
TABLE 217 INDIA REMOTE PARTICLE COUNTER IN CLEANROOM PARTICLE COUNTERS MARKET, BY TYPE, 2019-2028 (USD MILLION)
TABLE 218 INDIA CLEANROOM PARTICLE COUNTERS MARKET, BY PARTICLE SIZE, 2019-2028 (USD MILLION)
TABLE 219 INDIA CLEANROOM PARTICLE COUNTERS MARKET, BY FLOW RATE CAPACITY, 2019-2028 (USD MILLION)
TABLE 220 INDIA CLEANROOM PARTICLE COUNTERS MARKET, BY FACILITY TYPE, 2019-2028 (USD MILLION)
TABLE 221 INDIA CLEANROOM PARTICLE COUNTERS MARKET, BY END USER, 2019-2028 (USD MILLION)
TABLE 222 INDIA CLEANROOM PARTICLE COUNTERS MARKET, BY DISTRIBUTION CHANNEL, 2019-2028 (USD MILLION)
TABLE 223 AUSTRALIA CLEANROOM PARTICLE COUNTERS MARKET, BY TYPE, 2019-2028 (USD MILLION)
TABLE 224 AUSTRALIA PORTABLE PARTICLE COUNTER IN CLEANROOM PARTICLE COUNTERS MARKET, BY TYPE, 2019-2028 (USD MILLION)
TABLE 225 AUSTRALIA HANDHELD PARTICLE COUNTER IN CLEANROOM PARTICLE COUNTERS MARKET, BY TYPE, 2019-2028 (USD MILLION)
TABLE 226 AUSTRALIA REMOTE PARTICLE COUNTER IN CLEANROOM PARTICLE COUNTERS MARKET, BY TYPE, 2019-2028 (USD MILLION)
TABLE 227 AUSTRALIA CLEANROOM PARTICLE COUNTERS MARKET, BY PARTICLE SIZE, 2019-2028 (USD MILLION)
TABLE 228 AUSTRALIA CLEANROOM PARTICLE COUNTERS MARKET, BY FLOW RATE CAPACITY, 2019-2028 (USD MILLION)
TABLE 229 AUSTRALIA CLEANROOM PARTICLE COUNTERS MARKET, BY FACILITY TYPE, 2019-2028 (USD MILLION)
TABLE 230 AUSTRALIA CLEANROOM PARTICLE COUNTERS MARKET, BY END USER, 2019-2028 (USD MILLION)
TABLE 231 AUSTRALIA CLEANROOM PARTICLE COUNTERS MARKET, BY DISTRIBUTION CHANNEL, 2019-2028 (USD MILLION)
TABLE 232 SINGAPORE CLEANROOM PARTICLE COUNTERS MARKET, BY TYPE, 2019-2028 (USD MILLION)
TABLE 233 SINGAPORE PORTABLE PARTICLE COUNTER IN CLEANROOM PARTICLE COUNTERS MARKET, BY TYPE, 2019-2028 (USD MILLION)
TABLE 234 SINGAPORE HANDHELD PARTICLE COUNTER IN CLEANROOM PARTICLE COUNTERS MARKET, BY TYPE, 2019-2028 (USD MILLION)
TABLE 235 SINGAPORE REMOTE PARTICLE COUNTER IN CLEANROOM PARTICLE COUNTERS MARKET, BY TYPE, 2019-2028 (USD MILLION)
TABLE 236 SINGAPORE CLEANROOM PARTICLE COUNTERS MARKET, BY PARTICLE SIZE, 2019-2028 (USD MILLION)
TABLE 237 SINGAPORE CLEANROOM PARTICLE COUNTERS MARKET, BY FLOW RATE CAPACITY, 2019-2028 (USD MILLION)
TABLE 238 SINGAPORE CLEANROOM PARTICLE COUNTERS MARKET, BY FACILITY TYPE, 2019-2028 (USD MILLION)
TABLE 239 SINGAPORE CLEANROOM PARTICLE COUNTERS MARKET, BY END USER, 2019-2028 (USD MILLION)
TABLE 240 SINGAPORE CLEANROOM PARTICLE COUNTERS MARKET, BY DISTRIBUTION CHANNEL, 2019-2028 (USD MILLION)
TABLE 241 THAILAND CLEANROOM PARTICLE COUNTERS MARKET, BY TYPE, 2019-2028 (USD MILLION)
TABLE 242 THAILAND PORTABLE PARTICLE COUNTER IN CLEANROOM PARTICLE COUNTERS MARKET, BY TYPE, 2019-2028 (USD MILLION)
TABLE 243 THAILAND HANDHELD PARTICLE COUNTER IN CLEANROOM PARTICLE COUNTERS MARKET, BY TYPE, 2019-2028 (USD MILLION)
TABLE 244 THAILAND REMOTE PARTICLE COUNTER IN CLEANROOM PARTICLE COUNTERS MARKET, BY TYPE, 2019-2028 (USD MILLION)
TABLE 245 THAILAND CLEANROOM PARTICLE COUNTERS MARKET, BY PARTICLE SIZE, 2019-2028 (USD MILLION)
TABLE 246 THAILAND CLEANROOM PARTICLE COUNTERS MARKET, BY FLOW RATE CAPACITY, 2019-2028 (USD MILLION)
TABLE 247 THAILAND CLEANROOM PARTICLE COUNTERS MARKET, BY FACILITY TYPE, 2019-2028 (USD MILLION)
TABLE 248 THAILAND CLEANROOM PARTICLE COUNTERS MARKET, BY END USER, 2019-2028 (USD MILLION)
TABLE 249 THAILAND CLEANROOM PARTICLE COUNTERS MARKET, BY DISTRIBUTION CHANNEL, 2019-2028 (USD MILLION)
TABLE 250 MALAYSIA CLEANROOM PARTICLE COUNTERS MARKET, BY TYPE, 2019-2028 (USD MILLION)
TABLE 251 MALAYSIA PORTABLE PARTICLE COUNTER IN CLEANROOM PARTICLE COUNTERS MARKET, BY TYPE, 2019-2028 (USD MILLION)
TABLE 252 MALAYSIA HANDHELD PARTICLE COUNTER IN CLEANROOM PARTICLE COUNTERS MARKET, BY TYPE, 2019-2028 (USD MILLION)
TABLE 253 MALAYSIA REMOTE PARTICLE COUNTER IN CLEANROOM PARTICLE COUNTERS MARKET, BY TYPE, 2019-2028 (USD MILLION)
TABLE 254 MALAYSIA CLEANROOM PARTICLE COUNTERS MARKET, BY PARTICLE SIZE, 2019-2028 (USD MILLION)
TABLE 255 MALAYSIA CLEANROOM PARTICLE COUNTERS MARKET, BY FLOW RATE CAPACITY, 2019-2028 (USD MILLION)
TABLE 256 MALAYSIA CLEANROOM PARTICLE COUNTERS MARKET, BY FACILITY TYPE, 2019-2028 (USD MILLION)
TABLE 257 MALAYSIA CLEANROOM PARTICLE COUNTERS MARKET, BY END USER, 2019-2028 (USD MILLION)
TABLE 258 MALAYSIA CLEANROOM PARTICLE COUNTERS MARKET, BY DISTRIBUTION CHANNEL, 2019-2028 (USD MILLION)
TABLE 259 INDONESIA CLEANROOM PARTICLE COUNTERS MARKET, BY TYPE, 2019-2028 (USD MILLION)
TABLE 260 INDONESIA PORTABLE PARTICLE COUNTER IN CLEANROOM PARTICLE COUNTERS MARKET, BY TYPE, 2019-2028 (USD MILLION)
TABLE 261 INDONESIA HANDHELD PARTICLE COUNTER IN CLEANROOM PARTICLE COUNTERS MARKET, BY TYPE, 2019-2028 (USD MILLION)
TABLE 262 INDONESIA REMOTE PARTICLE COUNTER IN CLEANROOM PARTICLE COUNTERS MARKET, BY TYPE, 2019-2028 (USD MILLION)
TABLE 263 INDONESIA CLEANROOM PARTICLE COUNTERS MARKET, BY PARTICLE SIZE, 2019-2028 (USD MILLION)
TABLE 264 INDONESIA CLEANROOM PARTICLE COUNTERS MARKET, BY FLOW RATE CAPACITY, 2019-2028 (USD MILLION)
TABLE 265 INDONESIA CLEANROOM PARTICLE COUNTERS MARKET, BY FACILITY TYPE, 2019-2028 (USD MILLION)
TABLE 266 INDONESIA CLEANROOM PARTICLE COUNTERS MARKET, BY END USER, 2019-2028 (USD MILLION)
TABLE 267 INDONESIA CLEANROOM PARTICLE COUNTERS MARKET, BY DISTRIBUTION CHANNEL, 2019-2028 (USD MILLION)
TABLE 268 PHILIPPINES CLEANROOM PARTICLE COUNTERS MARKET, BY TYPE, 2019-2028 (USD MILLION)
TABLE 269 PHILIPPINES PORTABLE PARTICLE COUNTER IN CLEANROOM PARTICLE COUNTERS MARKET, BY TYPE, 2019-2028 (USD MILLION)
TABLE 270 PHILIPPINES HANDHELD PARTICLE COUNTER IN CLEANROOM PARTICLE COUNTERS MARKET, BY TYPE, 2019-2028 (USD MILLION)
TABLE 271 PHILIPPINES REMOTE PARTICLE COUNTER IN CLEANROOM PARTICLE COUNTERS MARKET, BY TYPE, 2019-2028 (USD MILLION)
TABLE 272 PHILIPPINES CLEANROOM PARTICLE COUNTERS MARKET, BY PARTICLE SIZE, 2019-2028 (USD MILLION)
TABLE 273 PHILIPPINES CLEANROOM PARTICLE COUNTERS MARKET, BY FLOW RATE CAPACITY, 2019-2028 (USD MILLION)
TABLE 274 PHILIPPINES CLEANROOM PARTICLE COUNTERS MARKET, BY FACILITY TYPE, 2019-2028 (USD MILLION)
TABLE 275 PHILIPPINES CLEANROOM PARTICLE COUNTERS MARKET, BY END USER, 2019-2028 (USD MILLION)
TABLE 276 PHILIPPINES CLEANROOM PARTICLE COUNTERS MARKET, BY DISTRIBUTION CHANNEL, 2019-2028 (USD MILLION)
TABLE 277 REST OF ASIA-PACIFIC CLEANROOM PARTICLE COUNTERS MARKET, BY TYPE, 2019-2028 (USD MILLION)
TABLE 278 MIDDLE EAST AND AFRICA CLEANROOM PARTICLE COUNTERS MARKET, BY COUNTRY, 2019-2028 (USD MILLION)
TABLE 279 MIDDLE EAST AND AFRICA CLEANROOM PARTICLE COUNTERS MARKET, BY TYPE, 2019-2028 (USD MILLION)
TABLE 280 MIDDLE EAST AND AFRICA PORTABLE PARTICLE COUNTER IN CLEANROOM PARTICLE COUNTERS MARKET, BY TYPE, 2019-2028 (USD MILLION)
TABLE 281 MIDDLE EAST AND AFRICA HANDHELD PARTICLE COUNTER IN CLEANROOM PARTICLE COUNTERS MARKET, BY TYPE, 2019-2028 (USD MILLION)
TABLE 282 MIDDLE EAST AND AFRICA REMOTE PARTICLE COUNTER IN CLEANROOM PARTICLE COUNTERS MARKET, BY TYPE, 2019-2028 (USD MILLION)
TABLE 283 MIDDLE EAST AND AFRICA CLEANROOM PARTICLE COUNTERS MARKET, BY PARTICLE SIZE, 2019-2028 (USD MILLION)
TABLE 284 MIDDLE EAST AND AFRICA CLEANROOM PARTICLE COUNTERS MARKET, BY FLOW RATE CAPACITY, 2019-2028 (USD MILLION)
TABLE 285 MIDDLE EAST AND AFRICA CLEANROOM PARTICLE COUNTERS MARKET, BY FACILITY TYPE, 2019-2028 (USD MILLION)
TABLE 286 MIDDLE EAST AND AFRICA CLEANROOM PARTICLE COUNTERS MARKET, BY END USER, 2019-2028 (USD MILLION)
TABLE 287 MIDDLE EAST AND AFRICA CLEANROOM PARTICLE COUNTERS MARKET, BY DISTRIBUTION CHANNEL, 2019-2028 (USD MILLION)
TABLE 288 SOUTH AFRICA CLEANROOM PARTICLE COUNTERS MARKET, BY TYPE, 2019-2028 (USD MILLION)
TABLE 289 SOUTH AFRICA PORTABLE PARTICLE COUNTER IN CLEANROOM PARTICLE COUNTERS MARKET, BY TYPE, 2019-2028 (USD MILLION)
TABLE 290 SOUTH AFRICA HANDHELD PARTICLE COUNTER IN CLEANROOM PARTICLE COUNTERS MARKET, BY TYPE, 2019-2028 (USD MILLION)
TABLE 291 SOUTH AFRICA REMOTE PARTICLE COUNTER IN CLEANROOM PARTICLE COUNTERS MARKET, BY TYPE, 2019-2028 (USD MILLION)
TABLE 292 SOUTH AFRICA CLEANROOM PARTICLE COUNTERS MARKET, BY PARTICLE SIZE, 2019-2028 (USD MILLION)
TABLE 293 SOUTH AFRICA CLEANROOM PARTICLE COUNTERS MARKET, BY FLOW RATE CAPACITY, 2019-2028 (USD MILLION)
TABLE 294 SOUTH AFRICA CLEANROOM PARTICLE COUNTERS MARKET, BY FACILITY TYPE, 2019-2028 (USD MILLION)
TABLE 295 SOUTH AFRICA CLEANROOM PARTICLE COUNTERS MARKET, BY END USER, 2019-2028 (USD MILLION)
TABLE 296 SOUTH AFRICA CLEANROOM PARTICLE COUNTERS MARKET, BY DISTRIBUTION CHANNEL, 2019-2028 (USD MILLION)
TABLE 297 SAUDI ARABIA CLEANROOM PARTICLE COUNTERS MARKET, BY TYPE, 2019-2028 (USD MILLION)
TABLE 298 SAUDI ARABIA PORTABLE PARTICLE COUNTER IN CLEANROOM PARTICLE COUNTERS MARKET, BY TYPE, 2019-2028 (USD MILLION)
TABLE 299 SAUDI ARABIA HANDHELD PARTICLE COUNTER IN CLEANROOM PARTICLE COUNTERS MARKET, BY TYPE, 2019-2028 (USD MILLION)
TABLE 300 SAUDI ARABIA REMOTE PARTICLE COUNTER IN CLEANROOM PARTICLE COUNTERS MARKET, BY TYPE, 2019-2028 (USD MILLION)
TABLE 301 SAUDI ARABIA CLEANROOM PARTICLE COUNTERS MARKET, BY PARTICLE SIZE, 2019-2028 (USD MILLION)
TABLE 302 SAUDI ARABIA CLEANROOM PARTICLE COUNTERS MARKET, BY FLOW RATE CAPACITY, 2019-2028 (USD MILLION)
TABLE 303 SAUDI ARABIA CLEANROOM PARTICLE COUNTERS MARKET, BY FACILITY TYPE, 2019-2028 (USD MILLION)
TABLE 304 SAUDI ARABIA CLEANROOM PARTICLE COUNTERS MARKET, BY END USER, 2019-2028 (USD MILLION)
TABLE 305 SAUDI ARABIA CLEANROOM PARTICLE COUNTERS MARKET, BY DISTRIBUTION CHANNEL, 2019-2028 (USD MILLION)
TABLE 306 U.A.E CLEANROOM PARTICLE COUNTERS MARKET, BY TYPE, 2019-2028 (USD MILLION)
TABLE 307 U.A.E PORTABLE PARTICLE COUNTER IN CLEANROOM PARTICLE COUNTERS MARKET, BY TYPE, 2019-2028 (USD MILLION)
TABLE 308 U.A.E HANDHELD PARTICLE COUNTER IN CLEANROOM PARTICLE COUNTERS MARKET, BY TYPE, 2019-2028 (USD MILLION)
TABLE 309 U.A.E REMOTE PARTICLE COUNTER IN CLEANROOM PARTICLE COUNTERS MARKET, BY TYPE, 2019-2028 (USD MILLION)
TABLE 310 U.A.E CLEANROOM PARTICLE COUNTERS MARKET, BY PARTICLE SIZE, 2019-2028 (USD MILLION)
TABLE 311 U.A.E CLEANROOM PARTICLE COUNTERS MARKET, BY FLOW RATE CAPACITY, 2019-2028 (USD MILLION)
TABLE 312 U.A.E CLEANROOM PARTICLE COUNTERS MARKET, BY FACILITY TYPE, 2019-2028 (USD MILLION)
TABLE 313 U.A.E CLEANROOM PARTICLE COUNTERS MARKET, BY END USER, 2019-2028 (USD MILLION)
TABLE 314 U.A.E CLEANROOM PARTICLE COUNTERS MARKET, BY DISTRIBUTION CHANNEL, 2019-2028 (USD MILLION)
TABLE 315 EGYPT CLEANROOM PARTICLE COUNTERS MARKET, BY TYPE, 2019-2028 (USD MILLION)
TABLE 316 EGYPT PORTABLE PARTICLE COUNTER IN CLEANROOM PARTICLE COUNTERS MARKET, BY TYPE, 2019-2028 (USD MILLION)
TABLE 317 EGYPT HANDHELD PARTICLE COUNTER IN CLEANROOM PARTICLE COUNTERS MARKET, BY TYPE, 2019-2028 (USD MILLION)
TABLE 318 EGYPT REMOTE PARTICLE COUNTER IN CLEANROOM PARTICLE COUNTERS MARKET, BY TYPE, 2019-2028 (USD MILLION)
TABLE 319 EGYPT CLEANROOM PARTICLE COUNTERS MARKET, BY PARTICLE SIZE, 2019-2028 (USD MILLION)
TABLE 320 EGYPT CLEANROOM PARTICLE COUNTERS MARKET, BY FLOW RATE CAPACITY, 2019-2028 (USD MILLION)
TABLE 321 EGYPT CLEANROOM PARTICLE COUNTERS MARKET, BY FACILITY TYPE, 2019-2028 (USD MILLION)
TABLE 322 EGYPT CLEANROOM PARTICLE COUNTERS MARKET, BY END USER, 2019-2028 (USD MILLION)
TABLE 323 EGYPT CLEANROOM PARTICLE COUNTERS MARKET, BY DISTRIBUTION CHANNEL, 2019-2028 (USD MILLION)
TABLE 324 ISRAEL CLEANROOM PARTICLE COUNTERS MARKET, BY TYPE, 2019-2028 (USD MILLION)
TABLE 325 ISRAEL PORTABLE PARTICLE COUNTER IN CLEANROOM PARTICLE COUNTERS MARKET, BY TYPE, 2019-2028 (USD MILLION)
TABLE 326 ISRAEL HANDHELD PARTICLE COUNTER IN CLEANROOM PARTICLE COUNTERS MARKET, BY TYPE, 2019-2028 (USD MILLION)
TABLE 327 ISRAEL REMOTE PARTICLE COUNTER IN CLEANROOM PARTICLE COUNTERS MARKET, BY TYPE, 2019-2028 (USD MILLION)
TABLE 328 ISRAEL CLEANROOM PARTICLE COUNTERS MARKET, BY PARTICLE SIZE, 2019-2028 (USD MILLION)
TABLE 329 ISRAEL CLEANROOM PARTICLE COUNTERS MARKET, BY FLOW RATE CAPACITY, 2019-2028 (USD MILLION)
TABLE 330 ISRAELCLEANROOM PARTICLE COUNTERS MARKET, BY FACILITY TYPE, 2019-2028 (USD MILLION)
TABLE 331 ISRAEL CLEANROOM PARTICLE COUNTERS MARKET, BY END USER, 2019-2028 (USD MILLION)
TABLE 332 ISRAEL CLEANROOM PARTICLE COUNTERS MARKET, BY DISTRIBUTION CHANNEL, 2019-2028 (USD MILLION)
TABLE 333 REST OF MIDDLE EAST AND AFRICA CLEANROOM PARTICLE COUNTERS MARKET, BY TYPE, 2019-2028 (USD MILLION)
TABLE 334 SOUTH AMERICA CLEANROOM PARTICLE COUNTERS MARKET, BY COUNTRY, 2019-2028 (USD MILLION)
TABLE 335 SOUTH AMERICA CLEANROOM PARTICLE COUNTERS MARKET, BY TYPE, 2019-2028 (USD MILLION)
TABLE 336 SOUTH AMERICA PORTABLE PARTICLE COUNTER IN CLEANROOM PARTICLE COUNTERS MARKET, BY TYPE, 2019-2028 (USD MILLION)
TABLE 337 SOUTH AMERICA HANDHELD PARTICLE COUNTER IN CLEANROOM PARTICLE COUNTERS MARKET, BY TYPE, 2019-2028 (USD MILLION)
TABLE 338 SOUTH AMERICA REMOTE PARTICLE COUNTER IN CLEANROOM PARTICLE COUNTERS MARKET, BY TYPE, 2019-2028 (USD MILLION)
TABLE 339 SOUTH AMERICA CLEANROOM PARTICLE COUNTERS MARKET, BY PARTICLE SIZE, 2019-2028 (USD MILLION)
TABLE 340 SOUTH AMERICA CLEANROOM PARTICLE COUNTERS MARKET, BY FLOW RATE CAPACITY, 2019-2028 (USD MILLION)
TABLE 341 SOUTH AMERICA CLEANROOM PARTICLE COUNTERS MARKET, BY FACILITY TYPE, 2019-2028 (USD MILLION)
TABLE 342 SOUTH AMERICA CLEANROOM PARTICLE COUNTERS MARKET, BY END USER, 2019-2028 (USD MILLION)
TABLE 343 SOUTH AMERICA CLEANROOM PARTICLE COUNTERS MARKET, BY DISTRIBUTION CHANNEL, 2019-2028 (USD MILLION)
TABLE 344 BRAZIL CLEANROOM PARTICLE COUNTERS MARKET, BY TYPE, 2019-2028 (USD MILLION)
TABLE 345 BRAZIL PORTABLE PARTICLE COUNTER IN CLEANROOM PARTICLE COUNTERS MARKET, BY TYPE, 2019-2028 (USD MILLION)
TABLE 346 BRAZIL HANDHELD PARTICLE COUNTER IN CLEANROOM PARTICLE COUNTERS MARKET, BY TYPE, 2019-2028 (USD MILLION)
TABLE 347 BRAZIL REMOTE PARTICLE COUNTER IN CLEANROOM PARTICLE COUNTERS MARKET, BY TYPE, 2019-2028 (USD MILLION)
TABLE 348 BRAZIL CLEANROOM PARTICLE COUNTERS MARKET, BY PARTICLE SIZE, 2019-2028 (USD MILLION)
TABLE 349 BRAZIL CLEANROOM PARTICLE COUNTERS MARKET, BY FLOW RATE CAPACITY, 2019-2028 (USD MILLION)
TABLE 350 BRAZIL CLEANROOM PARTICLE COUNTERS MARKET, BY FACILITY TYPE, 2019-2028 (USD MILLION)
TABLE 351 BRAZIL CLEANROOM PARTICLE COUNTERS MARKET, BY END USER, 2019-2028 (USD MILLION)
TABLE 352 BRAZIL CLEANROOM PARTICLE COUNTERS MARKET, BY DISTRIBUTION CHANNEL, 2019-2028 (USD MILLION)
TABLE 353 ARGENTINA CLEANROOM PARTICLE COUNTERS MARKET, BY TYPE, 2019-2028 (USD MILLION)
TABLE 354 ARGENTINA PORTABLE PARTICLE COUNTER IN CLEANROOM PARTICLE COUNTERS MARKET, BY TYPE, 2019-2028 (USD MILLION)
TABLE 355 ARGENTINA HANDHELD PARTICLE COUNTER IN CLEANROOM PARTICLE COUNTERS MARKET, BY TYPE, 2019-2028 (USD MILLION)
TABLE 356 ARGENTINA REMOTE PARTICLE COUNTER IN CLEANROOM PARTICLE COUNTERS MARKET, BY TYPE, 2019-2028 (USD MILLION)
TABLE 357 ARGENTINA CLEANROOM PARTICLE COUNTERS MARKET, BY PARTICLE SIZE, 2019-2028 (USD MILLION)
TABLE 358 ARGENTINA CLEANROOM PARTICLE COUNTERS MARKET, BY FLOW RATE CAPACITY, 2019-2028 (USD MILLION)
TABLE 359 ARGENTINA CLEANROOM PARTICLE COUNTERS MARKET, BY FACILITY TYPE, 2019-2028 (USD MILLION)
TABLE 360 ARGENTINA CLEANROOM PARTICLE COUNTERS MARKET, BY END USER, 2019-2028 (USD MILLION)
TABLE 361 ARGENTINA CLEANROOM PARTICLE COUNTERS MARKET, BY DISTRIBUTION CHANNEL, 2019-2028 (USD MILLION)
TABLE 362 REST OF SOUTH AMERICA CLEANROOM PARTICLE COUNTERS MARKET, BY TYPE, 2019-2028 (USD MILLION)
Lista de figuras
FIGURE 1 GLOBAL CLEANROOM PARTICLE COUNTERS MARKET: SEGMENTATION
FIGURE 2 GLOBAL CLEANROOM PARTICLE COUNTERS MARKET: DATA TRIANGULATION
FIGURE 3 GLOBAL CLEANROOM PARTICLE COUNTERS MARKET: DROC ANALYSIS
FIGURE 4 GLOBAL CLEANROOM PARTICLE COUNTERS MARKET: GLOBAL VS REGIONAL MARKET ANALYSIS
FIGURE 5 GLOBAL CLEANROOM PARTICLE COUNTERS MARKET: COMPANY RESEARCH ANALYSIS
FIGURE 6 GLOBAL CLEANROOM PARTICLE COUNTERS MARKET: INTERVIEW DEMOGRAPHICS
FIGURE 7 GLOBAL CLEANROOM PARTICLE COUNTERS MARKET: DBMR MARKET POSITION GRID
FIGURE 8 GLOBAL CLEANROOM PARTICLE COUNTERS MARKET: VENDOR SHARE ANALYSIS
FIGURE 9 GLOBAL CLEANROOM PARTICLE COUNTERS MARKET: MARKET END USER COVERAGE GRID
FIGURE 10 GLOBAL CLEANROOM PARTICLE COUNTERS MARKET: SEGMENTATION
FIGURE 11 THE INCREASED UTILIZATION OF REMOTE AND PORTABLE PARTICLE COUNTERS FOR PHARMACEUTICAL DRUG TESTING AND INCREASED RESEARCH AND DEVELOPMENT OF REMOTE PARTICLE COUNTERS IS EXPECTED TO DRIVE THE GLOBAL CLEANROOM PARTICLE COUNTERS MARKETIN THE FORECAST PERIOD OF 2021 TO 2028
FIGURE 12 PORTABLE PARTICLE COUNTER SEGMENT IS EXPECTED TO ACCOUNT FOR THE LARGEST SHARE OF THE GLOBAL CLEANROOM PARTICLE COUNTERS MARKET IN 2021 & 2028
FIGURE 13 DRIVERS, RESTRIANTS, OPPORTUNITIES, AND CHALLENGES OF GLOBAL CLEANROOM PARTICLE COUNTERS MARKET
FIGURE 14 GLOBAL CLEANROOM PARTICLE COUNTERS MARKET: BY TYPE, 2020
FIGURE 15 GLOBAL CLEANROOM PARTICLE COUNTERS MARKET: BY TYPE, 2021-2028 (USD MILLION)
FIGURE 16 GLOBAL CLEANROOM PARTICLE COUNTERS MARKET: BY TYPE, CAGR (2021-2028)
FIGURE 17 GLOBAL CLEANROOM PARTICLE COUNTERS MARKET: BY TYPE, LIFELINE CURVE
FIGURE 18 GLOBAL CLEANROOM PARTICLE COUNTERS MARKET: BY PARTICLE SIZE, 2020
FIGURE 19 GLOBAL CLEANROOM PARTICLE COUNTERS MARKET: BY PARTICLE SIZE, 2021-2028 (USD MILLION)
FIGURE 20 GLOBAL CLEANROOM PARTICLE COUNTERS MARKET: BY PARTICLE SIZE, CAGR (2021-2028)
FIGURE 21 GLOBAL CLEANROOM PARTICLE COUNTERS MARKET: BY PARTICLE SIZE, LIFELINE CURVE
FIGURE 22 GLOBAL CLEANROOM PARTICLE COUNTERS MARKET: BY FLOW RATE CAPACITY, 2020
FIGURE 23 GLOBAL CLEANROOM PARTICLE COUNTERS MARKET: BY FLOW RATE CAPACITY, 2021-2028 (USD MILLION)
FIGURE 24 GLOBAL CLEANROOM PARTICLE COUNTERS MARKET: BY FLOW RATE CAPACITY, CAGR (2021-2028)
FIGURE 25 GLOBAL CLEANROOM PARTICLE COUNTERS MARKET: BY FLOW RATE CAPACITY, LIFELINE CURVE
FIGURE 26 GLOBAL CLEANROOM PARTICLE COUNTERS MARKET: BY FACILITY TYPE, 2020
FIGURE 27 GLOBAL CLEANROOM PARTICLE COUNTERS MARKET: BY FACILITY TYPE, 2021-2028 (USD MILLION)
FIGURE 28 GLOBAL CLEANROOM PARTICLE COUNTERS MARKET: BY FACILITY TYPE, CAGR (2021-2028)
FIGURE 29 GLOBAL CLEANROOM PARTICLE COUNTERS MARKET: BY FACILITY TYPE, LIFELINE CURVE
FIGURE 30 GLOBAL CLEANROOM PARTICLE COUNTERS MARKET: BY END USER, 2020
FIGURE 31 GLOBAL CLEANROOM PARTICLE COUNTERS MARKET: BY END USER, 2021-2028 (USD MILLION)
FIGURE 32 GLOBAL CLEANROOM PARTICLE COUNTERS MARKET: BY END USER, CAGR (2021-2028)
FIGURE 33 GLOBAL CLEANROOM PARTICLE COUNTERS MARKET: BY END USER, LIFELINE CURVE
FIGURE 34 GLOBAL CLEANROOM PARTICLE COUNTERS MARKET: BY DISTRIBUTION CHANNEL, 2020
FIGURE 35 GLOBAL CLEANROOM PARTICLE COUNTERS MARKET: BY DISTRIBUTION CHANNEL, 2021-2028 (USD MILLION)
FIGURE 36 GLOBAL CLEANROOM PARTICLE COUNTERS MARKET: BY DISTRIBUTION CHANNEL, CAGR (2021-2028)
FIGURE 37 GLOBAL CLEANROOM PARTICLE COUNTERS MARKET: BY DISTRIBUTION CHANNEL, LIFELINE CURVE
FIGURE 38 GLOBAL CLEANROOM PARTICLE COUNTERS MARKET : SNAPSHOT (2020)
FIGURE 39 GLOBAL CLEANROOM PARTICLE COUNTERS MARKET : BY REGION (2020)
FIGURE 40 GLOBAL CLEANROOM PARTICLE COUNTERS MARKET : BY REGION (2021 & 2028)
FIGURE 41 GLOBAL CLEANROOM PARTICLE COUNTERS MARKET : BY REGION (2020 & 2028)
FIGURE 42 GLOBAL CLEANROOM PARTICLE COUNTERS MARKET : BY TYPE (2021-2028)
FIGURE 43 NORTH AMERICA CLEANROOM PARTICLE COUNTERS MARKET: SNAPSHOT (2020)
FIGURE 44 NORTH AMERICA CLEANROOM PARTICLE COUNTERS MARKET: BY COUNTRY (2020)
FIGURE 45 NORTH AMERICA CLEANROOM PARTICLE COUNTERS MARKET: BY COUNTRY (2021 & 2028)
FIGURE 46 NORTH AMERICA CLEANROOM PARTICLE COUNTERS MARKET: BY COUNTRY (2020 & 2028)
FIGURE 47 NORTH AMERICA CLEANROOM PARTICLE COUNTERS MARKET: BY SERVICES (2021-2028)
FIGURE 48 EUROPE CLEANROOM PARTICLE COUNTERS MARKET: SNAPSHOT (2020)
FIGURE 49 EUROPE CLEANROOM PARTICLE COUNTERS MARKET: BY COUNTRY (2020)
FIGURE 50 EUROPE CLEANROOM PARTICLE COUNTERS MARKET: BY COUNTRY (2021 & 2028)
FIGURE 51 EUROPE CLEANROOM PARTICLE COUNTERS MARKET: BY COUNTRY (2020 & 2028)
FIGURE 52 EUROPE CLEANROOM PARTICLE COUNTERS MARKET: BY TYPE (2021-2028)
FIGURE 53 ASIA-PACIFIC CLEANROOM PARTICLE COUNTERS MARKET : SNAPSHOT (2020)
FIGURE 54 ASIA-PACIFIC CLEANROOM PARTICLE COUNTERS MARKET : BY COUNTRY (2020)
FIGURE 55 ASIA-PACIFIC CLEANROOM PARTICLE COUNTERS MARKET : BY COUNTRY (2021 & 2028)
FIGURE 56 ASIA-PACIFIC CLEANROOM PARTICLE COUNTERS MARKET : BY COUNTRY (2020 & 2028)
FIGURE 57 ASIA-PACIFIC CLEANROOM PARTICLE COUNTERS MARKET : BY TYPE (2021-2028)
FIGURE 58 MIDDLE EAST AND AFRICA CLEANROOM PARTICLE COUNTERS MARKET: SNAPSHOT (2020)
FIGURE 59 MIDDLE EAST AND AFRICA CLEANROOM PARTICLE COUNTERS MARKET: BY COUNTRY (2020)
FIGURE 60 MIDDLE EAST AND AFRICA CLEANROOM PARTICLE COUNTERS MARKET: BY COUNTRY (2021 & 2028)
FIGURE 61 MIDDLE EAST AND AFRICA CLEANROOM PARTICLE COUNTERS MARKET: BY COUNTRY (2020 & 2028)
FIGURE 62 MIDDLE EAST AND AFRICA CLEANROOM PARTICLE COUNTERS MARKET: BY TYPE (2021-2028)
FIGURE 63 SOUTH AMERICA CLEANROOM PARTICLE COUNTERS MARKET: SNAPSHOT (2020)
FIGURE 64 SOUTH AMERICA CLEANROOM PARTICLE COUNTERS MARKET: BY COUNTRY (2020)
FIGURE 65 SOUTH AMERICA CLEANROOM PARTICLE COUNTERS MARKET: BY COUNTRY (2021 & 2028)
FIGURE 66 SOUTH AMERICA CLEANROOM PARTICLE COUNTERS MARKET: BY COUNTRY (2020 & 2028)
FIGURE 67 SOUTH AMERICA CLEANROOM PARTICLE COUNTERS MARKET: BY TYPE (2021-2028)
FIGURE 68 GLOBAL CLEANROOM PARTICLE COUNTER MARKET: COMPANY SHARE 2020 (%)
FIGURE 69 NORTH AMERICA CLEANROOM PARTICLE COUNTER MARKET: COMPANY SHARE 2020 (%)
FIGURE 70 EUROPE CLEANROOM PARTICLE COUNTER MARKET: COMPANY SHARE 2020 (%)
FIGURE 71 ASIA-PACIFIC CLEANROOM PARTICLE COUNTER MARKET: COMPANY SHARE 2020 (%)
Metodología de investigación
La recopilación de datos y el análisis del año base se realizan utilizando módulos de recopilación de datos con muestras de gran tamaño. La etapa incluye la obtención de información de mercado o datos relacionados a través de varias fuentes y estrategias. Incluye el examen y la planificación de todos los datos adquiridos del pasado con antelación. Asimismo, abarca el examen de las inconsistencias de información observadas en diferentes fuentes de información. Los datos de mercado se analizan y estiman utilizando modelos estadísticos y coherentes de mercado. Además, el análisis de la participación de mercado y el análisis de tendencias clave son los principales factores de éxito en el informe de mercado. Para obtener más información, solicite una llamada de un analista o envíe su consulta.
La metodología de investigación clave utilizada por el equipo de investigación de DBMR es la triangulación de datos, que implica la extracción de datos, el análisis del impacto de las variables de datos en el mercado y la validación primaria (experto en la industria). Los modelos de datos incluyen cuadrícula de posicionamiento de proveedores, análisis de línea de tiempo de mercado, descripción general y guía del mercado, cuadrícula de posicionamiento de la empresa, análisis de patentes, análisis de precios, análisis de participación de mercado de la empresa, estándares de medición, análisis global versus regional y de participación de proveedores. Para obtener más información sobre la metodología de investigación, envíe una consulta para hablar con nuestros expertos de la industria.
Personalización disponible
Data Bridge Market Research es líder en investigación formativa avanzada. Nos enorgullecemos de brindar servicios a nuestros clientes existentes y nuevos con datos y análisis que coinciden y se adaptan a sus objetivos. El informe se puede personalizar para incluir análisis de tendencias de precios de marcas objetivo, comprensión del mercado de países adicionales (solicite la lista de países), datos de resultados de ensayos clínicos, revisión de literatura, análisis de mercado renovado y base de productos. El análisis de mercado de competidores objetivo se puede analizar desde análisis basados en tecnología hasta estrategias de cartera de mercado. Podemos agregar tantos competidores sobre los que necesite datos en el formato y estilo de datos que esté buscando. Nuestro equipo de analistas también puede proporcionarle datos en archivos de Excel sin procesar, tablas dinámicas (libro de datos) o puede ayudarlo a crear presentaciones a partir de los conjuntos de datos disponibles en el informe.

