

Mercado global de aleaciones de soldadura fuerte, por metal (níquel, cobalto, plata, oro, aluminio, cobre, acero, hierro, magnesio, titanio y otros), material de relleno (polvo de soldadura fuerte, pasta de soldadura fuerte, cinta de soldadura fuerte, preforma de soldadura fuerte, lámina de soldadura fuerte y varilla y alambre de soldadura fuerte), tecnología (soldadura fuerte con soplete, soldadura fuerte en horno, soldadura fuerte por inducción, soldadura fuerte por inmersión, soldadura fuerte por resistencia, soldadura fuerte por infrarrojos, soldadura fuerte exotérmica, soldadura fuerte por manta, soldadura fuerte por haz de electrones /láser, soldadura fuerte, amoníaco disociado, soldadura fuerte al vacío, soldadura fuerte con hidrógeno, soldadura fuerte con gas combustible y otros), forma (tubería, tubo, lámina, tira, placa, barra redonda, plana, barra, alambre y otros), temperatura de producción (menos de 900 °C, 901 °C a 1000 °C, 1001 °C a 1200 °C y más de 1200 °C), uso final (aeroespacial y defensa, electrónica y eléctrica, Automotriz, Marina, Productos químicos, Construcción y otros), Tendencias de la industria y pronóstico hasta 2029.
Análisis y perspectivas del mercado
Los rellenos de soldadura fuerte para aplicaciones de unión son esenciales para la fabricación y el diseño de materiales avanzados. En las últimas décadas se han desarrollado varios tipos de rellenos de soldadura fuerte para unir materiales de ingeniería similares o diferentes. Partes importantes de componentes de automóviles y aeronaves, incluido el acero, a menudo se unen mediante soldadura fuerte. Además, los componentes cerámicos en dispositivos y circuitos de microondas se han unido con un alto nivel de integración en dispositivos microelectrónicos.
De manera similar, en el campo médico, los implantes metálicos se han soldado a coronas dentales de cerámica. Estos avances han hecho que la vida humana sea más cómoda. Sin embargo, en la soldadura, existen ciertos problemas con la formación de compuestos intermetálicos (IMC) y tensiones residuales en las uniones a altas temperaturas.
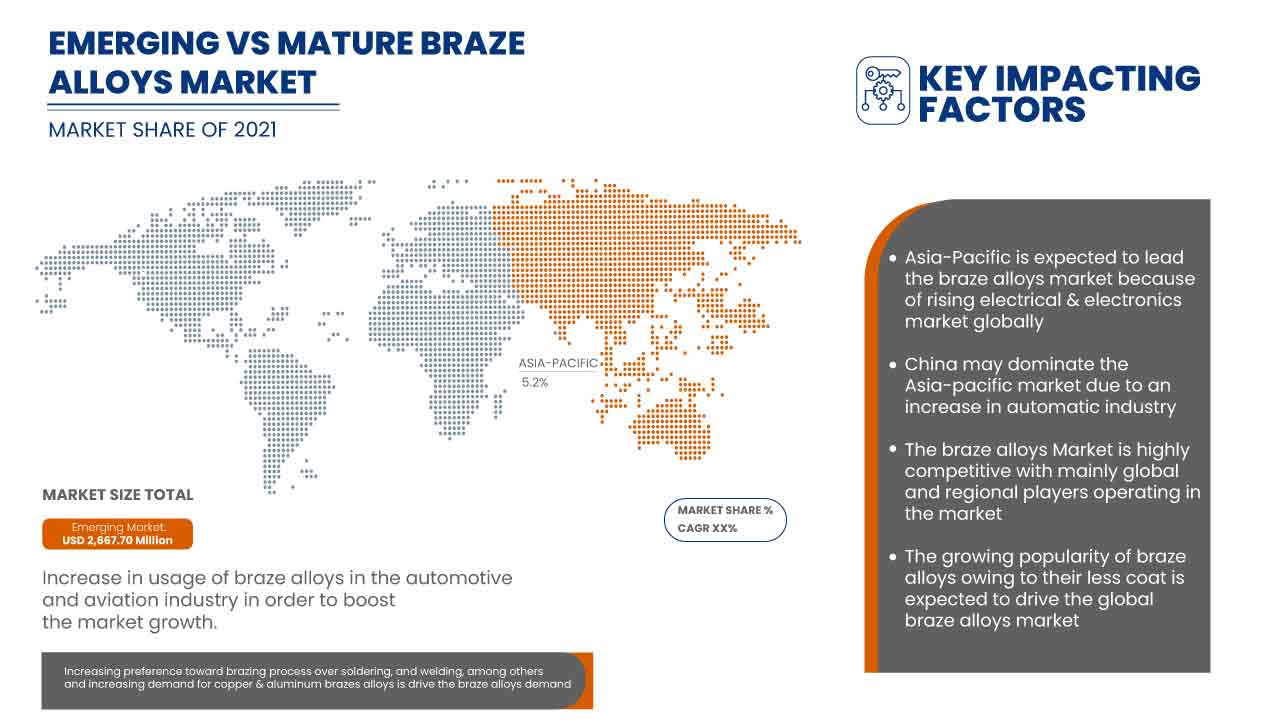
El aumento del uso de aleaciones de soldadura fuerte, junto con la creciente aplicación de estas en los sectores de la automoción, la aeronáutica y la defensa, la electrónica y la electricidad, y la construcción, ha hecho que su demanda aumente. Data Bridge Market Research analiza que el mercado de aleaciones de soldadura fuerte crecerá a una tasa compuesta anual del 4,8 % durante el período de pronóstico de 2022 a 2029.
|
Métrica del informe |
Detalles |
|
Período de pronóstico |
2022 a 2029 |
|
Año base |
2021 |
|
Años históricos |
2020 (Personalizable para 2020 - 2014) |
|
Unidades cuantitativas |
Ingresos en millones de USD, toneladas, precios en USD |
|
Segmentos cubiertos |
Por metal (níquel, cobalto, plata, oro, aluminio, cobre, acero, hierro, magnesio, titanio y otros), material de relleno (polvo de soldadura fuerte, pasta de soldadura fuerte, cinta de soldadura fuerte, preforma de soldadura fuerte, lámina de soldadura fuerte y varilla y alambre de soldadura fuerte), tecnología (soldadura fuerte con soplete, soldadura fuerte en horno, soldadura fuerte por inducción, soldadura fuerte por inmersión, soldadura fuerte por resistencia, soldadura fuerte por infrarrojos, soldadura fuerte exotérmica, soldadura fuerte por manta, soldadura fuerte por haz de electrones/láser, soldadura fuerte, amoníaco disociado, soldadura fuerte al vacío, soldadura fuerte con hidrógeno, soldadura fuerte con gas combustible y otros), forma (tubería, tubo, lámina, tira, placa, barra redonda, plana, barra, alambre y otros), temperatura de producción (menos de 900 °C, 901 °C a 1000 °C, 1001 °C a 1200 °C y más de 1200 °C), uso final (aeroespacial y defensa, electrónica y electricidad, automotriz, marina, Productos químicos, construcción y edificación y otros) |
|
Países cubiertos |
EE. UU., Canadá, México, Alemania, Reino Unido, Italia, Francia, España, Rusia, Turquía, Suiza, Bélgica, Países Bajos, resto de Europa, Japón, China, Corea del Sur, India, Australia, Singapur, Tailandia, Indonesia, Malasia, Filipinas, resto de Asia-Pacífico, Brasil, Argentina, resto de Sudamérica, Sudáfrica, Israel, Egipto, Arabia Saudita, Emiratos Árabes Unidos y resto de Medio Oriente y África. |
|
Actores del mercado cubiertos |
Johnson Matthey, OC Oerlikon Management AG, Sulzer Ltd, Belmont Metals, Harris Products Group, Morgan Advanced Materials y sus filiales, Aimtek, Inc., Prince Izant Company, Lucas-Milhaupt, Inc., Esprix Technologies, Indium Corporation, AMETEK. Inc., TSI Technologies, ESAB y Umicore, Indian Solder and Brazing Alloys, SAXONIA Edelmetalle GmbH, Saru Silver Alloy Private Limited., Cupro Alloys Corporation., KRANTI METALLURGY PVT LTD., SK METAL entre otros. |
Dinámica del mercado de aleaciones para soldadura fuerte
Conductores
- Aumento del uso de aleaciones de soldadura fuerte en la industria automotriz y aeronáutica
Las aleaciones para soldadura fuerte están experimentando una demanda significativa en la industria automotriz, donde se utilizan como conexiones de condensadores y evaporadores para sistemas de aire acondicionado, tuberías de inyección de combustible y pastillas de freno. La industria automotriz y de la aviación se ha esforzado por desarrollar componentes automotrices livianos.
- Creciente preferencia por el proceso de soldadura fuerte frente a la soldadura blanda y la soldadura autógena, entre otros.
La soldadura fuerte es un proceso de unión de metales en el que se unen dos o más elementos metálicos fundiendo y haciendo fluir un metal de relleno en la unión. Se utiliza ampliamente para unir conductores metálicos en sistemas de puesta a tierra eléctricos de alta y baja tensión. Este proceso se utiliza actualmente en el Reino Unido, Irlanda y otros países del mundo para crear una unión permanente de dos metales conductores, normalmente cobre o acero.

Oportunidades
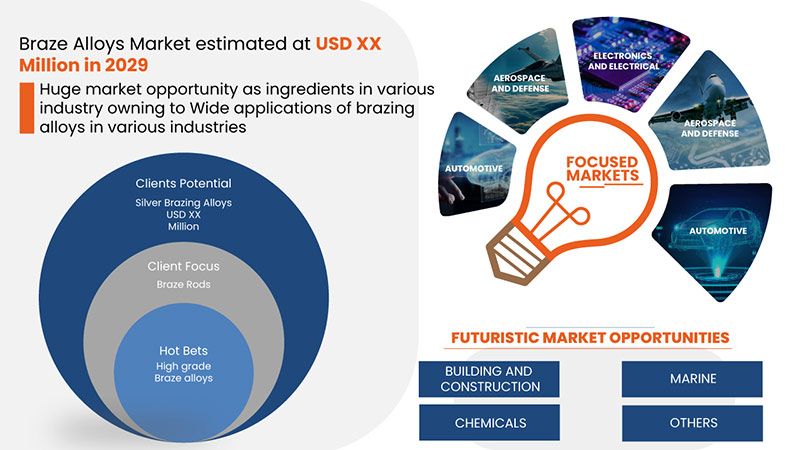
- Amplias aplicaciones de aleaciones de soldadura fuerte en diversas industrias.
La soldadura fuerte es un proceso de unión muy utilizado porque permite unir casi todos los metales, excepto el aluminio y el magnesio. Se utiliza para componentes eléctricos y accesorios de tuberías, entre otros. Los metales que tienen un espesor desigual se pueden unir mediante soldadura fuerte. La soldadura fuerte se utiliza para unir una variedad de metales, metales diferentes e incluso no metales. Produce uniones limpias que son rentables. Además, las aleaciones de soldadura fuerte son en su mayoría resistentes a la corrosión y conservan las características metalúrgicas del material, ya que las bajas temperaturas de las aleaciones de soldadura fuerte ayudan a minimizar la distorsión térmica. Además, las aleaciones de soldadura fuerte proporcionan un sellado excelente en comparación con la soldadura y otros procesos.
Restricciones/Desafíos
- Precios fluctuantes de los metales para soldadura fuerte
Los precios de las materias primas están fluctuando actualmente a niveles sin precedentes, tanto en Estados Unidos como en el resto del mundo, ya que los precios se ven afectados por el ajuste de los mercados de oferta. Además de la oferta y la demanda, el otro factor que ha influido en las fluctuaciones a corto plazo de los precios de las materias primas es que los inversores pueden alejarse repentinamente de lo que perciben como apuestas más arriesgadas, incluidas las acciones y las materias primas.
Este informe de mercado de aleaciones de soldadura fuerte proporciona detalles de nuevos desarrollos recientes, regulaciones comerciales, análisis de importación y exportación, análisis de producción, optimización de la cadena de valor, participación de mercado, impacto de los actores del mercado nacional y localizado, analiza oportunidades en términos de bolsillos de ingresos emergentes, cambios en las regulaciones del mercado, análisis estratégico del crecimiento del mercado, tamaño del mercado, crecimientos del mercado de categorías, nichos de aplicación y dominio, aprobaciones de productos, lanzamientos de productos, expansiones geográficas, innovaciones tecnológicas en el mercado. Para obtener más información sobre el mercado de aleaciones de soldadura fuerte, comuníquese con Data Bridge Market Research para obtener un informe de analista, nuestro equipo lo ayudará a tomar una decisión de mercado informada para lograr el crecimiento del mercado.
Impacto posterior al COVID-19 en el mercado de aleaciones para soldadura fuerte
La COVID-19 ha afectado al mercado en cierta medida. Debido al cierre del proceso de fabricación, se detuvo y la demanda de los usuarios finales también disminuyó, lo que afectó negativamente al mercado. Después de la COVID-19, la demanda de aleaciones de soldadura aumentó debido al cambio en el patrón de compra de los consumidores y al cambio gradual hacia el aumento de la demanda de aleaciones de soldadura entre varios usuarios finales, como la industria automotriz, aeroespacial y de defensa, electrónica y eléctrica, construcción y edificación, entre otros.
Acontecimientos recientes
- En agosto de 2021, Indium Corporation lanzó una nueva pasta de soldadura versátil. Indium12.8HF es una pasta versátil diseñada para brindar un rendimiento excepcional de inyección y microdispensación en una variedad de sistemas. Este lanzamiento ayudará a la empresa a aumentar su base de clientes.
- En junio de 2021, OC Oerlikon Management AG adquirió Coeurdor, un proveedor líder de servicios integrales de componentes para la industria de artículos de lujo en rápido crecimiento. Coeurdor es una marca consolidada y un proveedor de servicios integrales de diseño, fabricación y recubrimiento de componentes metálicos para marcas de lujo líderes a nivel mundial con el fin de ofrecer un punto de apoyo en el sector de los artículos de lujo. Por tanto, la adquisición ayudará a aumentar los ingresos de la empresa.
- En abril de 2020, Johnson Matthey se asoció con Stena Recycling Group para crear una solución circular y sostenible para el reciclaje de baterías de iones de litio con el fin de desarrollar una cadena de valor eficiente para el reciclaje de baterías de iones de litio y materiales de fabricación de celdas. Este desarrollo ayudará a la empresa a crecer rápidamente en los próximos años.
Alcance del mercado mundial de aleaciones para soldadura fuerte
El mercado de aleaciones para soldadura fuerte está segmentado en metal, material de relleno, tecnología, forma, temperatura de producción y uso final. El crecimiento entre estos segmentos le ayudará a analizar los segmentos de crecimiento en las industrias y brindará a los usuarios una valiosa descripción general del mercado y conocimientos del mercado para tomar decisiones estratégicas para identificar las principales aplicaciones del mercado.
Metal
- Plata
- Cobre
- Níquel
- Oro
- Titanio
- Acero
- Aluminio
- Cobalto
- Hierro
- Magnesio
- Otro
Sobre la base del metal, el mercado global de aleaciones de soldadura fuerte está segmentado en plata, cobre, níquel, oro, titanio, acero, aluminio, cobalto, hierro, magnesio y otros.
Material de relleno
- Pasta para soldar
- Varilla y alambre para soldadura fuerte
- Polvo para soldar
- Preforma de soldadura fuerte
- Lámina de soldadura fuerte
- Cinta de soldadura fuerte
Sobre la base del material de relleno, el mercado global de aleaciones de soldadura fuerte se segmenta en pasta de soldadura fuerte, varilla y alambre de soldadura fuerte, polvo de soldadura fuerte, preforma de soldadura fuerte, lámina de soldadura fuerte y cinta de soldadura fuerte.
Tecnología
- Soldadura fuerte con soplete
- Soldadura fuerte en horno
- Soldadura fuerte por resistencia
- Soldadura fuerte por inducción
- Soldadura por inmersión
- Soldadura por infrarrojos
- Soldadura fuerte al vacío
- Soldadura fuerte por haz de electrones/láser
- Soldadura fuerte exotérmica
- Soldadura fuerte
- Soldadura fuerte con hidrógeno
- Soldadura fuerte con manta
- Amoniaco disociado
- Soldadura fuerte con gas combustible
- Otros
Sobre la base de la tecnología, el mercado global de aleaciones de soldadura fuerte está segmentado en soldadura fuerte con soplete, soldadura fuerte en horno, soldadura fuerte por resistencia, soldadura fuerte por inducción, soldadura fuerte por inmersión, soldadura fuerte por infrarrojos, soldadura fuerte al vacío, soldadura fuerte por haz de electrones/láser, soldadura fuerte exotérmica, soldadura fuerte, soldadura fuerte de hidrógeno, soldadura fuerte con manta, amoníaco disociado, soldadura fuerte con gas combustible y otros.
Forma
- Cable
- Banda
- Bar
- Tubo
- Tubo
- Departamento
- Hoja
- Lámina
- Barra redonda
- Otros
Sobre la base de la forma, el mercado global de aleaciones de soldadura fuerte se segmenta en alambres, tiras, barras, caños, tubos, planos, láminas, placas, barras redondas y otros.
Temperatura de producción
- 1001 °C a 1200 °C
- Menos de 900 °C
- 901 °C a 1000 °C
- Por encima de 1200 °C
Sobre la base de la temperatura de producción, el mercado global de aleaciones de soldadura fuerte se segmenta en 1001 °C a 1200 °C, menos de 900 °C, 901 °C a 1000 °C y más de 1200 °C.
Uso final
- Automotor
- Aeroespacial y Defensa
- Electrónica y electricidad
- Construcción y edificación
- Productos químicos
- Marina
- Otros
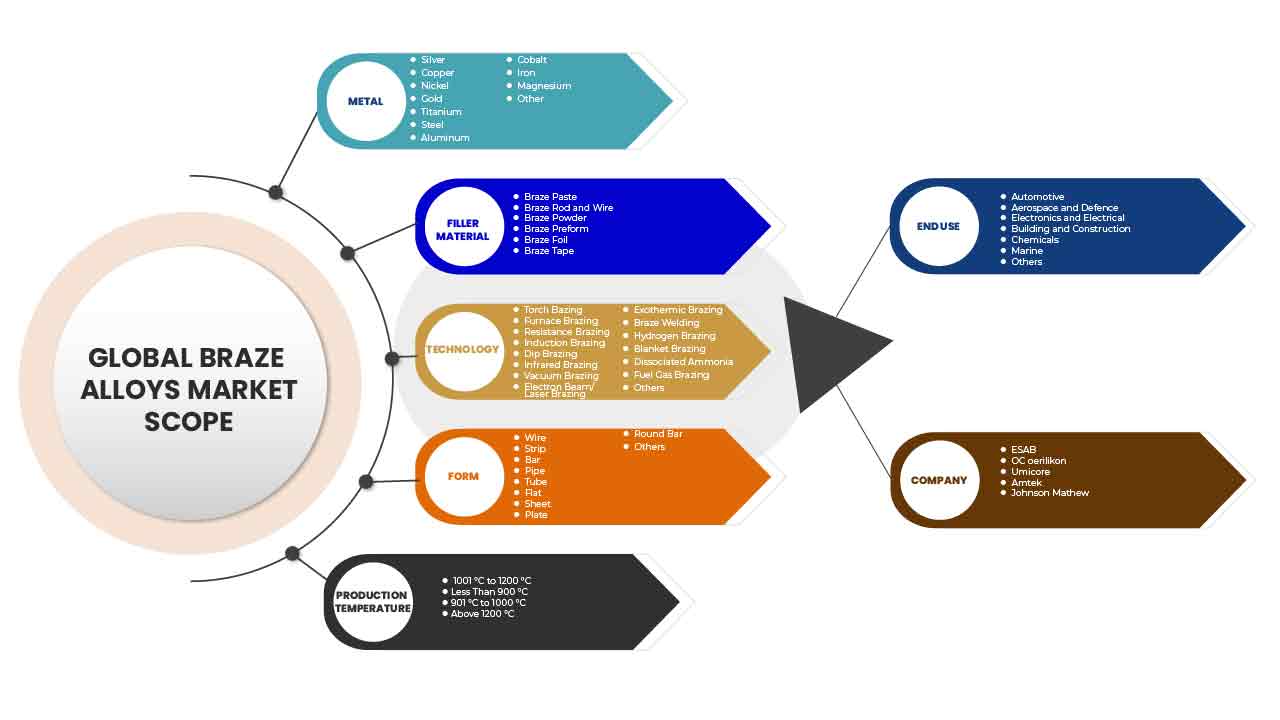
Sobre la base del uso final, el mercado global de aleaciones de soldadura fuerte se segmenta en automotriz, aeroespacial y de defensa, electrónica y eléctrica, construcción y edificación, productos químicos, marino y otros.
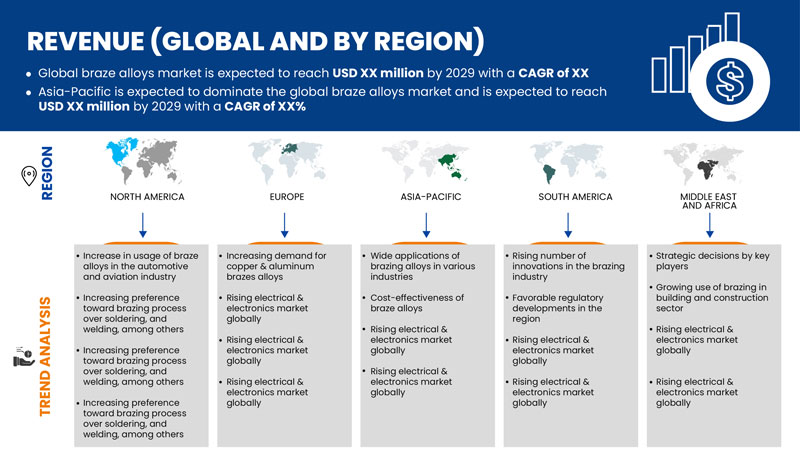
Análisis y perspectivas regionales del mercado de aleaciones para soldadura fuerte
Se analiza el mercado de aleaciones de soldadura fuerte y se proporcionan información y tendencias del tamaño del mercado por país, metal, material de relleno, tecnología, forma, temperatura de producción y uso final.
Las regiones cubiertas en el informe del mercado de aleaciones de soldadura fuerte son América del Norte, Europa, Asia-Pacífico, América del Sur, Medio Oriente y África.
Asia-Pacífico está dominando el mercado de aleaciones de soldadura fuerte durante el período de pronóstico debido al aumento en el uso de aleaciones de soldadura fuerte en amplias industrias de usuarios finales.
La sección de países del informe también proporciona factores de impacto de mercado individuales y cambios en las regulaciones del mercado que afectan las tendencias actuales y futuras del mercado. Los puntos de datos, como las ventas nuevas y de reemplazo, la demografía del país, la epidemiología de las enfermedades y los aranceles de importación y exportación, son algunos de los principales indicadores utilizados para pronosticar el escenario del mercado para países individuales. Además, la presencia y disponibilidad de marcas globales y sus desafíos enfrentados debido a la alta competencia de las marcas locales y nacionales, y el impacto de los canales de venta se consideran al proporcionar un análisis de pronóstico de los datos del país.
Análisis del panorama competitivo y de la cuota de mercado de las aleaciones para soldadura fuerte
El panorama competitivo del mercado de aleaciones para soldadura fuerte proporciona detalles de los competidores. Los detalles incluidos son una descripción general de la empresa, las finanzas de la empresa, los ingresos generados, el potencial de mercado, la inversión en investigación y desarrollo, las nuevas iniciativas de mercado, la presencia en el CCG, los sitios e instalaciones de producción, las capacidades de producción, las fortalezas y debilidades de la empresa, el lanzamiento de productos, la amplitud y la variedad de productos y el dominio de las aplicaciones. Los puntos de datos anteriores proporcionados solo están relacionados con el enfoque de las empresas en el mercado global de aleaciones para soldadura fuerte.
Algunos de los principales actores que operan en el mercado global de aleaciones de soldadura fuerte son Johnson Matthey, OC Oerlikon Management AG, Sulzer Ltd, Belmont Metals, Harris Products Group, Morgan Advanced Materials y sus filiales, Aimtek, Inc., Prince Izant Company, Lucas-Milhaupt, Inc., Esprix Technologies, Indium Corporation, AMETEK. Inc., TSI Technologies, ESAB y Umicore, Indian Solder and Brazing Alloys, SAXONIA Edelmetalle GmbH, Saru Silver Alloy Private Limited., Cupro Alloys Corporation., KRANTI METALLURGY PVT LTD., SK METAL y otros.
Metodología de la investigación
La recopilación de datos y el análisis del año base se realizan utilizando módulos de recopilación de datos con tamaños de muestra grandes. Los datos del mercado se analizan y estiman utilizando modelos estadísticos y coherentes del mercado. Además, el análisis de la participación de mercado y el análisis de tendencias clave son los principales factores de éxito en el informe de mercado. La metodología de investigación clave utilizada por el equipo de investigación de DBMR es la triangulación de datos que implica la extracción de datos, el análisis del impacto de las variables de datos en el mercado y la validación primaria (experto en la industria). Aparte de esto, los modelos de datos incluyen cuadrícula de posicionamiento de proveedores, análisis de la línea de tiempo del mercado, descripción general y guía del mercado, cuadrícula de posicionamiento de la empresa, análisis de la participación de mercado de la empresa, estándares de medición, análisis global versus regional y de la participación de los proveedores. Solicite una llamada de un analista en caso de tener más consultas.
SKU-
Obtenga acceso en línea al informe sobre la primera nube de inteligencia de mercado del mundo

- Panel de análisis de datos interactivo
- Panel de análisis de empresas para oportunidades con alto potencial de crecimiento
- Acceso de analista de investigación para personalización y consultas
- Análisis de la competencia con panel interactivo
- Últimas noticias, actualizaciones y análisis de tendencias
- Aproveche el poder del análisis de referencia para un seguimiento integral de la competencia
Tabla de contenido
1 INTRODUCTION
1.1 OBJECTIVES OF THE STUDY
1.2 MARKET DEFINITION
1.3 OVERVIEW OF THE GLOBAL BRAZE ALLOYS MARKET
1.4 LIMITATIONS
1.5 MARKETS COVERED
2 MARKET SEGMENTATION
2.1 MARKETS COVERED
2.2 GEOGRAPHICAL SCOPE
2.3 YEARS CONSIDERED FOR THE STUDY
2.4 CURRENCY AND PRICING
2.5 DBMR TRIPOD DATA VALIDATION MODEL
2.6 MULTIVARIATE MODELLING
2.7 METAL LIFELINE CURVE
2.8 PRIMARY INTERVIEWS WITH KEY OPINION LEADERS
2.9 DBMR MARKET POSITION GRID
2.1 VENDOR SHARE ANALYSIS
2.11 SECONDARY SOURCES
2.12 ASSUMPTIONS
3 EXECUTIVE SUMMARY
4 PREMIUM INSIGHTS
4.1 GLOBAL BRAZE ALLOYS MARKET- VENDOR SELECTION CRITERIA
4.2 TECHNOLOGICAL ADVANCEMENT IN BRAZE ALLOYS MARKET
4.3 GLOBAL BRAZE ALLOYS MARKET: SUPPLY CHAIN ANALYSIS
4.3.1 RAW MATERIAL PROCUREMENT
4.3.2 MANUFACTURING
4.3.3 MARKETING AND DISTRIBUTION
4.3.4 END USERS
4.4 GLOBAL BRAZE ALLOYS MARKET: REGULATIONS
4.4.1 REGULATIONS BY U.K. GOVERNMENT
4.4.2 FDA REGULATIONS
4.4.3 OSHA (OCCUPATIONAL SAFETY AND HEALTH ADMINISTRATION) STANDARDS
4.4.4 ISO STANDARDS
4.5 GLOBAL BRAZE ALLOYS MARKET-RAW MATERIAL PRODUCTION COVERAGE
4.6 GLOBAL BRAZE ALLOYS MARKET, PORTER’S FIVE FORCES ANALYSIS
4.6.1 BUYER POWER
4.6.2 SUPPLIER POWER
4.6.3 THE THREAT OF NEW ENTRANTS
4.6.4 THREAT OF SUBSTITUTES
4.6.5 RIVALRY AMONG EXISTING COMPETITORS
4.7 PESTEL ANALYSIS: GLOBAL BRAZE ALLOYS MARKET
4.7.1 POLITICS:
4.7.2 ECONOMY:
4.7.3 SOCIAL:
4.7.4 TECHNOLOGY:
4.7.5 ENVIRONMENTAL:
4.7.6 LEGAL:
4.8 CLIMATE CHANGE-
4.9 ALLOY PRICES AFFECT MARKET GROWTH BY REGIONS
5 MARKET OVERVIEW
5.1 DRIVERS
5.1.1 INCREASE IN USAGE OF BRAZE ALLOYS IN THE AUTOMOTIVE AND AVIATION INDUSTRY
5.1.2 INCREASING PREFERENCE TOWARD BRAZING PROCESS OVER SOLDERING, AND WELDING, AMONG OTHERS
5.1.3 INCREASING DEMAND FOR COPPER & ALUMINUM BRAZES ALLOYS
5.1.4 RISING ELECTRICAL & ELECTRONICS MARKET GLOBALLY
5.2 RESTRAINTS
5.2.1 FLUCTUATING PRICES OF BRAZE METALS
5.2.2 COMPLEXITIES IN THE MANUFACTURING PROCESS OF BRAZE ALLOYS
5.2.3 AVAILABILITY OF SUBSTITUTES FOR BRAZE ALLOYS
5.3 OPPORTUNITIES
5.3.1 WIDE APPLICATIONS OF BRAZING ALLOYS IN VARIOUS INDUSTRIES
5.3.2 COST-EFFECTIVENESS OF BRAZE ALLOYS
5.3.3 RISING NUMBER OF INNOVATIONS IN THE BRAZING INDUSTRY
5.3.4 STRATEGIC DECISIONS BY KEY PLAYERS
5.4 CHALLENGES
5.4.1 SUPPLY CHAIN DISRUPTION DUE TO COVID -19
5.4.2 ADVERSE EFFECT OF BRAZING ON THE ENVIRONMENT
6 GLOBAL BRAZE ALLOYS MARKET, BY METAL
6.1 OVERVIEW
6.2 SILVER
6.3 COPPER
6.4 NICKEL
6.5 GOLD
6.6 TITANIUM
6.7 STEEL
6.7.1 STAINLESS STEEL
6.7.2 CARBON STEEL
6.7.3 LOW ALLOY STEEL
6.7.4 OTHERS
6.8 ALUMINUM
6.9 COBALT
6.1 IRON
6.11 MAGNESIUM
6.12 OTHERS
7 GLOBAL BRAZE ALLOYS MARKET, BY FILLER MATERIAL
7.1 OVERVIEW
7.2 BRAZE PASTE
7.3 BRAZE ROD AND WIRE
7.4 BRAZE POWDER
7.5 BRAZE PREFORM
7.6 BRAZE FOIL
7.7 BRAZE TAPE
8 GLOBAL BRAZE ALLOYS MARKET, BY TECHNOLOGY
8.1 OVERVIEW
8.2 TORCH BRAZING
8.3 FURNACE BRAZING
8.4 RESISTANCE BRAZING
8.5 INDUCTION BRAZING
8.6 DIP BRAZING
8.7 INFRARED BRAZING
8.8 VACUUM BRAZING
8.9 ELECTRON BEAM/LASER BRAZING
8.1 EXOTHERMIC BRAZING
8.11 BRAZE WELDING
8.12 HYDROGEN BRAZING
8.13 BLANKET BRAZING
8.14 DISSOCIATED AMMONIA
8.15 FUEL GAS BRAZING
8.16 OTHERS
9 GLOBAL BRAZE ALLOYS MARKET, BY FORM
9.1 OVERVIEW
9.2 WIRE
9.3 STRIP
9.4 BAR
9.5 PIPE
9.6 TUBE
9.7 FLAT
9.8 SHEET
9.9 PLATE
9.1 ROUND BAR
9.11 OTHERS
10 GLOBAL BRAZE ALLOYS MARKET, BY PRODUCTION TEMPERATURE
10.1 OVERVIEW
10.2 1001 °C TO 1200 °C
10.3 LESS THAN 900 °C
10.4 901 °C TO 1000 °C
10.5 ABOVE 1200 °C
11 GLOBAL BRAZE ALLOYS MARKET, BY END USER
11.1 OVERVIEW
11.2 AUTOMOTIVE
11.2.1 SILVER
11.2.2 COPPER
11.2.3 NICKEL
11.2.4 GOLD
11.2.5 TITANIUM
11.2.6 STEEL
11.2.7 ALUMINUM
11.2.8 COBALT
11.2.9 IRON
11.2.10 MAGNESIUM
11.2.11 OTHERS
11.3 AEROSPACE AND DEFENSE
11.3.1 SILVER
11.3.2 COPPER
11.3.3 NICKEL
11.3.4 GOLD
11.3.5 TITANIUM
11.3.6 STEEL
11.3.7 ALUMINUM
11.3.8 COBALT
11.3.9 IRON
11.3.10 MAGNESIUM
11.3.11 OTHERS
11.4 ELECTRONICS AND ELECTRICAL
11.4.1 SILVER
11.4.2 COPPER
11.4.3 NICKEL
11.4.4 GOLD
11.4.5 TITANIUM
11.4.6 STEEL
11.4.7 ALUMINUM
11.4.8 COBALT
11.4.9 IRON
11.4.10 MAGNESIUM
11.4.11 OTHERS
11.5 BUILDING AND CONSTRUCTION
11.5.1 SILVER
11.5.2 COPPER
11.5.3 NICKEL
11.5.4 GOLD
11.5.5 TITANIUM
11.5.6 STEEL
11.5.7 ALUMINUM
11.5.8 COBALT
11.5.9 IRON
11.5.10 MAGNESIUM
11.5.11 OTHERS
11.6 CHEMICALS
11.6.1 SILVER
11.6.2 COPPER
11.6.3 NICKEL
11.6.4 GOLD
11.6.5 TITANIUM
11.6.6 STEEL
11.6.7 ALUMINUM
11.6.8 COBALT
11.6.9 IRON
11.6.10 MAGNESIUM
11.6.11 OTHERS
11.7 MARINE
11.7.1 SILVER
11.7.2 COPPER
11.7.3 NICKEL
11.7.4 GOLD
11.7.5 TITANIUM
11.7.6 STEEL
11.7.7 ALUMINUM
11.7.8 COBALT
11.7.9 IRON
11.7.10 MAGNESIUM
11.7.11 OTHERS
11.8 OTHERS
11.8.1 SILVER
11.8.2 COPPER
11.8.3 NICKEL
11.8.4 GOLD
11.8.5 TITANIUM
11.8.6 STEEL
11.8.7 ALUMINUM
11.8.8 COBALT
11.8.9 IRON
11.8.10 MAGNESIUM
11.8.11 OTHERS
12 GLOBAL BRAZE ALLOYS MARKET, BY REGION
12.1 OVERVIEW
12.2 ASIA-PACIFIC
12.2.1 CHINA
12.2.2 JAPAN
12.2.3 SOUTH KOREA
12.2.4 INDIA
12.2.5 AUSTRALIA
12.2.6 SINGAPORE
12.2.7 THAILAND
12.2.8 MALAYSIA
12.2.9 INDONESIA
12.2.10 PHILIPPINES
12.2.11 REST OF ASIA-PACIFIC
12.3 EUROPE
12.3.1 GERMANY
12.3.2 U.K.
12.3.3 FRANCE
12.3.4 ITALY
12.3.5 SPAIN
12.3.6 NETHERLANDS
12.3.7 BELGIUM
12.3.8 SWITZERLAND
12.3.9 RUSSIA
12.3.10 TURKEY
12.3.11 REST OF EUROPE
12.4 NORTH AMERICA
12.4.1 U.S.
12.4.2 CANADA
12.4.3 MEXICO
12.5 SOUTH AMERICA
12.5.1 BRAZIL
12.5.2 ARGENTINA
12.5.3 REST OF SOUTH AMERICA
12.6 MIDDLE EAST AND AFRICA
12.6.1 SOUTH AFRICA
12.6.2 U.A.E.
12.6.3 SAUDI ARABIA
12.6.4 EGYPT
12.6.5 ISRAEL
12.6.6 REST OF MIDDLE EAST AND AFRICA
13 COMPANY LANDSCAPE
13.1 COMPANY SHARE ANALYSIS: GLOBAL
13.2 COMPANY SHARE ANALYSIS: NORTH AMERICA
13.3 COMPANY SHARE ANALYSIS: EUROPE
13.4 COMPANY SHARE ANALYSIS: ASIA-PACIFIC
14 SWOT ANALYSIS
15 COMPANY PROFILE
15.1 ESAB
15.1.1 COMPANY SANPSHOT
15.1.2 REVENUE ANALYSIS
15.1.3 COMPANY SHARE ANALYSYS
15.1.4 PRODUCT PORTFOLIO
15.1.5 RECENT DEVELOPMENTS
15.2 OC OERLIKON MANAGEMENT AG
15.2.1 COMPANY SNAPSHOT
15.2.2 REVENUE ANALYSIS
15.2.3 COMPANY SHARE ANALYSIS
15.2.4 PRODUCT PORTFOLIO
15.2.5 RECENT DEVELOPMENTS
15.3 UMICORE
15.3.1 COMPANY SNAPSHOT
15.3.2 REVENUE ANALYSIS
15.3.3 COMPANY SHARE ANALYSIS
15.3.4 PRODUCT PORTFOLIO
15.3.5 RECENT DEVELOPMENT
15.4 AMETEK.INC.
15.4.1 COMPANY SNAPSHOT
15.4.2 REVENUE ANALYSIS
15.4.3 PRODUCT PORTFOLIO
15.4.4 RECENT DEVELOPMENT
15.5 JOHNSON MATTHEY
15.5.1 COMPANY SNAPSHOT
15.5.2 REVENUE ANALYSIS
15.5.3 COMPANY SHARE ANALYSI
15.5.4 PRODUCT PORTFOLIO
15.5.5 RECENT DEVELOPMENTS
15.6 AIMTEK
15.6.1 COMPANY SANPSHOT
15.6.2 COMPANY SHARE ANALYSIS
15.6.3 PRODUCT PORTFOLIO
15.6.4 RECENT DEVELOPMENT
15.7 BELMONT METALS
15.7.1 COMPANY SNAPSHOT
15.7.2 PRODUCT PORTFOLIO
15.7.3 RECENT DEVELOPMENT
15.8 CUPRO ALLOYS CORPORATION.
15.8.1 COMPANY SNAPSHOT
15.8.2 PRODUCT PORTFOLIO
15.8.3 RECENT DEVELOPMENTS
15.9 ESPRIX TECHNOLOGIES
15.9.1 COMPANY SNAPSHOT
15.9.2 PRODUCT PORTFOLIO
15.9.3 RECENT DEVELOPMENT
15.1 HARRIS PRODUCTS GROUP.
15.10.1 COMPANY SNAPSHOT
15.10.2 PRODUCT PORTFOLIO
15.10.3 RECENT DEVELOPMENT
15.11 INDIAN SOLDER AND BRAZING ALLOYS
15.11.1 COMPANY SNAPSHOT
15.11.2 PRODUCT PORTFOLIO
15.11.3 RECENT DEVELOPMENTS
15.12 INDIUM CORPORATION
15.12.1 COMPANY SNAPSHOT
15.12.2 PRODUCT PORTFOLIO
15.12.3 RECENT DEVELOPMENT
15.13 KRANTI METALLURGY PVT LTD.
15.13.1 COMPANY SNAPSHOT
15.13.2 PRODUCT PORTFOLIO
15.13.3 RECENT DEVELOPMENTS
15.14 LUCAS-MILHAUPT, INC.
15.14.1 COMPANY SNAPSHOT
15.14.2 PRODUCT PORTFOLIO
15.14.3 RECENT DEVELOPMENTS
15.15 MORGAN ADVANCED MATERIALS
15.15.1 COMPANY SNAPSHOT
15.15.2 PRODUCT PORTFOLIO
15.15.3 RECENT DEVELOPMENT
15.16 PRINCE IZANT COMPANY.
15.16.1 COMPANY SANPSHOT
15.16.2 PRODUCT PORTFOLIO
15.16.3 RECENT DEVELOPMENT
15.17 SARU SILVER ALLOY PRIV ATE LIMITED.
15.17.1 COMPANY SNAPSHOT
15.17.2 PRODUCT PORTFOLIO
15.17.3 RECENT DEVELOPMENTS
15.18 SAXONIA EDELMETALLE GMBH
15.18.1 COMPANY SNAPSHOT
15.18.2 PRODUCT PORTFOLIO
15.18.3 RECENT DEVELOPMENTS
15.19 S. K. METAL
15.19.1 COMPANY SNAPSHOT
15.19.2 PRODUCT PORTFOLIO
15.19.3 RECENT DEVELOPMENTS
15.2 SULZER LTD
15.20.1 COMPANY SNAPSHOT
15.20.2 REVENUE ANALYSIS
15.20.3 PRODUCT PORTFOLIO
15.20.4 RECENT DEVELOPMENTS
15.21 TSI TECHNOLOGIES
15.21.1 COMPANY SANPSHOT
15.21.2 PRODUCT PORTFOLIO
15.21.3 RECENT DEVELOPMENT
16 QUESTIONNAIRE
17 RELATED REPORTS
Lista de Tablas
TABLE 1 CHINA'S AVERAGE PRICE FOR BRAZING ALLOYS TYPES
TABLE 2 INDIA'S AVERAGE PRICE FOR BRAZING ALLOYS TYPES
TABLE 3 U.S. AVERAGE PRICE FOR BRAZING ALLOYS TYPES
TABLE 4 GLOBAL BRAZE ALLOYS MARKET, BY METAL, 2014-2029 (USD MILLION)
TABLE 5 GLOBAL BRAZE ALLOYS MARKET, BY METAL, 2014-2029 (TONS)
TABLE 6 GLOBAL SILVER IN BRAZE ALLOYS MARKET, BY REGION, 2014-2029 (USD MILLION)
TABLE 7 GLOBAL COPPER IN BRAZE ALLOYS MARKET, BY REGION, 2014-2029 (USD MILLION)
TABLE 8 GLOBAL NICKEL IN BRAZE ALLOYS MARKET, BY REGION, 2014-2029 (USD MILLION)
TABLE 9 GLOBAL GOLD IN BRAZE ALLOYS MARKET, BY REGION, 2014-2029 (USD MILLION)
TABLE 10 GLOBAL TITANIUM IN BRAZE ALLOYS MARKET, BY REGION, 2014-2029 (USD MILLION)
TABLE 11 GLOBAL STEEL IN BRAZE ALLOYS MARKET, BY REGION, 2014-2029 (USD MILLION)
TABLE 12 GLOBAL STEEL IN BRAZE ALLOYS MARKET, BY METAL, 2014-2029 (USD MILLION)
TABLE 13 GLOBAL ALUMINUM IN BRAZE ALLOYS MARKET, BY REGION, 2014-2029 (USD MILLION)
TABLE 14 GLOBAL COBALT IN BRAZE ALLOYS MARKET, BY REGION, 2014-2029 (USD MILLION)
TABLE 15 GLOBAL IRON IN BRAZE ALLOYS MARKET, BY REGION, 2014-2029 (USD MILLION)
TABLE 16 GLOBAL MAGNESIUM IN BRAZE ALLOYS MARKET, BY REGION, 2014-2029 (USD MILLION)
TABLE 17 GLOBAL OTHERS IN BRAZE ALLOYS MARKET, BY REGION, 2014-2029 (USD MILLION)
TABLE 18 GLOBAL BRAZE ALLOYS MARKET, BY FILLER MATERIAL, 2014-2029 (USD MILLION)
TABLE 19 GLOBAL BRAZE PASTE IN BRAZE ALLOYS MARKET, BY REGION, 2014-2029 (USD MILLION)
TABLE 20 GLOBAL BRAZE ROD AND WIRE IN BRAZE ALLOYS MARKET, BY REGION, 2014-2029 (USD MILLION)
TABLE 21 GLOBAL BRAZE POWDER IN BRAZE ALLOYS MARKET, BY REGION, 2014-2029 (USD MILLION)
TABLE 22 GLOBAL BRAZE PREFORM IN BRAZE ALLOYS MARKET, BY REGION, 2014-2029 (USD MILLION)
TABLE 23 GLOBAL BRAZE FOIL IN BRAZE ALLOYS MARKET, BY REGION, 2014-2029 (USD MILLION)
TABLE 24 GLOBAL BRAZE TAPE IN BRAZE ALLOYS MARKET, BY REGION, 2014-2029 (USD MILLION)
TABLE 25 GLOBAL BRAZE ALLOYS MARKET, BY TECHNOLOGY, 2014-2029 (USD MILLION)
TABLE 26 GLOBAL TORCH BRAZING IN BRAZE ALLOYS MARKET, BY REGION, 2014-2029 (USD MILLION)
TABLE 27 GLOBAL FURNACE BRAZING IN BRAZE ALLOYS MARKET, BY REGION, 2014-2029 (USD MILLION)
TABLE 28 GLOBAL RESISTANCE BRAZING IN BRAZE ALLOYS MARKET, BY REGION, 2014-2029 (USD MILLION)
TABLE 29 GLOBAL INDUCTION BRAZING IN BRAZE ALLOYS MARKET, BY REGION, 2014-2029 (USD MILLION)
TABLE 30 GLOBAL DIP BRAZING IN BRAZE ALLOYS MARKET, BY REGION, 2014-2029 (USD MILLION)
TABLE 31 GLOBAL INFRARED BRAZING IN BRAZE ALLOYS MARKET, BY REGION, 2014-2029 (USD MILLION)
TABLE 32 GLOBAL VACUUM BRAZING IN BRAZE ALLOYS MARKET, BY REGION, 2014-2029 (USD MILLION)
TABLE 33 GLOBAL ELECTRON BEAM/LASER BRAZING IN BRAZE ALLOYS MARKET, BY REGION, 2014-2029 (USD MILLION)
TABLE 34 GLOBAL EXOTHERMIC BRAZING IN BRAZE ALLOYS MARKET, BY REGION, 2014-2029 (USD MILLION)
TABLE 35 GLOBAL BRAZE WELDING IN BRAZE ALLOYS MARKET, BY REGION, 2014-2029 (USD MILLION)
TABLE 36 GLOBAL HYDROGEN BRAZING IN BRAZE ALLOYS MARKET, BY REGION, 2014-2029 (USD MILLION)
TABLE 37 GLOBAL BLANKET BRAZING IN BRAZE ALLOYS MARKET, BY REGION, 2014-2029 (USD MILLION)
TABLE 38 GLOBAL DISSOCIATED AMMONIA IN BRAZE ALLOYS MARKET, BY REGION, 2014-2029 (USD MILLION)
TABLE 39 GLOBAL FUEL GAS BRAZING IN BRAZE ALLOYS MARKET, BY REGION, 2014-2029 (USD MILLION)
TABLE 40 GLOBAL OTHERS IN BRAZE ALLOYS MARKET, BY REGION, 2014-2029 (USD MILLION)
TABLE 41 GLOBAL BRAZE ALLOYS MARKET, BY FORM, 2014-2029 (USD MILLION)
TABLE 42 GLOBAL WIRE IN BRAZE ALLOYS MARKET, BY REGION, 2014-2029 (USD MILLION)
TABLE 43 GLOBAL STRIP IN BRAZE ALLOYS MARKET, BY REGION, 2014-2029 (USD MILLION)
TABLE 44 GLOBAL BAR IN BRAZE ALLOYS MARKET, BY REGION, 2014-2029 (USD MILLION)
TABLE 45 GLOBAL PIPE IN BRAZE ALLOYS MARKET, BY REGION, 2014-2029 (USD MILLION)
TABLE 46 GLOBAL TUBE IN BRAZE ALLOYS MARKET, BY REGION, 2014-2029 (USD MILLION)
TABLE 47 GLOBAL FLAT IN BRAZE ALLOYS MARKET, BY REGION, 2014-2029 (USD MILLION)
TABLE 48 GLOBAL SHEET IN BRAZE ALLOYS MARKET, BY REGION, 2014-2029 (USD MILLION)
TABLE 49 GLOBAL PLATE IN BRAZE ALLOYS MARKET, BY REGION, 2014-2029 (USD MILLION)
TABLE 50 GLOBAL ROUND BAR IN BRAZE ALLOYS MARKET, BY REGION, 2014-2029 (USD MILLION)
TABLE 51 GLOBAL OTHERS IN BRAZE ALLOYS MARKET, BY REGION, 2014-2029 (USD MILLION)
TABLE 52 GLOBAL BRAZE ALLOYS MARKET, BY PRODUCTION TEMPERATURE, 2014-2029 (USD MILLION)
TABLE 53 GLOBAL 1001 °C TO 1200 °C IN BRAZE ALLOYS MARKET, BY REGION, 2014-2029 (USD MILLION)
TABLE 54 GLOBAL LESS THAN 900 °C IN BRAZE ALLOYS MARKET, BY REGION, 2014-2029 (USD MILLION)
TABLE 55 GLOBAL 901 °C TO 1000 °C IN BRAZE ALLOYS MARKET, BY REGION, 2014-2029 (USD MILLION)
TABLE 56 GLOBAL ABOVE 1200 °C IN BRAZE ALLOYS MARKET, BY REGION, 2014-2029 (USD MILLION)
TABLE 57 GLOBAL BRAZE ALLOYS MARKET, BY END-USER, 2014-2029 (USD MILLION)
TABLE 58 GLOBAL AUTOMOTIVE IN BRAZE ALLOYS MARKET, BY REGION, 2014-2029 (USD MILLION)
TABLE 59 GLOBAL AUTOMOTIVE IN BRAZE ALLOYS MARKET, BY METAL, 2014-2029 (USD MILLION)
TABLE 60 GLOBAL AEROSPACE AND DEFENSE IN BRAZE ALLOYS MARKET, BY REGION, 2014-2029 (USD MILLION)
TABLE 61 GLOBAL AEROSPACE AND DEFENSE IN BRAZE ALLOYS MARKET, BY METAL, 2014-2029 (USD MILLION)
TABLE 62 GLOBAL ELECTRONICS AND ELECTRICAL IN BRAZE ALLOYS MARKET, BY REGION, 2014-2029 (USD MILLION)
TABLE 63 GLOBAL ELECTRONICS AND ELECTRICAL IN BRAZE ALLOYS MARKET, BY METAL, 2014-2029 (USD MILLION)
TABLE 64 GLOBAL BUILDING AND CONSTRUCTION IN BRAZE ALLOYS MARKET, BY REGION, 2014-2029 (USD MILLION)
TABLE 65 GLOBAL BUILDING AND CONSTRUCTION IN BRAZE ALLOYS MARKET, BY METAL, 2014-2029 (USD MILLION)
TABLE 66 GLOBAL CHEMICALS IN BRAZE ALLOYS MARKET, BY REGION, 2014-2029 (USD MILLION)
TABLE 67 GLOBAL CHEMICALS IN BRAZE ALLOYS MARKET, BY METAL, 2014-2029 (USD MILLION)
TABLE 68 GLOBAL MARINE IN BRAZE ALLOYS MARKET, BY REGION, 2014-2029 (USD MILLION)
TABLE 69 GLOBAL MARINE IN BRAZE ALLOYS MARKET, BY METAL, 2014-2029 (USD MILLION)
TABLE 70 GLOBAL OTHERS IN BRAZE ALLOYS MARKET, BY REGION, 2014-2029 (USD MILLION)
TABLE 71 GLOBAL OTHERS IN BRAZE ALLOYS MARKET, BY METAL, 2014-2029 (USD MILLION)
TABLE 72 GLOBAL BRAZE ALLOYS MARKET, BY REGION, 2014-2029 (USD MILLION)
TABLE 73 GLOBAL BRAZE ALLOYS MARKET, BY REGION, 2014-2029 (TONS)
TABLE 74 ASIA-PACIFIC BRAZE ALLOYS MARKET, BY COUNTRY, 2014-2029 (USD MILLION)
TABLE 75 ASIA-PACIFIC BRAZE ALLOYS MARKET, BY COUNTRY, 2014-2029 (TONS)
TABLE 76 ASIA-PACIFIC BRAZE ALLOYS MARKET, BY METAL, 2014-2029 (USD MILLION)
TABLE 77 ASIA-PACIFIC BRAZE ALLOYS MARKET, BY METAL, 2014-2029 (TONS)
TABLE 78 ASIA-PACIFIC STEEL IN BRAZE ALLOYS MARKET, BY METAL, 2014-2029 (USD MILLION)
TABLE 79 ASIA-PACIFIC BRAZE ALLOYS MARKET, BY FILLER MATERIAL, 2014-2029 (USD MILLION)
TABLE 80 ASIA-PACIFIC BRAZE ALLOYS MARKET, BY TECHNOLOGY, 2014-2029 (USD MILLION)
TABLE 81 ASIA-PACIFIC BRAZE ALLOYS MARKET, BY FORM, 2014-2029 (USD MILLION)
TABLE 82 ASIA-PACIFIC BRAZE ALLOYS MARKET, BY PRODUCTION TEMPERATURE, 2014-2029 (USD MILLION)
TABLE 83 ASIA-PACIFIC BRAZE ALLOYS MARKET, BY END USE, 2014-2029 (USD MILLION)
TABLE 84 ASIA-PACIFIC AUTOMOTIVE IN BRAZE ALLOYS MARKET, BY METAL, 2014-2029 (USD MILLION)
TABLE 85 ASIA-PACIFIC AEROSPACE AND DEFENCE IN BRAZE ALLOYS MARKET, BY METAL, 2014-2029 (USD MILLION)
TABLE 86 ASIA-PACIFIC ELECTRONICS AND ELECTRICAL BRAZE ALLOYS MARKET, BY METAL, 2014-2029 (USD MILLION)
TABLE 87 ASIA-PACIFIC BUILDING AND CONSTRUCTION IN BRAZE ALLOYS MARKET, BY METAL, 2014-2029 (USD MILLION)
TABLE 88 ASIA-PACIFIC CHEMICALS IN BRAZE ALLOYS MARKET, BY METAL, 2014-2029 (USD MILLION)
TABLE 89 ASIA-PACIFIC MARINE IN BRAZE ALLOYS MARKET, BY METAL, 2014-2029 (USD MILLION)
TABLE 90 ASIA-PACIFIC OTHERS IN BRAZE ALLOYS MARKET, BY METAL, 2014-2029 (USD MILLION)
TABLE 91 CHINA BRAZE ALLOYS MARKET, BY METAL, 2014-2029 (USD MILLION)
TABLE 92 CHINA BRAZE ALLOYS MARKET, BY METAL, 2014-2029 (TONS)
TABLE 93 CHINA STEEL IN BRAZE ALLOYS MARKET, BY METAL, 2014-2029 (USD MILLION)
TABLE 94 CHINA BRAZE ALLOYS MARKET, BY FILLER MATERIAL, 2014-2029 (USD MILLION)
TABLE 95 CHINA BRAZE ALLOYS MARKET, BY TECHNOLOGY, 2014-2029 (USD MILLION)
TABLE 96 CHINA BRAZE ALLOYS MARKET, BY FORM, 2014-2029 (USD MILLION)
TABLE 97 CHINA BRAZE ALLOYS MARKET, BY PRODUCTION TEMPERATURE, 2014-2029 (USD MILLION)
TABLE 98 CHINA BRAZE ALLOYS MARKET, BY END USE, 2014-2029 (USD MILLION)
TABLE 99 CHINA AUTOMOTIVE IN BRAZE ALLOYS MARKET, BY METAL, 2014-2029 (USD MILLION)
TABLE 100 CHINA AEROSPACE AND DEFENCE IN BRAZE ALLOYS MARKET, BY METAL, 2014-2029 (USD MILLION)
TABLE 101 CHINA ELECTRONICS AND ELECTRICAL BRAZE ALLOYS MARKET, BY METAL, 2014-2029 (USD MILLION)
TABLE 102 CHINA BUILDING AND CONSTRUCTION IN BRAZE ALLOYS MARKET, BY METAL, 2014-2029 (USD MILLION)
TABLE 103 CHINA CHEMICALS IN BRAZE ALLOYS MARKET, BY METAL, 2014-2029 (USD MILLION)
TABLE 104 CHINA MARINE IN BRAZE ALLOYS MARKET, BY METAL, 2014-2029 (USD MILLION)
TABLE 105 CHINA OTHERS IN BRAZE ALLOYS MARKET, BY METAL, 2014-2029 (USD MILLION)
TABLE 106 JAPAN BRAZE ALLOYS MARKET, BY METAL, 2014-2029 (USD MILLION)
TABLE 107 JAPAN BRAZE ALLOYS MARKET, BY METAL, 2014-2029 (TONS)
TABLE 108 JAPAN STEEL IN BRAZE ALLOYS MARKET, BY METAL, 2014-2029 (USD MILLION)
TABLE 109 JAPAN BRAZE ALLOYS MARKET, BY FILLER MATERIAL, 2014-2029 (USD MILLION)
TABLE 110 JAPAN BRAZE ALLOYS MARKET, BY TECHNOLOGY, 2014-2029 (USD MILLION)
TABLE 111 JAPAN BRAZE ALLOYS MARKET, BY FORM, 2014-2029 (USD MILLION)
TABLE 112 JAPAN BRAZE ALLOYS MARKET, BY PRODUCTION TEMPERATURE, 2014-2029 (USD MILLION)
TABLE 113 JAPAN BRAZE ALLOYS MARKET, BY END USE, 2014-2029 (USD MILLION)
TABLE 114 JAPAN AUTOMOTIVE IN BRAZE ALLOYS MARKET, BY METAL, 2014-2029 (USD MILLION)
TABLE 115 JAPAN AEROSPACE AND DEFENCE IN BRAZE ALLOYS MARKET, BY METAL, 2014-2029 (USD MILLION)
TABLE 116 JAPAN ELECTRONICS AND ELECTRICAL BRAZE ALLOYS MARKET, BY METAL, 2014-2029 (USD MILLION)
TABLE 117 JAPAN BUILDING AND CONSTRUCTION IN BRAZE ALLOYS MARKET, BY METAL, 2014-2029 (USD MILLION)
TABLE 118 JAPAN CHEMICALS IN BRAZE ALLOYS MARKET, BY METAL, 2014-2029 (USD MILLION)
TABLE 119 JAPAN MARINE IN BRAZE ALLOYS MARKET, BY METAL, 2014-2029 (USD MILLION)
TABLE 120 JAPAN OTHERS IN BRAZE ALLOYS MARKET, BY METAL, 2014-2029 (USD MILLION)
TABLE 121 SOUTH KOREA BRAZE ALLOYS MARKET, BY METAL, 2014-2029 (USD MILLION)
TABLE 122 SOUTH KOREA BRAZE ALLOYS MARKET, BY METAL, 2014-2029 (TONS)
TABLE 123 SOUTH KOREA STEEL IN BRAZE ALLOYS MARKET, BY METAL, 2014-2029 (USD MILLION)
TABLE 124 SOUTH KOREA BRAZE ALLOYS MARKET, BY FILLER MATERIAL, 2014-2029 (USD MILLION)
TABLE 125 SOUTH KOREA BRAZE ALLOYS MARKET, BY TECHNOLOGY, 2014-2029 (USD MILLION)
TABLE 126 SOUTH KOREA BRAZE ALLOYS MARKET, BY FORM, 2014-2029 (USD MILLION)
TABLE 127 SOUTH KOREA BRAZE ALLOYS MARKET, BY PRODUCTION TEMPERATURE, 2014-2029 (USD MILLION)
TABLE 128 SOUTH KOREA BRAZE ALLOYS MARKET, BY END USE, 2014-2029 (USD MILLION)
TABLE 129 SOUTH KOREA AUTOMOTIVE IN BRAZE ALLOYS MARKET, BY METAL, 2014-2029 (USD MILLION)
TABLE 130 SOUTH KOREA AEROSPACE AND DEFENCE IN BRAZE ALLOYS MARKET, BY METAL, 2014-2029 (USD MILLION)
TABLE 131 SOUTH KOREA ELECTRONICS AND ELECTRICAL BRAZE ALLOYS MARKET, BY METAL, 2014-2029 (USD MILLION)
TABLE 132 SOUTH KOREA BUILDING AND CONSTRUCTION IN BRAZE ALLOYS MARKET, BY METAL, 2014-2029 (USD MILLION)
TABLE 133 SOUTH KOREA CHEMICALS IN BRAZE ALLOYS MARKET, BY METAL, 2014-2029 (USD MILLION)
TABLE 134 SOUTH KOREA MARINE IN BRAZE ALLOYS MARKET, BY METAL, 2014-2029 (USD MILLION)
TABLE 135 SOUTH KOREA OTHERS IN BRAZE ALLOYS MARKET, BY METAL, 2014-2029 (USD MILLION)
TABLE 136 INDIA BRAZE ALLOYS MARKET, BY METAL, 2014-2029 (USD MILLION)
TABLE 137 INDIA BRAZE ALLOYS MARKET, BY METAL, 2014-2029 (TONS)
TABLE 138 INDIA STEEL IN BRAZE ALLOYS MARKET, BY METAL, 2014-2029 (USD MILLION)
TABLE 139 INDIA BRAZE ALLOYS MARKET, BY FILLER MATERIAL, 2014-2029 (USD MILLION)
TABLE 140 INDIA BRAZE ALLOYS MARKET, BY TECHNOLOGY, 2014-2029 (USD MILLION)
TABLE 141 INDIA BRAZE ALLOYS MARKET, BY FORM, 2014-2029 (USD MILLION)
TABLE 142 INDIA BRAZE ALLOYS MARKET, BY PRODUCTION TEMPERATURE, 2014-2029 (USD MILLION)
TABLE 143 INDIA BRAZE ALLOYS MARKET, BY END USE, 2014-2029 (USD MILLION)
TABLE 144 INDIA AUTOMOTIVE IN BRAZE ALLOYS MARKET, BY METAL, 2014-2029 (USD MILLION)
TABLE 145 INDIA AEROSPACE AND DEFENCE IN BRAZE ALLOYS MARKET, BY METAL, 2014-2029 (USD MILLION)
TABLE 146 INDIA ELECTRONICS AND ELECTRICAL BRAZE ALLOYS MARKET, BY METAL, 2014-2029 (USD MILLION)
TABLE 147 INDIA BUILDING AND CONSTRUCTION IN BRAZE ALLOYS MARKET, BY METAL, 2014-2029 (USD MILLION)
TABLE 148 INDIA CHEMICALS IN BRAZE ALLOYS MARKET, BY METAL, 2014-2029 (USD MILLION)
TABLE 149 INDIA MARINE IN BRAZE ALLOYS MARKET, BY METAL, 2014-2029 (USD MILLION)
TABLE 150 INDIA OTHERS IN BRAZE ALLOYS MARKET, BY METAL, 2014-2029 (USD MILLION)
TABLE 151 AUSTRALIA BRAZE ALLOYS MARKET, BY METAL, 2014-2029 (USD MILLION)
TABLE 152 AUSTRALIA BRAZE ALLOYS MARKET, BY METAL, 2014-2029 (TONS)
TABLE 153 AUSTRALIA STEEL IN BRAZE ALLOYS MARKET, BY METAL, 2014-2029 (USD MILLION)
TABLE 154 AUSTRALIA BRAZE ALLOYS MARKET, BY FILLER MATERIAL, 2014-2029 (USD MILLION)
TABLE 155 AUSTRALIA BRAZE ALLOYS MARKET, BY TECHNOLOGY, 2014-2029 (USD MILLION)
TABLE 156 AUSTRALIA BRAZE ALLOYS MARKET, BY FORM, 2014-2029 (USD MILLION)
TABLE 157 AUSTRALIA BRAZE ALLOYS MARKET, BY PRODUCTION TEMPERATURE, 2014-2029 (USD MILLION)
TABLE 158 AUSTRALIA BRAZE ALLOYS MARKET, BY END USE, 2014-2029 (USD MILLION)
TABLE 159 AUSTRALIA AUTOMOTIVE IN BRAZE ALLOYS MARKET, BY METAL, 2014-2029 (USD MILLION)
TABLE 160 AUSTRALIA AEROSPACE AND DEFENCE IN BRAZE ALLOYS MARKET, BY METAL, 2014-2029 (USD MILLION)
TABLE 161 AUSTRALIA ELECTRONICS AND ELECTRICAL BRAZE ALLOYS MARKET, BY METAL, 2014-2029 (USD MILLION)
TABLE 162 AUSTRALIA BUILDING AND CONSTRUCTION IN BRAZE ALLOYS MARKET, BY METAL, 2014-2029 (USD MILLION)
TABLE 163 AUSTRALIA CHEMICALS IN BRAZE ALLOYS MARKET, BY METAL, 2014-2029 (USD MILLION)
TABLE 164 AUSTRALIA MARINE IN BRAZE ALLOYS MARKET, BY METAL, 2014-2029 (USD MILLION)
TABLE 165 AUSTRALIA OTHERS IN BRAZE ALLOYS MARKET, BY METAL, 2014-2029 (USD MILLION)
TABLE 166 SINGAPORE BRAZE ALLOYS MARKET, BY METAL, 2014-2029 (USD MILLION)
TABLE 167 SINGAPORE BRAZE ALLOYS MARKET, BY METAL, 2014-2029 (TONS)
TABLE 168 SINGAPORE STEEL IN BRAZE ALLOYS MARKET, BY METAL, 2014-2029 (USD MILLION)
TABLE 169 SINGAPORE BRAZE ALLOYS MARKET, BY FILLER MATERIAL, 2014-2029 (USD MILLION)
TABLE 170 SINGAPORE BRAZE ALLOYS MARKET, BY TECHNOLOGY, 2014-2029 (USD MILLION)
TABLE 171 SINGAPORE BRAZE ALLOYS MARKET, BY FORM, 2014-2029 (USD MILLION)
TABLE 172 SINGAPORE BRAZE ALLOYS MARKET, BY PRODUCTION TEMPERATURE, 2014-2029 (USD MILLION)
TABLE 173 SINGAPORE BRAZE ALLOYS MARKET, BY END USE, 2014-2029 (USD MILLION)
TABLE 174 SINGAPORE AUTOMOTIVE IN BRAZE ALLOYS MARKET, BY METAL, 2014-2029 (USD MILLION)
TABLE 175 SINGAPORE AEROSPACE AND DEFENCE IN BRAZE ALLOYS MARKET, BY METAL, 2014-2029 (USD MILLION)
TABLE 176 SINGAPORE ELECTRONICS AND ELECTRICAL BRAZE ALLOYS MARKET, BY METAL, 2014-2029 (USD MILLION)
TABLE 177 SINGAPORE BUILDING AND CONSTRUCTION IN BRAZE ALLOYS MARKET, BY METAL, 2014-2029 (USD MILLION)
TABLE 178 SINGAPORE CHEMICALS IN BRAZE ALLOYS MARKET, BY METAL, 2014-2029 (USD MILLION)
TABLE 179 SINGAPORE MARINE IN BRAZE ALLOYS MARKET, BY METAL, 2014-2029 (USD MILLION)
TABLE 180 SINGAPORE OTHERS IN BRAZE ALLOYS MARKET, BY METAL, 2014-2029 (USD MILLION)
TABLE 181 THAILAND BRAZE ALLOYS MARKET, BY METAL, 2014-2029 (USD MILLION)
TABLE 182 THAILAND BRAZE ALLOYS MARKET, BY METAL, 2014-2029 (TONS)
TABLE 183 THAILAND STEEL IN BRAZE ALLOYS MARKET, BY METAL, 2014-2029 (USD MILLION)
TABLE 184 THAILAND BRAZE ALLOYS MARKET, BY FILLER MATERIAL, 2014-2029 (USD MILLION)
TABLE 185 THAILAND BRAZE ALLOYS MARKET, BY TECHNOLOGY, 2014-2029 (USD MILLION)
TABLE 186 THAILAND BRAZE ALLOYS MARKET, BY FORM, 2014-2029 (USD MILLION)
TABLE 187 THAILAND BRAZE ALLOYS MARKET, BY PRODUCTION TEMPERATURE, 2014-2029 (USD MILLION)
TABLE 188 THAILAND BRAZE ALLOYS MARKET, BY END USE, 2014-2029 (USD MILLION)
TABLE 189 THAILAND AUTOMOTIVE IN BRAZE ALLOYS MARKET, BY METAL, 2014-2029 (USD MILLION)
TABLE 190 THAILAND AEROSPACE AND DEFENCE IN BRAZE ALLOYS MARKET, BY METAL, 2014-2029 (USD MILLION)
TABLE 191 THAILAND ELECTRONICS AND ELECTRICAL BRAZE ALLOYS MARKET, BY METAL, 2014-2029 (USD MILLION)
TABLE 192 THAILAND BUILDING AND CONSTRUCTION IN BRAZE ALLOYS MARKET, BY METAL, 2014-2029 (USD MILLION)
TABLE 193 THAILAND CHEMICALS IN BRAZE ALLOYS MARKET, BY METAL, 2014-2029 (USD MILLION)
TABLE 194 THAILAND MARINE IN BRAZE ALLOYS MARKET, BY METAL, 2014-2029 (USD MILLION)
TABLE 195 THAILAND OTHERS IN BRAZE ALLOYS MARKET, BY METAL, 2014-2029 (USD MILLION)
TABLE 196 MALAYSIA BRAZE ALLOYS MARKET, BY METAL, 2014-2029 (USD MILLION)
TABLE 197 MALAYSIA BRAZE ALLOYS MARKET, BY METAL, 2014-2029 (TONS)
TABLE 198 MALAYSIA STEEL IN BRAZE ALLOYS MARKET, BY METAL, 2014-2029 (USD MILLION)
TABLE 199 MALAYSIA BRAZE ALLOYS MARKET, BY FILLER MATERIAL, 2014-2029 (USD MILLION)
TABLE 200 MALAYSIA BRAZE ALLOYS MARKET, BY TECHNOLOGY, 2014-2029 (USD MILLION)
TABLE 201 MALAYSIA BRAZE ALLOYS MARKET, BY FORM, 2014-2029 (USD MILLION)
TABLE 202 MALAYSIA BRAZE ALLOYS MARKET, BY PRODUCTION TEMPERATURE, 2014-2029 (USD MILLION)
TABLE 203 MALAYSIA BRAZE ALLOYS MARKET, BY END USE, 2014-2029 (USD MILLION)
TABLE 204 MALAYSIA AUTOMOTIVE IN BRAZE ALLOYS MARKET, BY METAL, 2014-2029 (USD MILLION)
TABLE 205 MALAYSIA AEROSPACE AND DEFENCE IN BRAZE ALLOYS MARKET, BY METAL, 2014-2029 (USD MILLION)
TABLE 206 MALAYSIA ELECTRONICS AND ELECTRICAL BRAZE ALLOYS MARKET, BY METAL, 2014-2029 (USD MILLION)
TABLE 207 MALAYSIA BUILDING AND CONSTRUCTION IN BRAZE ALLOYS MARKET, BY METAL, 2014-2029 (USD MILLION)
TABLE 208 MALAYSIA CHEMICALS IN BRAZE ALLOYS MARKET, BY METAL, 2014-2029 (USD MILLION)
TABLE 209 MALAYSIA MARINE IN BRAZE ALLOYS MARKET, BY METAL, 2014-2029 (USD MILLION)
TABLE 210 MALAYSIA OTHERS IN BRAZE ALLOYS MARKET, BY METAL, 2014-2029 (USD MILLION)
TABLE 211 INDONESIA BRAZE ALLOYS MARKET, BY METAL, 2014-2029 (USD MILLION)
TABLE 212 INDONESIA BRAZE ALLOYS MARKET, BY METAL, 2014-2029 (TONS)
TABLE 213 INDONESIA STEEL IN BRAZE ALLOYS MARKET, BY METAL, 2014-2029 (USD MILLION)
TABLE 214 INDONESIA BRAZE ALLOYS MARKET, BY FILLER MATERIAL, 2014-2029 (USD MILLION)
TABLE 215 INDONESIA BRAZE ALLOYS MARKET, BY TECHNOLOGY, 2014-2029 (USD MILLION)
TABLE 216 INDONESIA BRAZE ALLOYS MARKET, BY FORM, 2014-2029 (USD MILLION)
TABLE 217 INDONESIA BRAZE ALLOYS MARKET, BY PRODUCTION TEMPERATURE, 2014-2029 (USD MILLION)
TABLE 218 INDONESIA BRAZE ALLOYS MARKET, BY END USE, 2014-2029 (USD MILLION)
TABLE 219 INDONESIA AUTOMOTIVE IN BRAZE ALLOYS MARKET, BY METAL, 2014-2029 (USD MILLION)
TABLE 220 INDONESIA AEROSPACE AND DEFENCE IN BRAZE ALLOYS MARKET, BY METAL, 2014-2029 (USD MILLION)
TABLE 221 INDONESIA ELECTRONICS AND ELECTRICAL BRAZE ALLOYS MARKET, BY METAL, 2014-2029 (USD MILLION)
TABLE 222 INDONESIA BUILDING AND CONSTRUCTION IN BRAZE ALLOYS MARKET, BY METAL, 2014-2029 (USD MILLION)
TABLE 223 INDONESIA CHEMICALS IN BRAZE ALLOYS MARKET, BY METAL, 2014-2029 (USD MILLION)
TABLE 224 INDONESIA MARINE IN BRAZE ALLOYS MARKET, BY METAL, 2014-2029 (USD MILLION)
TABLE 225 INDONESIA OTHERS IN BRAZE ALLOYS MARKET, BY METAL, 2014-2029 (USD MILLION)
TABLE 226 PHILIPPINES BRAZE ALLOYS MARKET, BY METAL, 2014-2029 (USD MILLION)
TABLE 227 PHILIPPINES BRAZE ALLOYS MARKET, BY METAL, 2014-2029 (TONS)
TABLE 228 PHILIPPINES STEEL IN BRAZE ALLOYS MARKET, BY METAL, 2014-2029 (USD MILLION)
TABLE 229 PHILIPPINES BRAZE ALLOYS MARKET, BY FILLER MATERIAL, 2014-2029 (USD MILLION)
TABLE 230 PHILIPPINES BRAZE ALLOYS MARKET, BY TECHNOLOGY, 2014-2029 (USD MILLION)
TABLE 231 PHILIPPINES BRAZE ALLOYS MARKET, BY FORM, 2014-2029 (USD MILLION)
TABLE 232 PHILIPPINES BRAZE ALLOYS MARKET, BY PRODUCTION TEMPERATURE, 2014-2029 (USD MILLION)
TABLE 233 PHILIPPINES BRAZE ALLOYS MARKET, BY END USE, 2014-2029 (USD MILLION)
TABLE 234 PHILIPPINES AUTOMOTIVE IN BRAZE ALLOYS MARKET, BY METAL, 2014-2029 (USD MILLION)
TABLE 235 PHILIPPINES AEROSPACE AND DEFENCE IN BRAZE ALLOYS MARKET, BY METAL, 2014-2029 (USD MILLION)
TABLE 236 PHILIPPINES ELECTRONICS AND ELECTRICAL BRAZE ALLOYS MARKET, BY METAL, 2014-2029 (USD MILLION)
TABLE 237 PHILIPPINES BUILDING AND CONSTRUCTION IN BRAZE ALLOYS MARKET, BY METAL, 2014-2029 (USD MILLION)
TABLE 238 PHILIPPINES CHEMICALS IN BRAZE ALLOYS MARKET, BY METAL, 2014-2029 (USD MILLION)
TABLE 239 PHILIPPINES MARINE IN BRAZE ALLOYS MARKET, BY METAL, 2014-2029 (USD MILLION)
TABLE 240 PHILIPPINES OTHERS IN BRAZE ALLOYS MARKET, BY METAL, 2014-2029 (USD MILLION)
TABLE 241 REST OF ASIA-PACIFIC BRAZE ALLOYS MARKET, BY METAL, 2014-2029 (USD MILLION)
TABLE 242 REST OF ASIA-PACIFIC BRAZE ALLOYS MARKET, BY METAL, 2014-2029 (TONS)
TABLE 243 EUROPE BRAZE ALLOYS MARKET, BY COUNTRY, 2014-2029 (USD MILLION)
TABLE 244 EUROPE BRAZE ALLOYS MARKET, BY COUNTRY, 2014-2029 (TONS)
TABLE 245 EUROPE BRAZE ALLOYS MARKET, BY METAL, 2014-2029 (USD MILLION)
TABLE 246 EUROPE BRAZE ALLOYS MARKET, BY METAL, 2014-2029 (TONS)
TABLE 247 EUROPE STEEL IN BRAZE ALLOYS MARKET, BY METAL, 2014-2029 (USD MILLION)
TABLE 248 EUROPE BRAZE ALLOYS MARKET, BY FILLER MATERIAL, 2014-2029 (USD MILLION)
TABLE 249 EUROPE BRAZE ALLOYS MARKET, BY TECHNOLOGY, 2014-2029 (USD MILLION)
TABLE 250 EUROPE BRAZE ALLOYS MARKET, BY FORM , 2014-2029 (USD MILLION)
TABLE 251 EUROPE BRAZE ALLOYS MARKET, BY PRODUCTION TEMPERATURE, 2014-2029 (USD MILLION)
TABLE 252 EUROPE BRAZE ALLOYS MARKET, BY END USE, 2014-2029 (USD MILLION)
TABLE 253 EUROPE AUTOMOTIVE IN BRAZE ALLOYS MARKET, BY METAL, 2014-2029 (USD MILLION)
TABLE 254 EUROPE AEROSPACE AND DEFENCE IN BRAZE ALLOYS MARKET, BY METAL, 2014-2029 (USD MILLION)
TABLE 255 EUROPE ELECTRONICS AND ELECTRICAL BRAZE ALLOYS MARKET, BY METAL, 2014-2029 (USD MILLION)
TABLE 256 EUROPE BUILDING AND CONSTRUCTION IN BRAZE ALLOYS MARKET, BY METAL, 2014-2029 (USD MILLION)
TABLE 257 EUROPE CHEMICALS IN BRAZE ALLOYS MARKET, BY METAL, 2014-2029 (USD MILLION)
TABLE 258 EUROPE MARINE IN BRAZE ALLOYS MARKET, BY METAL, 2014-2029 (USD MILLION)
TABLE 259 EUROPE OTHERS IN BRAZE ALLOYS MARKET, BY METAL, 2014-2029 (USD MILLION)
TABLE 260 GERMANY BRAZE ALLOYS MARKET, BY METAL, 2014-2029 (USD MILLION)
TABLE 261 GERMANY BRAZE ALLOYS MARKET, BY METAL, 2014-2029 (TONS)
TABLE 262 GERMANY STEEL IN BRAZE ALLOYS MARKET, BY METAL, 2014-2029 (USD MILLION)
TABLE 263 GERMANY BRAZE ALLOYS MARKET, BY FILLER MATERIAL, 2014-2029 (USD MILLION)
TABLE 264 GERMANY BRAZE ALLOYS MARKET, BY TECHNOLOGY, 2014-2029 (USD MILLION)
TABLE 265 GERMANY BRAZE ALLOYS MARKET, BY FORM , 2014-2029 (USD MILLION)
TABLE 266 GERMANY BRAZE ALLOYS MARKET, BY PRODUCTION TEMPERATURE, 2014-2029 (USD MILLION)
TABLE 267 GERMANY BRAZE ALLOYS MARKET, BY END USE, 2014-2029 (USD MILLION)
TABLE 268 GERMANY AUTOMOTIVE IN BRAZE ALLOYS MARKET, BY METAL, 2014-2029 (USD MILLION)
TABLE 269 GERMANY AEROSPACE AND DEFENCE IN BRAZE ALLOYS MARKET, BY METAL, 2014-2029 (USD MILLION)
TABLE 270 GERMANY ELECTRONICS AND ELECTRICAL BRAZE ALLOYS MARKET, BY METAL, 2014-2029 (USD MILLION)
TABLE 271 GERMANY BUILDING AND CONSTRUCTION IN BRAZE ALLOYS MARKET, BY METAL, 2014-2029 (USD MILLION)
TABLE 272 GERMANY CHEMICALS IN BRAZE ALLOYS MARKET, BY METAL, 2014-2029 (USD MILLION)
TABLE 273 GERMANY MARINE IN BRAZE ALLOYS MARKET, BY METAL, 2014-2029 (USD MILLION)
TABLE 274 GERMANY OTHERS IN BRAZE ALLOYS MARKET, BY METAL, 2014-2029 (USD MILLION)
TABLE 275 U.K. BRAZE ALLOYS MARKET, BY METAL, 2014-2029 (USD MILLION)
TABLE 276 U.K. BRAZE ALLOYS MARKET, BY METAL, 2014-2029 (TONS)
TABLE 277 U.K. STEEL IN BRAZE ALLOYS MARKET, BY METAL, 2014-2029 (USD MILLION)
TABLE 278 U.K. BRAZE ALLOYS MARKET, BY FILLER MATERIAL, 2014-2029 (USD MILLION)
TABLE 279 U.K. BRAZE ALLOYS MARKET, BY TECHNOLOGY, 2014-2029 (USD MILLION)
TABLE 280 U.K. BRAZE ALLOYS MARKET, BY FORM , 2014-2029 (USD MILLION)
TABLE 281 U.K. BRAZE ALLOYS MARKET, BY PRODUCTION TEMPERATURE, 2014-2029 (USD MILLION)
TABLE 282 U.K. BRAZE ALLOYS MARKET, BY END USE, 2014-2029 (USD MILLION)
TABLE 283 U.K. AUTOMOTIVE IN BRAZE ALLOYS MARKET, BY METAL, 2014-2029 (USD MILLION)
TABLE 284 U.K. AEROSPACE AND DEFENCE IN BRAZE ALLOYS MARKET, BY METAL, 2014-2029 (USD MILLION)
TABLE 285 U.K. ELECTRONICS AND ELECTRICAL BRAZE ALLOYS MARKET, BY METAL, 2014-2029 (USD MILLION)
TABLE 286 U.K. BUILDING AND CONSTRUCTION IN BRAZE ALLOYS MARKET, BY METAL, 2014-2029 (USD MILLION)
TABLE 287 U.K. CHEMICALS IN BRAZE ALLOYS MARKET, BY METAL, 2014-2029 (USD MILLION)
TABLE 288 U.K. MARINE IN BRAZE ALLOYS MARKET, BY METAL, 2014-2029 (USD MILLION)
TABLE 289 U.K. OTHERS IN BRAZE ALLOYS MARKET, BY METAL, 2014-2029 (USD MILLION)
TABLE 290 FRANCE BRAZE ALLOYS MARKET, BY METAL, 2014-2029 (USD MILLION)
TABLE 291 FRANCE BRAZE ALLOYS MARKET, BY METAL, 2014-2029 (TONS)
TABLE 292 FRANCE STEEL IN BRAZE ALLOYS MARKET, BY METAL, 2014-2029 (USD MILLION)
TABLE 293 FRANCE BRAZE ALLOYS MARKET, BY FILLER MATERIAL, 2014-2029 (USD MILLION)
TABLE 294 FRANCE BRAZE ALLOYS MARKET, BY TECHNOLOGY, 2014-2029 (USD MILLION)
TABLE 295 FRANCE BRAZE ALLOYS MARKET, BY FORM , 2014-2029 (USD MILLION)
TABLE 296 FRANCE BRAZE ALLOYS MARKET, BY PRODUCTION TEMPERATURE, 2014-2029 (USD MILLION)
TABLE 297 FRANCE BRAZE ALLOYS MARKET, BY END USE, 2014-2029 (USD MILLION)
TABLE 298 FRANCE AUTOMOTIVE IN BRAZE ALLOYS MARKET, BY METAL, 2014-2029 (USD MILLION)
TABLE 299 FRANCE AEROSPACE AND DEFENCE IN BRAZE ALLOYS MARKET, BY METAL, 2014-2029 (USD MILLION)
TABLE 300 FRANCE ELECTRONICS AND ELECTRICAL BRAZE ALLOYS MARKET, BY METAL, 2014-2029 (USD MILLION)
TABLE 301 FRANCE BUILDING AND CONSTRUCTION IN BRAZE ALLOYS MARKET, BY METAL, 2014-2029 (USD MILLION)
TABLE 302 FRANCE CHEMICALS IN BRAZE ALLOYS MARKET, BY METAL, 2014-2029 (USD MILLION)
TABLE 303 FRANCE MARINE IN BRAZE ALLOYS MARKET, BY METAL, 2014-2029 (USD MILLION)
TABLE 304 FRANCE OTHERS IN BRAZE ALLOYS MARKET, BY METAL, 2014-2029 (USD MILLION)
TABLE 305 ITALY BRAZE ALLOYS MARKET, BY METAL, 2014-2029 (USD MILLION)
TABLE 306 ITALY BRAZE ALLOYS MARKET, BY METAL, 2014-2029 (TONS)
TABLE 307 ITALY STEEL IN BRAZE ALLOYS MARKET, BY METAL, 2014-2029 (USD MILLION)
TABLE 308 ITALY BRAZE ALLOYS MARKET, BY FILLER MATERIAL, 2014-2029 (USD MILLION)
TABLE 309 ITALY BRAZE ALLOYS MARKET, BY TECHNOLOGY, 2014-2029 (USD MILLION)
TABLE 310 ITALY BRAZE ALLOYS MARKET, BY FORM , 2014-2029 (USD MILLION)
TABLE 311 ITALY BRAZE ALLOYS MARKET, BY PRODUCTION TEMPERATURE, 2014-2029 (USD MILLION)
TABLE 312 ITALY BRAZE ALLOYS MARKET, BY END USE, 2014-2029 (USD MILLION)
TABLE 313 ITALY AUTOMOTIVE IN BRAZE ALLOYS MARKET, BY METAL, 2014-2029 (USD MILLION)
TABLE 314 ITALY AEROSPACE AND DEFENCE IN BRAZE ALLOYS MARKET, BY METAL, 2014-2029 (USD MILLION)
TABLE 315 ITALY ELECTRONICS AND ELECTRICAL BRAZE ALLOYS MARKET, BY METAL, 2014-2029 (USD MILLION)
TABLE 316 ITALY BUILDING AND CONSTRUCTION IN BRAZE ALLOYS MARKET, BY METAL, 2014-2029 (USD MILLION)
TABLE 317 ITALY CHEMICALS IN BRAZE ALLOYS MARKET, BY METAL, 2014-2029 (USD MILLION)
TABLE 318 ITALY MARINE IN BRAZE ALLOYS MARKET, BY METAL, 2014-2029 (USD MILLION)
TABLE 319 ITALY OTHERS IN BRAZE ALLOYS MARKET, BY METAL, 2014-2029 (USD MILLION)
TABLE 320 SPAIN BRAZE ALLOYS MARKET, BY METAL, 2014-2029 (USD MILLION)
TABLE 321 SPAIN BRAZE ALLOYS MARKET, BY METAL, 2014-2029 (TONS)
TABLE 322 SPAIN STEEL IN BRAZE ALLOYS MARKET, BY METAL, 2014-2029 (USD MILLION)
TABLE 323 SPAIN BRAZE ALLOYS MARKET, BY FILLER MATERIAL, 2014-2029 (USD MILLION)
TABLE 324 SPAIN BRAZE ALLOYS MARKET, BY TECHNOLOGY, 2014-2029 (USD MILLION)
TABLE 325 SPAIN BRAZE ALLOYS MARKET, BY FORM , 2014-2029 (USD MILLION)
TABLE 326 SPAIN BRAZE ALLOYS MARKET, BY PRODUCTION TEMPERATURE, 2014-2029 (USD MILLION)
TABLE 327 SPAIN BRAZE ALLOYS MARKET, BY END USE, 2014-2029 (USD MILLION)
TABLE 328 SPAIN AUTOMOTIVE IN BRAZE ALLOYS MARKET, BY METAL, 2014-2029 (USD MILLION)
TABLE 329 SPAIN AEROSPACE AND DEFENCE IN BRAZE ALLOYS MARKET, BY METAL, 2014-2029 (USD MILLION)
TABLE 330 SPAIN ELECTRONICS AND ELECTRICAL BRAZE ALLOYS MARKET, BY METAL, 2014-2029 (USD MILLION)
TABLE 331 SPAIN BUILDING AND CONSTRUCTION IN BRAZE ALLOYS MARKET, BY METAL, 2014-2029 (USD MILLION)
TABLE 332 SPAIN CHEMICALS IN BRAZE ALLOYS MARKET, BY METAL, 2014-2029 (USD MILLION)
TABLE 333 SPAIN MARINE IN BRAZE ALLOYS MARKET, BY METAL, 2014-2029 (USD MILLION)
TABLE 334 SPAIN OTHERS IN BRAZE ALLOYS MARKET, BY METAL, 2014-2029 (USD MILLION)
TABLE 335 NETHERLANDS BRAZE ALLOYS MARKET, BY METAL, 2014-2029 (USD MILLION)
TABLE 336 NETHERLANDS BRAZE ALLOYS MARKET, BY METAL, 2014-2029 (TONS)
TABLE 337 NETHERLANDS STEEL IN BRAZE ALLOYS MARKET, BY METAL, 2014-2029 (USD MILLION)
TABLE 338 NETHERLANDS BRAZE ALLOYS MARKET, BY FILLER MATERIAL, 2014-2029 (USD MILLION)
TABLE 339 NETHERLANDS BRAZE ALLOYS MARKET, BY TECHNOLOGY, 2014-2029 (USD MILLION)
TABLE 340 NETHERLANDS BRAZE ALLOYS MARKET, BY FORM , 2014-2029 (USD MILLION)
TABLE 341 NETHERLANDS BRAZE ALLOYS MARKET, BY PRODUCTION TEMPERATURE, 2014-2029 (USD MILLION)
TABLE 342 NETHERLANDS BRAZE ALLOYS MARKET, BY END USE, 2014-2029 (USD MILLION)
TABLE 343 NETHERLANDS AUTOMOTIVE IN BRAZE ALLOYS MARKET, BY METAL, 2014-2029 (USD MILLION)
TABLE 344 NETHERLANDS AEROSPACE AND DEFENCE IN BRAZE ALLOYS MARKET, BY METAL, 2014-2029 (USD MILLION)
TABLE 345 NETHERLANDS ELECTRONICS AND ELECTRICAL BRAZE ALLOYS MARKET, BY METAL, 2014-2029 (USD MILLION)
TABLE 346 NETHERLANDS BUILDING AND CONSTRUCTION IN BRAZE ALLOYS MARKET, BY METAL, 2014-2029 (USD MILLION)
TABLE 347 NETHERLANDS CHEMICALS IN BRAZE ALLOYS MARKET, BY METAL, 2014-2029 (USD MILLION)
TABLE 348 NETHERLANDS MARINE IN BRAZE ALLOYS MARKET, BY METAL, 2014-2029 (USD MILLION)
TABLE 349 NETHERLANDS OTHERS IN BRAZE ALLOYS MARKET, BY METAL, 2014-2029 (USD MILLION)
TABLE 350 BELGIUM BRAZE ALLOYS MARKET, BY METAL, 2014-2029 (USD MILLION)
TABLE 351 BELGIUM BRAZE ALLOYS MARKET, BY METAL, 2014-2029 (TONS)
TABLE 352 BELGIUM STEEL IN BRAZE ALLOYS MARKET, BY METAL, 2014-2029 (USD MILLION)
TABLE 353 BELGIUM BRAZE ALLOYS MARKET, BY FILLER MATERIAL, 2014-2029 (USD MILLION)
TABLE 354 BELGIUM BRAZE ALLOYS MARKET, BY TECHNOLOGY, 2014-2029 (USD MILLION)
TABLE 355 BELGIUM BRAZE ALLOYS MARKET, BY FORM , 2014-2029 (USD MILLION)
TABLE 356 BELGIUM BRAZE ALLOYS MARKET, BY PRODUCTION TEMPERATURE, 2014-2029 (USD MILLION)
TABLE 357 BELGIUM BRAZE ALLOYS MARKET, BY END USE, 2014-2029 (USD MILLION)
TABLE 358 BELGIUM AUTOMOTIVE IN BRAZE ALLOYS MARKET, BY METAL, 2014-2029 (USD MILLION)
TABLE 359 BELGIUM AEROSPACE AND DEFENCE IN BRAZE ALLOYS MARKET, BY METAL, 2014-2029 (USD MILLION)
TABLE 360 BELGIUM ELECTRONICS AND ELECTRICAL BRAZE ALLOYS MARKET, BY METAL, 2014-2029 (USD MILLION)
TABLE 361 BELGIUM BUILDING AND CONSTRUCTION IN BRAZE ALLOYS MARKET, BY METAL, 2014-2029 (USD MILLION)
TABLE 362 BELGIUM CHEMICALS IN BRAZE ALLOYS MARKET, BY METAL, 2014-2029 (USD MILLION)
TABLE 363 BELGIUM MARINE IN BRAZE ALLOYS MARKET, BY METAL, 2014-2029 (USD MILLION)
TABLE 364 BELGIUM OTHERS IN BRAZE ALLOYS MARKET, BY METAL, 2014-2029 (USD MILLION)
TABLE 365 SWITZERLAND BRAZE ALLOYS MARKET, BY METAL, 2014-2029 (USD MILLION)
TABLE 366 SWITZERLAND BRAZE ALLOYS MARKET, BY METAL, 2014-2029 (TONS)
TABLE 367 SWITZERLAND STEEL IN BRAZE ALLOYS MARKET, BY METAL, 2014-2029 (USD MILLION)
TABLE 368 SWITZERLAND BRAZE ALLOYS MARKET, BY FILLER MATERIAL, 2014-2029 (USD MILLION)
TABLE 369 SWITZERLAND BRAZE ALLOYS MARKET, BY TECHNOLOGY, 2014-2029 (USD MILLION)
TABLE 370 SWITZERLAND BRAZE ALLOYS MARKET, BY FORM , 2014-2029 (USD MILLION)
TABLE 371 SWITZERLAND BRAZE ALLOYS MARKET, BY PRODUCTION TEMPERATURE, 2014-2029 (USD MILLION)
TABLE 372 SWITZERLAND BRAZE ALLOYS MARKET, BY END USE, 2014-2029 (USD MILLION)
TABLE 373 SWITZERLAND AUTOMOTIVE IN BRAZE ALLOYS MARKET, BY METAL, 2014-2029 (USD MILLION)
TABLE 374 SWITZERLAND AEROSPACE AND DEFENCE IN BRAZE ALLOYS MARKET, BY METAL, 2014-2029 (USD MILLION)
TABLE 375 SWITZERLAND ELECTRONICS AND ELECTRICAL BRAZE ALLOYS MARKET, BY METAL, 2014-2029 (USD MILLION)
TABLE 376 SWITZERLAND BUILDING AND CONSTRUCTION IN BRAZE ALLOYS MARKET, BY METAL, 2014-2029 (USD MILLION)
TABLE 377 SWITZERLAND CHEMICALS IN BRAZE ALLOYS MARKET, BY METAL, 2014-2029 (USD MILLION)
TABLE 378 SWITZERLAND MARINE IN BRAZE ALLOYS MARKET, BY METAL, 2014-2029 (USD MILLION)
TABLE 379 SWITZERLAND OTHERS IN BRAZE ALLOYS MARKET, BY METAL, 2014-2029 (USD MILLION)
TABLE 380 RUSSIA BRAZE ALLOYS MARKET, BY METAL, 2014-2029 (USD MILLION)
TABLE 381 RUSSIA BRAZE ALLOYS MARKET, BY METAL, 2014-2029 (TONS)
TABLE 382 RUSSIA STEEL IN BRAZE ALLOYS MARKET, BY METAL, 2014-2029 (USD MILLION)
TABLE 383 RUSSIA BRAZE ALLOYS MARKET, BY FILLER MATERIAL, 2014-2029 (USD MILLION)
TABLE 384 RUSSIA BRAZE ALLOYS MARKET, BY TECHNOLOGY, 2014-2029 (USD MILLION)
TABLE 385 RUSSIA BRAZE ALLOYS MARKET, BY FORM , 2014-2029 (USD MILLION)
TABLE 386 RUSSIA BRAZE ALLOYS MARKET, BY PRODUCTION TEMPERATURE, 2014-2029 (USD MILLION)
TABLE 387 RUSSIA BRAZE ALLOYS MARKET, BY END USE, 2014-2029 (USD MILLION)
TABLE 388 RUSSIA AUTOMOTIVE IN BRAZE ALLOYS MARKET, BY METAL, 2014-2029 (USD MILLION)
TABLE 389 RUSSIA AEROSPACE AND DEFENCE IN BRAZE ALLOYS MARKET, BY METAL, 2014-2029 (USD MILLION)
TABLE 390 RUSSIA ELECTRONICS AND ELECTRICAL BRAZE ALLOYS MARKET, BY METAL, 2014-2029 (USD MILLION)
TABLE 391 RUSSIA BUILDING AND CONSTRUCTION IN BRAZE ALLOYS MARKET, BY METAL, 2014-2029 (USD MILLION)
TABLE 392 RUSSIA CHEMICALS IN BRAZE ALLOYS MARKET, BY METAL, 2014-2029 (USD MILLION)
TABLE 393 RUSSIA MARINE IN BRAZE ALLOYS MARKET, BY METAL, 2014-2029 (USD MILLION)
TABLE 394 RUSSIA OTHERS IN BRAZE ALLOYS MARKET, BY METAL, 2014-2029 (USD MILLION)
TABLE 395 TURKEY BRAZE ALLOYS MARKET, BY METAL, 2014-2029 (USD MILLION)
TABLE 396 TURKEY BRAZE ALLOYS MARKET, BY METAL, 2014-2029 (TONS)
TABLE 397 TURKEY STEEL IN BRAZE ALLOYS MARKET, BY METAL, 2014-2029 (USD MILLION)
TABLE 398 TURKEY BRAZE ALLOYS MARKET, BY FILLER MATERIAL, 2014-2029 (USD MILLION)
TABLE 399 TURKEY BRAZE ALLOYS MARKET, BY TECHNOLOGY, 2014-2029 (USD MILLION)
TABLE 400 TURKEY BRAZE ALLOYS MARKET, BY FORM , 2014-2029 (USD MILLION)
TABLE 401 TURKEY BRAZE ALLOYS MARKET, BY PRODUCTION TEMPERATURE, 2014-2029 (USD MILLION)
TABLE 402 TURKEY BRAZE ALLOYS MARKET, BY END USE, 2014-2029 (USD MILLION)
TABLE 403 TURKEY AUTOMOTIVE IN BRAZE ALLOYS MARKET, BY METAL, 2014-2029 (USD MILLION)
TABLE 404 TURKEY AEROSPACE AND DEFENCE IN BRAZE ALLOYS MARKET, BY METAL, 2014-2029 (USD MILLION)
TABLE 405 TURKEY ELECTRONICS AND ELECTRICAL BRAZE ALLOYS MARKET, BY METAL, 2014-2029 (USD MILLION)
TABLE 406 TURKEY BUILDING AND CONSTRUCTION IN BRAZE ALLOYS MARKET, BY METAL, 2014-2029 (USD MILLION)
TABLE 407 TURKEY CHEMICALS IN BRAZE ALLOYS MARKET, BY METAL, 2014-2029 (USD MILLION)
TABLE 408 TURKEY MARINE IN BRAZE ALLOYS MARKET, BY METAL, 2014-2029 (USD MILLION)
TABLE 409 TURKEY OTHERS IN BRAZE ALLOYS MARKET, BY METAL, 2014-2029 (USD MILLION)
TABLE 410 REST OF EUROPE BRAZE ALLOYS MARKET, BY METAL, 2014-2029 (USD MILLION)
TABLE 411 REST OF EUROPE BRAZE ALLOYS MARKET, BY METAL, 2014-2029 (TONS)
TABLE 412 NORTH AMERICA BRAZE ALLOYS MARKET, BY COUNTRY, 2014-2029 (USD MILLION)
TABLE 413 NORTH AMERICA BRAZE ALLOYS MARKET, BY COUNTRY, 2014-2029 (TONS)
TABLE 414 NORTH AMERICA BRAZE ALLOYS MARKET, BY METAL, 2014-2029 (USD MILLION)
TABLE 415 NORTH AMERICA BRAZE ALLOYS MARKET, BY METAL, 2014-2029 (TONS)
TABLE 416 NORTH AMERICA STEEL IN BRAZE ALLOYS MARKET, BY METAL, 2014-2029 (USD MILLION)
TABLE 417 NORTH AMERICA BRAZE ALLOYS MARKET, BY FILLER MATERIAL, 2014-2029 (USD MILLION)
TABLE 418 NORTH AMERICA BRAZE ALLOYS MARKET, BY TECHNOLOGY, 2014-2029 (USD MILLION)
TABLE 419 NORTH AMERICA BRAZE ALLOYS MARKET, BY FORM, 2014-2029 (USD MILLION)
TABLE 420 NORTH AMERICA BRAZE ALLOYS MARKET, BY PRODUCTION TEMPERATURE, 2014-2029 (USD MILLION)
TABLE 421 NORTH AMERICA BRAZE ALLOYS MARKET, BY END USE, 2014-2029 (USD MILLION)
TABLE 422 NORTH AMERICA AUTOMOTIVE IN BRAZE ALLOYS MARKET, BY METAL, 2014-2029 (USD MILLION)
TABLE 423 NORTH AMERICA AEROSPACE AND DEFENCE IN BRAZE ALLOYS MARKET, BY METAL, 2014-2029 (USD MILLION)
TABLE 424 NORTH AMERICA ELECTRONICS AND ELECTRICAL BRAZE ALLOYS MARKET, BY METAL, 2014-2029 (USD MILLION)
TABLE 425 NORTH AMERICA BUILDING AND CONSTRUCTION IN BRAZE ALLOYS MARKET, BY METAL, 2014-2029 (USD MILLION)
TABLE 426 NORTH AMERICA CHEMICALS IN BRAZE ALLOYS MARKET, BY METAL, 2014-2029 (USD MILLION)
TABLE 427 NORTH AMERICA MARINE IN BRAZE ALLOYS MARKET, BY METAL, 2014-2029 (USD MILLION)
TABLE 428 NORTH AMERICA OTHERS IN BRAZE ALLOYS MARKET, BY METAL, 2014-2029 (USD MILLION)
TABLE 429 U.S. BRAZE ALLOYS MARKET, BY METAL, 2014-2029 (USD MILLION)
TABLE 430 U.S. BRAZE ALLOYS MARKET, BY METAL, 2014-2029 (TONS)
TABLE 431 U.S. STEEL IN BRAZE ALLOYS MARKET, BY METAL, 2014-2029 (USD MILLION)
TABLE 432 U.S. BRAZE ALLOYS MARKET, BY FILLER MATERIAL, 2014-2029 (USD MILLION)
TABLE 433 U.S. BRAZE ALLOYS MARKET, BY TECHNOLOGY, 2014-2029 (USD MILLION)
TABLE 434 U.S. BRAZE ALLOYS MARKET, BY FORM, 2014-2029 (USD MILLION)
TABLE 435 U.S. BRAZE ALLOYS MARKET, BY PRODUCTION TEMPERATURE, 2014-2029 (USD MILLION)
TABLE 436 U.S. BRAZE ALLOYS MARKET, BY END USE, 2014-2029 (USD MILLION)
TABLE 437 U.S. AUTOMOTIVE IN BRAZE ALLOYS MARKET, BY METAL, 2014-2029 (USD MILLION)
TABLE 438 U.S. AEROSPACE AND DEFENCE IN BRAZE ALLOYS MARKET, BY METAL, 2014-2029 (USD MILLION)
TABLE 439 U.S. ELECTRONICS AND ELECTRICAL BRAZE ALLOYS MARKET, BY METAL, 2014-2029 (USD MILLION)
TABLE 440 U.S. BUILDING AND CONSTRUCTION IN BRAZE ALLOYS MARKET, BY METAL, 2014-2029 (USD MILLION)
TABLE 441 U.S. CHEMICALS IN BRAZE ALLOYS MARKET, BY METAL, 2014-2029 (USD MILLION)
TABLE 442 U.S. MARINE IN BRAZE ALLOYS MARKET, BY METAL, 2014-2029 (USD MILLION)
TABLE 443 U.S. OTHERS IN BRAZE ALLOYS MARKET, BY METAL, 2014-2029 (USD MILLION)
TABLE 444 CANADA BRAZE ALLOYS MARKET, BY METAL, 2014-2029 (USD MILLION)
TABLE 445 CANADA BRAZE ALLOYS MARKET, BY METAL, 2014-2029 (TONS)
TABLE 446 CANADA STEEL IN BRAZE ALLOYS MARKET, BY METAL, 2014-2029 (USD MILLION)
TABLE 447 CANADA BRAZE ALLOYS MARKET, BY FILLER MATERIAL, 2014-2029 (USD MILLION)
TABLE 448 CANADA BRAZE ALLOYS MARKET, BY TECHNOLOGY, 2014-2029 (USD MILLION)
TABLE 449 CANADA BRAZE ALLOYS MARKET, BY FORM, 2014-2029 (USD MILLION)
TABLE 450 CANADA BRAZE ALLOYS MARKET, BY PRODUCTION TEMPERATURE, 2014-2029 (USD MILLION)
TABLE 451 CANADA BRAZE ALLOYS MARKET, BY END USE, 2014-2029 (USD MILLION)
TABLE 452 CANADA AUTOMOTIVE IN BRAZE ALLOYS MARKET, BY METAL, 2014-2029 (USD MILLION)
TABLE 453 CANADA AEROSPACE AND DEFENCE IN BRAZE ALLOYS MARKET, BY METAL, 2014-2029 (USD MILLION)
TABLE 454 CANADA ELECTRONICS AND ELECTRICAL BRAZE ALLOYS MARKET, BY METAL, 2014-2029 (USD MILLION)
TABLE 455 CANADA BUILDING AND CONSTRUCTION IN BRAZE ALLOYS MARKET, BY METAL, 2014-2029 (USD MILLION)
TABLE 456 CANADA CHEMICALS IN BRAZE ALLOYS MARKET, BY METAL, 2014-2029 (USD MILLION)
TABLE 457 CANADA MARINE IN BRAZE ALLOYS MARKET, BY METAL, 2014-2029 (USD MILLION)
TABLE 458 CANADA OTHERS IN BRAZE ALLOYS MARKET, BY METAL, 2014-2029 (USD MILLION)
TABLE 459 MEXICO BRAZE ALLOYS MARKET, BY METAL, 2014-2029 (USD MILLION)
TABLE 460 MEXICO BRAZE ALLOYS MARKET, BY METAL, 2014-2029 (TONS)
TABLE 461 MEXICO STEEL IN BRAZE ALLOYS MARKET, BY METAL, 2014-2029 (USD MILLION)
TABLE 462 MEXICO BRAZE ALLOYS MARKET, BY FILLER MATERIAL, 2014-2029 (USD MILLION)
TABLE 463 MEXICO BRAZE ALLOYS MARKET, BY TECHNOLOGY, 2014-2029 (USD MILLION)
TABLE 464 MEXICO BRAZE ALLOYS MARKET, BY FORM, 2014-2029 (USD MILLION)
TABLE 465 MEXICO BRAZE ALLOYS MARKET, BY PRODUCTION TEMPERATURE, 2014-2029 (USD MILLION)
TABLE 466 MEXICO BRAZE ALLOYS MARKET, BY END USE, 2014-2029 (USD MILLION)
TABLE 467 MEXICO AUTOMOTIVE IN BRAZE ALLOYS MARKET, BY METAL, 2014-2029 (USD MILLION)
TABLE 468 MEXICO AEROSPACE AND DEFENCE IN BRAZE ALLOYS MARKET, BY METAL, 2014-2029 (USD MILLION)
TABLE 469 MEXICO ELECTRONICS AND ELECTRICAL BRAZE ALLOYS MARKET, BY METAL, 2014-2029 (USD MILLION)
TABLE 470 MEXICO BUILDING AND CONSTRUCTION IN BRAZE ALLOYS MARKET, BY METAL, 2014-2029 (USD MILLION)
TABLE 471 MEXICO CHEMICALS IN BRAZE ALLOYS MARKET, BY METAL, 2014-2029 (USD MILLION)
TABLE 472 MEXICO MARINE IN BRAZE ALLOYS MARKET, BY METAL, 2014-2029 (USD MILLION)
TABLE 473 MEXICO OTHERS IN BRAZE ALLOYS MARKET, BY METAL, 2014-2029 (USD MILLION)
TABLE 474 SOUTH AMERICA BRAZE ALLOYS MARKET, BY COUNTRY, 2014-2029 (USD MILLION)
TABLE 475 SOUTH AMERICA BRAZE ALLOYS MARKET, BY COUNTRY, 2014-2029 (TONS)
TABLE 476 SOUTH AMERICA BRAZE ALLOYS MARKET, BY METAL, 2014-2029 (USD MILLION)
TABLE 477 SOUTH AMERICA BRAZE ALLOYS MARKET, BY METAL, 2014-2029 (TONS)
TABLE 478 SOUTH AMERICA STEEL IN BRAZE ALLOYS MARKET, BY METAL, 2014-2029 (USD MILLION)
TABLE 479 SOUTH AMERICA BRAZE ALLOYS MARKET, BY FILLER MATERIAL, 2014-2029 (USD MILLION)
TABLE 480 SOUTH AMERICA BRAZE ALLOYS MARKET, BY TECHNOLOGY, 2014-2029 (USD MILLION)
TABLE 481 SOUTH AMERICA BRAZE ALLOYS MARKET, BY FORM, 2014-2029 (USD MILLION)
TABLE 482 SOUTH AMERICA BRAZE ALLOYS MARKET, BY PRODUCTION TEMPERATURE, 2014-2029 (USD MILLION)
TABLE 483 SOUTH AMERICA BRAZE ALLOYS MARKET, BY END USE, 2014-2029 (USD MILLION)
TABLE 484 SOUTH AMERICA AUTOMOTIVE IN BRAZE ALLOYS MARKET, BY METAL, 2014-2029 (USD MILLION)
TABLE 485 SOUTH AMERICA AEROSPACE AND DEFENCE IN BRAZE ALLOYS MARKET, BY METAL, 2014-2029 (USD MILLION)
TABLE 486 SOUTH AMERICA ELECTRONICS AND ELECTRICAL BRAZE ALLOYS MARKET, BY METAL, 2014-2029 (USD MILLION)
TABLE 487 SOUTH AMERICA BUILDING AND CONSTRUCTION IN BRAZE ALLOYS MARKET, BY METAL, 2014-2029 (USD MILLION)
TABLE 488 SOUTH AMERICA CHEMICALS IN BRAZE ALLOYS MARKET, BY METAL, 2014-2029 (USD MILLION)
TABLE 489 SOUTH AMERICA MARINE IN BRAZE ALLOYS MARKET, BY METAL, 2014-2029 (USD MILLION)
TABLE 490 SOUTH AMERICA OTHERS IN BRAZE ALLOYS MARKET, BY METAL, 2014-2029 (USD MILLION)
TABLE 491 BRAZIL BRAZE ALLOYS MARKET, BY METAL, 2014-2029 (USD MILLION)
TABLE 492 BRAZIL BRAZE ALLOYS MARKET, BY METAL, 2014-2029 (TONS)
TABLE 493 BRAZIL STEEL IN BRAZE ALLOYS MARKET, BY METAL, 2014-2029 (USD MILLION)
TABLE 494 BRAZIL BRAZE ALLOYS MARKET, BY FILLER MATERIAL, 2014-2029 (USD MILLION)
TABLE 495 BRAZIL BRAZE ALLOYS MARKET, BY TECHNOLOGY, 2014-2029 (USD MILLION)
TABLE 496 BRAZIL BRAZE ALLOYS MARKET, BY FORM, 2014-2029 (USD MILLION)
TABLE 497 BRAZIL BRAZE ALLOYS MARKET, BY PRODUCTION TEMPERATURE, 2014-2029 (USD MILLION)
TABLE 498 BRAZIL BRAZE ALLOYS MARKET, BY END USE, 2014-2029 (USD MILLION)
TABLE 499 BRAZIL AUTOMOTIVE IN BRAZE ALLOYS MARKET, BY METAL, 2014-2029 (USD MILLION)
TABLE 500 BRAZIL AEROSPACE AND DEFENCE IN BRAZE ALLOYS MARKET, BY METAL, 2014-2029 (USD MILLION)
TABLE 501 BRAZIL ELECTRONICS AND ELECTRICAL BRAZE ALLOYS MARKET, BY METAL, 2014-2029 (USD MILLION)
TABLE 502 BRAZIL BUILDING AND CONSTRUCTION IN BRAZE ALLOYS MARKET, BY METAL, 2014-2029 (USD MILLION)
TABLE 503 BRAZIL CHEMICALS IN BRAZE ALLOYS MARKET, BY METAL, 2014-2029 (USD MILLION)
TABLE 504 BRAZIL MARINE IN BRAZE ALLOYS MARKET, BY METAL, 2014-2029 (USD MILLION)
TABLE 505 BRAZIL OTHERS IN BRAZE ALLOYS MARKET, BY METAL, 2014-2029 (USD MILLION)
TABLE 506 ARGENTINA BRAZE ALLOYS MARKET, BY METAL, 2014-2029 (USD MILLION)
TABLE 507 ARGENTINA BRAZE ALLOYS MARKET, BY METAL, 2014-2029 (TONS)
TABLE 508 ARGENTINA STEEL IN BRAZE ALLOYS MARKET, BY METAL, 2014-2029 (USD MILLION)
TABLE 509 ARGENTINA BRAZE ALLOYS MARKET, BY FILLER MATERIAL, 2014-2029 (USD MILLION)
TABLE 510 ARGENTINA BRAZE ALLOYS MARKET, BY TECHNOLOGY, 2014-2029 (USD MILLION)
TABLE 511 ARGENTINA BRAZE ALLOYS MARKET, BY FORM, 2014-2029 (USD MILLION)
TABLE 512 ARGENTINA BRAZE ALLOYS MARKET, BY PRODUCTION TEMPERATURE, 2014-2029 (USD MILLION)
TABLE 513 ARGENTINA BRAZE ALLOYS MARKET, BY END USE, 2014-2029 (USD MILLION)
TABLE 514 ARGENTINA AUTOMOTIVE IN BRAZE ALLOYS MARKET, BY METAL, 2014-2029 (USD MILLION)
TABLE 515 ARGENTINA AEROSPACE AND DEFENCE IN BRAZE ALLOYS MARKET, BY METAL, 2014-2029 (USD MILLION)
TABLE 516 ARGENTINA ELECTRONICS AND ELECTRICAL BRAZE ALLOYS MARKET, BY METAL, 2014-2029 (USD MILLION)
TABLE 517 ARGENTINA BUILDING AND CONSTRUCTION IN BRAZE ALLOYS MARKET, BY METAL, 2014-2029 (USD MILLION)
TABLE 518 ARGENTINA CHEMICALS IN BRAZE ALLOYS MARKET, BY METAL, 2014-2029 (USD MILLION)
TABLE 519 ARGENTINA MARINE IN BRAZE ALLOYS MARKET, BY METAL, 2014-2029 (USD MILLION)
TABLE 520 ARGENTINA OTHERS IN BRAZE ALLOYS MARKET, BY METAL, 2014-2029 (USD MILLION)
TABLE 521 REST OF SOUTH AMERICA BRAZE ALLOYS MARKET, BY METAL, 2014-2029 (USD MILLION)
TABLE 522 REST OF SOUTH AMERICA BRAZE ALLOYS MARKET, BY METAL, 2014-2029 (TONS)
TABLE 523 MIDDLE EAST AND AFRICA BRAZE ALLOYS MARKET, BY COUNTRY, 2014-2029 (USD MILLION)
TABLE 524 MIDDLE EAST AND AFRICA BRAZE ALLOYS MARKET, BY COUNTRY, 2014-2029 (TONS)
TABLE 525 MIDDLE EAST AND AFRICA BRAZE ALLOYS MARKET, BY METAL, 2014-2029 (USD MILLION)
TABLE 526 MIDDLE EAST AND AFRICA BRAZE ALLOYS MARKET, BY METAL, 2014-2029 (TONS)
TABLE 527 MIDDLE EAST AND AFRICA STEEL IN BRAZE ALLOYS MARKET, BY METAL, 2014-2029 (USD MILLION)
TABLE 528 MIDDLE EAST AND AFRICA BRAZE ALLOYS MARKET, BY FILLER MATERIAL, 2014-2029 (USD MILLION)
TABLE 529 MIDDLE EAST AND AFRICA BRAZE ALLOYS MARKET, BY TECHNOLOGY, 2014-2029 (USD MILLION)
TABLE 530 MIDDLE EAST AND AFRICA BRAZE ALLOYS MARKET, BY FORM , 2014-2029 (USD MILLION)
TABLE 531 MIDDLE EAST AND AFRICA BRAZE ALLOYS MARKET, BY PRODUCTION TEMPERATURE, 2014-2029 (USD MILLION)
TABLE 532 MIDDLE EAST AND AFRICA BRAZE ALLOYS MARKET, BY END USE, 2014-2029 (USD MILLION)
TABLE 533 MIDDLE EAST AND AFRICA AUTOMOTIVE IN BRAZE ALLOYS MARKET, BY METAL, 2014-2029 (USD MILLION)
TABLE 534 MIDDLE EAST AND AFRICA AEROSPACE AND DEFENCE IN BRAZE ALLOYS MARKET, BY METAL, 2014-2029 (USD MILLION)
TABLE 535 MIDDLE EAST AND AFRICA ELECTRONICS AND ELECTRICAL BRAZE ALLOYS MARKET, BY METAL, 2014-2029 (USD MILLION)
TABLE 536 MIDDLE EAST AND AFRICA BUILDING AND CONSTRUCTION IN BRAZE ALLOYS MARKET, BY METAL, 2014-2029 (USD MILLION)
TABLE 537 MIDDLE EAST AND AFRICA CHEMICALS IN BRAZE ALLOYS MARKET, BY METAL, 2014-2029 (USD MILLION)
TABLE 538 MIDDLE EAST AND AFRICA MARINE IN BRAZE ALLOYS MARKET, BY METAL, 2014-2029 (USD MILLION)
TABLE 539 MIDDLE EAST AND AFRICA OTHERS IN BRAZE ALLOYS MARKET, BY METAL, 2014-2029 (USD MILLION)
TABLE 540 SOUTH AFRICA BRAZE ALLOYS MARKET, BY METAL, 2014-2029 (USD MILLION)
TABLE 541 SOUTH AFRICA BRAZE ALLOYS MARKET, BY METAL, 2014-2029 (TONS)
TABLE 542 SOUTH AFRICA STEEL IN BRAZE ALLOYS MARKET, BY METAL, 2014-2029 (USD MILLION)
TABLE 543 SOUTH AFRICA BRAZE ALLOYS MARKET, BY FILLER MATERIAL, 2014-2029 (USD MILLION)
TABLE 544 SOUTH AFRICA BRAZE ALLOYS MARKET, BY TECHNOLOGY, 2014-2029 (USD MILLION)
TABLE 545 SOUTH AFRICA BRAZE ALLOYS MARKET, BY FORM , 2014-2029 (USD MILLION)
TABLE 546 SOUTH AFRICA BRAZE ALLOYS MARKET, BY PRODUCTION TEMPERATURE, 2014-2029 (USD MILLION)
TABLE 547 SOUTH AFRICA BRAZE ALLOYS MARKET, BY END USE, 2014-2029 (USD MILLION)
TABLE 548 SOUTH AFRICA AUTOMOTIVE IN BRAZE ALLOYS MARKET, BY METAL, 2014-2029 (USD MILLION)
TABLE 549 SOUTH AFRICA AEROSPACE AND DEFENCE IN BRAZE ALLOYS MARKET, BY METAL, 2014-2029 (USD MILLION)
TABLE 550 SOUTH AFRICA ELECTRONICS AND ELECTRICAL BRAZE ALLOYS MARKET, BY METAL, 2014-2029 (USD MILLION)
TABLE 551 SOUTH AFRICA BUILDING AND CONSTRUCTION IN BRAZE ALLOYS MARKET, BY METAL, 2014-2029 (USD MILLION)
TABLE 552 SOUTH AFRICA CHEMICALS IN BRAZE ALLOYS MARKET, BY METAL, 2014-2029 (USD MILLION)
TABLE 553 SOUTH AFRICA MARINE IN BRAZE ALLOYS MARKET, BY METAL, 2014-2029 (USD MILLION)
TABLE 554 SOUTH AFRICA OTHERS IN BRAZE ALLOYS MARKET, BY METAL, 2014-2029 (USD MILLION)
TABLE 555 U.A.E. BRAZE ALLOYS MARKET, BY METAL, 2014-2029 (USD MILLION)
TABLE 556 U.A.E. BRAZE ALLOYS MARKET, BY METAL, 2014-2029 (TONS)
TABLE 557 U.A.E. STEEL IN BRAZE ALLOYS MARKET, BY METAL, 2014-2029 (USD MILLION)
TABLE 558 U.A.E. BRAZE ALLOYS MARKET, BY FILLER MATERIAL, 2014-2029 (USD MILLION)
TABLE 559 U.A.E. BRAZE ALLOYS MARKET, BY TECHNOLOGY, 2014-2029 (USD MILLION)
TABLE 560 U.A.E. BRAZE ALLOYS MARKET, BY FORM , 2014-2029 (USD MILLION)
TABLE 561 U.A.E. BRAZE ALLOYS MARKET, BY PRODUCTION TEMPERATURE, 2014-2029 (USD MILLION)
TABLE 562 U.A.E. BRAZE ALLOYS MARKET, BY END USE, 2014-2029 (USD MILLION)
TABLE 563 U.A.E. AUTOMOTIVE IN BRAZE ALLOYS MARKET, BY METAL, 2014-2029 (USD MILLION)
TABLE 564 U.A.E. AEROSPACE AND DEFENCE IN BRAZE ALLOYS MARKET, BY METAL, 2014-2029 (USD MILLION)
TABLE 565 U.A.E. ELECTRONICS AND ELECTRICAL BRAZE ALLOYS MARKET, BY METAL, 2014-2029 (USD MILLION)
TABLE 566 U.A.E. BUILDING AND CONSTRUCTION IN BRAZE ALLOYS MARKET, BY METAL, 2014-2029 (USD MILLION)
TABLE 567 U.A.E. CHEMICALS IN BRAZE ALLOYS MARKET, BY METAL, 2014-2029 (USD MILLION)
TABLE 568 U.A.E. MARINE IN BRAZE ALLOYS MARKET, BY METAL, 2014-2029 (USD MILLION)
TABLE 569 U.A.E. OTHERS IN BRAZE ALLOYS MARKET, BY METAL, 2014-2029 (USD MILLION)
TABLE 570 SAUDI ARABIA BRAZE ALLOYS MARKET, BY METAL, 2014-2029 (USD MILLION)
TABLE 571 SAUDI ARABIA BRAZE ALLOYS MARKET, BY METAL, 2014-2029 (TONS)
TABLE 572 SAUDI ARABIA STEEL IN BRAZE ALLOYS MARKET, BY METAL, 2014-2029 (USD MILLION)
TABLE 573 SAUDI ARABIA BRAZE ALLOYS MARKET, BY FILLER MATERIAL, 2014-2029 (USD MILLION)
TABLE 574 SAUDI ARABIA BRAZE ALLOYS MARKET, BY TECHNOLOGY, 2014-2029 (USD MILLION)
TABLE 575 SAUDI ARABIA BRAZE ALLOYS MARKET, BY FORM , 2014-2029 (USD MILLION)
TABLE 576 SAUDI ARABIA BRAZE ALLOYS MARKET, BY PRODUCTION TEMPERATURE, 2014-2029 (USD MILLION)
TABLE 577 SAUDI ARABIA BRAZE ALLOYS MARKET, BY END USE, 2014-2029 (USD MILLION)
TABLE 578 SAUDI ARABIA AUTOMOTIVE IN BRAZE ALLOYS MARKET, BY METAL, 2014-2029 (USD MILLION)
TABLE 579 SAUDI ARABIA AEROSPACE AND DEFENCE IN BRAZE ALLOYS MARKET, BY METAL, 2014-2029 (USD MILLION)
TABLE 580 SAUDI ARABIA ELECTRONICS AND ELECTRICAL BRAZE ALLOYS MARKET, BY METAL, 2014-2029 (USD MILLION)
TABLE 581 SAUDI ARABIA BUILDING AND CONSTRUCTION IN BRAZE ALLOYS MARKET, BY METAL, 2014-2029 (USD MILLION)
TABLE 582 SAUDI ARABIA CHEMICALS IN BRAZE ALLOYS MARKET, BY METAL, 2014-2029 (USD MILLION)
TABLE 583 SAUDI ARABIA MARINE IN BRAZE ALLOYS MARKET, BY METAL, 2014-2029 (USD MILLION)
TABLE 584 SAUDI ARABIA OTHERS IN BRAZE ALLOYS MARKET, BY METAL, 2014-2029 (USD MILLION)
TABLE 585 EGYPT BRAZE ALLOYS MARKET, BY METAL, 2014-2029 (USD MILLION)
TABLE 586 EGYPT BRAZE ALLOYS MARKET, BY METAL, 2014-2029 (TONS)
TABLE 587 EGYPT STEEL IN BRAZE ALLOYS MARKET, BY METAL, 2014-2029 (USD MILLION)
TABLE 588 EGYPT BRAZE ALLOYS MARKET, BY FILLER MATERIAL, 2014-2029 (USD MILLION)
TABLE 589 EGYPT BRAZE ALLOYS MARKET, BY TECHNOLOGY, 2014-2029 (USD MILLION)
TABLE 590 EGYPT BRAZE ALLOYS MARKET, BY FORM , 2014-2029 (USD MILLION)
TABLE 591 EGYPT BRAZE ALLOYS MARKET, BY PRODUCTION TEMPERATURE, 2014-2029 (USD MILLION)
TABLE 592 EGYPT BRAZE ALLOYS MARKET, BY END USE, 2014-2029 (USD MILLION)
TABLE 593 EGYPT AUTOMOTIVE IN BRAZE ALLOYS MARKET, BY METAL, 2014-2029 (USD MILLION)
TABLE 594 EGYPT AEROSPACE AND DEFENCE IN BRAZE ALLOYS MARKET, BY METAL, 2014-2029 (USD MILLION)
TABLE 595 EGYPT ELECTRONICS AND ELECTRICAL BRAZE ALLOYS MARKET, BY METAL, 2014-2029 (USD MILLION)
TABLE 596 EGYPT BUILDING AND CONSTRUCTION IN BRAZE ALLOYS MARKET, BY METAL, 2014-2029 (USD MILLION)
TABLE 597 EGYPT CHEMICALS IN BRAZE ALLOYS MARKET, BY METAL, 2014-2029 (USD MILLION)
TABLE 598 EGYPT MARINE IN BRAZE ALLOYS MARKET, BY METAL, 2014-2029 (USD MILLION)
TABLE 599 EGYPT OTHERS IN BRAZE ALLOYS MARKET, BY METAL, 2014-2029 (USD MILLION)
TABLE 600 ISRAEL BRAZE ALLOYS MARKET, BY METAL, 2014-2029 (USD MILLION)
TABLE 601 ISRAEL BRAZE ALLOYS MARKET, BY METAL, 2014-2029 (TONS)
TABLE 602 ISRAEL STEEL IN BRAZE ALLOYS MARKET, BY METAL, 2014-2029 (USD MILLION)
TABLE 603 ISRAEL BRAZE ALLOYS MARKET, BY FILLER MATERIAL, 2014-2029 (USD MILLION)
TABLE 604 ISRAEL BRAZE ALLOYS MARKET, BY TECHNOLOGY, 2014-2029 (USD MILLION)
TABLE 605 ISRAEL BRAZE ALLOYS MARKET, BY FORM , 2014-2029 (USD MILLION)
TABLE 606 ISRAEL BRAZE ALLOYS MARKET, BY PRODUCTION TEMPERATURE, 2014-2029 (USD MILLION)
TABLE 607 ISRAEL BRAZE ALLOYS MARKET, BY END USE, 2014-2029 (USD MILLION)
TABLE 608 ISRAEL AUTOMOTIVE IN BRAZE ALLOYS MARKET, BY METAL, 2014-2029 (USD MILLION)
TABLE 609 ISRAEL AEROSPACE AND DEFENCE IN BRAZE ALLOYS MARKET, BY METAL, 2014-2029 (USD MILLION)
TABLE 610 ISRAEL ELECTRONICS AND ELECTRICAL BRAZE ALLOYS MARKET, BY METAL, 2014-2029 (USD MILLION)
TABLE 611 ISRAEL BUILDING AND CONSTRUCTION IN BRAZE ALLOYS MARKET, BY METAL, 2014-2029 (USD MILLION)
TABLE 612 ISRAEL CHEMICALS IN BRAZE ALLOYS MARKET, BY METAL, 2014-2029 (USD MILLION)
TABLE 613 ISRAEL MARINE IN BRAZE ALLOYS MARKET, BY METAL, 2014-2029 (USD MILLION)
TABLE 614 ISRAEL OTHERS IN BRAZE ALLOYS MARKET, BY METAL, 2014-2029 (USD MILLION)
TABLE 615 REST OF MIDDLE EAST AND AFRICA BRAZE ALLOYS MARKET, BY METAL, 2014-2029 (USD MILLION)
TABLE 616 REST OF MIDDLE EAST AND AFRICA BRAZE ALLOYS MARKET, BY METAL, 2014-2029 (TONS)
Lista de figuras
FIGURE 1 GLOBAL BRAZE ALLOYS MARKET: SEGMENTATION
FIGURE 2 GLOBAL BRAZE ALLOYS MARKET: DATA TRIANGULATION
FIGURE 3 GLOBAL BRAZE ALLOYS MARKET: DROC ANALYSIS
FIGURE 4 GLOBAL BRAZE ALLOYS MARKET: GLOBAL VS REGIONAL MARKET ANALYSIS
FIGURE 5 GLOBAL BRAZE ALLOYS MARKET: COMPANY RESEARCH ANALYSIS
FIGURE 6 GLOBAL BRAZE ALLOYS MARKET: INTERVIEW DEMOGRAPHICS
FIGURE 7 GLOBAL BRAZE ALLOYS MARKET: DBMR MARKET POSITION GRID
FIGURE 8 GLOBAL BRAZE ALLOYS MARKET: VENDOR SHARE ANALYSIS
FIGURE 9 GLOBAL BRAZE ALLOY MARKET: SEGMENTATION
FIGURE 10 ASIA-PACIFIC IS EXPECTED TO DOMINATE THE GLOBAL CONDENSING UNIT MARKET AND GROWING WITH THE HIGHEST CAGR IN THE FORECAST PERIOD OF 2022 TO 2029
FIGURE 11 INCREASE IN USAGE OF BRAZE ALLOYS IN THE AUTOMOTIVE AND AVIATION IS A MAJOR DRIVER FOR THE GROWTH OF GLOBAL BRAZE ALLOYS MARKET IN THE FORECAST PERIOD OF 2022-2029
FIGURE 12 METAL IS EXPECTED TO ACCOUNT FOR THE LARGEST SHARE OF THE GLOBAL BRAZE ALLOYS MARKET IN 2021 AND 2029
FIGURE 13 ASIA-PACIFIC IS THE FASTEST GROWING MARKET FOR BRAZE ALLOYS MANUFACTURERS IN THE FORECAST PERIOD OF 2022 TO 2029
FIGURE 14 VENDOR SELECTION CRITERIA:
FIGURE 15 SUPPLY CHAIN OF GLOBAL BRAZE ALLOYS MARKET
FIGURE 16 VARIOUS CLASSES OF BRAZING FILLERS ACCORDING TO ISO 17672:2016
FIGURE 17 THE FOLLOWING GRAPH SHOWCASES THE DIFFERENT PRICES RANGE IN DIFFERENT REGIONS IN USD MILLION PER TON.
FIGURE 18 DRIVERS, RESTRAINTS, OPPORTUNITIES, AND CHALLENGES OF THE GLOBAL BRAZE ALLOYS MARKET
FIGURE 19 PRICE GRAPH OF SOME OF THE METALS USED IN BRAZE ALLOYS
FIGURE 20 GLOBAL BRAZE ALLOYS MARKET: BY METAL, 2021
FIGURE 21 GLOBAL BRAZE ALLOYS MARKET: BY FILLER MATERIAL, 2021
FIGURE 22 GLOBAL BRAZE ALLOYS MARKET: BY TECHNOLOGY, 2021
FIGURE 23 GLOBAL BRAZE ALLOYS MARKET: BY FORM, 2021
FIGURE 24 GLOBAL BRAZE ALLOYS MARKET: BY PRODUCTION TEMPERATURE, 2021
FIGURE 25 GLOBAL BRAZE ALLOYS MARKET: BY END USER, 2021
FIGURE 26 GLOBAL BRAZE ALLOYS MARKET: SNAPSHOT (2021)
FIGURE 27 GLOBAL BRAZE ALLOYS MARKET: BY REGION (2021)
FIGURE 28 GLOBAL BRAZE ALLOYS MARKET: BY REGION (2022 & 2029)
FIGURE 29 GLOBAL BRAZE ALLOYS MARKET: BY REGION (2021 & 2029)
FIGURE 30 GLOBAL BRAZE ALLOYS MARKET: BY METAL (2022 & 2029)
FIGURE 31 ASIA-PACIFIC BRAZE ALLOYS MARKET: SNAPSHOT (2021)
FIGURE 32 ASIA-PACIFIC BRAZE ALLOYS MARKET: BY COUNTRY (2021)
FIGURE 33 ASIA-PACIFIC BRAZE ALLOYS MARKET: BY COUNTRY (2022 & 2029)
FIGURE 34 ASIA-PACIFIC BRAZE ALLOYS MARKET: BY COUNTRY (2021 & 2029)
FIGURE 35 ASIA-PACIFIC BRAZE ALLOYS MARKET: BY METAL (2022 & 2029)
FIGURE 36 EUROPE BRAZE ALLOYS MARKET: SNAPSHOT (2021)
FIGURE 37 EUROPE BRAZE ALLOYS MARKET: BY COUNTRY (2021)
FIGURE 38 EUROPE BRAZE ALLOYS MARKET: BY COUNTRY (2022 & 2029)
FIGURE 39 EUROPE BRAZE ALLOYS MARKET: BY COUNTRY (2021 & 2029)
FIGURE 40 EUROPE BRAZE ALLOYS MARKET: BY METAL (2022 & 2029)
FIGURE 41 NORTH AMERICA BRAZE ALLOYS MARKET: SNAPSHOT (2021)
FIGURE 42 NORTH AMERICA BRAZE ALLOYS MARKET: BY COUNTRY (2021)
FIGURE 43 NORTH AMERICA BRAZE ALLOYS MARKET: BY COUNTRY (2022 & 2029)
FIGURE 44 NORTH AMERICA BRAZE ALLOYS MARKET: BY COUNTRY (2021 & 2029)
FIGURE 45 NORTH AMERICA BRAZE ALLOYS MARKET: BY METAL (2022 & 2029)
FIGURE 46 SOUTH AMERICA BRAZE ALLOYS MARKET: SNAPSHOT (2021)
FIGURE 47 SOUTH AMERICA BRAZE ALLOYS MARKET: BY COUNTRY (2021)
FIGURE 48 SOUTH AMERICA BRAZE ALLOYS MARKET: BY COUNTRY (2022 & 2029)
FIGURE 49 SOUTH AMERICA BRAZE ALLOYS MARKET: BY COUNTRY (2021 & 2029)
FIGURE 50 SOUTH AMERICA BRAZE ALLOYS MARKET: BY METAL (2022 & 2029)
FIGURE 51 MIDDLE EAST AND AFRICA BRAZE ALLOYS MARKET: SNAPSHOT (2021)
FIGURE 52 MIDDLE EAST AND AFRICA BRAZE ALLOYS MARKET: BY COUNTRY (2021)
FIGURE 53 MIDDLE EAST AND AFRICA BRAZE ALLOYS MARKET: BY COUNTRY (2022 & 2029)
FIGURE 54 MIDDLE EAST AND AFRICA BRAZE ALLOYS MARKET: BY COUNTRY (2021 & 2029)
FIGURE 55 MIDDLE EAST AND AFRICA BRAZE ALLOYS MARKET: BY METAL (2022 & 2029)
FIGURE 56 GLOBAL BRAZE ALLOY MARKET: COMPANY SHARE 2021 (%)
FIGURE 57 NORTH AMERICA BRAZE ALLOY MARKET: COMPANY SHARE 2021 (%)
FIGURE 58 EUROPE BRAZE ALLOY MARKET: COMPANY SHARE 2021 (%)
FIGURE 59 ASIA-PACIFIC BRAZE ALLOY MARKET: COMPANY SHARE 2021 (%)
Metodología de investigación
La recopilación de datos y el análisis del año base se realizan utilizando módulos de recopilación de datos con muestras de gran tamaño. La etapa incluye la obtención de información de mercado o datos relacionados a través de varias fuentes y estrategias. Incluye el examen y la planificación de todos los datos adquiridos del pasado con antelación. Asimismo, abarca el examen de las inconsistencias de información observadas en diferentes fuentes de información. Los datos de mercado se analizan y estiman utilizando modelos estadísticos y coherentes de mercado. Además, el análisis de la participación de mercado y el análisis de tendencias clave son los principales factores de éxito en el informe de mercado. Para obtener más información, solicite una llamada de un analista o envíe su consulta.
La metodología de investigación clave utilizada por el equipo de investigación de DBMR es la triangulación de datos, que implica la extracción de datos, el análisis del impacto de las variables de datos en el mercado y la validación primaria (experto en la industria). Los modelos de datos incluyen cuadrícula de posicionamiento de proveedores, análisis de línea de tiempo de mercado, descripción general y guía del mercado, cuadrícula de posicionamiento de la empresa, análisis de patentes, análisis de precios, análisis de participación de mercado de la empresa, estándares de medición, análisis global versus regional y de participación de proveedores. Para obtener más información sobre la metodología de investigación, envíe una consulta para hablar con nuestros expertos de la industria.
Personalización disponible
Data Bridge Market Research es líder en investigación formativa avanzada. Nos enorgullecemos de brindar servicios a nuestros clientes existentes y nuevos con datos y análisis que coinciden y se adaptan a sus objetivos. El informe se puede personalizar para incluir análisis de tendencias de precios de marcas objetivo, comprensión del mercado de países adicionales (solicite la lista de países), datos de resultados de ensayos clínicos, revisión de literatura, análisis de mercado renovado y base de productos. El análisis de mercado de competidores objetivo se puede analizar desde análisis basados en tecnología hasta estrategias de cartera de mercado. Podemos agregar tantos competidores sobre los que necesite datos en el formato y estilo de datos que esté buscando. Nuestro equipo de analistas también puede proporcionarle datos en archivos de Excel sin procesar, tablas dinámicas (libro de datos) o puede ayudarlo a crear presentaciones a partir de los conjuntos de datos disponibles en el informe.

