

Global Bee Products Market
Tamaño del mercado en miles de millones de dólares
Tasa de crecimiento anual compuesta (CAGR) :
% 
 USD
14.41 Billion
USD
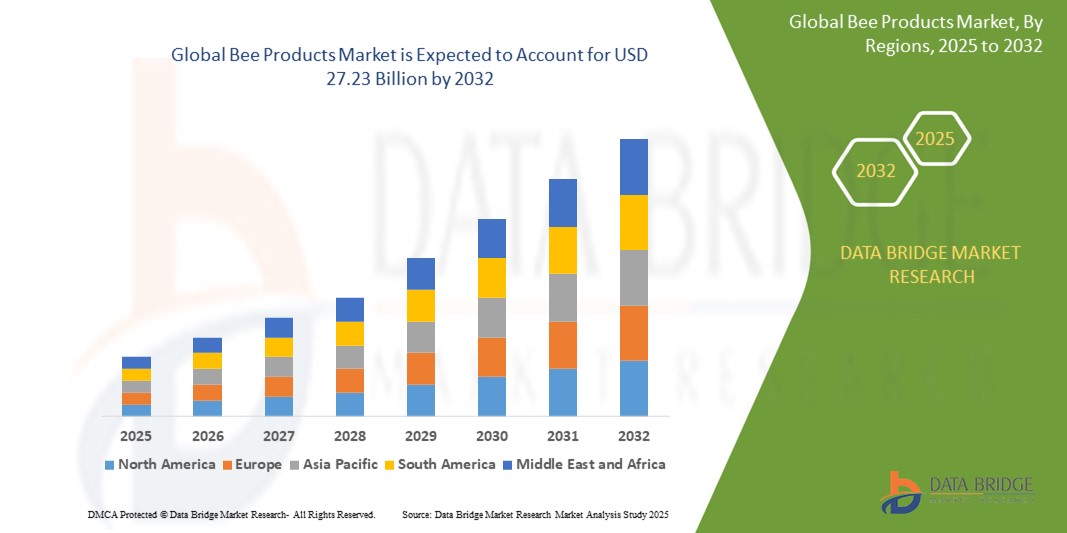
27.23 Billion
2024
2032
USD
14.41 Billion
USD
27.23 Billion
2024
2032
| 2025 –2032 | |
| USD 14.41 Billion | |
| USD 27.23 Billion | |
| % | |
|
Segmentación del mercado global de productos apícolas por tipo (miel, cera de abejas, propóleo, jalea real, veneno de abeja y otros), naturaleza (orgánica y convencional), canal de distribución (directo e indirecto): tendencias de la industria y pronóstico hasta 2032.
Tamaño del mercado de productos apícolas
- El tamaño del mercado mundial de productos apícolas se valoró en USD 14,41 mil millones en 2024 y se espera que alcance los USD 27,23 mil millones para 2032 , con una CAGR del 8,28% durante el período de pronóstico.
- El crecimiento del mercado se debe en gran medida a la creciente preferencia de los consumidores por productos naturales, orgánicos y que fortalecen el sistema inmunitario, respaldada por una mayor concienciación sobre la salud y la creciente popularidad de sistemas de medicina tradicional como el Ayurveda y la Medicina Tradicional China. Estas tendencias impulsan una fuerte demanda de miel, propóleo, jalea real y otros productos derivados de las abejas, tanto en aplicaciones alimentarias como nutracéuticas.
- Además, la creciente aplicación de productos apícolas en el cuidado personal, productos farmacéuticos y alimentos funcionales, junto con las iniciativas gubernamentales para promover la apicultura, están acelerando la penetración en el mercado global. Estos factores convergentes están mejorando significativamente la escala comercial y la diversificación de la industria de productos apícolas.
Análisis del mercado de productos apícolas
- Los productos apícolas, como la miel, la cera, el propóleo, la jalea real y el polen, son sustancias de origen natural ampliamente utilizadas en la alimentación, la salud, la cosmética y los suplementos dietéticos. Estos productos son valorados por sus propiedades antimicrobianas, antiinflamatorias y antioxidantes, y se incorporan cada vez más en fórmulas enfocadas en el bienestar.
- La creciente demanda de ingredientes de etiqueta limpia y sin químicos, y el creciente número de consumidores que buscan alternativas a los aditivos sintéticos son factores clave que impulsan el consumo de productos apícolas. El mercado también se beneficia de las innovaciones en las prácticas apícolas, los sistemas de trazabilidad y los modelos de abastecimiento sostenible.
- Asia-Pacífico dominó el mercado de productos apícolas con una participación del 36,1% en 2024, debido al alto consumo de miel y productos medicinales tradicionales en toda la región.
- Se espera que América del Norte sea la región de más rápido crecimiento en el mercado de productos apícolas durante el período de pronóstico debido al creciente interés en remedios naturales, alimentos de etiqueta limpia y soluciones de salud holísticas.
- El segmento de la miel dominó el mercado con una participación del 61,8 % en 2024, gracias a su amplio consumo como edulcorante natural y al creciente reconocimiento de sus beneficios para la salud. Los consumidores buscan cada vez más la miel por sus propiedades antioxidantes, antibacterianas y antiinflamatorias, lo que la convierte en un producto básico tanto en alimentos como en nutracéuticos. La creciente tendencia hacia productos alimenticios naturales que fortalecen el sistema inmunitario impulsa aún más la demanda de miel en las regiones desarrolladas y en desarrollo.
Alcance del informe y segmentación del mercado de productos apícolas
|
Atributos |
Perspectivas clave del mercado de productos apícolas |
|
Segmentos cubiertos |
|
|
Países cubiertos |
América del norte
Europa
Asia-Pacífico
Oriente Medio y África
Sudamerica
|
|
Actores clave del mercado |
|
|
Oportunidades de mercado |
|
|
Conjuntos de información de datos de valor añadido |
Además de los conocimientos sobre escenarios de mercado, como valor de mercado, tasa de crecimiento, segmentación, cobertura geográfica y actores principales, los informes de mercado seleccionados por Data Bridge Market Research también incluyen análisis en profundidad de expertos, análisis de precios, análisis de participación de marca, encuesta de consumidores, análisis demográfico, análisis de la cadena de suministro, análisis de la cadena de valor, descripción general de materias primas/consumibles, criterios de selección de proveedores, análisis PESTLE, análisis de Porter y marco regulatorio. |
Tendencias del mercado de productos apícolas
Aumento de la conciencia sobre los beneficios para la salud de los productos apícolas
- El mercado mundial de productos apícolas está experimentando un fuerte crecimiento a medida que los consumidores reconocen cada vez más los beneficios nutricionales y terapéuticos de la miel, el propóleo, el polen de abeja, la jalea real, la cera de abejas y el veneno de abejas para promover la salud y el bienestar.
- Por ejemplo, empresas líderes como Comvita Limited, Dabur India Ltd., Apis Flora, Manuka Health New Zealand y Bee Maid Honey Limited están educando activamente a los consumidores y desarrollando nuevos productos centrados en el apoyo inmunológico, las propiedades antioxidantes y los remedios naturales.
- Una mayor investigación científica y una cobertura mediática positiva han aumentado la conciencia sobre el papel de los productos apícolas en la salud digestiva, el cuidado de heridas, el alivio de las alergias y como fuentes de vitaminas, minerales y antioxidantes.
- Los cambios hacia opciones de alimentos naturales y orgánicos han impulsado la demanda de miel cruda, suplementos de polen y cosméticos a base de cera de abejas, mientras que la popularidad de la medicina alternativa ha llevado a una mayor adopción de productos apícolas en alimentos funcionales, nutracéuticos y suplementos dietéticos.
- La expansión del comercio electrónico y los canales directos al consumidor permiten que marcas como Barkman Honey LLC, Bee Health Limited y MN Propolis lleguen a un público más amplio con ofertas de productos apícolas premium y especiales.
- Las innovaciones de productos, como la miel baja en azúcar, las cápsulas de jalea real, las gotas de propóleo y los envoltorios de cera de abejas, están abordando diversas preferencias de los consumidores y tendencias de estilo de vida.
Dinámica del mercado de productos apícolas
Conductor
Aumento de la conciencia sobre los beneficios para la salud de los productos apícolas
- La demanda de los consumidores de ingredientes naturales y saludables está impulsando el uso de productos apícolas en las categorías de alimentos y bebidas, cuidado personal y productos farmacéuticos.
- Por ejemplo, Comvita, Manuka Health New Zealand y Dabur India Ltd. están aprovechando la validación científica y las campañas de marketing para resaltar los beneficios antimicrobianos, antiinflamatorios y nutritivos de sus líneas de productos.
- La integración de productos apícolas en alimentos funcionales y vitaminas está creciendo, en gran medida debido a la preferencia de los consumidores por suplementos que estimulan la inmunidad, energizan y mejoran la salud digestiva.
- Los gobiernos y las organizaciones de salud en los principales mercados apoyan la apicultura mediante capacitación, subsidios e iniciativas de conservación para mantener el suministro y promover el consumo.
- Las marcas de belleza y cuidado personal, como las que utilizan cera de abejas y jalea real, están respondiendo a la demanda de fórmulas de "belleza limpia", lo que impulsa el crecimiento intersectorial.
Restricción/Desafío
Pérdida de hábitat debido a la urbanización y la expansión agrícola
- La pérdida de hábitat debido a la rápida urbanización, la expansión agrícola, la deforestación, el uso de pesticidas y la contaminación ambiental es una amenaza importante para las poblaciones de abejas, lo que afecta directamente el suministro de materia prima para el mercado de productos apícolas.
- Por ejemplo, la continua expansión de tierras agrícolas e infraestructura reduce los hábitats de flores silvestres y bosques vitales para la búsqueda de alimento y la anidación de las abejas, lo que provoca disminuciones en la densidad y la productividad de las colonias.
- Empresas como Apis Flora, Bee Maid Honey Limited y Dabur India Ltd. enfrentan mayores desafíos de producción debido a la reducción de la diversidad y la salud de las abejas, lo que afecta los rendimientos de miel, polen y propóleo.
- Esta tendencia genera mayores riesgos en la cadena de suministro, volatilidad de precios y la necesidad de que las empresas busquen un abastecimiento sostenible, apoyen la conservación de las abejas o innoven con ingredientes alternativos para mitigar la escasez.
- Las presiones operativas adicionales se derivan del aumento de los costos laborales, la escasez de habilidades entre los apicultores y los requisitos de cumplimiento ambiental más estrictos para los participantes de la industria.
Alcance del mercado de productos apícolas
El mercado está segmentado según tipo, naturaleza y canal de distribución.
- Por tipo
Según el tipo, el mercado de productos apícolas se segmenta en miel, cera de abejas, propóleo, jalea real, veneno de abeja, entre otros. El segmento de la miel dominó la mayor cuota de mercado con un 61,8 % en 2024, gracias a su amplio consumo como edulcorante natural y al creciente reconocimiento de sus beneficios para la salud. Los consumidores buscan cada vez más la miel por sus propiedades antioxidantes, antibacterianas y antiinflamatorias, lo que la convierte en un producto básico tanto en alimentos como en nutracéuticos. La creciente tendencia hacia productos alimenticios naturales que fortalecen el sistema inmunitario impulsa aún más la demanda de miel tanto en las regiones desarrolladas como en las que están en desarrollo.
Se prevé que el segmento del propóleo experimente su mayor crecimiento entre 2025 y 2032, impulsado por la creciente demanda de las industrias farmacéutica y de cuidado personal. Conocido por sus propiedades antiinflamatorias, antimicrobianas y cicatrizantes, el propóleo está ganando terreno como ingrediente clave en suplementos funcionales para la salud, pastillas para la garganta y productos dermatológicos. El crecimiento del segmento también se ve impulsado por la creciente preferencia de los consumidores por los remedios botánicos y la creciente investigación sobre los beneficios terapéuticos del propóleo.
- Por naturaleza
Debido a su naturaleza, el mercado de productos apícolas se segmenta en orgánicos y convencionales. El segmento convencional tuvo la mayor participación de mercado en 2024, gracias a su amplia disponibilidad, precios más bajos y canales de distribución consolidados. Los productos apícolas convencionales se utilizan ampliamente en la industria alimentaria, cosmética y farmacéutica gracias a su suministro constante y la facilidad de adquisición a granel.
Se prevé que el segmento orgánico registre la tasa de crecimiento anual compuesta (TCAC) más rápida entre 2025 y 2032, impulsado por la creciente preferencia de los consumidores por productos sin químicos, trazables y de origen sostenible. La creciente concienciación sobre los impactos ambientales y en la salud asociados con los aditivos sintéticos está impulsando la demanda de variantes orgánicas, especialmente entre los consumidores preocupados por su salud y en los segmentos premium de cuidado personal. El apoyo regulatorio al etiquetado y la certificación de productos orgánicos también está mejorando la credibilidad de los productos y el crecimiento del mercado.
- Por canal de distribución
Según el canal de distribución, el mercado de productos apícolas se segmenta en canales directos e indirectos. El segmento indirecto representó la mayor cuota de mercado en 2024 gracias a su amplia accesibilidad en supermercados, farmacias, tiendas de salud y plataformas de comercio electrónico. Este canal se beneficia de una infraestructura minorista consolidada, visibilidad de marca y campañas promocionales que atraen a una amplia base de consumidores.
Se proyecta que el segmento directo crecerá a su ritmo más rápido entre 2025 y 2032, impulsado por el aumento de las ventas de productor a consumidor a través de sitios web propios, mercados agrícolas y tiendas especializadas. El modelo de venta directa al consumidor permite un mejor control de calidad, trazabilidad y mayores márgenes, a la vez que fomenta la confianza del consumidor en las fuentes de productos apícolas artesanales y locales. La demanda de autenticidad y transparencia está animando a los pequeños productores y a las granjas orgánicas a capitalizar este canal.
Análisis regional del mercado de productos apícolas
- Asia-Pacífico dominó el mercado de productos apícolas con la mayor participación en los ingresos del 36,1 % en 2024, impulsada por el alto consumo de miel y productos medicinales tradicionales en toda la región.
- El uso profundamente arraigado de productos apícolas en la región en Ayurveda, la medicina tradicional china (MTC) y los alimentos funcionales, junto con la creciente demanda de suplementos de salud orgánicos y naturales, son importantes impulsores del crecimiento.
- Además, la creciente conciencia sobre la salud, el aumento de los ingresos disponibles y el fuerte apoyo gubernamental al desarrollo de la apicultura están impulsando la producción y el consumo interno de diversos productos derivados de las abejas.
Perspectiva del mercado de productos apícolas en Japón
El mercado japonés está en constante crecimiento, impulsado por la fuerte demanda de miel de alta pureza y suplementos premium a base de abejas, como la jalea real y el propóleo. Los consumidores japoneses priorizan la calidad, la seguridad y la funcionalidad, lo que ha popularizado los productos apícolas en nutracéuticos y cosméticos. Los productores nacionales están aprovechando tecnologías avanzadas de filtración y procesamiento para satisfacer la demanda de formulaciones higiénicas, trazables y de valor añadido.
Perspectiva del mercado de productos apícolas de China
China ocupó la mayor participación en el mercado de productos apícolas de Asia-Pacífico en 2024, gracias a su posición como productor y exportador líder mundial de miel, propóleo y jalea real. Las prácticas de medicina tradicional, el aumento de los ingresos disponibles y una industria del bienestar floreciente son impulsores clave de la demanda. Los programas gubernamentales que fomentan la apicultura y el emprendimiento rural también están acelerando la producción y la innovación en el procesamiento.
Perspectiva del mercado europeo de productos apícolas
Se proyecta que el mercado europeo de productos apícolas crezca a una tasa de crecimiento anual compuesta (TCAC) significativa durante el período de pronóstico, impulsado por la creciente preferencia de los consumidores por productos orgánicos y de origen ético, y la sólida demanda en los sectores del cuidado personal y los suplementos dietéticos. Las estrictas regulaciones de la UE sobre la pureza, el etiquetado y el origen de los productos están mejorando la confianza de los consumidores e impulsando la expansión del mercado, especialmente para la cera de abejas, el propóleo y la miel orgánica.
Perspectivas del mercado de productos apícolas del Reino Unido
El mercado británico se perfila para un crecimiento estable, impulsado por el creciente interés en la miel sostenible y de origen local y los productos de bienestar apícolas. La creciente preferencia de los consumidores por productos orgánicos y trazables, junto con el creciente uso de propóleo y cera de abeja en productos para el cuidado de la piel y suplementos para la salud, está impulsando la demanda. Las iniciativas nacionales de apicultura y la apuesta del sector minorista por marcas con conciencia ecológica también contribuyen a la penetración en el mercado.
Perspectiva del mercado de productos apícolas en Alemania
Se espera que Alemania experimente un fuerte crecimiento, impulsado por una alta concienciación de los consumidores sobre la sostenibilidad y la salud natural. El país cuenta con una larga tradición en apiterapia y medicina natural, lo que impulsa la demanda de productos como el propóleo, la jalea real y el veneno de abeja. Los productores locales se están centrando en la certificación orgánica, el abastecimiento transparente y la expansión de su presencia en las industrias farmacéutica y de cuidado personal.
Perspectiva del mercado de productos apícolas de América del Norte
Se proyecta que América del Norte crecerá a la tasa de crecimiento anual compuesta (TCAC) más rápida entre 2025 y 2032, impulsada por el creciente interés en remedios naturales, alimentos de etiqueta limpia y soluciones holísticas de salud. Los consumidores se inclinan por la miel cruda y sin procesar, así como por productos apícolas funcionales como la jalea real y el polen de abeja. El mercado se beneficia de una mayor concienciación sobre la salud, la innovación en formulaciones y la expansión de la distribución a través de canales en línea y de salud especializada.
Perspectiva del mercado de productos apícolas de EE. UU.
El mercado estadounidense capturó la mayor participación en los ingresos de Norteamérica en 2024, impulsado por la fuerte demanda de alimentos funcionales, productos naturales para el cuidado de la piel y suplementos inmunoestimulantes. La transición hacia ingredientes orgánicos y de origen local está impulsando el crecimiento en los segmentos de la miel, el propóleo y la cera de abejas. Además, la creciente adopción de productos apícolas en fórmulas de belleza limpia y marcas premium de bienestar está acelerando la expansión del mercado.
Cuota de mercado de productos apícolas
La industria de productos apícolas está liderada principalmente por empresas bien establecidas, entre las que se incluyen:
- Comvita Limited (Nueva Zelanda)
- Dabur India Limited (India)
- Local Honey Man (Reino Unido)
- Cera Verde (Brasil)
- Bee Maid Honey Limited (Canadá)
- Vida natural en Australia (Australia)
- Barkman Honey, LLC (EE. UU.)
- Apis Flora (Brasil)
- Bee Health Limited (Reino Unido)
- Grupo MN (Brasil)
- Beekeeper's Naturals, Inc. (Canadá)
- King's Gel ind. e Com. Ltda (Brasil)
- Granja de abejas Johnston (EE. UU.)
- Propóleo BeeVital (Inglaterra)
- SDM Nutraceuticals Inc. (EE. UU.)
- Tienda de miel Royal Bee (India)
- Granjas ecológicas de abejas YS (EE. UU.)
- SUNYATA PON LEE (Brasil)
- Langnese Honey GmbH & Co. KG (Alemania)
- Polenectar (Brasil)
Últimos avances en el mercado mundial de productos apícolas
- En diciembre de 2024, se lanzó la Iniciativa de Miel Orgánica "Sonahani" en el distrito de Koriya, en Chhattisgarh, capacitando a 20 agricultores en apicultura científica y suministrando colmenas italianas. El proyecto, financiado por el Fondo Fiduciario de Minerales del Distrito, permitió a los agricultores locales generar ingresos mediante la venta de miel orgánica en dos meses, con el apoyo de grupos de autoayuda liderados por mujeres.
- En agosto de 2024, Badshah Masala, en colaboración con la Fundación Ennoble para la Innovación Social, emprendió una importante iniciativa de mejora educativa con la inauguración de la renovada Escuela Primaria GPS Nargol Mukhya y Bhata Fadiyu Aanganwadi, ubicada en Umbergaon, Gujarat. Esta iniciativa se centró en mejorar la experiencia de aprendizaje general de más de 250 estudiantes mediante la modernización de infraestructuras esenciales, la mejora de las instalaciones sanitarias y la creación de un entorno educativo más atractivo y acogedor para los niños. Esta colaboración refleja un firme compromiso con el desarrollo comunitario y la mejora del acceso a una educación primaria de calidad en las regiones rurales.
- En diciembre de 2023, Dabur India Limited lanzó su campaña "Ciencia en Acción", cuyo objetivo era promover la base científica del Ayurveda y fortalecer la confianza pública en las prácticas de salud tradicionales de la India. Mediante una serie de vídeos digitales basados en investigaciones, anuncios impresos y seminarios impartidos por expertos, la campaña buscó fusionar la sabiduría ayurvédica tradicional con los conocimientos científicos modernos. Con ello, Dabur buscaba educar a los consumidores sobre la eficacia de los remedios ayurvédicos y fomentar su integración en las rutinas de bienestar contemporáneas.
- En septiembre de 2023, se introdujo HiveLink, un sistema inteligente de monitoreo de colmenas basado en IoT, para optimizar las operaciones apícolas. El sistema utiliza sensores para monitorizar la temperatura, la humedad y el peso de la colmena en tiempo real, lo que permite la detección temprana de enfermedades y una mejor gestión de las colmenas.
- En 2020, el Gobierno de la India lanzó la Misión Nacional de Apicultura y Miel (NBHM, por sus siglas en inglés) en el marco de la iniciativa Atmanirbhar Bharat, destinando 500 millones de rupias para promover la apicultura científica en todo el país. La misión se centró en establecer 16 Centros Integrados de Desarrollo Apícola (IBDC, por sus siglas en inglés), introducir sistemas de trazabilidad de la miel y formar Organizaciones de Productores Agrícolas (OPA) centradas en la miel en estados como Bihar, Uttar Pradesh, Madhya Pradesh, Rajastán y Bengala Occidental.
SKU-
Obtenga acceso en línea al informe sobre la primera nube de inteligencia de mercado del mundo

- Panel de análisis de datos interactivo
- Panel de análisis de empresas para oportunidades con alto potencial de crecimiento
- Acceso de analista de investigación para personalización y consultas
- Análisis de la competencia con panel interactivo
- Últimas noticias, actualizaciones y análisis de tendencias
- Aproveche el poder del análisis de referencia para un seguimiento integral de la competencia
Metodología de investigación
La recopilación de datos y el análisis del año base se realizan utilizando módulos de recopilación de datos con muestras de gran tamaño. La etapa incluye la obtención de información de mercado o datos relacionados a través de varias fuentes y estrategias. Incluye el examen y la planificación de todos los datos adquiridos del pasado con antelación. Asimismo, abarca el examen de las inconsistencias de información observadas en diferentes fuentes de información. Los datos de mercado se analizan y estiman utilizando modelos estadísticos y coherentes de mercado. Además, el análisis de la participación de mercado y el análisis de tendencias clave son los principales factores de éxito en el informe de mercado. Para obtener más información, solicite una llamada de un analista o envíe su consulta.
La metodología de investigación clave utilizada por el equipo de investigación de DBMR es la triangulación de datos, que implica la extracción de datos, el análisis del impacto de las variables de datos en el mercado y la validación primaria (experto en la industria). Los modelos de datos incluyen cuadrícula de posicionamiento de proveedores, análisis de línea de tiempo de mercado, descripción general y guía del mercado, cuadrícula de posicionamiento de la empresa, análisis de patentes, análisis de precios, análisis de participación de mercado de la empresa, estándares de medición, análisis global versus regional y de participación de proveedores. Para obtener más información sobre la metodología de investigación, envíe una consulta para hablar con nuestros expertos de la industria.
Personalización disponible
Data Bridge Market Research es líder en investigación formativa avanzada. Nos enorgullecemos de brindar servicios a nuestros clientes existentes y nuevos con datos y análisis que coinciden y se adaptan a sus objetivos. El informe se puede personalizar para incluir análisis de tendencias de precios de marcas objetivo, comprensión del mercado de países adicionales (solicite la lista de países), datos de resultados de ensayos clínicos, revisión de literatura, análisis de mercado renovado y base de productos. El análisis de mercado de competidores objetivo se puede analizar desde análisis basados en tecnología hasta estrategias de cartera de mercado. Podemos agregar tantos competidores sobre los que necesite datos en el formato y estilo de datos que esté buscando. Nuestro equipo de analistas también puede proporcionarle datos en archivos de Excel sin procesar, tablas dinámicas (libro de datos) o puede ayudarlo a crear presentaciones a partir de los conjuntos de datos disponibles en el informe.

