Global Bacteriophages Therapy Market
Tamaño del mercado en miles de millones de dólares
Tasa de crecimiento anual compuesta (CAGR) :
% 
 USD
39.80 Million
USD
64.40 Million
2021
2029
USD
39.80 Million
USD
64.40 Million
2021
2029
| 2022 –2029 | |
| USD 39.80 Million | |
| USD 64.40 Million | |
| % | |
|
Mercado mundial de terapia con bacteriófagos, por objetivo (Escherichia coli, Staphylococcus, Streptococcus, Pseudomonas, Salmonella, otros), tipo (lítico, lisogénico), base (cultivo en caldo estéril, base de gelatina soluble en agua), aplicación (disentería bacteriana, infecciones de la piel y la mucosa nasal, infección cutánea supurativa, infecciones pulmonares y pleurales, infecciones de heridas posoperatorias, otras), vía de administración (oral, parenteral, rectal, dérmica, otras), usuarios finales (hospitales, clínicas especializadas, atención domiciliaria, otros), canal de distribución (farmacia hospitalaria, farmacia minorista, farmacia en línea, otros) – Tendencias de la industria y pronóstico hasta 2029
Análisis y tamaño del mercado
La resistencia a los antibióticos es cada vez más frecuente en todo el mundo, lo que aumenta la demanda de alternativas eficaces. Según los CDC, las infecciones bacterianas resistentes a los antibióticos afectan a unas 33.000 personas en Europa cada año. Se prevé que la resistencia a los antibióticos aumente a nivel mundial, lo que creará una demanda considerable de bacteriófagos. La terapia con fagos es otro nombre para la terapia con bacteriófagos. Para tratar las infecciones bacterianas, se utilizan virus. Los bacteriófagos son virus bacterianos. Los fagos son virus que matan bacterias y son inofensivos para las plantas, los animales y los seres humanos. Se cree que los bacteriófagos son los adversarios naturales de las bacterias. Los bacteriófagos se pueden encontrar en las aguas residuales, el agua, el suelo y otros entornos donde existen bacterias.
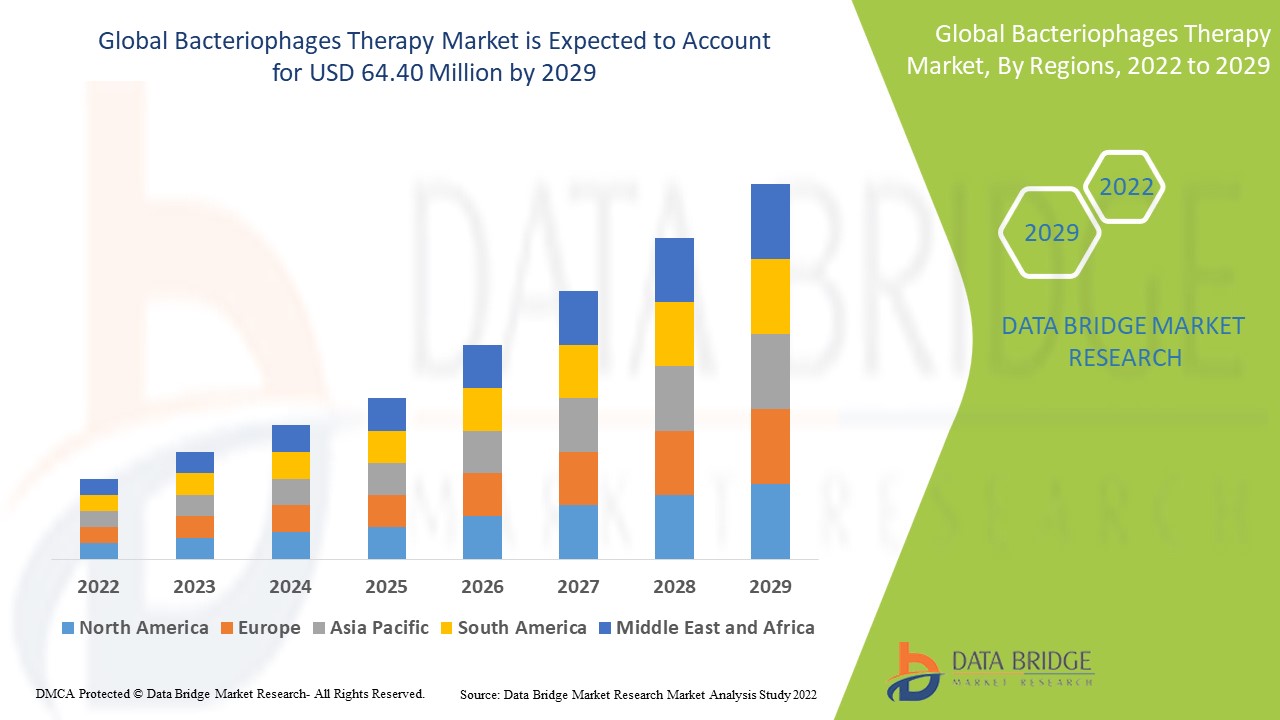
Data Bridge Market Research analiza que el mercado de terapia con bacteriófagos se valoró en USD 39,80 millones en 2021 y se espera que alcance los USD 64,40 millones para 2029, registrando una CAGR del 6,20% durante el período de pronóstico de 2022 a 2029. Además de los conocimientos del mercado, como el valor de mercado, la tasa de crecimiento, los segmentos del mercado, la cobertura geográfica, los actores del mercado y el escenario del mercado, el informe de mercado curado por el equipo de Data Bridge Market Research también incluye un análisis de expertos en profundidad, epidemiología del paciente, análisis de la cartera, análisis de precios y marco regulatorio.
Alcance del informe y segmentación del mercado
|
Métrica del informe |
Detalles |
|
Período de pronóstico |
2022 a 2029 |
|
Año base |
2021 |
|
Años históricos |
2020 (Personalizable para 2014 - 2019) |
|
Unidades cuantitativas |
Ingresos en millones de USD, volúmenes en unidades, precios en USD |
|
Segmentos cubiertos |
Objetivo (Escherichia coli, Staphylococcus, Streptococcus, Pseudomonas, Salmonella, otros), tipo (lítico, lisogénico), base (cultivo de caldo estéril, base de gelatina soluble en agua), aplicación (disentería bacteriana, infecciones de la piel y la mucosa nasal, infección cutánea supurativa, infecciones pulmonares y pleurales, infecciones de heridas posoperatorias, otros), vía de administración (oral, parenteral, rectal, dérmica, otros), usuarios finales (hospitales, clínicas especializadas, atención domiciliaria, otros), canal de distribución (farmacia hospitalaria, farmacia minorista, farmacia en línea, otros) |
|
Países cubiertos |
EE. UU., Canadá y México en América del Norte, Alemania, Francia, Reino Unido, Países Bajos, Suiza, Bélgica, Rusia, Italia, España, Turquía, Resto de Europa en Europa, China, Japón, India, Corea del Sur, Singapur, Malasia, Australia, Tailandia, Indonesia, Filipinas, Resto de Asia-Pacífico (APAC) en Asia-Pacífico (APAC), Arabia Saudita, Emiratos Árabes Unidos, Sudáfrica, Egipto, Israel, Resto de Medio Oriente y África (MEA) como parte de Medio Oriente y África (MEA), Brasil, Argentina y Resto de América del Sur como parte de América del Sur |
|
Actores del mercado cubiertos |
Microgen (EE. UU.), Micreos (Países Bajos), ATCC (EE. UU.), Intralytix, Inc. (EE. UU.), Adaptive Phage Therapeutics (EE. UU.), Armata Pharmaceuticals Inc. (EE. UU.), LOCUS BIOSCIENCES, INC. (EE. UU.), Delmont Laboratories, Inc. (EE. UU.), Nextbiotics (EE. UU.), Pherecydes Pharma (Francia), iNtODEWORLD. Inc. (EE. UU.), Enbiotix (EE. UU.), Fixed-Phage Limited (Reino Unido), Cytophage Technologies Inc. (Canadá), Eliava Bio Preparations LTD (Georgia), Phagelux, Inc. (China), InnoPhage, Ltd (Hong Kong), TechnoPhage (Portugal), Eligo Bioscience SA (Francia), BiomX Ltd. (Israel) |
|
Oportunidades de mercado |
|
Definición de mercado
Los bacteriófagos son virus que matan y atacan exclusivamente a las bacterias. Son una de las entidades biológicas más frecuentes capaces de combatir y matar a las bacterias resistentes a múltiples fármacos. Cuando todos los demás antibióticos han fallado para tratar una infección, los fagos pueden eliminar las bacterias que la causan, lo que permite a los expertos médicos salvar una vida. Los bacteriófagos se están considerando como un reemplazo de los antibióticos. Los virus se utilizan en esta terapia para inyectar su material genético en las bacterias y crecer utilizando la maquinaria de su huésped. Esta terapia con fagos se utiliza en el cuerpo de los pacientes para curar o prevenir enfermedades bacterianas. La terapia con bacteriófagos también es importante en las disciplinas de la biología molecular y la investigación tecnológica. Estas características amplían la posibilidad de desarrollar medicamentos. Los bacteriófagos también se denominan fagos.
Dinámica del mercado de la terapia con bacteriófagos
Conductores
- Alta tasa de prevalencia de enfermedades transmitidas por alimentos
El aumento de la tasa de prevalencia de enfermedades transmitidas por los alimentos en todo el mundo actuará como un factor importante que dará lugar a la expansión de la tasa de crecimiento del mercado. Las infecciones transmitidas por los alimentos causadas por alimentos en mal estado son cada vez más comunes. Las bacterias y los virus patógenos están presentes en los alimentos en mal estado. Según la OMS, alrededor de 600 millones de personas (casi una de cada diez personas en el planeta) enfermarán y 420.000 morirán como resultado de alimentos contaminados en 2019, lo que resultará en la pérdida de 33 millones de años de vida saludable (AVAD). Además, los niños menores de cinco años soportan el 40% de la carga de enfermedades transmitidas por los alimentos, con 125.000 muertes cada año. Este aspecto está impulsando el mercado de la terapia con bacteriófagos.
- Aumentar la inversión en infraestructura sanitaria
Otro factor importante que influye en la tasa de crecimiento del mercado de terapias con bacteriófagos es el aumento del gasto sanitario, que ayuda a mejorar su infraestructura. Además, varias organizaciones gubernamentales tienen como objetivo mejorar la infraestructura sanitaria aumentando la financiación, lo que influirá aún más en la dinámica del mercado.
- Aumento de la prevalencia de infecciones resistentes a los antibióticos
Se espera que la creciente prevalencia de infecciones resistentes a los antibióticos mejore el crecimiento del mercado. La creciente prevalencia de infecciones resistentes a los antimicrobianos ha dado lugar a un aumento del gasto sanitario para su tratamiento y un aumento del número de muertes. Según los Centros para el Control y la Prevención de Enfermedades (CDC), aproximadamente 2 millones de personas en los Estados Unidos contraerán una infección resistente a los antibióticos en 2019, y al menos 23.000 personas morirán cada año. Según la Organización Mundial de la Salud, más de 490.000 personas en todo el mundo se infectaron con tuberculosis resistente a múltiples fármacos en 2016. Esta resistencia a los fármacos complica el tratamiento de las personas que padecen otras enfermedades, como la malaria y el VIH.
Además, el aumento de las iniciativas gubernamentales para concienciar y aumentar la población geriátrica dará como resultado la expansión del mercado de terapias con bacteriófagos. Junto con esto, el cambio en el estilo de vida de las personas y el aumento del nivel de ingresos disponibles mejorarán la tasa de crecimiento del mercado.
Oportunidades
- Aumento del número de actividades de investigación y desarrollo
Además, el crecimiento del mercado se ve impulsado por un aumento en el número de actividades de investigación y desarrollo. Esto brindará oportunidades beneficiosas para el crecimiento del mercado de terapias con bacteriófagos. Por ejemplo, en enero de 2019, la Administración de Alimentos y Medicamentos de los Estados Unidos aprobó una solicitud de médicos científicos de la Facultad de Medicina de la Universidad de California en San Diego para realizar el primer ensayo clínico en los Estados Unidos de una terapia basada en bacteriófagos administrada por vía intravenosa. El experimento planificado se llevará a cabo en asociación con AmpliPhi Biosciences Corporation, una empresa de biotecnología con sede en San Diego.
Además, el crecimiento del mercado se ve impulsado por la inversión para desarrollar tecnologías avanzadas y aumentar el número de mercados emergentes. Estos factores brindarán oportunidades beneficiosas para el crecimiento del mercado de terapias con bacteriófagos.
Restricciones/Desafíos
Por otro lado, el alto costo asociado con la terapia con bacteriófagos obstaculizará la tasa de crecimiento del mercado de terapia con bacteriófagos durante el período de pronóstico de 2022 a 2029. La falta de infraestructura de atención médica en las economías en desarrollo y el estricto escenario regulatorio desafiarán el mercado de terapia con bacteriófagos. Además, la falta de conciencia entre las personas y la disponibilidad de alternativas restringirán y obstaculizarán aún más la tasa de crecimiento del mercado durante el período de pronóstico de 2022 a 2029.
Este informe de mercado de terapia con bacteriófagos proporciona detalles de nuevos desarrollos recientes, regulaciones comerciales, análisis de importación y exportación, análisis de producción, optimización de la cadena de valor, participación de mercado, impacto de los actores del mercado nacional y localizado, analiza oportunidades en términos de bolsillos de ingresos emergentes, cambios en las regulaciones del mercado, análisis estratégico del crecimiento del mercado, tamaño del mercado, crecimientos del mercado de categorías, nichos de aplicación y dominio, aprobaciones de productos, lanzamientos de productos, expansiones geográficas, innovaciones tecnológicas en el mercado. Para obtener más información sobre el mercado de terapia con bacteriófagos, comuníquese con Data Bridge Market Research para obtener un informe de analista, nuestro equipo lo ayudará a tomar una decisión de mercado informada para lograr el crecimiento del mercado.
Análisis de la epidemiología de los pacientes
El mercado de terapia con bacteriófagos también le proporciona un análisis detallado del mercado para el análisis de pacientes, el pronóstico y las curas. La prevalencia, la incidencia, la mortalidad y las tasas de adherencia son algunas de las variables de datos que están disponibles en el informe. Se analizan los análisis de impacto directo o indirecto de la epidemiología en el crecimiento del mercado para crear un modelo estadístico multivariado de cohorte más sólido para pronosticar el mercado en el período de crecimiento.
Impacto de la COVID-19 en el mercado de terapias con bacteriófagos
La enfermedad se ha propagado a más de 100 países desde el brote viral de COVID-19 en diciembre de 2019, lo que llevó a la Organización Mundial de la Salud a designarla como una emergencia de salud pública. Además, la pandemia de COVID-19 planteó desafíos significativos para las empresas en el mercado mundial de terapia con bacteriófagos en múltiples frentes. El suministro de materias primas para producir formulaciones de medicamentos fue una gran dificultad debido a las inconsistencias en las instalaciones de transporte. Además, debido a una creciente población de pacientes que sufren COVID-19 y otras afecciones potencialmente mortales, los distribuidores de bienes se encontraron con una demanda errática de los minoristas. La pandemia de COVID-19 interrumpió los ensayos clínicos en los Estados Unidos, lo que afectó a actores importantes en todo el sector. Las licencias de personal, los protocolos de distanciamiento social, las pérdidas financieras y las preocupaciones sobre la seguridad de los pacientes afectaron las capacidades del sitio de investigación. Los patrocinadores, las CRO y otras empresas de apoyo al desarrollo de medicamentos se han mudado a entornos de trabajo remotos. Como resultado de la pandemia de COVID-19, se estima que el 80% de los ensayos no relacionados con COVID-19 se detuvieron o interrumpieron.
Alcance del mercado mundial de terapia con bacteriófagos
El mercado de terapia con bacteriófagos está segmentado en función del objetivo, el tipo, la base, la aplicación, la vía de administración, el usuario final y el canal de distribución. El crecimiento entre estos segmentos le ayudará a analizar los segmentos de crecimiento reducidos en las industrias y brindará a los usuarios una valiosa descripción general del mercado y conocimientos del mercado para ayudarlos a tomar decisiones estratégicas para identificar las principales aplicaciones del mercado.
Objetivo
- Escherichia coli
- Estafilococo
- Estreptococo
- Pseudomonas
- Salmonela
- Otros
Tipo
- Lítico
- Lisogénico
Base
- Caldo de cultivo estéril
- Base de gelatina soluble en agua
Solicitud
- Disentería bacteriana
- Infecciones de la piel y la mucosa nasal
- Infección supurativa de la piel
- Infecciones pulmonares y pleurales
- Infecciones de heridas posoperatorias
- Otros
Vía de administración
- Oral
- Parenteral
- Rectal
- Dérmico
- Otros
Usuarios finales
- Hospitales
- Clínicas de especialidades
- Cuidado domiciliario
- Otros
Canal de distribución
- Farmacia hospitalaria
- Farmacia minorista
- Farmacia en línea
- Otros
Análisis y perspectivas regionales del mercado de terapia con bacteriófagos
Se analiza el mercado de la terapia con bacteriófagos y se proporcionan información y tendencias del tamaño del mercado por país, objetivo, tipo, base, aplicación, vía de administración, usuario final y canal de distribución como se mencionó anteriormente.
Los países cubiertos en el informe de mercado de terapia con bacteriófagos son EE. UU., Canadá y México en América del Norte, Alemania, Francia, Reino Unido, Países Bajos, Suiza, Bélgica, Rusia, Italia, España, Turquía, Resto de Europa en Europa, China, Japón, India, Corea del Sur, Singapur, Malasia, Australia, Tailandia, Indonesia, Filipinas, Resto de Asia-Pacífico (APAC) en Asia-Pacífico (APAC), Arabia Saudita, Emiratos Árabes Unidos, Sudáfrica, Egipto, Israel, Resto de Medio Oriente y África (MEA) como parte de Medio Oriente y África (MEA), Brasil, Argentina y Resto de América del Sur como parte de América del Sur.
América del Norte domina el mercado de terapia con bacteriófagos en términos de participación de mercado e ingresos de mercado y seguirá fortaleciendo su dominio durante el período de pronóstico. Esto se debe a la recuperación inmediata y al efecto terapéutico proporcionado por el bacteriófago lítico y el aumento del gasto en atención médica impulsará aún más la tasa de crecimiento del mercado en esta región. Además, la presencia de actores clave importantes y el aumento en la adopción de tecnologías más nuevas impulsarán aún más la tasa de crecimiento del mercado en esta región.
Se espera que Asia-Pacífico sea la región de más rápido crecimiento durante el período de pronóstico de 2022 a 2029 debido al aumento de la inversión en I+D innovadora para nuevos productos farmacéuticos en esta región. Además, el desarrollo de la infraestructura de atención médica y el aumento de las iniciativas gubernamentales impulsarán aún más la tasa de crecimiento del mercado en esta región.
La sección de países del informe también proporciona factores de impacto de mercado individuales y cambios en la regulación en el mercado a nivel nacional que afectan las tendencias actuales y futuras del mercado. Puntos de datos como análisis de la cadena de valor aguas abajo y aguas arriba, tendencias técnicas y análisis de las cinco fuerzas de Porter, estudios de casos son algunos de los indicadores utilizados para pronosticar el escenario del mercado para países individuales. Además, la presencia y disponibilidad de marcas globales y sus desafíos enfrentados debido a la competencia grande o escasa de las marcas locales y nacionales, el impacto de los aranceles nacionales y las rutas comerciales se consideran al proporcionar un análisis de pronóstico de los datos del país.
Análisis del panorama competitivo y de la cuota de mercado de la terapia con bacteriófagos
El panorama competitivo del mercado de terapia con bacteriófagos proporciona detalles por competidor. Los detalles incluidos son una descripción general de la empresa, las finanzas de la empresa, los ingresos generados, el potencial de mercado, la inversión en investigación y desarrollo, las nuevas iniciativas de mercado, la presencia global, los sitios e instalaciones de producción, las capacidades de producción, las fortalezas y debilidades de la empresa, el lanzamiento del producto, la amplitud y la variedad del producto, el dominio de la aplicación. Los puntos de datos anteriores proporcionados solo están relacionados con el enfoque de las empresas en relación con el mercado de terapia con bacteriófagos.
Algunos de los principales actores que operan en el mercado de la terapia con bacteriófagos son:
- Microgen (Estados Unidos)
- Micreos (Países Bajos)
- ATCC (Estados Unidos)
- Intralytix, Inc. (Estados Unidos)
- Terapéutica adaptativa de fagos (EE. UU.)
- Armata Pharmaceuticals Inc. (Estados Unidos)
- LOCUS BIOSCIENCES, INC. (EE.UU.)
- Delmont Laboratories, Inc. (Estados Unidos)
- Nextbiotics (Estados Unidos)
- Pherecydes Pharma (Francia)
- iNtODEWORLD. Inc. (Estados Unidos)
- Enbiotix (Estados Unidos)
- Fixed-Phage Limited (Reino Unido)
- Cytophage Technologies Inc. (Canadá)
- Preparaciones biológicas Eliava LTD (Georgia)
- Phagelux, Inc. (China)
- InnoPhage, Ltd (Hong Kong)
- TecnoPhage (Portugal)
- Eligo Bioscience SA (Francia)
- BiomX Ltd. (Israel)
SKU-
Obtenga acceso en línea al informe sobre la primera nube de inteligencia de mercado del mundo
- Panel de análisis de datos interactivo
- Panel de análisis de empresas para oportunidades con alto potencial de crecimiento
- Acceso de analista de investigación para personalización y consultas
- Análisis de la competencia con panel interactivo
- Últimas noticias, actualizaciones y análisis de tendencias
- Aproveche el poder del análisis de referencia para un seguimiento integral de la competencia
Tabla de contenido
1 INTRODUCTION
1.1 OBJECTIVES OF THE STUDY
1.2 MARKET DEFINITION
1.3 OVERVIEW OF GLOBAL BACTERIOPHAGES THERAPY MARKET
1.4 LIMITATIONS
1.5 MARKETS COVERED
2 MARKET SEGMENTATION
2.1 MARKETS COVERED
2.2 GEOGRAPHICAL SCOPE
2.3 YEARS CONSIDERED FOR THE STUDY
2.4 CURRENCY AND PRICING
2.5 DBMR TRIPOD DATA VALIDATION MODEL
2.6 MULTIVARIATE MODELLING
2.7 TAREGET LIFELINE CURVE
2.8 PRIMARY INTERVIEWS WITH KEY OPINION LEADERS
2.9 DBMR MARKET POSITION GRID
2.1 MARKET APPLICATION COVERAGE GRID
2.11 VENDOR SHARE ANALYSIS
2.12 SECONDARY SOURCES
2.13 ASSUMPTIONS
3 EXECUTIVE SUMMARY
4 PREMIUM INSIGHTS
4.1 PORTERS FIVE FORCES MODEL
4.2 PESTEL ANALYSIS
5 GLOBAL BACTERIOPHAGES THERAPY MARKET: REGULATIONS
5.1 THE U.S. REGULATORY GUIDELINES FOR BACTERIOPHAGES
5.2 EUROPE REGULATORY GUIDELINE FOR BACTERIOPHAGE
5.3 JAPAN REGULATORY GUIDELINE FOR BACTERIOPHAGE
5.4 AUSTRALIA REGULATORY GUIDELINE FOR BACTERIOPHAGE
6 GLOBAL BACTERIOPHAGES THERAPY MARKET: REGIONAL SUMMARY
7 RESEARCH AND DEVELOPMENT ANALYSIS: GLOBAL BACTERIOPHAGES THERAPY MARKET
7.1 PIPELINE ANALYSIS
8 MARKET OVERVIEW
8.1 DRIVERS
8.1.1 INCREASING PREVALENCE OF ANTIBIOTIC-RESISTANT INFECTIONS
8.1.2 INCREASING RESEARCH AND DEVELOPMENT ACTIVITIES
8.1.3 INCREASING GOVERNMENT FUNDING
8.1.4 INCREASING PRIVATE SECTOR FUNDING
8.1.5 TECHNOLOGICAL ADVANCEMENTS
8.2 RESTRAINTS
8.2.1 HIGH COST ASSOCIATED WITH BACTERIOPHAGE THERAPY
8.2.2 LACK OF SKILLED PROFESSIONALS
8.2.3 SIDE-EFFECTS OF BACTERIOPHAGE THERAPY
8.2.4 AVAILABILITY OF ALTERNATIVE THERAPIES FOR ANTIBIOTIC RESISTANCE
8.3 OPPORTUNITIES
8.3.1 PRESENCE OF NOVEL PIPELINE DRUGS
8.3.2 STRATEGIC INITIATIVES BY MARKET PLAYERS
8.3.3 INCREASING HEALTHCARE EXPENDITURE
8.4 CHALLENGES
8.4.1 LIMITATIONS OF BACTERIOPHAGE THERAPY
8.4.2 LACK OF PROPER REGULATORY GUIDELINES
9 IMPACT OF COVID-19 ON GLOBAL BACTERIOPHAGES THERAPY MARKET
9.1 IMPACT ON THE PRICE
9.2 IMPACT ON DEMAND
9.3 IMPACT ON SUPPLY
9.4 STRATEGIC INITIATIVES BY MANUFACTURERS
9.5 CONCLUSION
10 GLOBAL BACTERIOPHAGES THERAPY MARKET, BY TARGET
10.1 OVERVIEW
10.2 STAPHYLOCOCCUS
10.3 ESCHERICHIA COLI
10.4 PSEUDOMONAS
10.5 STREPTOCOCCUS
10.6 SALMONELLA
10.7 OTHERS
11 GLOBAL BACTERIOPHAGES THERAPY MARKET, BY TYPE
11.1 OVERVIEW
11.2 LYTIC
11.3 LYSOGENIC
12 GLOBAL BACTERIOPHAGES THERAPY MARKET, BY BASE
12.1 OVERVIEW
12.2 STERILE BROTH CULTURE
12.3 WATER-SOLUBLE JELLY BASE
13 GLOBAL BACTERIOPHAGES THERAPY MARKET, BY APPLICATION
13.1 OVERVIEW
13.2 POSTOPERATIVE WOUND INFECTIONS
13.3 INFECTIONS OF SKIN AND NASAL MUCOSA
13.4 BACTERIAL DYSENTERY
13.5 SUPPURATIVE SKIN INFECTIONS
13.6 LUNG AND PLEURAL INFECTION
13.7 OTHERS
14 GLOBAL BACTERIOPHAGES THERAPY MARKET, BY ROUTE OF ADMINISTRATION
14.1 OVERVIEW
14.2 ORAL
14.2.1 LIQUID
14.2.2 TABLET
14.3 DERMAL
14.4 PARENTERAL
14.4.1 INTRAVENOUSLY
14.4.2 INTRAPLEURAL INJECTIONS
14.5 OTHERS
15 GLOBAL BACTERIOPHAGES THERAPY MARKET, BY END USER
15.1 OVERVIEW
15.2 HOSPITALS
15.3 SPECILAITY CLINICS
15.4 ACADEMIC RESEARCH & INSTITUTES
15.5 OTHERS
16 GLOBAL BACTERIOPHAGES THERAPY MARKET, BY DISTRIBUTION CHANNEL
16.1 OVERVIEW
16.2 DIRECT TENDER
16.3 THIRD PARTY DISTRIBUTORS
17 GLOBAL BACTERIOPHAGES THERAPY MARKET, BY REGION
17.1 OVERVIEW
17.2 NORTH AMERICA
17.2.1 U.S.
17.2.2 CANADA
17.3 EUROPE
17.3.1 GEORGIA
17.3.2 RUSSIA
17.3.3 BELGIUM
17.3.4 POLAND
17.3.5 FRANCE
17.3.6 NETHERLANDS
17.3.7 U.K.
17.3.8 ITALY
17.3.9 GERMANY
17.3.10 TURKEY
17.3.11 SWITZERLAND
17.3.12 REST OF EUROPE
17.4 MIDDLE EAST & AFRICA
17.4.1 SOUTH AFRICA
17.4.2 SAUDI ARABIA
17.4.3 ISRAEL
17.4.4 EGYPT
17.4.5 REST OF MIDDLE EAST & AFRICA
17.5 ASIA-PACIFIC
17.5.1 CHINA
17.5.2 JAPAN
17.5.3 INDIA
17.5.4 AUSTRALIA
17.5.5 SOUTH KOREA
17.5.6 SINGAPORE
17.5.7 REST OF ASIA-PACIFIC
17.6 SOUTH AMERICA
17.6.1 BRAZIL
17.6.2 ARGENTINA
17.6.3 REST OF SOUTH AMERICA
18 GLOBAL BACTERIOPHAGES THERAPY MARKET: COMPANY LANDSCAPE
18.1 COMPANY SHARE ANALYSIS: GLOBAL
18.2 COMPANY SHARE ANALYSIS: NORTH AMERICA
18.3 COMPANY SHARE ANALYSIS: EUROPE
18.4 COMPANY SHARE ANALYSIS: ASIA-PACIFIC
19 SWOT ANALYSIS
20 COMPANY PROFILE
20.1 MICROGEN
20.1.1 COMPANY SNAPSHOT
20.1.2 COMPANY SHARE ANALYSIS
20.1.3 PRODUCT PORTFOLIO
20.1.4 RECENT DEVELOPMENTS
20.2 ADAPTIVE PHAGE THERAPEUTICS
20.2.1 COMPANY SNAPSHOT
20.2.2 COMPANY SHARE ANALYSIS
20.2.3 PRODUCT PORTFOLIO
20.2.4 RECENT DEVELOPMENTS
20.3 PHAGELUX,INC
20.3.1 COMPANY SNAPSHOT
20.3.2 COMPANY SHARE ANALYSIS
20.3.3 PRODUCT PORTFOLIO
20.3.4 RECENT DEVELOPMENTS
20.4 LOCUS BIOSCIENCES, INC.
20.4.1 COMPANY SNAPSHOT
20.4.2 COMPANY SHARE ANALYSIS
20.4.3 PRODUCT PORTFOLIO
20.4.4 RECENT DEVELOPMENTS
20.5 ATCC
20.5.1 COMPANY SNAPSHOT
20.5.2 COMPANY SHARE ANALYSIS
20.5.3 PRODUCT PORTFOLIO
20.5.4 RECENT DEVELOPMENTS
20.6 INTRALYTIX, INC.
20.6.1 COMPANY SNAPSHOT
20.6.2 PRODUCT PORTFOLIO
20.6.3 RECENT DEVELOPMENTS
20.7 MICREOS
20.7.1 COMPANY SNAPSHOT
20.7.2 PRODUCT PORTFOLIO
20.7.3 RECENT DEVELOPMENT
20.8 PYLUM
20.8.1 COMPANY SNAPSHOT
20.8.2 TECHNOLOGY PORTFOLIO
20.8.3 RECENT DEVELOPMENTS
20.9 FIXED-PHAGE LIMITED
20.9.1 COMPANY SNAPSHOT
20.9.2 PRODUCT PORTFOLIO
20.9.3 RECENT DEVELOPMENTS
20.1 ARMATA PHARMACEUTICALS, INC.
20.10.1 COMPANY SNAPSHOT
20.10.2 PRODUCT PORTFOLIO
20.10.3 RECENT DEVELOPMENTS
20.11 ARTHUR ANDREW MEDICAL
20.11.1 COMPANY SNAPSHOT
20.11.2 PRODUCT PORTFOLIO
20.11.3 RECENT DEVELOPMENT
20.12 CYTOPHAGE TECHNOLOGIES INC.
20.12.1 COMPANY SNAPSHOT
20.12.2 PRODUCT PORTFOLIO
20.12.3 RECENT DEVELOPMENT
20.13 ENBIOTIX, INC.
20.13.1 COMPANY SNAPSHOT
20.13.2 PRODUCT PORTFOLIO
20.13.3 RECENT DEVELOPMENTS
20.14 INTODEWORLD, INC.
20.14.1 COMPANY SNAPSHOT
20.14.2 PRODUCT PORTFOLIO
20.14.3 RECENT DEVELOPMENT
20.15 NEXTBIOTICS
20.15.1 COMPANY SNAPSHOT
20.15.2 TECHNOLOGY PORTFOLIO
20.15.3 RECENT DEVELOPMENT
20.16 PHERECYDES PHARMA
20.16.1 COMPANY SNAPSHOT
20.16.2 PRODUCT PORTFOLIO
20.16.3 RECENT DEVELOPMENT
21 QUESTIONNAIRE
22 RELATED REPORTS
Lista de Tablas
TABLE 1 GLOBAL BACTERIOPHAGES THERAPY MARKET, BY TARGET, 2019-2028 (USD MILLION)
TABLE 2 GLOBAL STAPHYLOCOCCUS IN BACTERIOPHAGES THERAPY MARKET, BY REGION, 2019-2028 (USD MILLION)
TABLE 3 GLOBAL ESCHERICHIA COLI IN BACTERIOPHAGES THERAPY MARKET, BY REGION, 2019-2028 (USD MILLION)
TABLE 4 GLOBAL PSEUDOMONAS IN BACTERIOPHAGES THERAPY MARKET, BY REGION, 2019-2028 (USD MILLION)
TABLE 5 GLOBAL STREPTOCOCCUS IN BACTERIOPHAGES THERAPY MARKET, BY REGION, 2019-2028 (USD MILLION)
TABLE 6 GLOBAL SALMONELLA IN BACTERIOPHAGES THERAPY MARKET, BY REGION, 2019-2028 (USD MILLION)
TABLE 7 GLOBAL OTHERS IN BACTERIOPHAGES THERAPY MARKET, BY REGION, 2019-2028 (USD MILLION)
TABLE 8 GLOBAL BACTERIOPHAGES THERAPY MARKET, BY TYPE, 2019-2028 (USD MILLION)
TABLE 9 GLOBAL LYTIC IN BACTERIOPHAGES THERAPY MARKET, BY REGION, 2019-2028 (USD MILLION)
TABLE 10 GLOBAL LYSOGENIC IN BACTERIOPHAGES THERAPY MARKET, BY REGION, 2019-2028 (USD MILLION)
TABLE 11 GLOBAL BACTERIOPHAGES THERAPY MARKET, BY BASE, 2019-2028 (USD MILLION)
TABLE 12 GLOBAL STERILE BROTH CULTURE IN BACTERIOPHAGES THERAPY MARKET, BY REGION, 2019-2028 (USD MILLION)
TABLE 13 GLOBAL WATER-SOLUBLE JELLY BASE IN BACTERIOPHAGES THERAPY MARKET, BY REGION, 2019-2028 (USD MILLION)
TABLE 14 GLOBAL BACTERIOPHAGES THERAPY MARKET, BY APPLICATION, 2019-2028 (USD MILLION)
TABLE 15 GLOBAL POSTOPERATIVE WOUND INFECTIONS IN BACTERIOPHAGES THERAPY MARKET, BY REGION, 2019-2028 (USD MILLION)
TABLE 16 GLOBAL INFECTIONS OF SKIN AND NASAL MUCOSA IN BACTERIOPHAGES THERAPY MARKET, BY REGION, 2019-2028 (USD MILLION)
TABLE 17 GLOBAL BACTERIAL DYSENTERY IN BACTERIOPHAGES THERAPY MARKET, BY REGION, 2019-2028 (USD MILLION)
TABLE 18 GLOBAL SUPPURATIVE SKIN INFECTIONS IN BACTERIOPHAGES THERAPY MARKET, BY REGION, 2019-2028 (USD MILLION)
TABLE 19 GLOBAL LUNG AND PLEURAL INFECTION IN BACTERIOPHAGES THERAPY MARKET, BY REGION, 2019-2028 (USD MILLION)
TABLE 20 GLOBAL OTHERS IN BACTERIOPHAGES THERAPY MARKET, BY REGION, 2019-2028 (USD MILLION)
TABLE 21 GLOBAL BACTERIOPHAGES THERAPY MARKET, BY ROUTE OF ADMINISTRATION, 2019-2028 (USD MILLION)
TABLE 22 GLOBAL ORAL IN BACTERIOPHAGES THERAPY MARKET, BY REGION, 2019-2028 (USD MILLION)
TABLE 23 GLOBAL ORAL IN BACTERIOPHAGES THERAPY MARKET, BY ROUTE OF ADMINISTRATION, 2019-2028 (USD MILLION)
TABLE 24 GLOBAL DERMAL IN BACTERIOPHAGES THERAPY MARKET, BY REGION, 2019-2028 (USD MILLION)
TABLE 25 GLOBAL PARENTERAL IN BACTERIOPHAGES THERAPY MARKET, BY REGION, 2019-2028 (USD MILLION)
TABLE 26 GLOBAL PARENTERAL IN BACTERIOPHAGES THERAPY MARKET, BY ROUTE OF ADMINISTRATION, 2019-2028 (USD MILLION)
TABLE 27 GLOBAL OTHERS IN BACTERIOPHAGES THERAPY MARKET, BY REGION, 2019-2028 (USD MILLION)
TABLE 28 GLOBAL BACTERIOPHAGES THERAPY MARKET, BY END USER, 2019-2028 (USD MILLION)
TABLE 29 GLOBAL HOSPITALS IN BACTERIOPHAGES THERAPY MARKET, BY REGION, 2019-2028 (USD MILLION)
TABLE 30 GLOBAL SPECILIATY CLINICS IN BACTERIOPHAGES THERAPY MARKET, BY REGION, 2019-2028 (USD MILLION)
TABLE 31 GLOBAL ACADEMIC RESEARCH & INSTITUTES IN BACTERIOPHAGES THERAPY MARKET, BY REGION, 2019-2028 (USD MILLION)
TABLE 32 GLOBAL OTHERS IN BACTERIOPHAGES THERAPY MARKET, BY REGION, 2019-2028 (USD MILLION)
TABLE 33 GLOBAL BACTERIOPHAGES THERAPY MARKET, BY DISTRIBUTION CHANNEL, 2019-2028 (USD MILLION)
TABLE 34 GLOBAL DIRECT TENDER IN BACTERIOPHAGES THERAPY MARKET, BY REGION, 2019-2028 (USD MILLION)
TABLE 35 GLOBAL THIRD PARTY DISTRIBUTORS IN BACTERIOPHAGES THERAPY MARKET, BY REGION, 2019-2028 (USD MILLION)
TABLE 36 GLOBAL BACTERIOPHAGES THERAPY MARKET, BY REGION, 2019-2028 (USD MILLION)
TABLE 37 NORTH AMERICA BACTERIOPHAGES THERAPY MARKET, BY COUNTRY, 2019-2028 (USD MILLION)
TABLE 38 NORTH AMERICA BACTERIOPHAGES THERAPY MARKET, BY TARGET, 2019-2028 (USD MILLION)
TABLE 39 NORTH AMERICA BACTERIOPHAGES THERAPY MARKET, BY TYPE, 2019-2028 (USD MILLION)
TABLE 40 NORTH AMERICA BACTERIOPHAGES THERAPY MARKET, BY BASE, 2019-2028 (USD MILLION)
TABLE 41 NORTH AMERICA BACTERIOPHAGES THERAPY MARKET, BY APPLICATION, 2019-2028 (USD MILLION)
TABLE 42 NORTH AMERICA BACTERIOPHAGES THERAPY MARKET, BY ROUTE OF ADMINISTRATION, 2019-2028 (USD MILLION)
TABLE 43 NORTH AMERICA ORAL IN BACTERIOPHAGES THERAPY MARKET, BY ROUTE OF ADMINISTRATION, 2019-2028 (USD MILLION)
TABLE 44 NORTH AMERICA PARENTERAL IN BACTERIOPHAGES THERAPY MARKET, BY ROUTE OF ADMINISTRATION, 2019-2028 (USD MILLION)
TABLE 45 NORTH AMERICA BACTERIOPHAGES THERAPY MARKET, BY END USER, 2019-2028 (USD MILLION)
TABLE 46 NORTH AMERICA BACTERIOPHAGES THERAPY MARKET, BY DISTRIBUTION CHANNEL, 2019-2028 (USD MILLION)
TABLE 47 U.S. BACTERIOPHAGES THERAPY MARKET, BY TARGET, 2019-2028 (USD MILLION)
TABLE 48 U.S. BACTERIOPHAGES THERAPY MARKET, BY TYPE, 2019-2028 (USD MILLION)
TABLE 49 U.S. BACTERIOPHAGES THERAPY MARKET, BY BASE, 2019-2028 (USD MILLION)
TABLE 50 U.S. BACTERIOPHAGES THERAPY MARKET, BY APPLICATION, 2019-2028 (USD MILLION)
TABLE 51 U.S. BACTERIOPHAGES THERAPY MARKET, BY ROUTE OF ADMINISTRATION, 2019-2028 (USD MILLION)
TABLE 52 U.S. ORAL IN BACTERIOPHAGES THERAPY MARKET, BY ROUTE OF ADMINISTRATION, 2019-2028 (USD MILLION)
TABLE 53 U.S. PARENTERAL IN BACTERIOPHAGES THERAPY MARKET, BY ROUTE OF ADMINISTRATION, 2019-2028 (USD MILLION)
TABLE 54 U.S. BACTERIOPHAGES THERAPY MARKET, BY END USER, 2019-2028 (USD MILLION)
TABLE 55 U.S. BACTERIOPHAGES THERAPY MARKET, BY DISTRIBUTION CHANNEL, 2019-2028 (USD MILLION)
TABLE 56 CANADA BACTERIOPHAGES THERAPY MARKET, BY TARGET, 2019-2028 (USD MILLION)
TABLE 57 CANADA BACTERIOPHAGES THERAPY MARKET, BY TYPE, 2019-2028 (USD MILLION)
TABLE 58 CANADA BACTERIOPHAGES THERAPY MARKET, BY BASE, 2019-2028 (USD MILLION)
TABLE 59 CANADA BACTERIOPHAGES THERAPY MARKET, BY APPLICATION, 2019-2028 (USD MILLION)
TABLE 60 CANADA BACTERIOPHAGES THERAPY MARKET, BY ROUTE OF ADMINISTRATION, 2019-2028 (USD MILLION)
TABLE 61 CANADA ORAL IN BACTERIOPHAGES THERAPY MARKET, BY ROUTE OF ADMINISTRATION, 2019-2028 (USD MILLION)
TABLE 62 CANADA PARENTERAL IN BACTERIOPHAGES THERAPY MARKET, BY ROUTE OF ADMINISTRATION, 2019-2028 (USD MILLION)
TABLE 63 CANADA BACTERIOPHAGES THERAPY MARKET, BY END USER, 2019-2028 (USD MILLION)
TABLE 64 CANADA BACTERIOPHAGES THERAPY MARKET, BY DISTRIBUTION CHANNEL, 2019-2028 (USD MILLION)
TABLE 65 EUROPE BACTERIOPHAGES THERAPY MARKET, BY COUNTRY, 2019-2028 (USD MILLION)
TABLE 66 EUROPE BACTERIOPHAGES THERAPY MARKET, BY TARGET, 2019-2028 (USD MILLION)
TABLE 67 EUROPE BACTERIOPHAGES THERAPY MARKET, BY TYPE, 2019-2028 (USD MILLION)
TABLE 68 EUROPE BACTERIOPHAGES THERAPY MARKET, BY BASE, 2019-2028 (USD MILLION)
TABLE 69 EUROPE BACTERIOPHAGES THERAPY MARKET, BY APPLICATION, 2019-2028 (USD MILLION)
TABLE 70 EUROPE BACTERIOPHAGES THERAPY MARKET, BY ROUTE OF ADMINISTRATION, 2019-2028 (USD MILLION)
TABLE 71 EUROPE ORAL IN BACTERIOPHAGES THERAPY MARKET, BY ROUTE OF ADMINISTRATION, 2019-2028 (USD MILLION)
TABLE 72 EUROPE PARENTERAL IN BACTERIOPHAGES THERAPY MARKET, BY ROUTE OF ADMINISTRATION, 2019-2028 (USD MILLION)
TABLE 73 EUROPE BACTERIOPHAGES THERAPY MARKET, BY END USER, 2019-2028 (USD MILLION)
TABLE 74 EUROPE BACTERIOPHAGES THERAPY MARKET, BY DISTRIBUTION CHANNEL, 2019-2028 (USD MILLION)
TABLE 75 GEORGIA BACTERIOPHAGES THERAPY MARKET, BY TARGET, 2019-2028 (USD MILLION)
TABLE 76 GEORGIA BACTERIOPHAGES THERAPY MARKET, BY TYPE, 2019-2028 (USD MILLION)
TABLE 77 GEORGIA BACTERIOPHAGES THERAPY MARKET, BY BASE, 2019-2028 (USD MILLION)
TABLE 78 GEORGIA BACTERIOPHAGES THERAPY MARKET, BY APPLICATION, 2019-2028 (USD MILLION)
TABLE 79 GEORGIA BACTERIOPHAGES THERAPY MARKET, BY ROUTE OF ADMINISTRATION, 2019-2028 (USD MILLION)
TABLE 80 GEORGIA ORAL IN BACTERIOPHAGES THERAPY MARKET, BY ROUTE OF ADMINISTRATION, 2019-2028 (USD MILLION)
TABLE 81 GEORGIA PARENTERAL IN BACTERIOPHAGES THERAPY MARKET, BY ROUTE OF ADMINISTRATION, 2019-2028 (USD MILLION)
TABLE 82 GEORGIA BACTERIOPHAGES THERAPY MARKET, BY END USER, 2019-2028 (USD MILLION)
TABLE 83 GEORGIA BACTERIOPHAGES THERAPY MARKET, BY DISTRIBUTION CHANNEL, 2019-2028 (USD MILLION)
TABLE 84 RUSSIA BACTERIOPHAGES THERAPY MARKET, BY TARGET, 2019-2028 (USD MILLION)
TABLE 85 RUSSIA BACTERIOPHAGES THERAPY MARKET, BY TYPE, 2019-2028 (USD MILLION)
TABLE 86 RUSSIA BACTERIOPHAGES THERAPY MARKET, BY BASE, 2019-2028 (USD MILLION)
TABLE 87 RUSSIA BACTERIOPHAGES THERAPY MARKET, BY APPLICATION, 2019-2028 (USD MILLION)
TABLE 88 RUSSIA BACTERIOPHAGES THERAPY MARKET, BY ROUTE OF ADMINISTRATION, 2019-2028 (USD MILLION)
TABLE 89 RUSSIA ORAL IN BACTERIOPHAGES THERAPY MARKET, BY ROUTE OF ADMINISTRATION, 2019-2028 (USD MILLION)
TABLE 90 RUSSIA PARENTERAL IN BACTERIOPHAGES THERAPY MARKET, BY ROUTE OF ADMINISTRATION, 2019-2028 (USD MILLION)
TABLE 91 RUSSIA BACTERIOPHAGES THERAPY MARKET, BY END USER, 2019-2028 (USD MILLION)
TABLE 92 RUSSIA BACTERIOPHAGES THERAPY MARKET, BY DISTRIBUTION CHANNEL, 2019-2028 (USD MILLION)
TABLE 93 BELGIUM BACTERIOPHAGES THERAPY MARKET, BY TARGET, 2019-2028 (USD MILLION)
TABLE 94 BELGIUM BACTERIOPHAGES THERAPY MARKET, BY TYPE, 2019-2028 (USD MILLION)
TABLE 95 BELGIUM BACTERIOPHAGES THERAPY MARKET, BY BASE, 2019-2028 (USD MILLION)
TABLE 96 BELGIUM BACTERIOPHAGES THERAPY MARKET, BY APPLICATION, 2019-2028 (USD MILLION)
TABLE 97 BELGIUM BACTERIOPHAGES THERAPY MARKET, BY ROUTE OF ADMINISTRATION, 2019-2028 (USD MILLION)
TABLE 98 BELGIUM ORAL IN BACTERIOPHAGES THERAPY MARKET, BY ROUTE OF ADMINISTRATION, 2019-2028 (USD MILLION)
TABLE 99 BELGIUM PARENTERAL IN BACTERIOPHAGES THERAPY MARKET, BY ROUTE OF ADMINISTRATION, 2019-2028 (USD MILLION)
TABLE 100 BELGIUM BACTERIOPHAGES THERAPY MARKET, BY END USER, 2019-2028 (USD MILLION)
TABLE 101 BELGIUM BACTERIOPHAGES THERAPY MARKET, BY DISTRIBUTION CHANNEL, 2019-2028 (USD MILLION)
TABLE 102 POLAND BACTERIOPHAGES THERAPY MARKET, BY TARGET, 2019-2028 (USD MILLION)
TABLE 103 POLAND BACTERIOPHAGES THERAPY MARKET, BY TYPE, 2019-2028 (USD MILLION)
TABLE 104 POLAND BACTERIOPHAGES THERAPY MARKET, BY BASE, 2019-2028 (USD MILLION)
TABLE 105 POLAND BACTERIOPHAGES THERAPY MARKET, BY APPLICATION, 2019-2028 (USD MILLION)
TABLE 106 POLAND BACTERIOPHAGES THERAPY MARKET, BY ROUTE OF ADMINISTRATION, 2019-2028 (USD MILLION)
TABLE 107 POLAND ORAL IN BACTERIOPHAGES THERAPY MARKET, BY ROUTE OF ADMINISTRATION, 2019-2028 (USD MILLION)
TABLE 108 POLAND PARENTERAL IN BACTERIOPHAGES THERAPY MARKET, BY ROUTE OF ADMINISTRATION, 2019-2028 (USD MILLION)
TABLE 109 POLAND BACTERIOPHAGES THERAPY MARKET, BY END USER, 2019-2028 (USD MILLION)
TABLE 110 POLAND BACTERIOPHAGES THERAPY MARKET, BY DISTRIBUTION CHANNEL, 2019-2028 (USD MILLION)
TABLE 111 FRANCE BACTERIOPHAGES THERAPY MARKET, BY TARGET, 2019-2028 (USD MILLION)
TABLE 112 FRANCE BACTERIOPHAGES THERAPY MARKET, BY TYPE, 2019-2028 (USD MILLION)
TABLE 113 FRANCE BACTERIOPHAGES THERAPY MARKET, BY BASE, 2019-2028 (USD MILLION)
TABLE 114 FRANCE BACTERIOPHAGES THERAPY MARKET, BY APPLICATION, 2019-2028 (USD MILLION)
TABLE 115 FRANCE BACTERIOPHAGES THERAPY MARKET, BY ROUTE OF ADMINISTRATION, 2019-2028 (USD MILLION)
TABLE 116 FRANCE ORAL IN BACTERIOPHAGES THERAPY MARKET, BY ROUTE OF ADMINISTRATION, 2019-2028 (USD MILLION)
TABLE 117 FRANCE PARENTERAL IN BACTERIOPHAGES THERAPY MARKET, BY ROUTE OF ADMINISTRATION, 2019-2028 (USD MILLION)
TABLE 118 FRANCE BACTERIOPHAGES THERAPY MARKET, BY END USER, 2019-2028 (USD MILLION)
TABLE 119 FRANCE BACTERIOPHAGES THERAPY MARKET, BY DISTRIBUTION CHANNEL, 2019-2028 (USD MILLION)
TABLE 120 NETHERLANDS BACTERIOPHAGES THERAPY MARKET, BY TARGET, 2019-2028 (USD MILLION)
TABLE 121 NETHERLANDS BACTERIOPHAGES THERAPY MARKET, BY TYPE, 2019-2028 (USD MILLION)
TABLE 122 NETHERLANDS BACTERIOPHAGES THERAPY MARKET, BY BASE, 2019-2028 (USD MILLION)
TABLE 123 NETHERLANDS BACTERIOPHAGES THERAPY MARKET, BY APPLICATION, 2019-2028 (USD MILLION)
TABLE 124 NETHERLANDS BACTERIOPHAGES THERAPY MARKET, BY ROUTE OF ADMINISTRATION, 2019-2028 (USD MILLION)
TABLE 125 NETHERLANDS ORAL IN BACTERIOPHAGES THERAPY MARKET, BY ROUTE OF ADMINISTRATION, 2019-2028 (USD MILLION)
TABLE 126 NETHERLANDS PARENTERAL IN BACTERIOPHAGES THERAPY MARKET, BY ROUTE OF ADMINISTRATION, 2019-2028 (USD MILLION)
TABLE 127 NETHERLANDS BACTERIOPHAGES THERAPY MARKET, BY END USER, 2019-2028 (USD MILLION)
TABLE 128 NETHERLANDS BACTERIOPHAGES THERAPY MARKET, BY DISTRIBUTION CHANNEL, 2019-2028 (USD MILLION)
TABLE 129 U.K. BACTERIOPHAGES THERAPY MARKET, BY TARGET, 2019-2028 (USD MILLION)
TABLE 130 U.K. BACTERIOPHAGES THERAPY MARKET, BY TYPE, 2019-2028 (USD MILLION)
TABLE 131 U.K. BACTERIOPHAGES THERAPY MARKET, BY BASE, 2019-2028 (USD MILLION)
TABLE 132 U.K. BACTERIOPHAGES THERAPY MARKET, BY APPLICATION, 2019-2028 (USD MILLION)
TABLE 133 U.K. BACTERIOPHAGES THERAPY MARKET, BY ROUTE OF ADMINISTRATION, 2019-2028 (USD MILLION)
TABLE 134 U.K. ORAL IN BACTERIOPHAGES THERAPY MARKET, BY ROUTE OF ADMINISTRATION, 2019-2028 (USD MILLION)
TABLE 135 U.K. PARENTERAL IN BACTERIOPHAGES THERAPY MARKET, BY ROUTE OF ADMINISTRATION, 2019-2028 (USD MILLION)
TABLE 136 U.K. BACTERIOPHAGES THERAPY MARKET, BY END USER, 2019-2028 (USD MILLION)
TABLE 137 U.K. BACTERIOPHAGES THERAPY MARKET, BY DISTRIBUTION CHANNEL, 2019-2028 (USD MILLION)
TABLE 138 ITALY BACTERIOPHAGES THERAPY MARKET, BY TARGET, 2019-2028 (USD MILLION)
TABLE 139 ITALY BACTERIOPHAGES THERAPY MARKET, BY TYPE, 2019-2028 (USD MILLION)
TABLE 140 ITALY BACTERIOPHAGES THERAPY MARKET, BY BASE, 2019-2028 (USD MILLION)
TABLE 141 ITALY BACTERIOPHAGES THERAPY MARKET, BY APPLICATION, 2019-2028 (USD MILLION)
TABLE 142 ITALY BACTERIOPHAGES THERAPY MARKET, BY ROUTE OF ADMINISTRATION, 2019-2028 (USD MILLION)
TABLE 143 ITALY ORAL IN BACTERIOPHAGES THERAPY MARKET, BY ROUTE OF ADMINISTRATION, 2019-2028 (USD MILLION)
TABLE 144 ITALY PARENTERAL IN BACTERIOPHAGES THERAPY MARKET, BY ROUTE OF ADMINISTRATION, 2019-2028 (USD MILLION)
TABLE 145 ITALY BACTERIOPHAGES THERAPY MARKET, BY END USER, 2019-2028 (USD MILLION)
TABLE 146 ITALY BACTERIOPHAGES THERAPY MARKET, BY DISTRIBUTION CHANNEL, 2019-2028 (USD MILLION)
TABLE 147 GERMANY BACTERIOPHAGES THERAPY MARKET, BY TARGET, 2019-2028 (USD MILLION)
TABLE 148 GERMANY BACTERIOPHAGES THERAPY MARKET, BY TYPE, 2019-2028 (USD MILLION)
TABLE 149 GERMANY BACTERIOPHAGES THERAPY MARKET, BY BASE, 2019-2028 (USD MILLION)
TABLE 150 GERMANY BACTERIOPHAGES THERAPY MARKET, BY APPLICATION, 2019-2028 (USD MILLION)
TABLE 151 GERMANY BACTERIOPHAGES THERAPY MARKET, BY ROUTE OF ADMINISTRATION, 2019-2028 (USD MILLION)
TABLE 152 GERMANY ORAL IN BACTERIOPHAGES THERAPY MARKET, BY ROUTE OF ADMINISTRATION, 2019-2028 (USD MILLION)
TABLE 153 GERMANY PARENTERAL IN BACTERIOPHAGES THERAPY MARKET, BY ROUTE OF ADMINISTRATION, 2019-2028 (USD MILLION)
TABLE 154 GERMANY BACTERIOPHAGES THERAPY MARKET, BY END USER, 2019-2028 (USD MILLION)
TABLE 155 GERMANY BACTERIOPHAGES THERAPY MARKET, BY DISTRIBUTION CHANNEL, 2019-2028 (USD MILLION)
TABLE 156 TURKEY BACTERIOPHAGES THERAPY MARKET, BY TARGET, 2019-2028 (USD MILLION)
TABLE 157 TURKEY BACTERIOPHAGES THERAPY MARKET, BY TYPE, 2019-2028 (USD MILLION)
TABLE 158 TURKEY BACTERIOPHAGES THERAPY MARKET, BY BASE, 2019-2028 (USD MILLION)
TABLE 159 TURKEY BACTERIOPHAGES THERAPY MARKET, BY APPLICATION, 2019-2028 (USD MILLION)
TABLE 160 TURKEY BACTERIOPHAGES THERAPY MARKET, BY ROUTE OF ADMINISTRATION, 2019-2028 (USD MILLION)
TABLE 161 TURKEY ORAL IN BACTERIOPHAGES THERAPY MARKET, BY ROUTE OF ADMINISTRATION, 2019-2028 (USD MILLION)
TABLE 162 TURKEY PARENTERAL IN BACTERIOPHAGES THERAPY MARKET, BY ROUTE OF ADMINISTRATION, 2019-2028 (USD MILLION)
TABLE 163 TURKEY BACTERIOPHAGES THERAPY MARKET, BY END USER, 2019-2028 (USD MILLION)
TABLE 164 TURKEY BACTERIOPHAGES THERAPY MARKET, BY DISTRIBUTION CHANNEL, 2019-2028 (USD MILLION)
TABLE 165 SWITZERLAND BACTERIOPHAGES THERAPY MARKET, BY TARGET, 2019-2028 (USD MILLION)
TABLE 166 SWITZERLAND BACTERIOPHAGES THERAPY MARKET, BY TYPE, 2019-2028 (USD MILLION)
TABLE 167 SWITZERLAND BACTERIOPHAGES THERAPY MARKET, BY BASE, 2019-2028 (USD MILLION)
TABLE 168 SWITZERLAND BACTERIOPHAGES THERAPY MARKET, BY APPLICATION, 2019-2028 (USD MILLION)
TABLE 169 SWITZERLAND BACTERIOPHAGES THERAPY MARKET, BY ROUTE OF ADMINISTRATION, 2019-2028 (USD MILLION)
TABLE 170 SWITZERLAND ORAL IN BACTERIOPHAGES THERAPY MARKET, BY ROUTE OF ADMINISTRATION, 2019-2028 (USD MILLION)
TABLE 171 SWITZERLAND PARENTERAL IN BACTERIOPHAGES THERAPY MARKET, BY ROUTE OF ADMINISTRATION, 2019-2028 (USD MILLION)
TABLE 172 SWITZERLAND BACTERIOPHAGES THERAPY MARKET, BY END USER, 2019-2028 (USD MILLION)
TABLE 173 SWITZERLAND BACTERIOPHAGES THERAPY MARKET, BY DISTRIBUTION CHANNEL, 2019-2028 (USD MILLION)
TABLE 174 REST OF EUROPE BACTERIOPHAGES THERAPY MARKET, BY TARGET, 2019-2028 (USD MILLION)
TABLE 175 MIDDLE EAST & AFRICA BACTERIOPHAGES THERAPY MARKET, BY COUNTRY, 2019-2028 (USD MILLION)
TABLE 176 MIDDLE EAST & AFRICA BACTERIOPHAGES THERAPY MARKET, BY TARGET, 2019-2028 (USD MILLION)
TABLE 177 MIDDLE EAST & AFRICA BACTERIOPHAGES THERAPY MARKET, BY TYPE, 2019-2028 (USD MILLION)
TABLE 178 MIDDLE EAST & AFRICA BACTERIOPHAGES THERAPY MARKET, BY BASE, 2019-2028 (USD MILLION)
TABLE 179 MIDDLE EAST & AFRICA BACTERIOPHAGES THERAPY MARKET, BY APPLICATION, 2019-2028 (USD MILLION)
TABLE 180 MIDDLE EAST & AFRICA BACTERIOPHAGES THERAPY MARKET, BY ROUTE OF ADMINISTRATION, 2019-2028 (USD MILLION)
TABLE 181 MIDDLE EAST & AFRICA ORAL IN BACTERIOPHAGES THERAPY MARKET, BY ROUTE OF ADMINISTRATION, 2019-2028 (USD MILLION)
TABLE 182 MIDDLE EAST & AFRICA PARENTERAL IN BACTERIOPHAGES THERAPY MARKET, BY ROUTE OF ADMINISTRATION, 2019-2028 (USD MILLION)
TABLE 183 MIDDLE EAST & AFRICA BACTERIOPHAGES THERAPY MARKET, BY END USER, 2019-2028 (USD MILLION)
TABLE 184 MIDDLE EAST & AFRICA BACTERIOPHAGES THERAPY MARKET, BY DISTRIBUTION CHANNEL, 2019-2028 (USD MILLION)
TABLE 185 SOUTH AFRICA BACTERIOPHAGES THERAPY MARKET, BY TARGET, 2019-2028 (USD MILLION)
TABLE 186 SOUTH AFRICA BACTERIOPHAGES THERAPY MARKET, BY TYPE, 2019-2028 (USD MILLION)
TABLE 187 SOUTH AFRICA BACTERIOPHAGES THERAPY MARKET, BY BASE, 2019-2028 (USD MILLION)
TABLE 188 SOUTH AFRICA BACTERIOPHAGES THERAPY MARKET, BY APPLICATION, 2019-2028 (USD MILLION)
TABLE 189 SOUTH AFRICA BACTERIOPHAGES THERAPY MARKET, BY ROUTE OF ADMINISTRATION, 2019-2028 (USD MILLION)
TABLE 190 SOUTH AFRICA ORAL IN BACTERIOPHAGES THERAPY MARKET, BY ROUTE OF ADMINISTRATION, 2019-2028 (USD MILLION)
TABLE 191 SOUTH AFRICA PARENTERAL IN BACTERIOPHAGES THERAPY MARKET, BY ROUTE OF ADMINISTRATION, 2019-2028 (USD MILLION)
TABLE 192 SOUTH AFRICA BACTERIOPHAGES THERAPY MARKET, BY END USER, 2019-2028 (USD MILLION)
TABLE 193 SOUTH AFRICA BACTERIOPHAGES THERAPY MARKET, BY DISTRIBUTION CHANNEL, 2019-2028 (USD MILLION)
TABLE 194 SAUDI ARABIA BACTERIOPHAGES THERAPY MARKET, BY TARGET, 2019-2028 (USD MILLION)
TABLE 195 SAUDI ARABIA BACTERIOPHAGES THERAPY MARKET, BY TYPE, 2019-2028 (USD MILLION)
TABLE 196 SAUDI ARABIA BACTERIOPHAGES THERAPY MARKET, BY BASE, 2019-2028 (USD MILLION)
TABLE 197 SAUDI ARABIA BACTERIOPHAGES THERAPY MARKET, BY APPLICATION, 2019-2028 (USD MILLION)
TABLE 198 SAUDI ARABIA BACTERIOPHAGES THERAPY MARKET, BY ROUTE OF ADMINISTRATION, 2019-2028 (USD MILLION)
TABLE 199 SAUDI ARABIA ORAL IN BACTERIOPHAGES THERAPY MARKET, BY ROUTE OF ADMINISTRATION, 2019-2028 (USD MILLION)
TABLE 200 SAUDI ARABIA PARENTERAL IN BACTERIOPHAGES THERAPY MARKET, BY ROUTE OF ADMINISTRATION, 2019-2028 (USD MILLION)
TABLE 201 SAUDI ARABIA BACTERIOPHAGES THERAPY MARKET, BY END USER, 2019-2028 (USD MILLION)
TABLE 202 SAUDI ARABIA BACTERIOPHAGES THERAPY MARKET, BY DISTRIBUTION CHANNEL, 2019-2028 (USD MILLION)
TABLE 203 ISRAEL BACTERIOPHAGES THERAPY MARKET, BY TARGET, 2019-2028 (USD MILLION)
TABLE 204 ISRAEL BACTERIOPHAGES THERAPY MARKET, BY TYPE, 2019-2028 (USD MILLION)
TABLE 205 ISRAEL BACTERIOPHAGES THERAPY MARKET, BY BASE, 2019-2028 (USD MILLION)
TABLE 206 ISRAEL BACTERIOPHAGES THERAPY MARKET, BY APPLICATION, 2019-2028 (USD MILLION)
TABLE 207 ISRAEL BACTERIOPHAGES THERAPY MARKET, BY ROUTE OF ADMINISTRATION, 2019-2028 (USD MILLION)
TABLE 208 ISRAEL ORAL IN BACTERIOPHAGES THERAPY MARKET, BY ROUTE OF ADMINISTRATION, 2019-2028 (USD MILLION)
TABLE 209 ISRAEL PARENTERAL IN BACTERIOPHAGES THERAPY MARKET, BY ROUTE OF ADMINISTRATION, 2019-2028 (USD MILLION)
TABLE 210 ISRAEL BACTERIOPHAGES THERAPY MARKET, BY END USER, 2019-2028 (USD MILLION)
TABLE 211 ISRAEL BACTERIOPHAGES THERAPY MARKET, BY DISTRIBUTION CHANNEL, 2019-2028 (USD MILLION)
TABLE 212 EGYPT BACTERIOPHAGES THERAPY MARKET, BY TARGET, 2019-2028 (USD MILLION)
TABLE 213 EGYPT BACTERIOPHAGES THERAPY MARKET, BY TYPE, 2019-2028 (USD MILLION)
TABLE 214 EGYPT BACTERIOPHAGES THERAPY MARKET, BY BASE, 2019-2028 (USD MILLION)
TABLE 215 EGYPT BACTERIOPHAGES THERAPY MARKET, BY APPLICATION, 2019-2028 (USD MILLION)
TABLE 216 EGYPT BACTERIOPHAGES THERAPY MARKET, BY ROUTE OF ADMINISTRATION, 2019-2028 (USD MILLION)
TABLE 217 EGYPT ORAL IN BACTERIOPHAGES THERAPY MARKET, BY ROUTE OF ADMINISTRATION, 2019-2028 (USD MILLION)
TABLE 218 EGYPT PARENTERAL IN BACTERIOPHAGES THERAPY MARKET, BY ROUTE OF ADMINISTRATION, 2019-2028 (USD MILLION)
TABLE 219 EGYPT BACTERIOPHAGES THERAPY MARKET, BY END USER, 2019-2028 (USD MILLION)
TABLE 220 EGYPT BACTERIOPHAGES THERAPY MARKET, BY DISTRIBUTION CHANNEL, 2019-2028 (USD MILLION)
TABLE 221 REST OF MIDDLE EAST & AFRICA BACTERIOPHAGES THERAPY MARKET, BY TARGET, 2019-2028 (USD MILLION)
TABLE 222 ASIA-PACIFIC BACTERIOPHAGES THERAPY MARKET, BY COUNTRY, 2019-2028 (USD MILLION)
TABLE 223 ASIA-PACIFIC BACTERIOPHAGES THERAPY MARKET, BY TARGET, 2019-2028 (USD MILLION)
TABLE 224 ASIA-PACIFIC BACTERIOPHAGES THERAPY MARKET, BY TYPE, 2019-2028 (USD MILLION)
TABLE 225 ASIA-PACIFIC BACTERIOPHAGES THERAPY MARKET, BY BASE, 2019-2028 (USD MILLION)
TABLE 226 ASIA-PACIFIC BACTERIOPHAGES THERAPY MARKET, BY APPLICATION, 2019-2028 (USD MILLION)
TABLE 227 ASIA-PACIFIC BACTERIOPHAGES THERAPY MARKET, BY ROUTE OF ADMINISTRATION, 2019-2028 (USD MILLION)
TABLE 228 ASIA-PACIFIC ORAL IN BACTERIOPHAGES THERAPY MARKET, BY ROUTE OF ADMINISTRATION, 2019-2028 (USD MILLION)
TABLE 229 ASIA-PACIFIC PARENTERAL IN BACTERIOPHAGES THERAPY MARKET, BY ROUTE OF ADMINISTRATION, 2019-2028 (USD MILLION)
TABLE 230 ASIA-PACIFIC BACTERIOPHAGES THERAPY MARKET, BY END USER, 2019-2028 (USD MILLION)
TABLE 231 ASIA-PACIFIC BACTERIOPHAGES THERAPY MARKET, BY DISTRIBUTION CHANNEL, 2019-2028 (USD MILLION)
TABLE 232 CHINA BACTERIOPHAGES THERAPY MARKET, BY TARGET, 2019-2028 (USD MILLION)
TABLE 233 CHINA BACTERIOPHAGES THERAPY MARKET, BY TYPE, 2019-2028 (USD MILLION)
TABLE 234 CHINA BACTERIOPHAGES THERAPY MARKET, BY BASE, 2019-2028 (USD MILLION)
TABLE 235 CHINA BACTERIOPHAGES THERAPY MARKET, BY APPLICATION, 2019-2028 (USD MILLION)
TABLE 236 CHINA BACTERIOPHAGES THERAPY MARKET, BY ROUTE OF ADMINISTRATION, 2019-2028 (USD MILLION)
TABLE 237 CHINA ORAL IN BACTERIOPHAGES THERAPY MARKET, BY ROUTE OF ADMINISTRATION, 2019-2028 (USD MILLION)
TABLE 238 CHINA PARENTERAL IN BACTERIOPHAGES THERAPY MARKET, BY ROUTE OF ADMINISTRATION, 2019-2028 (USD MILLION)
TABLE 239 CHINA BACTERIOPHAGES THERAPY MARKET, BY END USER, 2019-2028 (USD MILLION)
TABLE 240 CHINA BACTERIOPHAGES THERAPY MARKET, BY DISTRIBUTION CHANNEL, 2019-2028 (USD MILLION)
TABLE 241 JAPAN BACTERIOPHAGES THERAPY MARKET, BY TARGET, 2019-2028 (USD MILLION)
TABLE 242 JAPAN BACTERIOPHAGES THERAPY MARKET, BY TYPE, 2019-2028 (USD MILLION)
TABLE 243 JAPAN BACTERIOPHAGES THERAPY MARKET, BY BASE, 2019-2028 (USD MILLION)
TABLE 244 JAPAN BACTERIOPHAGES THERAPY MARKET, BY APPLICATION, 2019-2028 (USD MILLION)
TABLE 245 JAPAN BACTERIOPHAGES THERAPY MARKET, BY ROUTE OF ADMINISTRATION, 2019-2028 (USD MILLION)
TABLE 246 JAPAN ORAL IN BACTERIOPHAGES THERAPY MARKET, BY ROUTE OF ADMINISTRATION, 2019-2028 (USD MILLION)
TABLE 247 JAPAN PARENTERAL IN BACTERIOPHAGES THERAPY MARKET, BY ROUTE OF ADMINISTRATION, 2019-2028 (USD MILLION)
TABLE 248 JAPAN BACTERIOPHAGES THERAPY MARKET, BY END USER, 2019-2028 (USD MILLION)
TABLE 249 JAPAN BACTERIOPHAGES THERAPY MARKET, BY DISTRIBUTION CHANNEL, 2019-2028 (USD MILLION)
TABLE 250 INDIA BACTERIOPHAGES THERAPY MARKET, BY TARGET, 2019-2028 (USD MILLION)
TABLE 251 INDIA BACTERIOPHAGES THERAPY MARKET, BY TYPE, 2019-2028 (USD MILLION)
TABLE 252 INDIA BACTERIOPHAGES THERAPY MARKET, BY BASE, 2019-2028 (USD MILLION)
TABLE 253 INDIA BACTERIOPHAGES THERAPY MARKET, BY APPLICATION, 2019-2028 (USD MILLION)
TABLE 254 INDIA BACTERIOPHAGES THERAPY MARKET, BY ROUTE OF ADMINISTRATION, 2019-2028 (USD MILLION)
TABLE 255 INDIA ORAL IN BACTERIOPHAGES THERAPY MARKET, BY ROUTE OF ADMINISTRATION, 2019-2028 (USD MILLION)
TABLE 256 INDIA PARENTERAL IN BACTERIOPHAGES THERAPY MARKET, BY ROUTE OF ADMINISTRATION, 2019-2028 (USD MILLION)
TABLE 257 INDIA BACTERIOPHAGES THERAPY MARKET, BY END USER, 2019-2028 (USD MILLION)
TABLE 258 INDIA BACTERIOPHAGES THERAPY MARKET, BY DISTRIBUTION CHANNEL, 2019-2028 (USD MILLION)
TABLE 259 AUSTRALIA BACTERIOPHAGES THERAPY MARKET, BY TARGET, 2019-2028 (USD MILLION)
TABLE 260 AUSTRALIA BACTERIOPHAGES THERAPY MARKET, BY TYPE, 2019-2028 (USD MILLION)
TABLE 261 AUSTRALIA BACTERIOPHAGES THERAPY MARKET, BY BASE, 2019-2028 (USD MILLION)
TABLE 262 AUSTRALIA BACTERIOPHAGES THERAPY MARKET, BY APPLICATION, 2019-2028 (USD MILLION)
TABLE 263 AUSTRALIA BACTERIOPHAGES THERAPY MARKET, BY ROUTE OF ADMINISTRATION, 2019-2028 (USD MILLION)
TABLE 264 AUSTRALIA ORAL IN BACTERIOPHAGES THERAPY MARKET, BY ROUTE OF ADMINISTRATION, 2019-2028 (USD MILLION)
TABLE 265 AUSTRALIA PARENTERAL IN BACTERIOPHAGES THERAPY MARKET, BY ROUTE OF ADMINISTRATION, 2019-2028 (USD MILLION)
TABLE 266 AUSTRALIA BACTERIOPHAGES THERAPY MARKET, BY END USER, 2019-2028 (USD MILLION)
TABLE 267 AUSTRALIA BACTERIOPHAGES THERAPY MARKET, BY DISTRIBUTION CHANNEL, 2019-2028 (USD MILLION)
TABLE 268 SOUTH KOREA BACTERIOPHAGES THERAPY MARKET, BY TARGET, 2019-2028 (USD MILLION)
TABLE 269 SOUTH KOREA BACTERIOPHAGES THERAPY MARKET, BY TYPE, 2019-2028 (USD MILLION)
TABLE 270 SOUTH KOREA BACTERIOPHAGES THERAPY MARKET, BY BASE, 2019-2028 (USD MILLION)
TABLE 271 SOUTH KOREA BACTERIOPHAGES THERAPY MARKET, BY APPLICATION, 2019-2028 (USD MILLION)
TABLE 272 SOUTH KOREA BACTERIOPHAGES THERAPY MARKET, BY ROUTE OF ADMINISTRATION, 2019-2028 (USD MILLION)
TABLE 273 SOUTH KOREA ORAL IN BACTERIOPHAGES THERAPY MARKET, BY ROUTE OF ADMINISTRATION, 2019-2028 (USD MILLION)
TABLE 274 SOUTH KOREA PARENTERAL IN BACTERIOPHAGES THERAPY MARKET, BY ROUTE OF ADMINISTRATION, 2019-2028 (USD MILLION)
TABLE 275 SOUTH KOREA BACTERIOPHAGES THERAPY MARKET, BY END USER, 2019-2028 (USD MILLION)
TABLE 276 SOUTH KOREA BACTERIOPHAGES THERAPY MARKET, BY DISTRIBUTION CHANNEL, 2019-2028 (USD MILLION)
TABLE 277 SINGAPORE BACTERIOPHAGES THERAPY MARKET, BY TARGET, 2019-2028 (USD MILLION)
TABLE 278 SINGAPORE BACTERIOPHAGES THERAPY MARKET, BY TYPE, 2019-2028 (USD MILLION)
TABLE 279 SINGAPORE BACTERIOPHAGES THERAPY MARKET, BY BASE, 2019-2028 (USD MILLION)
TABLE 280 SINGAPORE BACTERIOPHAGES THERAPY MARKET, BY APPLICATION, 2019-2028 (USD MILLION)
TABLE 281 SINGAPORE BACTERIOPHAGES THERAPY MARKET, BY ROUTE OF ADMINISTRATION, 2019-2028 (USD MILLION)
TABLE 282 SINGAPORE ORAL IN BACTERIOPHAGES THERAPY MARKET, BY ROUTE OF ADMINISTRATION, 2019-2028 (USD MILLION)
TABLE 283 SINGAPORE PARENTERAL IN BACTERIOPHAGES THERAPY MARKET, BY ROUTE OF ADMINISTRATION, 2019-2028 (USD MILLION)
TABLE 284 SINGAPORE BACTERIOPHAGES THERAPY MARKET, BY END USER, 2019-2028 (USD MILLION)
TABLE 285 SINGAPORE BACTERIOPHAGES THERAPY MARKET, BY DISTRIBUTION CHANNEL, 2019-2028 (USD MILLION)
TABLE 286 REST OF ASIA-PACIFIC BACTERIOPHAGES THERAPY MARKET, BY TARGET, 2019-2028 (USD MILLION)
TABLE 287 SOUTH AMERICA BACTERIOPHAGES THERAPY MARKET, BY COUNTRY, 2019-2028 (USD MILLION)
TABLE 288 SOUTH AMERICA BACTERIOPHAGES THERAPY MARKET, BY TARGET, 2019-2028 (USD MILLION)
TABLE 289 SOUTH AMERICA BACTERIOPHAGES THERAPY MARKET, BY TYPE, 2019-2028 (USD MILLION)
TABLE 290 SOUTH AMERICA BACTERIOPHAGES THERAPY MARKET, BY BASE, 2019-2028 (USD MILLION)
TABLE 291 SOUTH AMERICA BACTERIOPHAGES THERAPY MARKET, BY APPLICATION, 2019-2028 (USD MILLION)
TABLE 292 SOUTH AMERICA BACTERIOPHAGES THERAPY MARKET, BY ROUTE OF ADMINISTRATION, 2019-2028 (USD MILLION)
TABLE 293 SOUTH AMERICA ORAL IN BACTERIOPHAGES THERAPY MARKET, BY ROUTE OF ADMINISTRATION, 2019-2028 (USD MILLION)
TABLE 294 SOUTH AMERICA PARENTERAL IN BACTERIOPHAGES THERAPY MARKET, BY ROUTE OF ADMINISTRATION, 2019-2028 (USD MILLION)
TABLE 295 SOUTH AMERICA BACTERIOPHAGES THERAPY MARKET, BY END USER, 2019-2028 (USD MILLION)
TABLE 296 SOUTH AMERICA BACTERIOPHAGES THERAPY MARKET, BY DISTRIBUTION CHANNEL, 2019-2028 (USD MILLION)
TABLE 297 BRAZIL BACTERIOPHAGES THERAPY MARKET, BY TARGET, 2019-2028 (USD MILLION)
TABLE 298 BRAZIL BACTERIOPHAGES THERAPY MARKET, BY TYPE, 2019-2028 (USD MILLION)
TABLE 299 BRAZIL BACTERIOPHAGES THERAPY MARKET, BY BASE, 2019-2028 (USD MILLION)
TABLE 300 BRAZIL BACTERIOPHAGES THERAPY MARKET, BY APPLICATION, 2019-2028 (USD MILLION)
TABLE 301 BRAZIL BACTERIOPHAGES THERAPY MARKET, BY ROUTE OF ADMINISTRATION, 2019-2028 (USD MILLION)
TABLE 302 BRAZIL ORAL IN BACTERIOPHAGES THERAPY MARKET, BY ROUTE OF ADMINISTRATION, 2019-2028 (USD MILLION)
TABLE 303 BRAZIL PARENTERAL IN BACTERIOPHAGES THERAPY MARKET, BY ROUTE OF ADMINISTRATION, 2019-2028 (USD MILLION)
TABLE 304 BRAZIL BACTERIOPHAGES THERAPY MARKET, BY END USER, 2019-2028 (USD MILLION)
TABLE 305 BRAZIL BACTERIOPHAGES THERAPY MARKET, BY DISTRIBUTION CHANNEL, 2019-2028 (USD MILLION)
TABLE 306 ARGENTINA BACTERIOPHAGES THERAPY MARKET, BY TARGET, 2019-2028 (USD MILLION)
TABLE 307 ARGENTINA BACTERIOPHAGES THERAPY MARKET, BY TYPE, 2019-2028 (USD MILLION)
TABLE 308 ARGENTINA BACTERIOPHAGES THERAPY MARKET, BY BASE, 2019-2028 (USD MILLION)
TABLE 309 ARGENTINA BACTERIOPHAGES THERAPY MARKET, BY APPLICATION, 2019-2028 (USD MILLION)
TABLE 310 ARGENTINA BACTERIOPHAGES THERAPY MARKET, BY ROUTE OF ADMINISTRATION, 2019-2028 (USD MILLION)
TABLE 311 ARGENTINA ORAL IN BACTERIOPHAGES THERAPY MARKET, BY ROUTE OF ADMINISTRATION, 2019-2028 (USD MILLION)
TABLE 312 ARGENTINA PARENTERAL IN BACTERIOPHAGES THERAPY MARKET, BY ROUTE OF ADMINISTRATION, 2019-2028 (USD MILLION)
TABLE 313 ARGENTINA BACTERIOPHAGES THERAPY MARKET, BY END USER, 2019-2028 (USD MILLION)
TABLE 314 ARGENTINA BACTERIOPHAGES THERAPY MARKET, BY DISTRIBUTION CHANNEL, 2019-2028 (USD MILLION)
TABLE 315 REST OF SOUTH AMERICA BACTERIOPHAGES THERAPY MARKET, BY TARGET, 2019-2028 (USD MILLION)
Lista de figuras
FIGURE 1 GLOBAL BACTERIOPHAGES THERAPY MARKET: SEGMENTATION
FIGURE 2 GLOBAL BACTERIOPHAGES THERAPY MARKET: DATA TRIANGULATION
FIGURE 3 GLOBAL BACTERIOPHAGES THERAPY MARKET: DROC ANALYSIS
FIGURE 4 GLOBAL BACTERIOPHAGES THERAPY MARKET : GLOBAL VS REGIONAL MARKET ANALYSIS
FIGURE 5 GLOBAL BACTERIOPHAGES THERAPY MARKET : COMPANY RESEARCH ANALYSIS
FIGURE 6 GLOBAL BACTERIOPHAGES THERAPY MARKET: INTERVIEW DEMOGRAPHICS
FIGURE 7 GLOBAL BACTERIOPHAGES THERAPY MARKET: DBMR MARKET POSITION GRID
FIGURE 8 GLOBAL BACTERIOPHAGES THERAPY MARKET: MARKET APPLICATION COVERAGE GRID
FIGURE 9 GLOBAL BACTERIOPHAGES THERAPY MARKET: VENDOR SHARE ANALYSIS
FIGURE 10 GLOBAL BACTERIOPHAGES THERAPY MARKET: SEGMENTATION
FIGURE 11 RISING INCIDENCE OF ANTIBIOTIC-RESISTANT INFECTIONS AND TECHNOLOGICAL ADVANCEMENTS ARE EXPECTED TO DRIVE THE GLOBAL BACTERIOPHAGES THERAPY MARKET IN THE FORECAST PERIOD OF 2021 TO 2028
FIGURE 12 STAPHYLOCOCCUS SEGMENT IS EXPECTED TO ACCOUNT FOR THE LARGEST SHARE OF THE GLOBAL BACTERIOPHAGES THERAPY MARKET IN 2021 & 2028
FIGURE 13 NORTH AMERICA IS EXPECTED TO DOMINATE THE GLOBAL BACTERIOPHAGES THERAPY MARKET AND ASIA-PACIFIC IS EXPECTED TO GROW WITH THE HIGHEST CAGR IN THE FORECAST PERIOD OF 2021 TO 2028
FIGURE 14 ASIA-PACIFIC IS THE FASTEST GROWING MARKET FOR STEM CELL MANUFACTURERS IN THE FORECAST PERIOD OF 2021 TO 2028
FIGURE 15 DRIVERS, RESTRAINTS, OPPORTUNITIES, AND CHALLENGES OF GLOBAL BACTERIOPHAGES THERAPY MARKET
FIGURE 16 GLOBAL BACTERIOPHAGES THERAPY MARKET: BY TARGET, 2020
FIGURE 17 GLOBAL BACTERIOPHAGES THERAPY MARKET: BY TARGET, 2021-2028 (USD MILLION)
FIGURE 18 GLOBAL BACTERIOPHAGES THERAPY MARKET: BY TARGET, CAGR (2021-2028)
FIGURE 19 GLOBAL BACTERIOPHAGES THERAPY MARKET: BY TARGET, LIFELINE CURVE
FIGURE 20 GLOBAL BACTERIOPHAGES THERAPY MARKET: BY TYPE, 2020
FIGURE 21 GLOBAL BACTERIOPHAGES THERAPY MARKET: BY TYPE, 2021-2028 (USD MILLION)
FIGURE 22 GLOBAL BACTERIOPHAGES THERAPY MARKET: BY TYPE, CAGR (2021-2028)
FIGURE 23 GLOBAL BACTERIOPHAGES THERAPY MARKET: BY TYPE, LIFELINE CURVE
FIGURE 24 GLOBAL BACTERIOPHAGES THERAPY MARKET: BY BASE, 2020
FIGURE 25 GLOBAL BACTERIOPHAGES THERAPY MARKET: BY BASE, 2021-2028 (USD MILLION)
FIGURE 26 GLOBAL BACTERIOPHAGES THERAPY MARKET: BY BASE, CAGR (2021-2028)
FIGURE 27 GLOBAL BACTERIOPHAGES THERAPY MARKET: BY BASE, LIFELINE CURVE
FIGURE 28 GLOBAL BACTERIOPHAGES THERAPY MARKET: BY APPLICATION, 2020
FIGURE 29 GLOBAL BACTERIOPHAGES THERAPY MARKET: BY APPLICATION, 2021-2028 (USD MILLION)
FIGURE 30 GLOBAL BACTERIOPHAGES THERAPY MARKET: BY APPLICATION, CAGR (2021-2028)
FIGURE 31 GLOBAL BACTERIOPHAGES THERAPY MARKET: BY APPLICATION, LIFELINE CURVE
FIGURE 32 GLOBAL BACTERIOPHAGES THERAPY MARKET: BY ROUTE OF ADMINISTRATION, 2020
FIGURE 33 GLOBAL BACTERIOPHAGES THERAPY MARKET: BY ROUTE OF ADMINISTRATION, 2021-2028 (USD MILLION)
FIGURE 34 GLOBAL BACTERIOPHAGES THERAPY MARKET: BY ROUTE OF ADMINISTRATION, CAGR (2021-2028)
FIGURE 35 GLOBAL BACTERIOPHAGES THERAPY MARKET: BY ROUTE OF ADMINISTRATION, LIFELINE CURVE
FIGURE 36 GLOBAL BACTERIOPHAGES THERAPY MARKET: BY END USER, 2020
FIGURE 37 GLOBAL BACTERIOPHAGES THERAPY MARKET: BY END USER, 2021-2028 (USD MILLION)
FIGURE 38 GLOBAL BACTERIOPHAGES THERAPY MARKET: BY END USER, CAGR (2021-2028)
FIGURE 39 GLOBAL BACTERIOPHAGES THERAPY MARKET: BY END USER, LIFELINE CURVE
FIGURE 40 GLOBAL BACTERIOPHAGES THERAPY MARKET: BY DISTRIBUTION CHANNEL, 2020
FIGURE 41 GLOBAL BACTERIOPHAGES THERAPY MARKET: BY DISTRIBUTION CHANNEL, 2021-2028 (USD MILLION)
FIGURE 42 GLOBAL BACTERIOPHAGES THERAPY MARKET: BY DISTRIBUTION CHANNEL, CAGR (2021-2028)
FIGURE 43 GLOBAL BACTERIOPHAGES THERAPY MARKET: BY DISTRIBUTION CHANNEL, LIFELINE CURVE
FIGURE 44 GLOBAL BACTERIOPHAGES THERAPY MARKET: SNAPSHOT (2020)
FIGURE 45 GLOBAL BACTERIOPHAGES THERAPY MARKET: BY REGION (2020)
FIGURE 46 GLOBAL BACTERIOPHAGES THERAPY MARKET: BY REGION (2021 & 2028)
FIGURE 47 GLOBAL BACTERIOPHAGES THERAPY MARKET: BY REGION (2020 & 2028)
FIGURE 48 GLOBAL BACTERIOPHAGES THERAPY MARKET: BY TARGET (2021-2028)
FIGURE 49 NORTH AMERICA BACTERIOPHAGES THERAPY MARKET: SNAPSHOT (2020)
FIGURE 50 NORTH AMERICA BACTERIOPHAGES THERAPY MARKET: BY COUNTRY (2020)
FIGURE 51 NORTH AMERICA BACTERIOPHAGES THERAPY MARKET: BY COUNTRY (2021 & 2028)
FIGURE 52 NORTH AMERICA BACTERIOPHAGES THERAPY MARKET: BY COUNTRY (2020 & 2028)
FIGURE 53 NORTH AMERICA BACTERIOPHAGES THERAPY MARKET: BY TARGET (2021-2028)
FIGURE 54 EUROPE BACTERIOPHAGES THERAPY MARKET: SNAPSHOT (2020)
FIGURE 55 EUROPE BACTERIOPHAGES THERAPY MARKET: BY COUNTRY (2020)
FIGURE 56 EUROPE BACTERIOPHAGES THERAPY MARKET: BY COUNTRY (2021 & 2028)
FIGURE 57 EUROPE BACTERIOPHAGES THERAPY MARKET: BY COUNTRY (2020 & 2028)
FIGURE 58 EUROPE BACTERIOPHAGES THERAPY MARKET: BY TARGET (2021-2028)
FIGURE 59 MIDDLE EAST & AFRICA BACTERIOPHAGES THERAPY MARKET: SNAPSHOT (2020)
FIGURE 60 MIDDLE EAST & AFRICA BACTERIOPHAGES THERAPY MARKET: BY COUNTRY (2020)
FIGURE 61 MIDDLE EAST & AFRICA BACTERIOPHAGES THERAPY MARKET: BY COUNTRY (2021 & 2028)
FIGURE 62 MIDDLE EAST & AFRICA BACTERIOPHAGES THERAPY MARKET: BY COUNTRY (2020 & 2028)
FIGURE 63 MIDDLE EAST & AFRICA BACTERIOPHAGES THERAPY MARKET: BY TARGET (2021-2028)
FIGURE 64 ASIA-PACIFIC BACTERIOPHAGES THERAPY MARKET: SNAPSHOT (2020)
FIGURE 65 ASIA-PACIFIC BACTERIOPHAGES THERAPY MARKET: BY COUNTRY (2020)
FIGURE 66 ASIA-PACIFIC BACTERIOPHAGES THERAPY MARKET: BY COUNTRY (2021 & 2028)
FIGURE 67 ASIA-PACIFIC BACTERIOPHAGES THERAPY MARKET: BY COUNTRY (2020 & 2028)
FIGURE 68 ASIA-PACIFIC BACTERIOPHAGES THERAPY MARKET: BY TARGET (2021-2028)
FIGURE 69 SOUTH AMERICA BACTERIOPHAGES THERAPY MARKET: SNAPSHOT (2020)
FIGURE 70 SOUTH AMERICA BACTERIOPHAGES THERAPY MARKET: BY COUNTRY (2020)
FIGURE 71 SOUTH AMERICA BACTERIOPHAGES THERAPY MARKET: BY COUNTRY (2021 & 2028)
FIGURE 72 SOUTH AMERICA BACTERIOPHAGES THERAPY MARKET: BY COUNTRY (2020 & 2028)
FIGURE 73 SOUTH AMERICA BACTERIOPHAGES THERAPY MARKET: BY TARGET (2021-2028)
FIGURE 74 GLOBAL BACTERIOPHAGES THERAPY MARKET: COMPANY SHARE 2020 (%)
FIGURE 75 NORTH AMERICA BACTERIOPHAGES THERAPY MARKET: COMPANY SHARE 2020 (%)
FIGURE 76 EUROPE BACTERIOPHAGES THERAPY MARKET: COMPANY SHARE 2020 (%)
FIGURE 77 ASIA-PACIFIC BACTERIOPHAGES THERAPY MARKET: COMPANY SHARE 2020 (%)
Metodología de investigación
La recopilación de datos y el análisis del año base se realizan utilizando módulos de recopilación de datos con muestras de gran tamaño. La etapa incluye la obtención de información de mercado o datos relacionados a través de varias fuentes y estrategias. Incluye el examen y la planificación de todos los datos adquiridos del pasado con antelación. Asimismo, abarca el examen de las inconsistencias de información observadas en diferentes fuentes de información. Los datos de mercado se analizan y estiman utilizando modelos estadísticos y coherentes de mercado. Además, el análisis de la participación de mercado y el análisis de tendencias clave son los principales factores de éxito en el informe de mercado. Para obtener más información, solicite una llamada de un analista o envíe su consulta.
La metodología de investigación clave utilizada por el equipo de investigación de DBMR es la triangulación de datos, que implica la extracción de datos, el análisis del impacto de las variables de datos en el mercado y la validación primaria (experto en la industria). Los modelos de datos incluyen cuadrícula de posicionamiento de proveedores, análisis de línea de tiempo de mercado, descripción general y guía del mercado, cuadrícula de posicionamiento de la empresa, análisis de patentes, análisis de precios, análisis de participación de mercado de la empresa, estándares de medición, análisis global versus regional y de participación de proveedores. Para obtener más información sobre la metodología de investigación, envíe una consulta para hablar con nuestros expertos de la industria.
Personalización disponible
Data Bridge Market Research es líder en investigación formativa avanzada. Nos enorgullecemos de brindar servicios a nuestros clientes existentes y nuevos con datos y análisis que coinciden y se adaptan a sus objetivos. El informe se puede personalizar para incluir análisis de tendencias de precios de marcas objetivo, comprensión del mercado de países adicionales (solicite la lista de países), datos de resultados de ensayos clínicos, revisión de literatura, análisis de mercado renovado y base de productos. El análisis de mercado de competidores objetivo se puede analizar desde análisis basados en tecnología hasta estrategias de cartera de mercado. Podemos agregar tantos competidores sobre los que necesite datos en el formato y estilo de datos que esté buscando. Nuestro equipo de analistas también puede proporcionarle datos en archivos de Excel sin procesar, tablas dinámicas (libro de datos) o puede ayudarlo a crear presentaciones a partir de los conjuntos de datos disponibles en el informe.