

Global Automated Cell Cultures Market
Tamaño del mercado en miles de millones de dólares
Tasa de crecimiento anual compuesta (CAGR) :
% 
 USD
14.13 Billion
USD
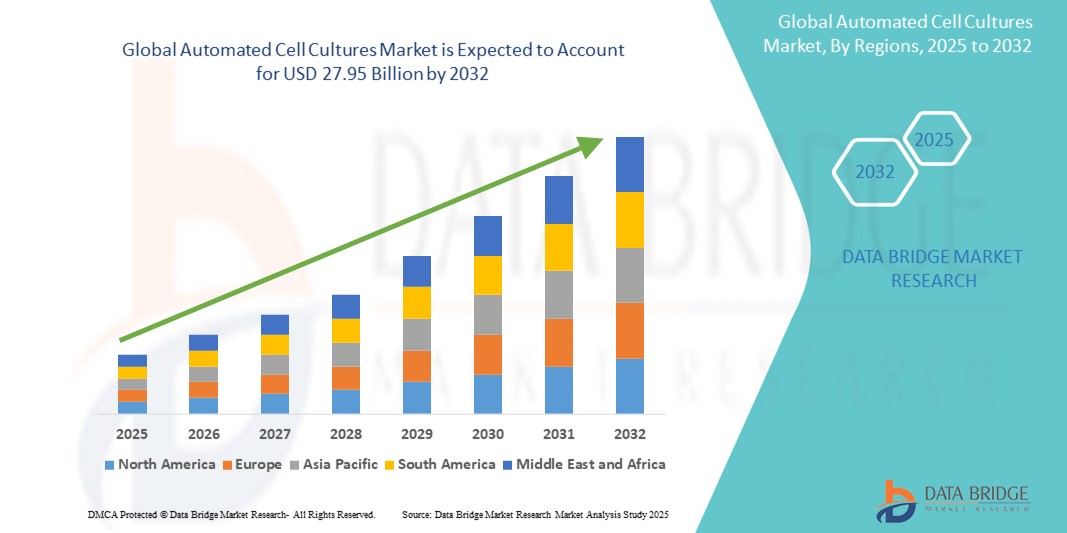
27.95 Billion
2024
2032
USD
14.13 Billion
USD
27.95 Billion
2024
2032
| 2025 –2032 | |
| USD 14.13 Billion | |
| USD 27.95 Billion | |
| % | |
|
Global Automated Cell Cultures Market Segmentation, By Products (Instruments, Reagents and Kits, and Others), Type (Automated Cell Culture Storage Equipment, Automated Cell Culture Vessels, Automated Cell Culture Supporting Instruments, Bioreactors), Application (Drug Development, Stem Cell Research, Regenerative Medicine, Cancer Research, Vaccines, and Others), End User (Biotech Companies, Research Organizations, Academic Research Institutes, and Other) - Industry Trends and Forecast to 2032
Automated Cell Cultures Market Size
- The global automated cell cultures market size was valued at USD 14.13 billion in 2024 and is expected to reach USD 27.95 billion by 2032, at a CAGR of 8.90% during the forecast period
- This growth is driven by factors such as the increasing demand for cell-based therapies, advancements in automation technologies, and the need for reproducibility and scalability in research and production processes
Automated Cell Cultures Market Analysis
- Automated cell cultures refer to systems and technologies that automate the processes involved in growing and maintaining cell cultures in laboratory settings
- These systems typically involve automated platforms that control environmental conditions such as temperature, humidity, and CO2 levels, as well as automated handling of cell culture vessels, media changes, and monitoring of cell growth and viability
- North America is expected to dominate the automated cell cultures market with 40.5% due to advanced healthcare infrastructure, significant investments in biopharmaceutical research
- Asia-Pacific is expected to be the fastest growing region in the automated cell cultures market during the forecast period due to Government initiatives to promote biotechnology and life sciences, along with the establishment of biopharmaceutical manufacturing hubs
- Instruments segment is expected to dominate the market with a market share due to systems require specialized instruments such as bioreactors, incubators, and automated cell handling systems for various cell-based applications
Report Scope and Automated Cell Cultures Market Segmentation
|
Attributes |
Automated Cell Cultures Key Market Insights |
|
Segments Covered |
|
|
Countries Covered |
América del norte
Europa
Asia-Pacífico
Oriente Medio y África
Sudamerica
|
|
Actores clave del mercado |
|
|
Oportunidades de mercado |
|
|
Conjuntos de información de datos de valor añadido |
Además de los conocimientos sobre escenarios de mercado, como el valor de mercado, la tasa de crecimiento, la segmentación, la cobertura geográfica y los principales actores, los informes de mercado seleccionados por Data Bridge Market Research también incluyen un análisis en profundidad de expertos, epidemiología de pacientes, análisis de la cartera de productos, análisis de precios y marco regulatorio. |
Tendencias del mercado de cultivos celulares automatizados
“ Avances tecnológicos en automatización ”
- La incorporación de inteligencia artificial (IA) y aprendizaje automático (ML) en sistemas automatizados de cultivo celular está mejorando el monitoreo en tiempo real, el análisis predictivo y la optimización de las condiciones de cultivo.
- Las plataformas basadas en la nube permiten la monitorización remota, el almacenamiento centralizado de datos y la colaboración fluida entre equipos de investigación, lo que facilita la mejora continua y la escalabilidad.
- Los sistemas robóticos avanzados están agilizando los procesos de manipulación de células, reduciendo el error humano y aumentando el rendimiento en las operaciones de cultivo celular.
- El desarrollo de sistemas compactos de alto rendimiento está haciendo que el cultivo celular automatizado sea más accesible para laboratorios e instituciones de investigación más pequeños.
- Los sistemas automatizados se integran cada vez más con herramientas analíticas como la espectrometría de masas y las imágenes de alto contenido para proporcionar datos completos para el análisis celular.
Dinámica del mercado de cultivos celulares automatizados
Conductor
“ Aumento de la demanda de productos biofarmacéuticos ”
- El aumento global de enfermedades crónicas está impulsando la demanda de productos biofarmacéuticos, incluidos anticuerpos monoclonales y vacunas, que requieren procesos de cultivo celular escalables y eficientes.
- Los enfoques de medicina personalizada requieren la producción de terapias celulares específicas para cada paciente, lo que aumenta aún más la necesidad de sistemas automatizados de cultivo celular.
- Los sistemas automatizados permiten una detección de alto rendimiento y una producción rápida, cruciales para acelerar el descubrimiento y desarrollo de fármacos, impulsando así el crecimiento del mercado.
- Las agencias reguladoras están brindando pautas y apoyo para el desarrollo y la aprobación de productos biofarmacéuticos, fomentando la inversión en tecnologías de cultivo celular automatizado.
- El aumento de la inversión en investigación y desarrollo por parte de las empresas farmacéuticas está promoviendo la adopción de sistemas automatizados de cultivo celular para agilizar los procesos de producción.
Oportunidad
Adopción de técnicas de cultivo celular 3D
- Las técnicas de cultivo celular tridimensional (3D) replican con mayor precisión los entornos in vivo, lo que mejora la relevancia de los resultados experimentales.
- Los cultivos 3D proporcionan modelos más confiables para la detección de fármacos, lo que reduce la probabilidad de fracasos en ensayos clínicos en etapas avanzadas.
- La integración del cultivo celular 3D con la ingeniería de tejidos está permitiendo el desarrollo de modelos de tejidos complejos para la medicina regenerativa.
- Las empresas están desarrollando y comercializando sistemas automatizados de cultivo celular en 3D, ampliando las oportunidades de mercado en este segmento.
- Las colaboraciones entre instituciones académicas y actores de la industria están acelerando el desarrollo y la adopción de tecnologías de cultivo celular en 3D.
Restricción/Desafío
Alta inversión de capital y escasez de mano de obra calificada
- La implementación de sistemas automatizados de cultivo celular implica costos iniciales significativos, incluida la compra de equipos, software y gastos de mantenimiento.
- Los costos operativos continuos, como los consumibles y el consumo de energía, pueden ser prohibitivos para los laboratorios pequeños y medianos.
- La complejidad de los sistemas automatizados requiere una fuerza laboral calificada y competente tanto en ciencias biológicas como en tecnologías de automatización.
- Invertir en programas de capacitación para mejorar las habilidades del personal existente aumenta los gastos operativos y los plazos de implementación.
- Garantizar el cumplimiento de normas regulatorias estrictas requiere conocimientos especializados y puede retrasar la adopción de sistemas automatizados.
Alcance del mercado de cultivos celulares automatizados
El mercado está segmentado en función de productos, tipo, aplicación y usuario final.
|
Segmentación |
Subsegmentación |
|
Por productos |
|
|
Por tipo |
|
|
Por aplicación |
|
|
Por el usuario final |
|
En 2025, se proyecta que los instrumentos dominen el mercado con la mayor participación en el segmento de productos.
Se prevé que el segmento de instrumentos domine el mercado de cultivos celulares automatizados, con la mayor cuota de mercado en 2025, debido a que los sistemas requieren instrumentos especializados, como biorreactores, incubadoras y sistemas automatizados de manipulación celular para diversas aplicaciones celulares. La demanda de instrumentos de alta precisión se debe a su papel crucial para escalar la producción y garantizar la reproducibilidad, especialmente en la producción biofarmacéutica.
Se espera que los biorreactores representen la mayor participación durante el período de pronóstico en el mercado de tipo
En 2025, se prevé que el segmento de biorreactores domine el mercado con la mayor cuota de mercado, debido a su importancia para mantener el entorno controlado necesario para el crecimiento celular y su amplio uso en la producción a gran escala de productos biológicos y vacunas. Los biorreactores son esenciales tanto para la investigación como para la fabricación comercial, lo que les otorga una cuota de mercado significativa.
Análisis regional del mercado de cultivos celulares automatizados
Norteamérica posee la mayor participación en el mercado de cultivos celulares automatizados.
- América del Norte posee la mayor participación del mercado mundial de cultivo celular automatizado, representando el 40,5%.
- El dominio de la región se atribuye a una infraestructura de atención médica avanzada, inversiones significativas en investigación biofarmacéutica y la presencia de importantes actores del mercado.
- América del Norte lidera la adopción de tecnologías de vanguardia en ciencias biológicas, con un fuerte enfoque en la innovación y la automatización.
- Estados Unidos, en particular, está a la vanguardia, con una financiación sustancial para iniciativas de investigación y una red bien establecida de instituciones de investigación y empresas biofarmacéuticas.
- Las políticas gubernamentales favorables y las iniciativas de financiación respaldan aún más la adopción generalizada de sistemas automatizados de cultivo celular en América del Norte.
Se proyecta que Asia-Pacífico registre la tasa de crecimiento anual compuesta (TCAC) más alta en el mercado de cultivos celulares automatizados.
- Se espera que la región de Asia y el Pacífico sea testigo del crecimiento más rápido en el mercado de cultivo celular automatizado.
- Países como China, India y Japón son los principales contribuyentes, impulsados por la creciente inversión en infraestructura de atención médica y la creciente demanda de productos biofarmacéuticos.
- Las iniciativas gubernamentales para promover la biotecnología y las ciencias de la vida, junto con el establecimiento de centros de fabricación biofarmacéutica, están impulsando el crecimiento del mercado.
- Las crecientes actividades de investigación en la región están creando una demanda significativa de soluciones de cultivo celular eficientes y escalables.
- La adopción de la automatización en los procesos de cultivo celular está ganando terreno a medida que las empresas locales se esfuerzan por mejorar la eficiencia de la producción y cumplir con los estándares globales.
Cuota de mercado de cultivos celulares automatizados
The market competitive landscape provides details by competitor. Details included are company overview, company financials, revenue generated, market potential, investment in research and development, new market initiatives, global presence, production sites and facilities, production capacities, company strengths and weaknesses, product launch, product width and breadth, application dominance. The above data points provided are only related to the companies' focus related to market.
The Major Market Leaders Operating in the Market Are:
- Sartorius AG (Germany)
- Danaher (U.S.)
- Lonza (Switzerland)
- Nexcelom Bioscience LLC (U.S.)
- HiMedia Laboratories (India)
- Cell Culture Company, LLC (U.S.)
- Advanced Instruments (U.S.)
- SHIBUYA CORPORATION (Japan)
- NanoEntek (South Korea)
- FUJIFILM Holdings America Corporation (U.S.)
- Hitachi, Ltd. (U.S.)
- Kawasaki Heavy Industries, Ltd. (Japan)
- Sphere Fluidics Limited (U.K.)
- Thrive Bioscience (U.S.)
- Eppendorf AG (Germany)
- CellGenix GmbH (Germany)
- ChemoMetec (Denmark)
- PromoCell GmbH (Germany)
- Thermo Fisher Scientific (U.S.)
- BioSpherix, Ltd. (U.S.)
Latest Developments in Global Automated Cell Cultures Market
- In May 2024, ProPharma announced the development of the Cell Manufacturing Box (CF Box) in collaboration with PBL. This enclosed, fully automated cell manufacturing equipment enables decentralized production of various Cell & Gene Therapies (CAGT) in Class D (ISO8) or c.n.c. adjacent environments, representing a significant advancement in cell therapy manufacturing technology
- In January 2024, Thermo Fisher Scientific introduced the Gibco™ Cell Therapy Systems (CTS™) Cellmation Software, an innovative automation solution designed to integrate workflows across multiple Thermo Fisher cell therapy instruments while ensuring cGMP compliance, aimed at optimizing clinical manufacturing processes for developers of breakthrough cell therapies
- In May 2024, SINFONIA TECHNOLOGY CO., LTD. announced the delivery of two units of its CellQualia Intelligent Cell Processing (ICP) System to Keio University. These systems were delivered in March and completed their Performance Qualification in April of the same year. The devices are set to support the stable production and supply of high-quality cell medicines, crucial for advancing regenerative medicine, a promising next-generation medical treatment
- In October 2023, Molecular Devices, LLC., a prominent provider of high-performance solutions in life sciences and an operating entity within Danaher Corporation's (NYSE: DHR) life sciences segment, introduced the patent-pending CellXpress.ai Automated Cell Culture System. This innovative solution integrates an incubator, liquid handler, and imager, enhanced with machine-learning capabilities
SKU-
Obtenga acceso en línea al informe sobre la primera nube de inteligencia de mercado del mundo

- Panel de análisis de datos interactivo
- Panel de análisis de empresas para oportunidades con alto potencial de crecimiento
- Acceso de analista de investigación para personalización y consultas
- Análisis de la competencia con panel interactivo
- Últimas noticias, actualizaciones y análisis de tendencias
- Aproveche el poder del análisis de referencia para un seguimiento integral de la competencia
Metodología de investigación
La recopilación de datos y el análisis del año base se realizan utilizando módulos de recopilación de datos con muestras de gran tamaño. La etapa incluye la obtención de información de mercado o datos relacionados a través de varias fuentes y estrategias. Incluye el examen y la planificación de todos los datos adquiridos del pasado con antelación. Asimismo, abarca el examen de las inconsistencias de información observadas en diferentes fuentes de información. Los datos de mercado se analizan y estiman utilizando modelos estadísticos y coherentes de mercado. Además, el análisis de la participación de mercado y el análisis de tendencias clave son los principales factores de éxito en el informe de mercado. Para obtener más información, solicite una llamada de un analista o envíe su consulta.
La metodología de investigación clave utilizada por el equipo de investigación de DBMR es la triangulación de datos, que implica la extracción de datos, el análisis del impacto de las variables de datos en el mercado y la validación primaria (experto en la industria). Los modelos de datos incluyen cuadrícula de posicionamiento de proveedores, análisis de línea de tiempo de mercado, descripción general y guía del mercado, cuadrícula de posicionamiento de la empresa, análisis de patentes, análisis de precios, análisis de participación de mercado de la empresa, estándares de medición, análisis global versus regional y de participación de proveedores. Para obtener más información sobre la metodología de investigación, envíe una consulta para hablar con nuestros expertos de la industria.
Personalización disponible
Data Bridge Market Research es líder en investigación formativa avanzada. Nos enorgullecemos de brindar servicios a nuestros clientes existentes y nuevos con datos y análisis que coinciden y se adaptan a sus objetivos. El informe se puede personalizar para incluir análisis de tendencias de precios de marcas objetivo, comprensión del mercado de países adicionales (solicite la lista de países), datos de resultados de ensayos clínicos, revisión de literatura, análisis de mercado renovado y base de productos. El análisis de mercado de competidores objetivo se puede analizar desde análisis basados en tecnología hasta estrategias de cartera de mercado. Podemos agregar tantos competidores sobre los que necesite datos en el formato y estilo de datos que esté buscando. Nuestro equipo de analistas también puede proporcionarle datos en archivos de Excel sin procesar, tablas dinámicas (libro de datos) o puede ayudarlo a crear presentaciones a partir de los conjuntos de datos disponibles en el informe.

