
Global Antenna Market
Tamaño del mercado en miles de millones de dólares
Tasa de crecimiento anual compuesta (CAGR) :
% 
 USD
26.55 Billion
USD
56.49 Billion
2024
2032
USD
26.55 Billion
USD
56.49 Billion
2024
2032
| 2025 –2032 | |
| USD 26.55 Billion | |
| USD 56.49 Billion | |
| % | |
Segmentación del mercado global de antenas por tipo (externa, interna), rango de frecuencia (ultraalta, muy alta, alta), tecnología (MIMO (multientrada y multisalida), SIMO (entrada única y multisalida), MISO (multientrada y única salida), SISO (entrada única y única salida)), aplicación (sistemas celulares, radar, sistemas Wi-Fi, WiMAX, otros), sector de uso final (redes/comunicaciones, electrónica de consumo, militar/defensa, automotriz, industrial, salud/médico, IoT, 5G, otros): tendencias y pronóstico del sector hasta 2032.
Análisis del mercado de antenas
Las antenas se utilizan ampliamente a gran escala en el sector de las telecomunicaciones. Estas satisfacen las necesidades de datos de evolución optimizados, transmisión de datos más rápida y descargas de alta velocidad. Se sabe que ofrecen mayor ancho de banda con menor interferencia.
Tamaño del mercado de antenas
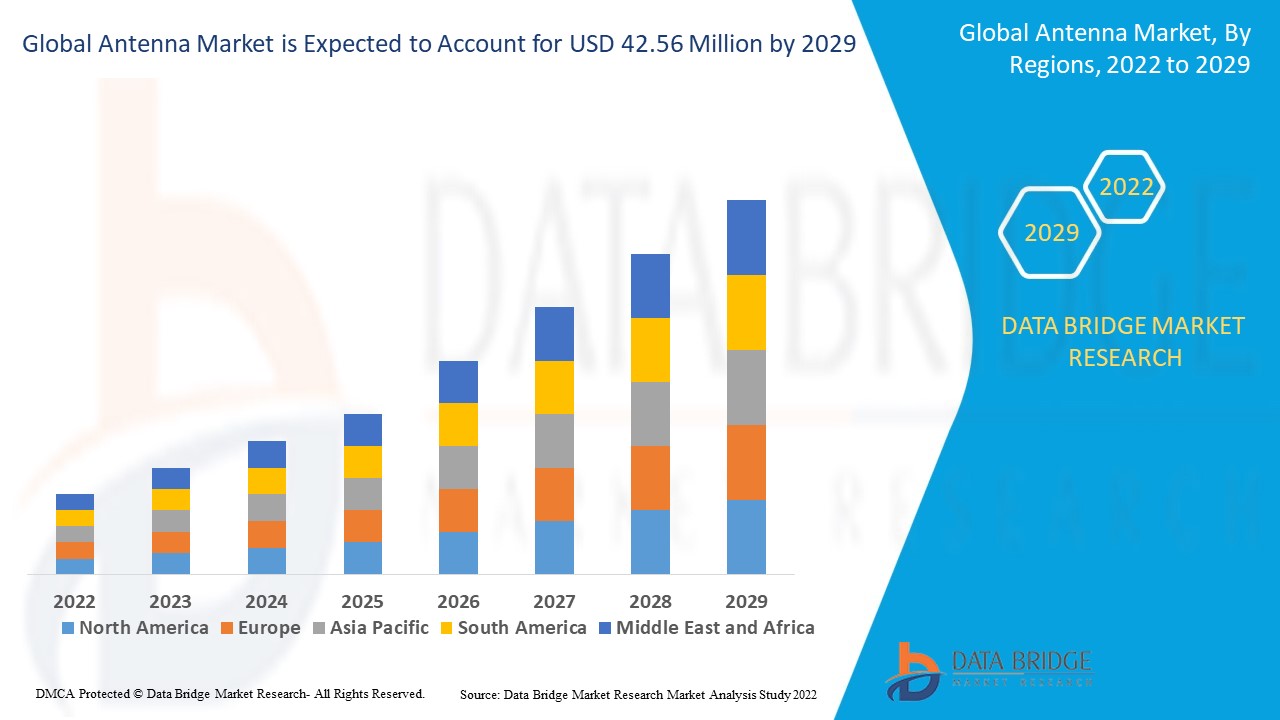
El tamaño del mercado global de antenas se valoró en USD 26,55 mil millones en 2024 y se proyecta que alcance los USD 56,49 mil millones para 2032, con una CAGR del 9,90% durante el período de pronóstico de 2025 a 2032.
Alcance del informe y segmentación del mercado
|
Atributos |
Perspectivas clave del mercado de antenas |
|
Segmentación |
|
|
Países cubiertos |
EE. UU., Canadá y México en América del Norte, Alemania, Francia, Reino Unido, Países Bajos, Suiza, Bélgica, Rusia, Italia, España, Turquía, Resto de Europa en Europa, China, Japón, India, Corea del Sur, Singapur, Malasia, Australia, Tailandia, Indonesia, Filipinas, Resto de Asia-Pacífico (APAC) en Asia-Pacífico (APAC), Arabia Saudita, Emiratos Árabes Unidos, Israel, Egipto, Sudáfrica, Resto de Medio Oriente y África (MEA) como parte de Medio Oriente y África (MEA), Brasil, Argentina y Resto de Sudamérica como parte de Sudamérica |
|
Actores clave del mercado |
TE Connectivity (Suiza), Ficosa Internacional SA (España), Abracon (EE. UU.), DENSO CORPORATION (Japón), Pulse Electronics (EE. UU.), Laird Connectivity (EE. UU.), Antenova Ltd. (Reino Unido), Johanson Technology (EE. UU.), Linx Technologies (EE. UU.), Tallysman (Canadá), Inventek Systems (EE. UU.), PCTEL (EE. UU.), WISI Communications GmbH & Co. KG (Alemania), Yokowo co., ltd. (Japón), AVX Antenna, Inc. (EE. UU.), Continental AG (Alemania), Calearo Antenne SPA (Italia), Huf Hülsbeck & Fürst GmbH & Co. KG (Alemania), HARADA INDUSTRY CO., LTD (Japón), HARMAN International (EE. UU.), INPAQ Technology Co., Ltd (Taiwán), HELLA GmbH & Co. KGaA (Alemania), Airgain, Inc. (EE. UU.), SCHAFFNER HOLDING AG (Suiza), Telefonaktiebolaget LM Ericsson (Suecia), LOROM INDUSTRIAL CO. LTD. (Reino Unido) y CommScope, Inc. (EE. UU.), entre otros. |
|
Oportunidades de mercado |
|
Definición del mercado de antenas
La antena es el dispositivo que actúa como enlace entre las ondas de radio que viajan por el espacio y los conductores que transportan corriente. Funciona como un transductor, convirtiendo el campo de radiofrecuencia en corriente alterna y viceversa.
Dinámica del mercado de antenas
Esta sección aborda la comprensión de los factores impulsores, las ventajas, las oportunidades, las limitaciones y los desafíos del mercado. Todo esto se analiza en detalle a continuación:
Conductores
- Aumento del uso de soluciones de conectividad inalámbrica
Debido al mayor uso de soluciones de conectividad inalámbrica por parte de las organizaciones como resultado de la transformación digital, el mercado de antenas tiende hacia el norte.
- Creciente adopción de la antena
Se espera que el mercado de antenas crezca debido al uso creciente de antenas en productos electrónicos de consumo, como teléfonos inteligentes , computadoras portátiles, dispositivos portátiles, tabletas y otros dispositivos.
- Aumento de la demanda de transmisión de datos más rápida
Además, la creciente demanda de una transferencia de datos más rápida en los sistemas de comunicación modernos con datos en evolución óptimos, descargas de alta velocidad y navegación en línea ha obligado a las empresas a mejorar la eficiencia de la transmisión inalámbrica, lo que beneficia al mercado de antenas.
Oportunidades
Además, la creciente adopción de telemática avanzada y el diseño mejorado de antenas amplían las oportunidades rentables para los actores del mercado en el período de pronóstico de 2025 a 2032.
Restricciones/Desafíos
Por otro lado, se prevé que el aumento del coste de las tecnologías de antenas interiores obstruya el crecimiento del mercado. Asimismo, se prevé que las crecientes disputas entre los países y sus efectos en el acuerdo comercial supongan un reto para el mercado de las aspiradoras centrales en el período de pronóstico 2025-2032.
Este informe del mercado de antenas proporciona detalles sobre los últimos desarrollos, regulaciones comerciales, análisis de importación y exportación, análisis de producción, optimización de la cadena de valor, cuota de mercado, impacto de los actores del mercado nacional y local, análisis de oportunidades en cuanto a nuevas fuentes de ingresos, cambios en las regulaciones del mercado, análisis estratégico del crecimiento del mercado, tamaño del mercado, crecimiento de las categorías de mercado, nichos de aplicación y dominio, aprobaciones y lanzamientos de productos, expansiones geográficas e innovaciones tecnológicas en el mercado. Para obtener más información sobre el mercado de antenas, contacte con Data Bridge Market Research para obtener un informe analítico. Nuestro equipo le ayudará a tomar decisiones informadas para impulsar el crecimiento del mercado.
Alcance del mercado global de antenas
El mercado de antenas se segmenta según el tipo de antena, la tecnología, el rango de frecuencia, la aplicación y el sector de uso final. El crecimiento de estos segmentos le permitirá analizar segmentos con menor crecimiento en las industrias y brindar a los usuarios una valiosa visión general del mercado y perspectivas que les ayudarán a tomar decisiones estratégicas para identificar las principales aplicaciones del mercado.
Tipo de antena
- Externo
- Interno
Rango de frecuencia
- Ultraalta
- Muy alto
- Alto
Tecnología
- MIMO (Multientrada Multisalida)
- SIMO (Entrada única, salida múltiple)
- MISO (Multientrada Salida Única)
- SISO (Entrada única, salida única)
Solicitud
- Sistemas celulares
- Radar
- Sistemas Wi-Fi
- WiMAX
- Otros
Sector de usuario final
- Redes/Comunicaciones
- Electrónica de consumo
- Militar/Defensa
- Automotor
- Industrial
- Salud/Medicina
- Internet de las cosas
- 5G
- Otros
Análisis regional del mercado de antenas
Se analiza el mercado de antenas y se proporcionan información y tendencias del tamaño del mercado por país, tipo de antena, tecnología, rango de frecuencia, aplicación y sector de uso final como se menciona anteriormente.
Los países cubiertos en el informe del mercado de antenas son EE. UU., Canadá y México en América del Norte, Alemania, Francia, Reino Unido, Países Bajos, Suiza, Bélgica, Rusia, Italia, España, Turquía, Resto de Europa en Europa, China, Japón, India, Corea del Sur, Singapur, Malasia, Australia, Tailandia, Indonesia, Filipinas, Resto de Asia-Pacífico (APAC) en Asia-Pacífico (APAC), Arabia Saudita, Emiratos Árabes Unidos, Israel, Egipto, Sudáfrica, Resto de Medio Oriente y África (MEA) como parte de Medio Oriente y África (MEA), Brasil, Argentina y Resto de América del Sur como parte de América del Sur.
América del Norte domina el mercado de antenas debido al aumento de la necesidad de servicios de Internet de alta velocidad en la región.
Se espera que Asia-Pacífico muestre un crecimiento significativo debido a la creciente automatización industrial en la región. Además, la creciente demanda de servicios de internet más rápidos que admitan tecnología avanzada impulsará aún más el crecimiento del mercado.
La sección de países del informe también presenta los factores que impactan el mercado individual y los cambios en la regulación del mercado nacional, los cuales impactan las tendencias actuales y futuras. Datos como el análisis de la cadena de valor aguas abajo y aguas arriba, las tendencias técnicas, el análisis de las cinco fuerzas de Porter y los estudios de caso son algunos de los indicadores utilizados para pronosticar el escenario del mercado en cada país. Asimismo, se considera la presencia y disponibilidad de marcas globales y los desafíos que enfrentan debido a la alta o escasa competencia de marcas locales y nacionales, el impacto de los aranceles nacionales y las rutas comerciales, al proporcionar un análisis de pronóstico de los datos nacionales.
Cuota de mercado de antenas
El panorama competitivo del mercado de antenas ofrece detalles por competidor. Se incluye información general de la empresa, sus estados financieros, ingresos generados, potencial de mercado, inversión en investigación y desarrollo, nuevas iniciativas de mercado, presencia global, plantas de producción, capacidad de producción, fortalezas y debilidades de la empresa, lanzamiento de productos, alcance y variedad de productos, y dominio de las aplicaciones. Los datos anteriores se refieren únicamente al enfoque de las empresas en el mercado de antenas.
Los líderes del mercado de antenas que operan en el mercado son:
- TE Connectivity (Suiza)
- Ficosa Internacional SA (España)
- Abracon (EE. UU.)
- DENSO CORPORATION (Japón)
- Pulse Electronics (EE. UU.)
- Laird Connectivity (EE. UU.)
- Antenova Ltd. (Reino Unido)
- Johanson Technology (EE. UU.)
- Linx Technologies (EE. UU.)
- Tallysman (Canadá)
- Inventek Systems (EE. UU.)
- PCTEL (EE.UU.)
- WISI Communications GmbH & Co. KG (Alemania)
- Yokowo co., ltd. (Japón)
- Antena AVX, Inc. (EE. UU.)
- Continental AG (Alemania)
- Calearo Antenne SPA (Italia)
- Huf Hülsbeck & Fürst GmbH & Co. KG (Alemania)
- HARADA INDUSTRY CO., LTD (Japón)
- HARMAN International (EE. UU.)
- INPAQ Technology Co., Ltd (Taiwán)
- HELLA GmbH & Co. KGaA (Alemania)
- Airgain, Inc. (EE. UU.)
- SCHAFFNER HOLDING AG (Suiza)
- Telefonaktiebolaget LM Ericsson (Suecia)
- LOROM INDUSTRIAL CO. LTD. (REINO UNIDO)
- CommScope, Inc. (EE. UU.)
Últimos avances en el mercado de antenas
- En marzo de 2019, PulseLarsen Electronics lanzó al mercado tres nuevos sistemas de antenas únicos. Para aplicaciones en interiores, se introdujeron nuevas antenas, como la serie Clear, antenas de seguridad pública y antenas de pala y varilla. Gracias a esto, la organización mejoró su oferta para el consumidor.
SKU-
Obtenga acceso en línea al informe sobre la primera nube de inteligencia de mercado del mundo

- Panel de análisis de datos interactivo
- Panel de análisis de empresas para oportunidades con alto potencial de crecimiento
- Acceso de analista de investigación para personalización y consultas
- Análisis de la competencia con panel interactivo
- Últimas noticias, actualizaciones y análisis de tendencias
- Aproveche el poder del análisis de referencia para un seguimiento integral de la competencia
Metodología de investigación
La recopilación de datos y el análisis del año base se realizan utilizando módulos de recopilación de datos con muestras de gran tamaño. La etapa incluye la obtención de información de mercado o datos relacionados a través de varias fuentes y estrategias. Incluye el examen y la planificación de todos los datos adquiridos del pasado con antelación. Asimismo, abarca el examen de las inconsistencias de información observadas en diferentes fuentes de información. Los datos de mercado se analizan y estiman utilizando modelos estadísticos y coherentes de mercado. Además, el análisis de la participación de mercado y el análisis de tendencias clave son los principales factores de éxito en el informe de mercado. Para obtener más información, solicite una llamada de un analista o envíe su consulta.
La metodología de investigación clave utilizada por el equipo de investigación de DBMR es la triangulación de datos, que implica la extracción de datos, el análisis del impacto de las variables de datos en el mercado y la validación primaria (experto en la industria). Los modelos de datos incluyen cuadrícula de posicionamiento de proveedores, análisis de línea de tiempo de mercado, descripción general y guía del mercado, cuadrícula de posicionamiento de la empresa, análisis de patentes, análisis de precios, análisis de participación de mercado de la empresa, estándares de medición, análisis global versus regional y de participación de proveedores. Para obtener más información sobre la metodología de investigación, envíe una consulta para hablar con nuestros expertos de la industria.
Personalización disponible
Data Bridge Market Research es líder en investigación formativa avanzada. Nos enorgullecemos de brindar servicios a nuestros clientes existentes y nuevos con datos y análisis que coinciden y se adaptan a sus objetivos. El informe se puede personalizar para incluir análisis de tendencias de precios de marcas objetivo, comprensión del mercado de países adicionales (solicite la lista de países), datos de resultados de ensayos clínicos, revisión de literatura, análisis de mercado renovado y base de productos. El análisis de mercado de competidores objetivo se puede analizar desde análisis basados en tecnología hasta estrategias de cartera de mercado. Podemos agregar tantos competidores sobre los que necesite datos en el formato y estilo de datos que esté buscando. Nuestro equipo de analistas también puede proporcionarle datos en archivos de Excel sin procesar, tablas dinámicas (libro de datos) o puede ayudarlo a crear presentaciones a partir de los conjuntos de datos disponibles en el informe.

