Global Amniotic Products Market
Tamaño del mercado en miles de millones de dólares
Tasa de crecimiento anual compuesta (CAGR) :
% 
 USD
1.02 Billion
USD
1.98 Billion
2024
2032
USD
1.02 Billion
USD
1.98 Billion
2024
2032
| 2025 –2032 | |
| USD 1.02 Billion | |
| USD 1.98 Billion | |
| % | |
|
Segmentación del mercado global de productos amnióticos por tipo de producto (membranas y suspensiones amnióticas), tipo (fluidos y no fluidos), aplicación (cuidado de heridas, ortopedia, oftalmología, periodoncia, medicina regenerativa, diagnóstico prenatal, biología de células madre, otros), tipo de adherencia (con y sin suturas), ubicación (tópica e interna), usuario final (hospitales, clínicas, atención domiciliaria, institutos de investigación, instituciones académicas, etc.), canal de distribución (licitación directa y distribuidor externo): tendencias y pronóstico del sector hasta 2032.
Análisis del mercado de productos amnióticos
El líquido amniótico es el líquido protector contenido en la membrana amniótica, que actúa como amortiguador para el feto en crecimiento y facilita el intercambio de nutrientes, agua y productos bioquímicos entre la madre y el feto. Los productos derivados del líquido amniótico, como la membrana amniótica y los productos derivados del líquido amniótico, constituyen un subtipo de ortobiología que se está investigando como una posible opción de tratamiento mediante el aumento de la inflamación y la cicatrización articular. Las membranas amnióticas (MA) se utilizaron inicialmente para el tratamiento de afecciones cutáneas como quemaduras, úlceras y heridas . La amplia gama de productos amnióticos utilizados en el tratamiento de enfermedades satisface la necesidad de los centros de salud. El creciente avance tecnológico conduce al desarrollo de productos amnióticos de alta eficiencia en el mercado.
Los principales factores que impulsan el crecimiento del mercado mundial de productos amnióticos son el uso de productos amnióticos para el tratamiento de trastornos de la piel y los ojos y la investigación en curso para aumentar la aplicación terapéutica y el factor que obstaculiza el crecimiento del mercado de productos amnióticos incluye el alto costo de los productos y procedimientos amnióticos y el retiro de productos.
El informe de mercado de productos amnióticos proporciona detalles sobre la cuota de mercado, nuevos desarrollos y análisis de la cartera de productos, el impacto de los actores del mercado nacional y local, y analiza las oportunidades en cuanto a nuevas oportunidades de negocio, cambios en la normativa del mercado, aprobaciones de productos, decisiones estratégicas, lanzamientos de productos, expansiones geográficas e innovaciones tecnológicas. Para comprender el análisis y la situación del mercado de productos amnióticos, contacte con Data Bridge Market Research para obtener un informe analítico. Nuestro equipo le ayudará a crear una solución que influya en los ingresos para alcanzar su objetivo.
Tamaño del mercado de productos amnióticos
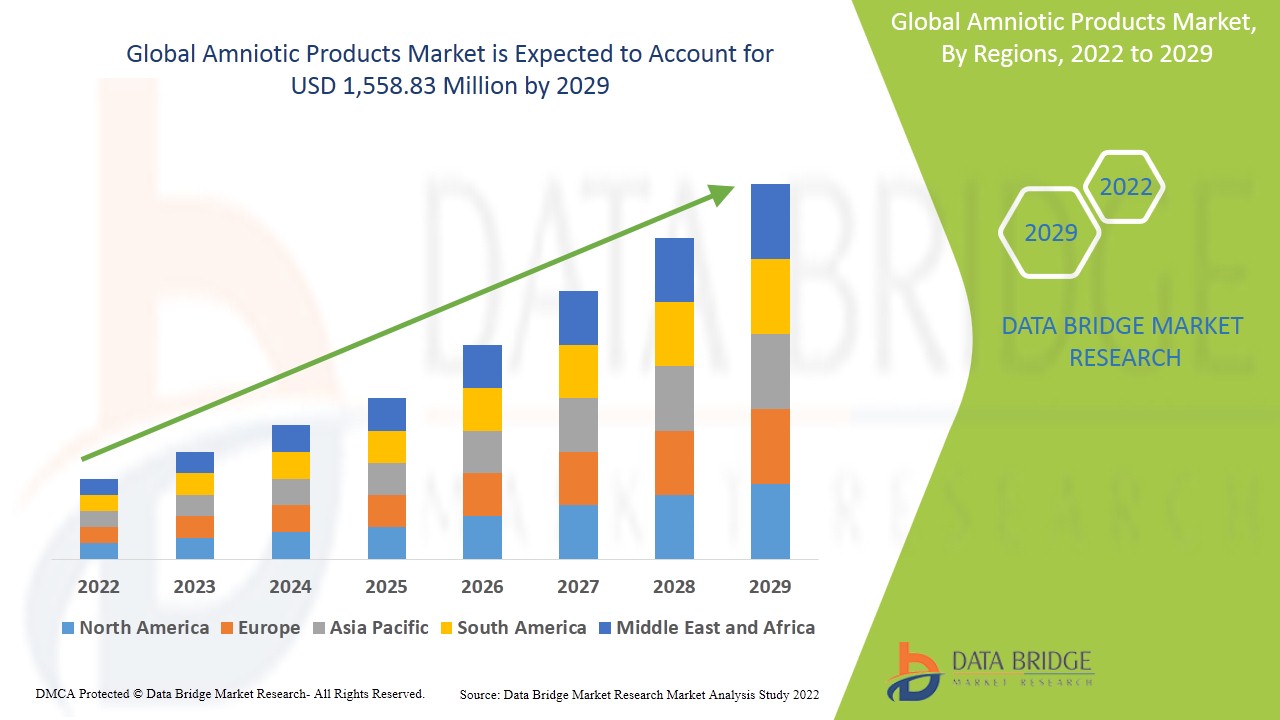
El tamaño del mercado mundial de productos amnióticos se valoró en USD 1.02 mil millones en 2024 y se proyecta que alcance los USD 1.98 mil millones para 2032, con una CAGR del 8,6% durante el período de pronóstico de 2025 a 2032.
Tendencias del mercado de productos amnióticos
Creciente adopción de la medicina regenerativa y soluciones para la cicatrización de heridas
Una de las tendencias clave en el mercado de productos amnióticos es la creciente adopción de la medicina regenerativa y las soluciones avanzadas para la cicatrización de heridas. Los productos amnióticos, como las membranas y el líquido amniótico, están ganando popularidad por su capacidad para promover la reparación tisular, mejorar la cicatrización de heridas y reducir la inflamación. Estos tratamientos no invasivos son especialmente valorados por su eficacia en el tratamiento de heridas crónicas, lesiones ortopédicas y la regeneración cutánea sin necesidad de cirugía. El creciente enfoque en procedimientos mínimamente invasivos, sumado a la creciente prevalencia de enfermedades crónicas y al envejecimiento de la población, está impulsando la demanda de productos amnióticos tanto en aplicaciones médicas como estéticas. Además, a medida que más investigaciones validan su potencial terapéutico, los productos amnióticos se están convirtiendo en una opción clave en la medicina regenerativa, impulsando aún más el crecimiento del mercado.
Alcance del informe y segmentación del mercado
|
Atributos |
Perspectivas clave del mercado de productos amnióticos |
|
Segmentación |
|
|
Países cubiertos |
EE. UU., Canadá y México, Alemania, Reino Unido, Italia, Francia, España, Suiza, Rusia, Turquía, Bélgica, Países Bajos y resto de Europa, China, Corea del Sur, Japón, India, Australia, Singapur, Malasia, Indonesia, Tailandia, Filipinas y resto de Asia-Pacífico, Sudáfrica, Arabia Saudita, Emiratos Árabes Unidos, Israel, Egipto y resto de Oriente Medio y África, Brasil, Argentina y resto de Sudamérica. |
|
Actores clave del mercado |
MIMEDX, Smith+Nephew, Organogenesis Inc., Integra LifeSciences, Stryker, APPLIED BIOLOGICS, Katena Products Inc., Lucina BioSciences, Next Biosciences, Skye Biologics Holdings, LLC, Surgenex, LLC, Ventris Medical, LLC, VIVEX Biologics, Inc., StimLabs LLC, LifeCell International Pvt. Ltd., NuVision Biotherapies Ltd., Genesis Biologics, Amnio Technology, LLC, AMNICELL Corporation, LTD. AlloSource |
Definición del mercado de productos amnióticos
El líquido amniótico es el líquido protector contenido en la membrana amniótica, que actúa como amortiguador para el feto en crecimiento y facilita el intercambio de nutrientes, agua y productos bioquímicos entre la madre y el feto. Los productos derivados del líquido amniótico, como la membrana amniótica y los productos derivados del líquido amniótico, constituyen un subtipo de ortobiológico que se está investigando como una posible opción de tratamiento mediante el aumento de la inflamación y la cicatrización articular. Las membranas amnióticas (MA) se utilizaron inicialmente para el tratamiento de afecciones cutáneas como quemaduras, úlceras y heridas. La amplia gama de productos amnióticos utilizados en el tratamiento de enfermedades satisface la necesidad de los centros de salud. El creciente avance tecnológico conduce al desarrollo de productos amnióticos de alta eficiencia en el mercado.
Dinámica del mercado de productos amnióticos
Conductores
Los principales factores que impulsan el crecimiento del mercado mundial de productos amnióticos son el uso de productos amnióticos para el tratamiento de trastornos de la piel y los ojos y la investigación en curso para aumentar la aplicación terapéutica.
Oportunidades
El uso creciente de productos amnióticos para el tratamiento de trastornos de la piel y los ojos y el aumento de iniciativas estratégicas por parte de actores clave actúan como una oportunidad para el crecimiento del mercado de productos amnióticos.
Restricciones/Desafíos
El factor que obstaculiza el crecimiento del mercado de productos amnióticos incluye el alto costo de los productos y procedimientos amnióticos y el retiro de productos.
Alcance del mercado de productos amnióticos
El mercado de productos amnióticos se segmenta según el tipo de producto, tipo, aplicación, tipo de adherencia, ubicación, usuario final y canal de distribución. El crecimiento entre segmentos le ayuda a analizar nichos de mercado y estrategias para abordar el mercado y determinar sus principales áreas de aplicación y la diferenciación en sus mercados objetivo.
Tipo de producto
- membranas amnióticas
- suspensiones amnióticas
Tipo
- Fluidos
- No flowabales
Solicitud
- Cuidado de heridas
- Ortopedía
- Oftalmología
- Periodontal
- Medicinas regenerativas
- Diagnóstico prenatal
- Biología de células madre
- Otros
Tipo de adherencia
- Con suturas
- Sin suturas
Sitio
- Con tópico
- Interno
Usuario final
- Hospital
- Clínicas
- Institutos de investigación
- Cuidado domiciliario
- Otros
Canal de distribución
- Licitación directa
- Distribuidor de terceros
Análisis regional del mercado de productos amnióticos
Se analiza el mercado de productos amnióticos y se proporciona información sobre el tamaño del mercado por país, tipo de producto, tipo, aplicación, tipo de adherencia, sitio, usuario final y canal de distribución como se menciona anteriormente.
Los países cubiertos en el informe del mercado de productos amnióticos son EE. UU., Canadá y México, Alemania, Reino Unido, Italia, Francia, España, Suiza, Rusia, Turquía, Bélgica, Países Bajos y el resto de Europa, China, Corea del Sur, Japón, India, Australia, Singapur, Malasia, Indonesia, Tailandia, Filipinas y el resto de Asia-Pacífico, Sudáfrica, Arabia Saudita, Emiratos Árabes Unidos, Israel, Egipto y el resto de Medio Oriente y África, Brasil, Argentina y el resto de América del Sur.
Se prevé que el segmento de membranas amnióticas en la región estadounidense de Norteamérica experimente su mayor crecimiento durante el período de pronóstico de 2025 a 2032, debido al creciente uso de productos amnióticos y al incremento de las actividades de investigación. En Alemania, el segmento de membranas amnióticas domina el mercado europeo debido al aumento de casos de atención de heridas y otras enfermedades oftalmológicas y ortopédicas. China lidera el crecimiento del mercado de Asia-Pacífico, y el segmento de membranas amnióticas domina en este país gracias al creciente número de centros de biotecnología y actividades de investigación.
La sección de países del informe también presenta los factores que impactan cada mercado y los cambios en la regulación nacional que impactan las tendencias actuales y futuras. Datos como las nuevas ventas, las ventas de reemplazo, la demografía del país, las leyes regulatorias y los aranceles de importación y exportación son algunos de los principales indicadores utilizados para pronosticar el escenario del mercado en cada país. Asimismo, se consideran la presencia y disponibilidad de marcas globales, los desafíos que enfrentan debido a la alta o escasa competencia de las marcas locales y nacionales, y el impacto de los canales de venta, al proporcionar un análisis de pronóstico de los datos del país.
Cuota de mercado de productos amnióticos
El panorama competitivo del mercado de productos amnióticos ofrece detalles por competidor. Se incluye información general de la empresa, sus estados financieros, ingresos generados, potencial de mercado, inversión en investigación y desarrollo, nuevas iniciativas de mercado, plantas de producción, fortalezas y debilidades, lanzamiento de productos, líneas de prueba, aprobaciones, patentes, alcance y variedad de productos, dominio de aplicaciones y curva de vida tecnológica. Los datos anteriores se refieren únicamente al enfoque de la empresa en el mercado de productos amnióticos.
Los líderes del mercado de productos amnióticos que operan en el mercado son:
- MIMEDX
- Smith+Nephew
- Organogénesis Inc.
- Integra LifeSciences, Stryker
- BIOLOGÍA APLICADA
- Productos Katena. Inc.
- Lucina BioSciences
- Próximas biociencias
- Skye Biologics Holdings, LLC.
- Surgenex, LLC.
- Ventris Medical, LLC.
- VIVEX Biologics, Inc.
- StimLabs LLC.
- LifeCell International Pvt. Ltd.
- NuVision Biotherapies Ltd.
- Productos biológicos Génesis
- Tecnología Amnio, LLC.
- Corporación AMNICELL, LTD
- AlloSource
Últimos avances en el mercado de productos amnióticos
- En enero, MiMedx anunció la adquisición de Stability Inc. (Stability Biologics). Con esta adquisición, MiMedx desarrollará y comercializará productos y terapias avanzadas para los sectores de cuidado de heridas, cirugía, ortopedia, columna vertebral, medicina deportiva, oftalmología y odontología, junto con Stability Biologics. Esta adquisición impulsó a la compañía a aumentar sus ingresos al adquirir una empresa de renombre.
- En febrero de 2020, Integra LifeSciences Holding Corporation anunció el lanzamiento de la membrana de aloinjerto placentario AmnioExcel Plus, su producto más reciente para el cuidado de heridas, que favorece la reparación de tejidos blandos. AmnioExcel Plus es un aloinjerto de nueva generación, más grueso, de tres capas y sin lado específico, compuesto por capas de amnios, corion y amnios, que ayuda a crear un entorno que facilita el cierre de heridas complejas. La tecnología patentada de procesamiento DryFlex preserva los factores de crecimiento, las citocinas y la matriz extracelular (MEC) inherentes al tejido placentario nativo.
SKU-
Obtenga acceso en línea al informe sobre la primera nube de inteligencia de mercado del mundo
- Panel de análisis de datos interactivo
- Panel de análisis de empresas para oportunidades con alto potencial de crecimiento
- Acceso de analista de investigación para personalización y consultas
- Análisis de la competencia con panel interactivo
- Últimas noticias, actualizaciones y análisis de tendencias
- Aproveche el poder del análisis de referencia para un seguimiento integral de la competencia
Metodología de investigación
La recopilación de datos y el análisis del año base se realizan utilizando módulos de recopilación de datos con muestras de gran tamaño. La etapa incluye la obtención de información de mercado o datos relacionados a través de varias fuentes y estrategias. Incluye el examen y la planificación de todos los datos adquiridos del pasado con antelación. Asimismo, abarca el examen de las inconsistencias de información observadas en diferentes fuentes de información. Los datos de mercado se analizan y estiman utilizando modelos estadísticos y coherentes de mercado. Además, el análisis de la participación de mercado y el análisis de tendencias clave son los principales factores de éxito en el informe de mercado. Para obtener más información, solicite una llamada de un analista o envíe su consulta.
La metodología de investigación clave utilizada por el equipo de investigación de DBMR es la triangulación de datos, que implica la extracción de datos, el análisis del impacto de las variables de datos en el mercado y la validación primaria (experto en la industria). Los modelos de datos incluyen cuadrícula de posicionamiento de proveedores, análisis de línea de tiempo de mercado, descripción general y guía del mercado, cuadrícula de posicionamiento de la empresa, análisis de patentes, análisis de precios, análisis de participación de mercado de la empresa, estándares de medición, análisis global versus regional y de participación de proveedores. Para obtener más información sobre la metodología de investigación, envíe una consulta para hablar con nuestros expertos de la industria.
Personalización disponible
Data Bridge Market Research es líder en investigación formativa avanzada. Nos enorgullecemos de brindar servicios a nuestros clientes existentes y nuevos con datos y análisis que coinciden y se adaptan a sus objetivos. El informe se puede personalizar para incluir análisis de tendencias de precios de marcas objetivo, comprensión del mercado de países adicionales (solicite la lista de países), datos de resultados de ensayos clínicos, revisión de literatura, análisis de mercado renovado y base de productos. El análisis de mercado de competidores objetivo se puede analizar desde análisis basados en tecnología hasta estrategias de cartera de mercado. Podemos agregar tantos competidores sobre los que necesite datos en el formato y estilo de datos que esté buscando. Nuestro equipo de analistas también puede proporcionarle datos en archivos de Excel sin procesar, tablas dinámicas (libro de datos) o puede ayudarlo a crear presentaciones a partir de los conjuntos de datos disponibles en el informe.