Image

Mercado mundial de feromonas agrícolas: tendencias de la industria y pronóstico para 2031

Bebida alimenticia

Image

Mercado mundial de feromonas agrícolas: tendencias de la industria y pronóstico para 2031

  • Bebida alimenticia
  • Informe publicado
  • mayo 2024
  • Global
  • 350 páginas
  • Número de mesas: 492
  • Número de figuras: 32

Mercado mundial de feromonas agrícolas: tendencias de la industria y pronóstico para 2031

Tamaño del mercado en miles de millones de dólares

CAGR: % Diagram

Diagram Período de pronóstico 2023-2031
Diagram Tamaño del mercado (año base) 3,15 mil millones de dólares
Diagram Tamaño del mercado (año previsto) 10,45 mil millones de dólares
Diagram CAGR %

Mercado global de feromonas agrícolas, por tipo (feromonas sexuales, feromonas de agregación, feromonas repelentes y otros), especies (polillas, escarabajos e insectos, gusanos cogolleros, mariposas y otros), función (interrupción del apareamiento, captura masiva, detección y monitoreo y otros), Modo de aplicación (dispensador, trampas, pulverizadores y otros), tipo de cultivo (frutas, hortalizas, plantas de té, césped y adornos, semillas oleaginosas y legumbres, cereales y granos y otros), canal de distribución (directo e indirecto): tendencias de la industria y Previsión hasta 2031.

Agricultural Pheromones Market

Análisis y tamaño del mercado de feromonas agrícolas
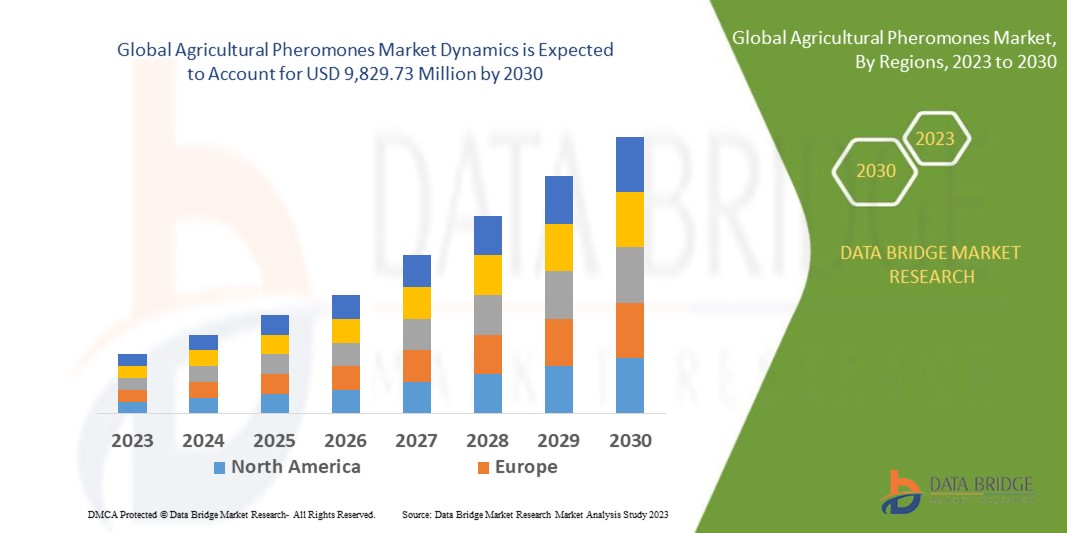
Se espera que el mercado mundial de feromonas agrícolas crezca significativamente en el período previsto de 2024 a 2031. Data Bridge Market Research analiza que el mercado está creciendo con una tasa compuesta anual del 16,4% en el período previsto de 2024 a 2031 desde USD 3,15 mil millones en 2023 y Se espera que alcance los 10.450 millones de dólares en 2031. Con la creciente preocupación por el impacto ambiental de los pesticidas químicos, existe una demanda creciente de métodos sostenibles de control de plagas. Las feromonas ofrecen una alternativa ecológica, impulsando su adopción en la agricultura, que son algunos de los factores impulsores que se espera impulsen el crecimiento del mercado.

Agricultural Pheromones MarketAgricultural Pheromones Market

Lo global agrícola El informe de mercado de feromonas proporciona detalles de la participación de mercado, los nuevos desarrollos y el impacto de los actores del mercado nacional y localizado, analiza oportunidades en términos de bolsillos de ingresos emergentes, cambios en las regulaciones del mercado, aprobaciones de productos, decisiones estratégicas, lanzamientos de productos, expansiones geográficas y tecnología. innovaciones en el mercado. Para comprender el análisis y el escenario del mercado, contáctenos para recibir un informe del analista. Nuestro equipo lo ayudará a crear una solución que impacte los ingresos para lograr el objetivo deseado.

Métrica de informe

Detalles

Período de pronóstico

2024 a 2031

Año base

2023

Años históricos

2022 (Personalizable para 2016 - 2021)

Unidades Cuantitativas

Ingresos en miles de millones de dólares

Segmentos cubiertos

Tipo (feromonas sexuales, feromonas de agregación, feromonas repelentes y otras), especie (polillas, escarabajos e chinches, gusanos cogolleros, mariposas y otras), función (interrupción del apareamiento, captura masiva, detección y monitoreo y otras), modo de aplicación (dispensador, Trampas, Aerosoles y Otros), Tipo de Cultivo (Frutas, Hortalizas, Plantas de Té, Césped y Adornos, Semillas y Legumbres Oleaginosas, Cereales y Granos y Otros), Canal de Distribución (Directo e Indirecto)

Países cubiertos

EE.UU., Canadá, México, Alemania, Francia, Reino Unido, Italia, España, Rusia, Países Bajos, Bélgica, Suiza, Turquía, Resto de Europa, China, Japón, India, Corea del Sur, Indonesia, Filipinas, Tailandia, Australia, Malasia, Singapur , Resto de Asia-Pacífico, Brasil, Argentina, Resto de América del Sur, Arabia Saudita, Emiratos Árabes Unidos, Sudáfrica, Kuwait y Resto de Medio Oriente y África

Actores del mercado cubiertos

Shin-Etsu Chemical Co., Ltd, FMC Corporation, BASF SE, Bioline AgroSciences Ltd., ISCA, BedoukianBio, Biobest Group NV, ChemTica Internacional, SA, Hercon Environmental, Koppert, Laboratorios Agrochem SL, Nufarm, Pherobank, Russell IPM Ltd, Suttera (una subsidiaria de The Wonderful Company LLC.) y Trécé Inc., entre otras

Definición del mercado mundial de feromonas agrícolas

Las feromonas agrícolas son químico Sustancias producidas y liberadas por organismos en el ambiente agrícola, particularmente insectos, para comunicarse entre sí. Estas feromonas desempeñan un papel crucial en varios aspectos del manejo agrícola, incluido el control de plagas, el comportamiento de apareamiento y la organización social. Además, las feromonas agrícolas también se pueden utilizar para monitorear las poblaciones de plagas atrapando insectos atraídos por feromonas específicas. Esta información ayuda a los agricultores e investigadores agrícolas a rastrear las poblaciones de plagas, evaluar la efectividad de las medidas de control y tomar decisiones informadas sobre las estrategias de manejo de plagas.

Dinámica del mercado mundial de feromonas agrícolas

Esta sección trata de comprender los impulsores, las oportunidades, los desafíos y las restricciones del mercado. Todo esto se analiza en detalle a continuación:

Conductores

  • Creciente demanda de manejo sostenible de plagas

El enfoque de los consumidores y los reguladores en la sostenibilidad ambiental y la seguridad alimentaria está impulsando la demanda de métodos de control de plagas con un uso reducido de productos químicos. Las feromonas agrícolas, compuestos naturales emitidos por los insectos para comunicarse, ofrecen una alternativa sostenible. Se dirigen específicamente a las plagas, minimizando el daño a los organismos no objetivo y a los insectos beneficiosos, reduciendo los residuos de pesticidas y preservando la biodiversidad. Las prácticas de manejo integrado de plagas (MIP) están contribuyendo a la adopción de feromonas agrícolas. Al integrar métodos basados ​​en feromonas con otras tácticas de control de plagas, los agricultores pueden controlar las poblaciones de plagas de manera efectiva y al mismo tiempo reducir la dependencia de pesticidas químicos. El apoyo regulatorio y los incentivos para la agricultura sostenible están impulsando aún más la adopción de feromonas agrícolas. Los gobiernos de todo el mundo están restringiendo el uso de pesticidas convencionales y promoviendo alternativas respetuosas con el medio ambiente, estimulando el crecimiento del mercado.

  • Apoyo regulatorio para el manejo integrado de plagas (MIP)

Con el objetivo de reducir la dependencia de pesticidas químicos, los gobiernos de todo el mundo están defendiendo el Manejo Integrado de Plagas (MIP), que integra varios métodos de control de plagas, incluido el uso estratégico de feromonas. Al promover prácticas agrícolas sostenibles, los organismos reguladores contribuyen a la preservación del medio ambiente y la protección de la salud pública.

El reconocimiento de la eficacia de las feromonas en el manejo de plagas por parte de las agencias reguladoras es evidente en el desarrollo de directrices, regulaciones y programas de certificación destinados a fomentar su adopción. Estas iniciativas no sólo enfatizan la importancia de reducir el uso de pesticidas, sino que también brindan incentivos para que los agricultores implementen alternativas respetuosas con el medio ambiente, como las feromonas. Además, la colaboración regulatoria con las partes interesadas de la industria garantiza la mejora continua y la estandarización de los productos a base de feromonas, infundiendo confianza en su seguridad y eficacia entre los agricultores.

Además, el apoyo regulatorio al MIP y al uso de feromonas está impulsado por preocupaciones ambientales más amplias, incluida la conservación de los ecosistemas y la preservación de la biodiversidad. Los gobiernos reconocen la necesidad de salvaguardar los recursos naturales y mitigar los impactos adversos de los pesticidas convencionales en los ecosistemas y la salud humana. Al respaldar prácticas sostenibles de manejo de plagas, como soluciones basadas en feromonas, las agencias reguladoras contribuyen al esfuerzo colectivo para lograr un sector agrícola más respetuoso con el medio ambiente y sostenible.

  • Avances en la tecnología de feromonas

Las innovaciones tecnológicas abarcan varios aspectos de la producción, formulación y sistemas de administración de feromonas, lo que conduce a una mayor eficacia, rentabilidad y facilidad de uso en aplicaciones de control de plagas. Un avance significativo es el desarrollo de feromonas sintéticas, que ofrecen varias ventajas sobre las feromonas de origen natural, incluida una mayor estabilidad, pureza y escalabilidad de la producción. Además, los avances en las técnicas de formulación permiten la encapsulación de feromonas en diversas matrices, como microcápsulas o dispositivos de liberación controlada, prolongando su actividad y eficacia en el campo. Además, los avances en los sistemas de administración de feromonas, como las trampas o dispensadores de feromonas, mejoran su practicidad y aplicabilidad en diversos entornos agrícolas.

Además, los avances en las tecnologías de monitoreo y detección permiten el monitoreo en tiempo real de las poblaciones de plagas y la evaluación de la eficacia de las feromonas, lo que proporciona información valiosa para la toma de decisiones sobre el manejo de plagas. Estos avances tecnológicos no sólo mejoran la eficacia y confiabilidad general de los métodos de control de plagas basados ​​en feromonas, sino que también contribuyen a una adopción más amplia de prácticas sostenibles de manejo de plagas en la agricultura.

Agricultural Pheromones Market

Oportunidad

  • Expansión en mercados emergentes

Los mercados emergentes, caracterizados por una rápida industrialización, urbanización y una creciente intensificación agrícola, ofrecen un potencial sin explotar para la adopción y el crecimiento de soluciones de control de plagas basadas en feromonas. A medida que estas economías evolucionan, existe un reconocimiento cada vez mayor de la necesidad de prácticas agrícolas sostenibles para abordar los desafíos de la seguridad alimentaria, las preocupaciones ambientales y las presiones regulatorias. Una oportunidad importante es la creciente demanda de soluciones de manejo de plagas respetuosas con el medio ambiente en los mercados emergentes. Los métodos tradicionales de control de plagas en estas regiones a menudo dependen en gran medida de pesticidas químicos, que pueden tener efectos perjudiciales para la salud humana, la biodiversidad y los servicios ecosistémicos. El control de plagas basado en feromonas ofrece una alternativa sostenible que se alinea con el creciente énfasis en las prácticas agrícolas ecológicas y los requisitos reglamentarios para la reducción de pesticidas y el manejo de residuos. Además, los diversos paisajes agrícolas y perfiles de plagas en los mercados emergentes presentan oportunidades para soluciones de feromonas personalizadas para abordar oportunidades de plagas específicas. Al personalizar las formulaciones de feromonas y las estrategias de implementación para adaptarlas a las condiciones locales y los sistemas de producción de cultivos, los fabricantes pueden satisfacer las necesidades y preferencias únicas de los agricultores en estas regiones, fomentando una mayor adopción y penetración en el mercado.

Restricciones/Desafíos

  • Condiciones ambientales variables

El control de plagas basado en feromonas se basa en la manipulación precisa del comportamiento de los insectos mediante la liberación de señales químicas específicas de cada especie. Sin embargo, factores ambientales como la temperatura, la humedad y la velocidad del viento pueden influir en la dispersión, longevidad y eficacia de las feromonas en el campo.

Las altas temperaturas pueden acelerar la degradación de las feromonas, reduciendo su eficacia y acortando su vida útil. Por el contrario, las bajas temperaturas pueden ralentizar la tasa de liberación de feromonas, limitando su eficacia para atraer plagas objetivo. De manera similar, las fluctuaciones en los niveles de humedad pueden afectar la evaporación y dispersión de las feromonas, alterando su distribución y reduciendo su atractivo para las plagas. Además, las condiciones ambientales variables pueden afectar el comportamiento de las plagas y la dinámica de las poblaciones, lo que influye en la eficacia de las estrategias de control de plagas basadas en feromonas. Además, la variabilidad ambiental puede plantear desafíos logísticos para el despliegue y la gestión de feromonas. Los eventos climáticos extremos, como lluvias intensas, vientos fuertes o condiciones de sequía, pueden dañar los dispensadores de feromonas, interrumpir los esfuerzos de captura o interferir con la transmisión de señales de feromonas, comprometiendo los resultados del control de plagas.

  • Complejidad de implementación y adopción

Las soluciones de control de plagas basadas en feromonas ofrecen beneficios prometedores en términos de eficacia, sostenibilidad y seguridad ambiental; su adopción puede verse obstaculizada por varios factores relacionados con la complejidad. A diferencia de los pesticidas químicos convencionales, que son familiares y ampliamente adoptados por los agricultores, las soluciones basadas en feromonas requieren conocimientos y capacitación especializados para una implementación adecuada. Los agricultores pueden enfrentar desafíos para comprender los principios del control de plagas basado en feromonas, seleccionar productos apropiados e implementarlos de manera efectiva en el campo.

Además, la adopción de soluciones de control de plagas basadas en feromonas a menudo implica cambios en las prácticas de gestión agrícola, las técnicas de producción de cultivos y los protocolos de seguimiento de plagas. Esta transición puede ser desalentadora para los agricultores, particularmente aquellos con recursos, experiencia técnica o acceso a información y capacitación limitados.

Desarrollos recientes

  • En diciembre de 2022, según un artículo publicado por ResearchGate GmbH, se destacó el papel fundamental de las feromonas sexuales para abordar los desafíos que plantean los insectos herbívoros en la agricultura global. Enfatiza la necesidad de alternativas sostenibles a los pesticidas químicos tradicionales debido a sus riesgos para el medio ambiente y la salud. El capítulo explora el uso actual de feromonas para monitorear y controlar poblaciones de insectos, destacando su naturaleza no tóxica y específica de cada especie.
  • Según un blog publicado por ISCA., East ISCA Inc. es líder en la aplicación de feromonas de insectos seguras para controlar los insectos invasores. El Servicio Forestal de EE. UU. utiliza SPLAT GM, el control de feromonas de ISCA para la polilla gitana, en cientos de miles de acres en 10 estados.

Mercado mundial de feromonas agrícolas Alcance

El mercado de feromonas agrícolas se clasifica según el tipo, especie, función, modo de aplicación, tipo de cultivo y canal de distribución. El crecimiento entre estos segmentos lo ayudará a analizar los principales segmentos de crecimiento en las industrias y brindará a los usuarios una valiosa descripción general del mercado y el mercado. conocimientos para tomar decisiones estratégicas para identificar las principales aplicaciones del mercado.

Tipo

  • Feromonas sexuales
  • Feromonas de agregación
  • Repelen las feromonas
  • Otros

Según el tipo de producto, el mercado de feromonas agrícolas se segmenta en feromonas sexuales, feromonas de agregación, feromonas repelentes y otras.

Especies

  • polillas
  • Escarabajos y bichos
  • gusano cogollero
  • mariposas
  • Otros

Según las especies, el mercado de feromonas agrícolas se segmenta en polillas, escarabajos e chinches, gusanos cogolleros, mariposas y otros.

Función

  • Interrupción del apareamiento
  • Trampa masiva
  • Detección y Monitoreo
  • Otros

Según su función, el mercado de feromonas agrícolas se segmenta en alteración del apareamiento, captura masiva, detección y seguimiento, entre otros.

Modo de aplicación

  • Dispensador
  • Trampas
  • Aerosoles
  • Otros

Según el modo de aplicación, el mercado de feromonas agrícolas se segmenta en dispensadores, trampas, aerosoles y otros.

Tipo de cultivo

  • frutas
  • Verduras
  • Plantas de té
  • Césped y adornos
  • Semillas oleaginosas y legumbres
  • Cereales y Granos
  • Otros

Según el tipo de cultivo, el mercado de feromonas agrícolas se segmenta en frutas, verduras, plantas de té, césped y adornos, semillas oleaginosas y legumbres, cereales y granos, y otros.

Canal de distribución

  • Directo
  • Indirecto

Según el canal de distribución, el mercado de feromonas agrícolas se segmenta en directo e indirecto.

Agricultural Pheromones Market

Análisis/perspectivas regionales del mercado mundial de feromonas agrícolas

El mercado de feromonas agrícolas está segmentado según el tipo, especie, función, modo de aplicación, tipo de cultivo y canal de distribución.

Los países cubiertos en el informe del mercado mundial de feromonas agrícolas son EE. UU., Canadá, México, Alemania, Francia, Reino Unido, Italia, España, Rusia, Países Bajos, Bélgica, Suiza, Turquía, el resto de Europa, China, Japón, India, Corea del Sur e Indonesia. , Filipinas, Tailandia, Australia, Malasia, Singapur, resto de Asia-Pacífico, Brasil, Argentina, resto de Sudamérica, Arabia Saudita, Emiratos Árabes Unidos, Sudáfrica, Kuwait y resto de Medio Oriente y África.

América del Norte está dominando el mercado debido a que la disponibilidad de financiación de deuda y capital de inversores influye en el nivel de actividad de transacciones en el mercado de PE. Las condiciones de financiación favorables pueden permitir acuerdos más grandes y valoraciones más altas. Se espera que Estados Unidos en América del Norte domine el mercado y también el país de más rápido crecimiento en la región debido a la creciente demanda de control sostenible de plagas. En Europa, Francia domina el mercado debido a los crecientes avances en la tecnología de feromonas. En Asia y el Pacífico, China domina el mercado debido a las crecientes prácticas de agricultura orgánica.

La sección de países del informe también proporciona factores individuales que impactan el mercado y cambios en la regulación del mercado que impactan las tendencias actuales y futuras del mercado. El análisis de la cadena de valor ascendente y descendente de los puntos de datos, el análisis de las cinco fuerzas de Porter de las tendencias técnicas y los estudios de casos son algunos de los indicadores utilizados para pronosticar el escenario del mercado para países individuales. Además, se consideran la presencia y disponibilidad de las marcas de América del Norte y los desafíos que enfrentan debido a la competencia grande o escasa de las marcas locales y nacionales, el impacto de los aranceles internos y las rutas comerciales, al tiempo que se proporciona un análisis de pronóstico de los datos del país.

Agricultural Pheromones Market

Panorama competitivo y cuota de mercado Análisis Cosméticos

El panorama competitivo del mercado de feromonas agrícolas proporciona detalles de los competidores. Los detalles incluidos son descripción general de la empresa, finanzas de la empresa, ingresos generados, potencial de mercado, inversión en investigación y desarrollo, nuevas iniciativas de mercado, sitios e instalaciones de producción, fortalezas y debilidades de la empresa, lanzamiento de productos, proyectos de pruebas de productos, aprobaciones de productos, patentes, ancho del producto y amplitud, dominio de la aplicación, curva de línea de vida tecnológica. Los puntos de datos anteriores proporcionados sólo están relacionados con el enfoque de las empresas en el mercado.

Algunos de los principales actores que operan en el mercado mundial de feromonas agrícolas Shin-Etsu Chemical Co., Ltd, FMC Corporation, BASF SE, Bioline AgroSciences Ltd., ISCA, BedoukianBio, Biobest Group NV, ChemTica Internacional, SA, Hercon Environmental, Koppert, Laboratorios Agrochem SL, Nufarm, Pherobank, Russell IPM Ltd, Suttera (Subsidiaria de The Wonderful Company LLC.) y Trécé Inc., entre otras.


SKU-

TABLA 1 ANÁLISIS DE PATENTES

TABLA 2 MERCADO MUNDIAL DE FEROMONAS AGRÍCOLAS, POR TIPO, 2022-2031 (MILLONES DE USD)

TABLA 3 FEROMONAS SEXUALES MUNDIALES EN EL MERCADO DE FEROMONAS AGRÍCOLAS, POR REGIÓN, 2022-2031 (MILLONES DE USD)

TABLA 4 MERCADO MUNDIAL DE FEROMONAS SEXUALES EN FEROMONAS AGRÍCOLAS, POR TIPO, 2022-2031 (MILLONES DE USD)

TABLA 5 FEROMONAS DE AGREGACIÓN GLOBAL EN EL MERCADO DE FEROMONAS AGRÍCOLAS, POR REGIÓN, 2022-2031 (MILLONES DE USD)

TABLA 6 FEROMONAS REPELENTES MUNDIALES EN EL MERCADO DE FEROMONAS AGRÍCOLAS, POR REGIÓN, 2022-2031 (MILLONES DE USD)

TABLA 7 MERCADO GLOBAL DE OTROS EN FEROMONAS AGRÍCOLAS, POR REGIÓN, 2022-2031 (MILLONES DE USD)

TABLA 8 MERCADO MUNDIAL DE FEROMONAS AGRÍCOLAS, POR ESPECIE, 2022-2031 (MILLONES DE USD)

TABLA 9 MERCADO MUNDIAL DE POLILLAS EN FEROMONAS AGRÍCOLAS, POR REGIÓN, 2022-2031 (MILLONES DE USD)

TABLA 10 MERCADO MUNDIAL DE ESCARABAJOS E INSECTOS EN FEROMONAS AGRÍCOLAS, POR REGIÓN, 2022-2031 (MILLONES DE USD)

TABLA 11 MERCADO GLOBAL DE GUSANO ARMY EN FEROMONAS AGRÍCOLAS, POR REGIÓN, 2022-2031 (MILLONES DE USD)

TABLA 12 MERCADO MUNDIAL DE MARIPOSAS EN FEROMONAS AGRÍCOLAS, POR REGIÓN, 2022-2031 (MILLONES DE USD)

TABLA 13 MERCADO GLOBAL DE OTROS EN FEROMONAS AGRÍCOLAS, POR REGIÓN, 2022-2031 (MILLONES DE USD)

TABLA 14 MERCADO MUNDIAL DE FEROMONAS AGRÍCOLAS, POR FUNCIÓN, 2022-2031 (MILLONES DE USD)

TABLA 15 INTERRUPCIÓN GLOBAL DEL APROXIMACIÓN EN EL MERCADO DE FEROMONAS AGRÍCOLAS, POR REGIÓN, 2022-2031 (MILLONES DE USD)

TABLA 16 MERCADO GLOBAL DE TRAMPAMIENTO MASIVO EN FEROMONAS AGRÍCOLAS, POR REGIÓN, 2022-2031 (MILLONES DE USD)

TABLA 17 DETECCIÓN Y MONITOREO GLOBAL EN EL MERCADO DE FEROMONAS AGRÍCOLAS, POR REGIÓN, 2022-2031 (MILLONES DE USD)

TABLA 18 MERCADO GLOBAL DE OTROS EN FEROMONAS AGRÍCOLAS, POR REGIÓN, 2022-2031 (MILLONES DE USD)

TABLA 19 MERCADO GLOBAL DE OTROS EN FEROMONAS AGRÍCOLAS, POR TIPO, 2022-2031 (MILLONES DE USD)

TABLA 20 MERCADO MUNDIAL DE FEROMONAS AGRÍCOLAS, POR MODO DE APLICACIÓN, 2022-2031 (MILLONES DE USD)

TABLA 21 MERCADO GLOBAL DE DISPENSADORES EN FEROMONAS AGRÍCOLAS, POR REGIÓN, 2022-2031 (MILLONES DE USD)

TABLA 22 TRAMPAS GLOBALES EN EL MERCADO DE FEROMONAS AGRÍCOLAS, POR REGIÓN, 2022-2031 (MILLONES DE USD)

TABLA 23 TRAMPAS GLOBALES EN EL MERCADO DE FEROMONAS AGRÍCOLAS, POR MODO DE APLICACIÓN, 2022-2031 (MILLONES DE USD)

TABLA 24 MERCADO GLOBAL DE AEROSOL EN FEROMONAS AGRÍCOLAS, POR REGIÓN, 2022-2031 (MILLONES DE USD)

TABLA 25 MERCADO GLOBAL DE OTROS EN FEROMONAS AGRÍCOLAS, POR REGIÓN, 2022-2031 (MILLONES DE USD)

CUADRO 26 MERCADO MUNDIAL DE FEROMONAS AGRÍCOLAS, POR TIPO DE CULTIVO, 2022-2031 (MILLONES DE USD)

CUADRO 27 MERCADO MUNDIAL DE FRUTAS EN FEROMONAS AGRÍCOLAS, POR REGIÓN, 2022-2031 (MILLONES DE USD)

CUADRO 28 MERCADO MUNDIAL DE FRUTAS EN FEROMONAS AGRÍCOLAS, POR TIPO DE CULTIVO, 2022-2031 (MILLONES DE USD)

CUADRO 29 MERCADO MUNDIAL DE VERDURAS EN FEROMONAS AGRÍCOLAS, POR REGIÓN, 2022-2031 (MILLONES DE USD)

CUADRO 30 MERCADO MUNDIAL DE HORTALIZAS EN FEROMONAS AGRÍCOLAS, POR TIPO DE CULTIVO, 2022-2031 (MILLONES DE USD)

TABLA 31 MERCADO MUNDIAL DE PLANTAS DE TÉ EN FEROMONAS AGRÍCOLAS, POR REGIÓN, 2022-2031 (MILLONES DE USD)

TABLA 32 MERCADO MUNDIAL DE CÉSPED Y ORNAMENTOS EN FEROMONAS AGRÍCOLAS, POR REGIÓN, 2022-2031 (MILLONES DE USD)

CUADRO 33 MERCADO MUNDIAL DE SEMILLAS Y LEGUMBRES OLEAGINOSAS EN FEROMONAS AGRÍCOLAS, POR REGIÓN, 2022-2031 (MILLONES DE USD)

CUADRO 34 MERCADO MUNDIAL DE SEMILLAS Y LEGUMBRES OLEAGINOSAS EN FEROMONAS AGRÍCOLAS, POR TIPO DE CULTIVO, 2022-2031 (MILLONES DE USD)

CUADRO 35 MERCADO MUNDIAL DE CEREALES Y GRANOS EN FEROMONAS AGRÍCOLAS, POR REGIÓN, 2022-2031 (MILLONES DE USD)

CUADRO 36 MERCADO MUNDIAL DE CEREALES Y GRANOS EN FEROMONAS AGRÍCOLAS, POR TIPO DE CULTIVO, 2022-2031 (MILLONES DE USD)

TABLA 37 MERCADO GLOBAL DE OTROS EN FEROMONAS AGRÍCOLAS, POR REGIÓN, 2022-2031 (MILLONES DE USD)

CUADRO 38 MERCADO MUNDIAL DE FEROMONAS AGRÍCOLAS, POR CANAL DE DISTRIBUCIÓN, 2022-2031 (MILLONES DE USD)

TABLA 39 MERCADO GLOBAL DIRECTO EN FEROMONAS AGRÍCOLAS, POR REGIÓN, 2022-2031 (MILLONES DE USD)

TABLA 40 MERCADO GLOBAL DE FEROMONAS INDIRECTAS AGRÍCOLAS, POR REGIÓN, 2022-2031 (MILLONES DE USD)

CUADRO 41 MERCADO MUNDIAL DE FEROMONAS AGRÍCOLAS, POR REGIÓN, 2022-2031 (MILLONES DE USD)

CUADRO 42 MERCADO DE FEROMONAS AGRÍCOLAS DE AMÉRICA DEL NORTE, POR PAÍS, 2022-2031 (MILLONES DE USD)

TABLA 43 MERCADO DE FEROMONAS AGRÍCOLAS DE AMÉRICA DEL NORTE, POR TIPO, 2022-2031 (MILLONES DE USD)

TABLA 44 FEROMONAS SEXUALES EN EL MERCADO DE FEROMONAS AGRÍCOLAS DE AMÉRICA DEL NORTE, POR TIPO, 2022-2031 (MILLONES DE USD)

CUADRO 45 MERCADO DE FEROMONAS AGRÍCOLAS DE AMÉRICA DEL NORTE, POR ESPECIE, 2022-2031 (MILLONES DE USD)

CUADRO 46 MERCADO DE FEROMONAS AGRÍCOLAS DE AMÉRICA DEL NORTE, POR FUNCIÓN, 2022-2031 (MILLONES DE USD)

CUADRO 47 OTROS MERCADO DE FEROMONAS AGRÍCOLAS DE AMÉRICA DEL NORTE, POR FUNCIÓN, 2022-2031 (MILLONES DE USD)

CUADRO 48 MERCADO DE FEROMONAS AGRÍCOLAS DE AMÉRICA DEL NORTE, POR MODO DE APLICACIÓN, 2022-2031 (MILLONES DE USD)

TABLA 49 TRAMPAS EN EL MERCADO DE FEROMONAS AGRÍCOLAS DE AMÉRICA DEL NORTE, POR TIPO, 2022-2031 (MILLONES DE USD)

CUADRO 50 MERCADO DE FEROMONAS AGRÍCOLAS DE AMÉRICA DEL NORTE, POR TIPO DE CULTIVO, 2022-2031 (MILLONES DE USD)

CUADRO 51 FRUTAS DE AMÉRICA DEL NORTE EN EL MERCADO DE FEROMONAS AGRÍCOLAS, POR CATEGORÍA, 2022-2031 (MILLONES DE USD)

CUADRO 52 VEGETALES DE AMÉRICA DEL NORTE EN EL MERCADO DE FEROMONAS AGRÍCOLAS, POR CATEGORÍA, 2022-2031 (MILLONES DE USD)

CUADRO 53 MERCADO DE FEROMONAS AGRÍCOLAS DE SEMILLAS Y LEGUMBRES OLEAGINOSAS DE AMÉRICA DEL NORTE, POR CATEGORÍA, 2022-2031 (MILLONES DE USD)

CUADRO 54 CEREALES DE AMÉRICA DEL NORTE Y AUMENTOS DEL MERCADO DE FEROMONAS AGRÍCOLAS, POR CATEGORÍA, 2022-2031 (MILLONES DE USD)

CUADRO 55 MERCADO DE FEROMONAS AGRÍCOLAS DE AMÉRICA DEL NORTE, POR CANAL DE DISTRIBUCIÓN, 2022-2031 (MILLONES DE USD)

TABLA 56 MERCADO DE FEROMONAS AGRÍCOLAS DE EE. UU., POR TIPO, 2022-2031 (MILLONES DE USD)

TABLA 57 FEROMONAS SEXUALES DE EE. UU. EN EL MERCADO DE FEROMONAS AGRÍCOLAS, POR TIPO, 2022-2031 (MILLONES DE USD)

TABLA 58 MERCADO DE FEROMONAS AGRÍCOLAS DE EE. UU., POR ESPECIE, 2022-2031 (MILLONES DE USD)

TABLA 59 MERCADO DE FEROMONAS AGRÍCOLAS DE EE. UU., POR FUNCIÓN, 2022-2031 (MILLONES DE USD)

TABLA 60 OTROS EN EL MERCADO DE FEROMONAS AGRÍCOLAS DE EE. UU., POR FUNCIÓN, 2022-2031 (MILLONES DE USD)

TABLA 61 MERCADO DE FEROMONAS AGRÍCOLAS DE EE. UU., POR MODO DE APLICACIÓN, 2022-2031 (MILLONES DE USD)

TABLA 62 TRAMPAS DE EE. UU. EN EL MERCADO DE FEROMONAS AGRÍCOLAS, POR TIPO, 2022-2031 (MILLONES DE USD)

TABLA 63 MERCADO DE FEROMONAS AGRÍCOLAS DE EE. UU., POR TIPO DE CULTIVO, 2022-2031 (MILLONES DE USD)

CUADRO 64 FRUTAS ESTADOUNIDENSES EN EL MERCADO DE FEROMONAS AGRÍCOLAS, POR CATEGORÍA, 2022-2031 (MILLONES DE USD)

CUADRO 65 VEGETALES ESTADOUNIDENSES EN EL MERCADO DE FEROMONAS AGRÍCOLAS, POR CATEGORÍA, 2022-2031 (MILLONES DE USD)

CUADRO 66 MERCADO DE FEROMONAS AGRÍCOLAS DE SEMILLAS Y LEGUMBRES OLEAGINOSAS DE EE. UU., POR CATEGORÍA, 2022-2031 (MILLONES DE USD)

CUADRO 67 CEREALES ESTADOUNIDENSES Y AUMENTOS EN EL MERCADO DE FEROMONAS AGRÍCOLAS, POR CATEGORÍA, 2022-2031 (MILLONES DE USD)

TABLA 68 MERCADO DE FEROMONAS AGRÍCOLAS DE EE. UU., POR CANAL DE DISTRIBUCIÓN, 2022-2031 (MILLONES DE USD)

CUADRO 69 MERCADO DE FEROMONAS AGRÍCOLAS DE CANADÁ, POR TIPO, 2022-2031 (MILLONES DE USD)

TABLA 70 FEROMONAS SEXUALES DE CANADÁ EN EL MERCADO DE FEROMONAS AGRÍCOLAS, POR TIPO, 2022-2031 (MILLONES DE USD)

CUADRO 71 MERCADO DE FEROMONAS AGRÍCOLAS DE CANADÁ, POR ESPECIE, 2022-2031 (MILLONES DE USD)

CUADRO 72 MERCADO DE FEROMONAS AGRÍCOLAS DE CANADÁ, POR FUNCIÓN, 2022-2031 (MILLONES DE USD)

CUADRO 73 CANADÁ OTROS EN EL MERCADO DE FEROMONAS AGRÍCOLAS, POR FUNCIÓN, 2022-2031 (MILLONES DE USD)

CUADRO 74 MERCADO DE FEROMONAS AGRÍCOLAS DE CANADÁ, POR MODO DE APLICACIÓN, 2022-2031 (MILLONES DE USD)

TABLA 75 TRAMPAS DE CANADÁ EN EL MERCADO DE FEROMONAS AGRÍCOLAS, POR TIPO, 2022-2031 (MILLONES DE USD)

CUADRO 76 MERCADO DE FEROMONAS AGRÍCOLAS DE CANADÁ, POR TIPO DE CULTIVO, 2022-2031 (MILLONES DE USD)

CUADRO 77 FRUTAS DE CANADÁ EN EL MERCADO DE FEROMONAS AGRÍCOLAS, POR CATEGORÍA, 2022-2031 (MILLONES DE USD)

CUADRO 78 VEGETALES DE CANADÁ EN EL MERCADO DE FEROMONAS AGRÍCOLAS, POR CATEGORÍA, 2022-2031 (MILLONES DE USD)

CUADRO 79 SEMILLAS Y LEGUMBRES OLEAGINOSAS EN EL MERCADO DE FEROMONAS AGRÍCOLAS DE CANADÁ, POR CATEGORÍA, 2022-2031 (MILLONES DE USD)

CUADRO 80 CEREALES DE CANADÁ Y AUMENTOS EN EL MERCADO DE FEROMONAS AGRÍCOLAS, POR CATEGORÍA, 2022-2031 (MILLONES DE USD)

CUADRO 81 MERCADO DE FEROMONAS AGRÍCOLAS DE CANADÁ, POR CANAL DE DISTRIBUCIÓN, 2022-2031 (MILLONES DE USD)

CUADRO 82 MERCADO DE FEROMONAS AGRÍCOLAS EN MÉXICO, POR TIPO, 2022-2031 (MILLONES DE USD)

CUADRO 83 FEROMONAS SEXUALES EN EL MERCADO DE FEROMONAS AGRÍCOLAS DE MÉXICO, POR TIPO, 2022-2031 (MILLONES DE USD)

CUADRO 84 MERCADO DE FEROMONAS AGRÍCOLAS EN MÉXICO, POR ESPECIE, 2022-2031 (MILLONES DE USD)

CUADRO 85 MERCADO DE FEROMONAS AGRÍCOLAS EN MÉXICO, POR FUNCIÓN, 2022-2031 (MILLONES DE USD)

CUADRO 86 OTROS EN EL MERCADO DE FEROMONAS AGRÍCOLAS DE MÉXICO, POR FUNCIÓN, 2022-2031 (MILLONES DE USD)

CUADRO 87 MERCADO DE FEROMONAS AGRÍCOLAS EN MÉXICO, POR MODO DE APLICACIÓN, 2022-2031 (MILLONES DE USD)

CUADRO 88 TRAMPAS EN EL MERCADO DE FEROMONAS AGRÍCOLAS DE MÉXICO, POR TIPO, 2022-2031 (MILLONES DE USD)

CUADRO 89 MERCADO DE FEROMONAS AGRÍCOLAS EN MÉXICO, POR TIPO DE CULTIVO, 2022-2031 (MILLONES DE USD)

CUADRO 90 FRUTAS DE MÉXICO EN EL MERCADO DE FEROMONAS AGRÍCOLAS, POR CATEGORÍA, 2022-2031 (MILLONES DE USD)

CUADRO 91 VEGETALES EN EL MERCADO DE FEROMONAS AGRÍCOLAS DE MÉXICO, POR CATEGORÍA, 2022-2031 (MILLONES DE USD)

CUADRO 92 MERCADO DE SEMILLAS Y LEGUMBRES OLEAGINOSAS EN MÉXICO FEROMONAS AGRÍCOLAS, POR CATEGORÍA, 2022-2031 (MILLONES DE USD)

CUADRO 93 CEREALES DE MÉXICO Y AUMENTO DEL MERCADO DE FEROMONAS AGRÍCOLAS, POR CATEGORÍA, 2022-2031 (MILLONES DE USD)

CUADRO 94 MERCADO DE FEROMONAS AGRÍCOLAS EN MÉXICO, POR CANAL DE DISTRIBUCIÓN, 2022-2031 (MILLONES DE USD)

CUADRO 95 MERCADO DE FEROMONAS AGRÍCOLAS EN EUROPA, POR PAÍS, 2022-2031 (MILLONES DE USD)

TABLA 96 MERCADO DE FEROMONAS AGRÍCOLAS EN EUROPA, POR TIPO, 2022-2031 (MILLONES DE USD)

TABLA 97 FEROMONAS SEXUALES EN EL MERCADO DE FEROMONAS AGRÍCOLAS EN EUROPA, POR TIPO, 2022-2031 (MILLONES DE USD)

CUADRO 98 MERCADO EUROPEO DE FEROMONAS AGRÍCOLAS, POR ESPECIE, 2022-2031 (MILLONES DE USD)

CUADRO 99 MERCADO EUROPEO DE FEROMONAS AGRÍCOLAS, POR FUNCIÓN, 2022-2031 (MILLONES DE USD)

TABLA 100 EUROPA OTROS EN EL MERCADO DE FEROMONAS AGRÍCOLAS, POR FUNCIÓN, 2022-2031 (MILLONES DE USD)

CUADRO 101 MERCADO EUROPEO DE FEROMONAS AGRÍCOLAS, POR MODO DE APLICACIÓN, 2022-2031 (MILLONES DE USD)

TABLA 102 TRAMPAS EUROPEAS EN EL MERCADO DE FEROMONAS AGRÍCOLAS, POR TIPO, 2022-2031 (MILLONES DE USD)

CUADRO 103 MERCADO DE FEROMONAS AGRÍCOLAS EN EUROPA, POR TIPO DE CULTIVO, 2022-2031 (MILLONES DE USD)

CUADRO 104 MERCADO DE FRUTAS EN EUROPA DE FEROMONAS AGRÍCOLAS, POR CATEGORÍA, 2022-2031 (MILLONES DE USD)

CUADRO 105 VEGETALES EN EL MERCADO DE FEROMONAS AGRÍCOLAS DE EUROPA, POR CATEGORÍA, 2022-2031 (MILLONES DE USD)

CUADRO 106 MERCADO EUROPEO DE SEMILLAS Y LEGUMBRES OLEAGINOSAS EN FEROMONAS AGRÍCOLAS, POR CATEGORÍA, 2022-2031 (MILLONES DE USD)

CUADRO 107 CEREALES EN EUROPA Y AUMENTOS DEL MERCADO DE FEROMONAS AGRÍCOLAS, POR CATEGORÍA, 2022-2031 (MILLONES DE USD)

CUADRO 108 MERCADO DE FEROMONAS AGRÍCOLAS EN EUROPA, POR CANAL DE DISTRIBUCIÓN, 2022-2031 (MILLONES DE USD)

TABLA 109 MERCADO DE FEROMONAS AGRÍCOLAS EN FRANCIA, POR TIPO, 2022-2031 (MILLONES DE USD)

TABLA 110 FEROMONAS SEXUALES EN FRANCIA EN EL MERCADO DE FEROMONAS AGRÍCOLAS, POR TIPO, 2022-2031 (MILLONES DE USD)

CUADRO 111 MERCADO DE FEROMONAS AGRÍCOLAS DE FRANCIA, POR ESPECIE, 2022-2031 (MILLONES DE USD)

CUADRO 112 MERCADO DE FEROMONAS AGRÍCOLAS EN FRANCIA, POR FUNCIÓN, 2022-2031 (MILLONES DE USD)

CUADRO 113 FRANCIA OTROS EN EL MERCADO DE FEROMONAS AGRÍCOLAS, POR FUNCIÓN, 2022-2031 (MILLONES DE USD)

CUADRO 114 MERCADO DE FEROMONAS AGRÍCOLAS EN FRANCIA, POR MODO DE APLICACIÓN, 2022-2031 (MILLONES DE USD)

TABLA 115 TRAMPAS DE FRANCIA EN EL MERCADO DE FEROMONAS AGRÍCOLAS, POR TIPO, 2022-2031 (MILLONES DE USD)

CUADRO 116 MERCADO DE FEROMONAS AGRÍCOLAS EN FRANCIA, POR TIPO DE CULTIVO, 2022-2031 (MILLONES DE USD)

CUADRO 117 FRANCIA FRUTAS EN EL MERCADO DE FEROMONAS AGRÍCOLAS, POR CATEGORÍA, 2022-2031 (MILLONES DE USD)

CUADRO 118 VEGETALES EN FRANCIA EN EL MERCADO DE FEROMONAS AGRÍCOLAS, POR CATEGORÍA, 2022-2031 (MILLONES DE USD)

CUADRO 119 MERCADO DE FEROMONAS AGRÍCOLAS DE SEMILLAS Y LEGUMBRES OLEAGINOSAS EN FRANCIA, POR CATEGORÍA, 2022-2031 (MILLONES DE USD)

CUADRO 120 CEREALES DE FRANCIA Y AUMENTOS DEL MERCADO DE FEROMONAS AGRÍCOLAS, POR CATEGORÍA, 2022-2031 (MILLONES DE USD)

CUADRO 121 MERCADO DE FEROMONAS AGRÍCOLAS EN FRANCIA, POR CANAL DE DISTRIBUCIÓN, 2022-2031 (MILLONES DE USD)

CUADRO 122 MERCADO DE FEROMONAS AGRÍCOLAS DE ALEMANIA, POR TIPO, 2022-2031 (MILLONES DE USD)

TABLA 123 FEROMONAS SEXUALES EN ALEMANIA EN EL MERCADO DE FEROMONAS AGRÍCOLAS, POR TIPO, 2022-2031 (MILLONES DE USD)

CUADRO 124 MERCADO DE FEROMONAS AGRÍCOLAS DE ALEMANIA, POR ESPECIE, 2022-2031 (MILLONES DE USD)

CUADRO 125 MERCADO DE FEROMONAS AGRÍCOLAS DE ALEMANIA, POR FUNCIÓN, 2022-2031 (MILLONES DE USD)

CUADRO 126 ALEMANIA OTROS EN EL MERCADO DE FEROMONAS AGRÍCOLAS, POR FUNCIÓN, 2022-2031 (MILLONES DE USD)

CUADRO 127 MERCADO DE FEROMONAS AGRÍCOLAS DE ALEMANIA, POR MODO DE APLICACIÓN, 2022-2031 (MILLONES DE USD)

TABLA 128 TRAMPAS DE ALEMANIA EN EL MERCADO DE FEROMONAS AGRÍCOLAS, POR TIPO, 2022-2031 (MILLONES DE USD)

CUADRO 129 MERCADO DE FEROMONAS AGRÍCOLAS DE ALEMANIA, POR TIPO DE CULTIVO, 2022-2031 (MILLONES DE USD)

CUADRO 130 FRUTAS DE ALEMANIA EN EL MERCADO DE FEROMONAS AGRÍCOLAS, POR CATEGORÍA, 2022-2031 (MILLONES DE USD)

CUADRO 131 VERDURAS DE ALEMANIA EN EL MERCADO DE FEROMONAS AGRÍCOLAS, POR CATEGORÍA, 2022-2031 (MILLONES DE USD)

CUADRO 132 SEMILLAS Y LEGUMBRES OLEAGINOSAS EN EL MERCADO DE FEROMONAS AGRÍCOLAS DE ALEMANIA, POR CATEGORÍA, 2022-2031 (MILLONES DE USD)

CUADRO 133 CEREALES DE ALEMANIA Y AUMENTOS DEL MERCADO DE FEROMONAS AGRÍCOLAS, POR CATEGORÍA, 2022-2031 (MILLONES DE USD)

CUADRO 134 MERCADO DE FEROMONAS AGRÍCOLAS DE ALEMANIA, POR CANAL DE DISTRIBUCIÓN, 2022-2031 (MILLONES DE USD)

CUADRO 135 MERCADO DE FEROMONAS AGRÍCOLAS DE ITALIA, POR TIPO, 2022-2031 (MILLONES DE USD)

TABLA 136 FEROMONAS SEXUALES DE ITALIA EN EL MERCADO DE FEROMONAS AGRÍCOLAS, POR TIPO, 2022-2031 (MILLONES DE USD)

CUADRO 137 MERCADO DE FEROMONAS AGRÍCOLAS DE ITALIA, POR ESPECIE, 2022-2031 (MILLONES DE USD)

CUADRO 138 MERCADO DE FEROMONAS AGRÍCOLAS DE ITALIA, POR FUNCIÓN, 2022-2031 (MILLONES DE USD)

CUADRO 139 ITALIA OTROS EN EL MERCADO DE FEROMONAS AGRÍCOLAS, POR FUNCIÓN, 2022-2031 (MILLONES DE USD)

CUADRO 140 MERCADO DE FEROMONAS AGRÍCOLAS DE ITALIA, POR MODO DE APLICACIÓN, 2022-2031 (MILLONES DE USD)

TABLA 141 TRAMPAS DE ITALIA EN EL MERCADO DE FEROMONAS AGRÍCOLAS, POR TIPO, 2022-2031 (MILLONES DE USD)

CUADRO 142 MERCADO DE FEROMONAS AGRÍCOLAS DE ITALIA, POR TIPO DE CULTIVO, 2022-2031 (MILLONES DE USD)

CUADRO 143 FRUTAS DE ITALIA EN EL MERCADO DE FEROMONAS AGRÍCOLAS, POR CATEGORÍA, 2022-2031 (MILLONES DE USD)

CUADRO 144 HORTALIZAS DE ITALIA EN EL MERCADO DE FEROMONAS AGRÍCOLAS, POR CATEGORÍA, 2022-2031 (MILLONES DE USD)

CUADRO 145 SEMILLAS Y LEGUMBRES OLEAGINOSAS EN EL MERCADO DE FEROMONAS AGRÍCOLAS DE ITALIA, POR CATEGORÍA, 2022-2031 (MILLONES DE USD)

CUADRO 146 CEREALES DE ITALIA Y AUMENTOS DEL MERCADO DE FEROMONAS AGRÍCOLAS, POR CATEGORÍA, 2022-2031 (MILLONES DE USD)

CUADRO 147 MERCADO DE FEROMONAS AGRÍCOLAS DE ITALIA, POR CANAL DE DISTRIBUCIÓN, 2022-2031 (MILLONES DE USD)

CUADRO 148 MERCADO DE FEROMONAS AGRÍCOLAS EN ESPAÑA, POR TIPO, 2022-2031 (MILLONES DE USD)

TABLA 149 FEROMONAS SEXUALES EN EL MERCADO DE FEROMONAS AGRÍCOLAS DE ESPAÑA, POR TIPO, 2022-2031 (MILLONES DE USD)

CUADRO 150 MERCADO DE FEROMONAS AGRÍCOLAS EN ESPAÑA, POR ESPECIES, 2022-2031 (MILLONES DE USD)

CUADRO 151 MERCADO DE FEROMONAS AGRÍCOLAS EN ESPAÑA, POR FUNCIÓN, 2022-2031 (MILLONES DE USD)

TABLA 152 ESPAÑA OTROS EN EL MERCADO DE FEROMONAS AGRÍCOLAS, POR FUNCIÓN, 2022-2031 (MILLONES DE USD)

CUADRO 153 MERCADO DE FEROMONAS AGRÍCOLAS EN ESPAÑA, POR MODO DE APLICACIÓN, 2022-2031 (MILLONES DE USD)

TABLA 154 TRAMPAS DE ESPAÑA EN EL MERCADO DE FEROMONAS AGRÍCOLAS, POR TIPO, 2022-2031 (MILLONES DE USD)

CUADRO 155 MERCADO DE FEROMONAS AGRÍCOLAS EN ESPAÑA, POR TIPO DE CULTIVO, 2022-2031 (MILLONES DE USD)

CUADRO 156 ESPAÑA FRUTAS EN EL MERCADO DE FEROMONAS AGRÍCOLAS, POR CATEGORÍA, 2022-2031 (MILLONES DE USD)

CUADRO 157 HORTALIZAS DE ESPAÑA EN EL MERCADO DE FEROMONAS AGRÍCOLAS, POR CATEGORÍA, 2022-2031 (MILLONES DE USD)

CUADRO 158 ESPAÑA: SEMILLAS Y LEGUMBRES OLEAGINOSAS EN EL MERCADO DE FEROMONAS AGRÍCOLAS, POR CATEGORÍA, 2022-2031 (MILLONES DE USD)

CUADRO 159 ESPAÑA CEREALES Y AUMENTOS DEL MERCADO DE FEROMONAS AGRÍCOLAS, POR CATEGORÍA, 2022-2031 (MILLONES DE USD)

CUADRO 160 MERCADO DE FEROMONAS AGRÍCOLAS EN ESPAÑA, POR CANAL DE DISTRIBUCIÓN, 2022-2031 (MILLONES DE USD)

TABLA 161 MERCADO DE FEROMONAS AGRÍCOLAS DE RUSIA, POR TIPO, 2022-2031 (MILLONES DE USD)

TABLA 162 FEROMONAS SEXUALES DE RUSIA EN EL MERCADO DE FEROMONAS AGRÍCOLAS, POR TIPO, 2022-2031 (MILLONES DE USD)

CUADRO 163 MERCADO DE FEROMONAS AGRÍCOLAS DE RUSIA, POR ESPECIE, 2022-2031 (MILLONES DE USD)

CUADRO 164 MERCADO DE FEROMONAS AGRÍCOLAS DE RUSIA, POR FUNCIÓN, 2022-2031 (MILLONES DE USD)

CUADRO 165 RUSIA OTROS EN EL MERCADO DE FEROMONAS AGRÍCOLAS, POR FUNCIÓN, 2022-2031 (MILLONES DE USD)

CUADRO 166 MERCADO DE FEROMONAS AGRÍCOLAS DE RUSIA, POR MODO DE APLICACIÓN, 2022-2031 (MILLONES DE USD)

TABLA 167 TRAMPAS DE RUSIA EN EL MERCADO DE FEROMONAS AGRÍCOLAS, POR TIPO, 2022-2031 (MILLONES DE USD)

CUADRO 168 MERCADO DE FEROMONAS AGRÍCOLAS DE RUSIA, POR TIPO DE CULTIVO, 2022-2031 (MILLONES DE USD)

CUADRO 169 FRUTAS DE RUSIA EN EL MERCADO DE FEROMONAS AGRÍCOLAS, POR CATEGORÍA, 2022-2031 (MILLONES DE USD)

CUADRO 170 VEGETALES DE RUSIA EN EL MERCADO DE FEROMONAS AGRÍCOLAS, POR CATEGORÍA, 2022-2031 (MILLONES DE USD)

CUADRO 171 SEMILLAS Y LEGUMBRES OLEAGINOSAS EN RUSIA EN EL MERCADO DE FEROMONAS AGRÍCOLAS, POR CATEGORÍA, 2022-2031 (MILLONES DE USD)

CUADRO 172 CEREALES DE RUSIA Y AUMENTOS DEL MERCADO DE FEROMONAS AGRÍCOLAS, POR CATEGORÍA, 2022-2031 (MILLONES DE USD)

CUADRO 173 MERCADO DE FEROMONAS AGRÍCOLAS DE RUSIA, POR CANAL DE DISTRIBUCIÓN, 2022-2031 (MILLONES DE USD)

TABLA 174 MERCADO DE FEROMONAS AGRÍCOLAS DEL REINO UNIDO, POR TIPO, 2022-2031 (MILLONES DE USD)

TABLA 175 FEROMONAS SEXUALES DEL REINO UNIDO EN EL MERCADO DE FEROMONAS AGRÍCOLAS, POR TIPO, 2022-2031 (MILLONES DE USD)

CUADRO 176 MERCADO DE FEROMONAS AGRÍCOLAS DEL REINO UNIDO, POR ESPECIE, 2022-2031 (MILLONES DE USD)

CUADRO 177 MERCADO DE FEROMONAS AGRÍCOLAS DEL REINO UNIDO, POR FUNCIÓN, 2022-2031 (MILLONES DE USD)

TABLA 178 OTROS REINO UNIDOS EN EL MERCADO DE FEROMONAS AGRÍCOLAS, POR FUNCIÓN, 2022-2031 (MILLONES DE USD)

CUADRO 179 MERCADO DE FEROMONAS AGRÍCOLAS DEL REINO UNIDO, POR MODO DE APLICACIÓN, 2022-2031 (MILLONES DE USD)

TABLA 180 TRAMPAS DEL REINO UNIDO EN EL MERCADO DE FEROMONAS AGRÍCOLAS, POR TIPO, 2022-2031 (MILLONES DE USD)

CUADRO 181 MERCADO DE FEROMONAS AGRÍCOLAS DEL REINO UNIDO, POR TIPO DE CULTIVO, 2022-2031 (MILLONES DE USD)

CUADRO 182 FRUTAS DEL REINO UNIDO EN EL MERCADO DE FEROMONAS AGRÍCOLAS, POR CATEGORÍA, 2022-2031 (MILLONES DE USD)

CUADRO 183 VEGETALES DEL REINO UNIDO EN EL MERCADO DE FEROMONAS AGRÍCOLAS, POR CATEGORÍA, 2022-2031 (MILLONES DE USD)

CUADRO 184 SEMILLAS Y LEGUMBRES OLEAGINOSAS EN EL MERCADO DE FEROMONAS AGRÍCOLAS DEL REINO UNIDO, POR CATEGORÍA, 2022-2031 (MILLONES DE USD)

CUADRO 185 CEREALES DEL REINO UNIDO Y AUMENTOS EN EL MERCADO DE FEROMONAS AGRÍCOLAS, POR CATEGORÍA, 2022-2031 (MILLONES DE USD)

CUADRO 186 MERCADO DE FEROMONAS AGRÍCOLAS DEL REINO UNIDO, POR CANAL DE DISTRIBUCIÓN, 2022-2031 (MILLONES DE USD)

CUADRO 187 MERCADO DE FEROMONAS AGRÍCOLAS DE TURQUÍA, POR TIPO, 2022-2031 (MILLONES DE USD)

TABLA 188 FEROMONAS SEXUALES DE TURQUÍA EN EL MERCADO DE FEROMONAS AGRÍCOLAS, POR TIPO, 2022-2031 (MILLONES DE USD)

CUADRO 189 MERCADO DE FEROMONAS AGRÍCOLAS DE TURQUÍA, POR ESPECIE, 2022-2031 (MILLONES DE USD)

CUADRO 190 MERCADO DE FEROMONAS AGRÍCOLAS DE TURQUÍA, POR FUNCIÓN, 2022-2031 (MILLONES DE USD)

CUADRO 191 TURQUÍA OTROS EN EL MERCADO DE FEROMONAS AGRÍCOLAS, POR FUNCIÓN, 2022-2031 (MILLONES DE USD)

CUADRO 192 MERCADO DE FEROMONAS AGRÍCOLAS DE TURQUÍA, POR MODO DE APLICACIÓN, 2022-2031 (MILLONES DE USD)

TABLA 193 TRAMPAS PARA PAVO EN EL MERCADO DE FEROMONAS AGRÍCOLAS, POR TIPO, 2022-2031 (MILLONES DE USD)

CUADRO 194 MERCADO DE FEROMONAS AGRÍCOLAS DE TURQUÍA, POR TIPO DE CULTIVO, 2022-2031 (MILLONES DE USD)

CUADRO 195 FRUTAS DE TURQUÍA EN EL MERCADO DE FEROMONAS AGRÍCOLAS, POR CATEGORÍA, 2022-2031 (MILLONES DE USD)

CUADRO 196 HORTALIZAS DE PAVO EN EL MERCADO DE FEROMONAS AGRÍCOLAS, POR CATEGORÍA, 2022-2031 (MILLONES DE USD)

CUADRO 197 SEMILLAS Y LEGUMBRES OLEAGINOSAS DE TURQUÍA EN EL MERCADO DE FEROMONAS AGRÍCOLAS, POR CATEGORÍA, 2022-2031 (MILLONES DE USD)

CUADRO 198 CEREALES DE TURQUÍA Y AUMENTOS EN EL MERCADO DE FEROMONAS AGRÍCOLAS, POR CATEGORÍA, 2022-2031 (MILLONES DE USD)

CUADRO 199 MERCADO DE FEROMONAS AGRÍCOLAS DE TURQUÍA, POR CANAL DE DISTRIBUCIÓN, 2022-2031 (MILLONES DE USD)

CUADRO 200 MERCADO DE FEROMONAS AGRÍCOLAS DE LOS PAÍSES BAJOS, POR TIPO, 2022-2031 (MILLONES DE USD)

TABLA 201 FEROMONAS SEXUALES DE LOS PAÍSES BAJOS EN EL MERCADO DE FEROMONAS AGRÍCOLAS, POR TIPO, 2022-2031 (MILLONES DE USD)

CUADRO 202 MERCADO DE FEROMONAS AGRÍCOLAS DE LOS PAÍSES BAJOS, POR ESPECIE, 2022-2031 (MILLONES DE USD)

CUADRO 203 MERCADO DE FEROMONAS AGRÍCOLAS DE LOS PAÍSES BAJOS, POR FUNCIÓN, 2022-2031 (MILLONES DE USD)

CUADRO 204 OTROS PAÍSES BAJOS EN EL MERCADO DE FEROMONAS AGRÍCOLAS, POR FUNCIÓN, 2022-2031 (MILLONES DE USD)

CUADRO 205 MERCADO DE FEROMONAS AGRÍCOLAS DE LOS PAÍSES BAJOS, POR MODO DE APLICACIÓN, 2022-2031 (MILLONES DE USD)

TABLA 206 TRAMPAS HOLANDESAS EN EL MERCADO DE FEROMONAS AGRÍCOLAS, POR TIPO, 2022-2031 (MILLONES DE USD)

CUADRO 207 MERCADO DE FEROMONAS AGRÍCOLAS DE LOS PAÍSES BAJOS, POR TIPO DE CULTIVO, 2022-2031 (MILLONES DE USD)

CUADRO 208 FRUTAS HOLANDESAS EN EL MERCADO DE FEROMONAS AGRÍCOLAS, POR CATEGORÍA, 2022-2031 (MILLONES DE USD)

CUADRO 209 VERDURAS HOLANDESAS EN EL MERCADO DE FEROMONAS AGRÍCOLAS, POR CATEGORÍA, 2022-2031 (MILLONES DE USD)

CUADRO 210 SEMILLAS Y LEGUMBRES OLEAGINOSAS DE LOS PAÍSES BAJOS EN EL MERCADO DE FEROMONAS AGRÍCOLAS, POR CATEGORÍA, 2022-2031 (MILLONES DE USD)

CUADRO 211 CEREALES DE LOS PAÍSES BAJOS Y AUMENTOS DEL MERCADO DE FEROMONAS AGRÍCOLAS, POR CATEGORÍA, 2022-2031 (MILLONES DE USD)

CUADRO 212 MERCADO DE FEROMONAS AGRÍCOLAS DE LOS PAÍSES BAJOS, POR CANAL DE DISTRIBUCIÓN, 2022-2031 (MILLONES DE USD)

CUADRO 213 MERCADO DE FEROMONAS AGRÍCOLAS DE BÉLGICA, POR TIPO, 2022-2031 (MILLONES DE USD)

TABLA 214 FEROMONAS SEXUALES DE BÉLGICA EN EL MERCADO DE FEROMONAS AGRÍCOLAS, POR TIPO, 2022-2031 (MILLONES DE USD)

CUADRO 215 MERCADO DE FEROMONAS AGRÍCOLAS DE BÉLGICA, POR ESPECIE, 2022-2031 (MILLONES DE USD)

CUADRO 216 MERCADO DE FEROMONAS AGRÍCOLAS DE BÉLGICA, POR FUNCIÓN, 2022-2031 (MILLONES DE USD)

CUADRO 217 OTROS BÉLGICA EN EL MERCADO DE FEROMONAS AGRÍCOLAS, POR FUNCIÓN, 2022-2031 (MILLONES DE USD)

CUADRO 218 MERCADO DE FEROMONAS AGRÍCOLAS DE BÉLGICA, POR MODO DE APLICACIÓN, 2022-2031 (MILLONES DE USD)

TABLA 219 TRAMPAS DE BÉLGICA EN EL MERCADO DE FEROMONAS AGRÍCOLAS, POR TIPO, 2022-2031 (MILLONES DE USD)

CUADRO 220 MERCADO DE FEROMONAS AGRÍCOLAS DE BÉLGICA, POR TIPO DE CULTIVO, 2022-2031 (MILLONES DE USD)

CUADRO 221 FRUTAS DE BÉLGICA EN EL MERCADO DE FEROMONAS AGRÍCOLAS, POR CATEGORÍA, 2022-2031 (MILLONES DE USD)

CUADRO 222 VEGETALES DE BÉLGICA EN EL MERCADO DE FEROMONAS AGRÍCOLAS, POR CATEGORÍA, 2022-2031 (MILLONES DE USD)

CUADRO 223 SEMILLAS Y LEGUMBRES OLEAGINOSAS EN EL MERCADO DE FEROMONAS AGRÍCOLAS, POR CATEGORÍA, 2022-2031 (MILLONES DE USD)

CUADRO 224 CEREALES DE BÉLGICA Y AUMENTOS DEL MERCADO DE FEROMONAS AGRÍCOLAS, POR CATEGORÍA, 2022-2031 (MILLONES DE USD)

CUADRO 225 MERCADO DE FEROMONAS AGRÍCOLAS DE BÉLGICA, POR CANAL DE DISTRIBUCIÓN, 2022-2031 (MILLONES DE USD)

CUADRO 226 MERCADO DE FEROMONAS AGRÍCOLAS DE SUIZA, POR TIPO, 2022-2031 (MILLONES DE USD)

TABLA 227 FEROMONAS SEXUALES EN EL MERCADO DE FEROMONAS AGRÍCOLAS DE SUIZA, POR TIPO, 2022-2031 (MILLONES DE USD)

CUADRO 228 MERCADO DE FEROMONAS AGRÍCOLAS DE SUIZA, POR ESPECIE, 2022-2031 (MILLONES DE USD)

CUADRO 229 MERCADO DE FEROMONAS AGRÍCOLAS DE SUIZA, POR FUNCIÓN, 2022-2031 (MILLONES DE USD)

CUADRO 230 SUIZA OTROS EN EL MERCADO DE FEROMONAS AGRÍCOLAS, POR FUNCIÓN, 2022-2031 (MILLONES DE USD)

CUADRO 231 MERCADO DE FEROMONAS AGRÍCOLAS DE SUIZA, POR MODO DE APLICACIÓN, 2022-2031 (MILLONES DE USD)

TABLA 232 TRAMPAS DE SUIZA EN EL MERCADO DE FEROMONAS AGRÍCOLAS, POR TIPO, 2022-2031 (MILLONES DE USD)

CUADRO 233 MERCADO DE FEROMONAS AGRÍCOLAS DE SUIZA, POR TIPO DE CULTIVO, 2022-2031 (MILLONES DE USD)

CUADRO 234 FRUTAS SUIZAS EN EL MERCADO DE FEROMONAS AGRÍCOLAS, POR CATEGORÍA, 2022-2031 (MILLONES DE USD)

CUADRO 235 VEGETALES DE SUIZA EN EL MERCADO DE FEROMONAS AGRÍCOLAS, POR CATEGORÍA, 2022-2031 (MILLONES DE USD)

CUADRO 236 SEMILLAS Y LEGUMBRES OLEAGINOSAS EN EL MERCADO DE FEROMONAS AGRÍCOLAS DE SUIZA, POR CATEGORÍA, 2022-2031 (MILLONES DE USD)

CUADRO 237 SUIZA CEREALES Y AUMENTOS DEL MERCADO DE FEROMONAS AGRÍCOLAS, POR CATEGORÍA, 2022-2031 (MILLONES DE USD)

CUADRO 238 MERCADO DE FEROMONAS AGRÍCOLAS DE SUIZA, POR CANAL DE DISTRIBUCIÓN, 2022-2031 (MILLONES DE USD)

TABLA 239 MERCADO DE FEROMONAS AGRÍCOLAS DEL RESTO DE EUROPA, POR TIPO, 2022-2031 (MILLONES DE USD)

CUADRO 240 MERCADO DE FEROMONAS AGRÍCOLAS DE ASIA Y EL PACÍFICO, POR PAÍS, 2022-2031 (MILES DE USD)

CUADRO 241 MERCADO DE FEROMONAS AGRÍCOLAS DE ASIA Y EL PACÍFICO, POR TIPO, 2022-2031 (MILLONES DE USD)

TABLA 242 FEROMONAS SEXUALES EN EL MERCADO DE FEROMONAS AGRÍCOLAS DE ASIA Y EL PACÍFICO, POR TIPO, 2022-2031 (MILLONES DE USD)

CUADRO 243 MERCADO DE FEROMONAS AGRÍCOLAS DE ASIA Y EL PACÍFICO, POR ESPECIE, 2022-2031 (MILLONES DE USD)

CUADRO 244 MERCADO DE FEROMONAS AGRÍCOLAS DE ASIA Y EL PACÍFICO, POR FUNCIÓN, 2022-2031 (MILLONES DE USD)

CUADRO 245 ASIA Y EL PACÍFICO OTROS EN EL MERCADO DE FEROMONAS AGRÍCOLAS, POR FUNCIÓN, 2022-2031 (MILLONES DE USD)

CUADRO 246 MERCADO DE FEROMONAS AGRÍCOLAS DE ASIA Y EL PACÍFICO, POR MODO DE APLICACIÓN, 2022-2031 (MILLONES DE USD)

TABLA 247 TRAMPAS DE ASIA Y EL PACÍFICO EN EL MERCADO DE FEROMONAS AGRÍCOLAS, POR TIPO, 2022-2031 (MILLONES DE USD)

CUADRO 248 MERCADO DE FEROMONAS AGRÍCOLAS DE ASIA Y EL PACÍFICO, POR TIPO DE CULTIVO, 2022-2031 (MILLONES DE USD)

CUADRO 249 FRUTAS DE ASIA Y EL PACÍFICO EN EL MERCADO DE FEROMONAS AGRÍCOLAS, POR CATEGORÍA, 2022-2031 (MILLONES DE USD)

CUADRO 250 VERDURAS DE ASIA Y EL PACÍFICO EN EL MERCADO DE FEROMONAS AGRÍCOLAS, POR CATEGORÍA, 2022-2031 (MILLONES DE USD)

CUADRO 251 MERCADO DE SEMILLAS Y LEGUMBRES OLEAGINOSAS DE ASIA Y EL PACÍFICO EN EL MERCADO DE FEROMONAS AGRÍCOLAS, POR CATEGORÍA, 2022-2031 (MILLONES DE USD)

CUADRO 252 CEREALES DE ASIA Y PACÍFICO Y AUMENTOS EN EL MERCADO DE FEROMONAS AGRÍCOLAS, POR CATEGORÍA, 2022-2031 (MILLONES DE USD)

CUADRO 253 MERCADO DE FEROMONAS AGRÍCOLAS DE ASIA Y EL PACÍFICO, POR CANAL DE DISTRIBUCIÓN, 2022-2031 (MILLONES DE USD)

CUADRO 254 MERCADO DE FEROMONAS AGRÍCOLAS DE CHINA, POR TIPO, 2022-2031 (MILLONES DE USD)

TABLA 255 FEROMONAS SEXUALES DE CHINA EN EL MERCADO DE FEROMONAS AGRÍCOLAS, POR TIPO, 2022-2031 (MILLONES DE USD)

CUADRO 256 MERCADO DE FEROMONAS AGRÍCOLAS DE CHINA, POR ESPECIE, 2022-2031 (MILLONES DE USD)

CUADRO 257 MERCADO DE FEROMONAS AGRÍCOLAS DE CHINA, POR FUNCIÓN, 2022-2031 (MILLONES DE USD)

CUADRO 258 CHINA OTROS EN EL MERCADO DE FEROMONAS AGRÍCOLAS, POR FUNCIÓN, 2022-2031 (MILLONES DE USD)

CUADRO 259 MERCADO DE FEROMONAS AGRÍCOLAS DE CHINA, POR MODO DE APLICACIÓN, 2022-2031 (MILLONES DE USD)

TABLA 260 TRAMPAS DE CHINA EN EL MERCADO DE FEROMONAS AGRÍCOLAS, POR TIPO, 2022-2031 (MILLONES DE USD)

CUADRO 261 MERCADO DE FEROMONAS AGRÍCOLAS DE CHINA, POR TIPO DE CULTIVO, 2022-2031 (MILLONES DE USD)

CUADRO 262 FRUTAS DE CHINA EN EL MERCADO DE FEROMONAS AGRÍCOLAS, POR CATEGORÍA, 2022-2031 (MILLONES DE USD)

CUADRO 263 VEGETALES DE CHINA EN EL MERCADO DE FEROMONAS AGRÍCOLAS, POR CATEGORÍA, 2022-2031 (MILLONES DE USD)

CUADRO 264 SEMILLAS Y LEGUMBRES OLEAGINOSAS EN EL MERCADO DE FEROMONAS AGRÍCOLAS DE CHINA, POR CATEGORÍA, 2022-2031 (MILLONES DE USD)

CUADRO 265 CEREALES DE CHINA Y AUMENTOS DEL MERCADO DE FEROMONAS AGRÍCOLAS, POR CATEGORÍA, 2022-2031 (MILLONES DE USD)

CUADRO 266 MERCADO DE FEROMONAS AGRÍCOLAS DE CHINA, POR CANAL DE DISTRIBUCIÓN, 2022-2031 (MILLONES DE USD)

CUADRO 267 MERCADO DE FEROMONAS AGRÍCOLAS DE JAPÓN, POR TIPO, 2022-2031 (MILLONES DE USD)

TABLA 268 FEROMONAS SEXUALES EN JAPÓN EN EL MERCADO DE FEROMONAS AGRÍCOLAS, POR TIPO, 2022-2031 (MILLONES DE USD)

CUADRO 269 MERCADO DE FEROMONAS AGRÍCOLAS DE JAPÓN, POR ESPECIE, 2022-2031 (MILLONES DE USD)

CUADRO 270 MERCADO DE FEROMONAS AGRÍCOLAS DE JAPÓN, POR FUNCIÓN, 2022-2031 (MILLONES DE USD)

CUADRO 271 OTROS EN EL MERCADO DE FEROMONAS AGRÍCOLAS DE JAPÓN, POR FUNCIÓN, 2022-2031 (MILLONES DE USD)

CUADRO 272 MERCADO DE FEROMONAS AGRÍCOLAS DE JAPÓN, POR MODO DE APLICACIÓN, 2022-2031 (MILLONES DE USD)

TABLA 273 TRAMPAS JAPONESES EN EL MERCADO DE FEROMONAS AGRÍCOLAS, POR TIPO, 2022-2031 (MILLONES DE USD)

CUADRO 274 MERCADO DE FEROMONAS AGRÍCOLAS DE JAPÓN, POR TIPO DE CULTIVO, 2022-2031 (MILLONES DE USD)

CUADRO 275 FRUTAS DEL JAPÓN EN EL MERCADO DE FEROMONAS AGRÍCOLAS, POR CATEGORÍA, 2022-2031 (MILLONES DE USD)

CUADRO 276 VEGETALES JAPONESES EN EL MERCADO DE FEROMONAS AGRÍCOLAS, POR CATEGORÍA, 2022-2031 (MILLONES DE USD)

CUADRO 277 SEMILLAS Y LEGUMBRES OLEAGINOSAS EN EL MERCADO DE FEROMONAS AGRÍCOLAS DE JAPÓN, POR CATEGORÍA, 2022-2031 (MILLONES DE USD)

CUADRO 278 CEREALES JAPONESES Y AUMENTOS EN EL MERCADO DE FEROMONAS AGRÍCOLAS, POR CATEGORÍA, 2022-2031 (MILLONES DE USD)

CUADRO 279 MERCADO DE FEROMONAS AGRÍCOLAS DE JAPÓN, POR CANAL DE DISTRIBUCIÓN, 2022-2031 (MILLONES DE USD)

CUADRO 280 MERCADO DE FEROMONAS AGRÍCOLAS DE LA INDIA, POR TIPO, 2022-2031 (MILLONES DE USD)

TABLA 281 FEROMONAS SEXUALES DE LA INDIA EN EL MERCADO DE FEROMONAS AGRÍCOLAS, POR TIPO, 2022-2031 (MILLONES DE USD)

CUADRO 282 MERCADO DE FEROMONAS AGRÍCOLAS DE LA INDIA, POR ESPECIE, 2022-2031 (MILLONES DE USD)

CUADRO 283 MERCADO DE FEROMONAS AGRÍCOLAS DE LA INDIA, POR FUNCIÓN, 2022-2031 (MILLONES DE USD)

CUADRO 284 INDIA OTROS EN EL MERCADO DE FEROMONAS AGRÍCOLAS, POR FUNCIÓN, 2022-2031 (MILLONES DE USD)

CUADRO 285 MERCADO DE FEROMONAS AGRÍCOLAS DE LA INDIA, POR MODO DE APLICACIÓN, 2022-2031 (MILLONES DE USD)

TABLA 286 TRAMPAS DE LA INDIA EN EL MERCADO DE FEROMONAS AGRÍCOLAS, POR TIPO, 2022-2031 (MILLONES DE USD)

CUADRO 287 MERCADO DE FEROMONAS AGRÍCOLAS DE LA INDIA, POR TIPO DE CULTIVO, 2022-2031 (MILLONES DE USD)

CUADRO 288 FRUTAS DE LA INDIA EN EL MERCADO DE FEROMONAS AGRÍCOLAS, POR CATEGORÍA, 2022-2031 (MILLONES DE USD)

CUADRO 289 VERDURAS DE LA INDIA EN EL MERCADO DE FEROMONAS AGRÍCOLAS, POR CATEGORÍA, 2022-2031 (MILLONES DE USD)

CUADRO 290 SEMILLAS Y LEGUMBRES OLEAGINOSAS EN EL MERCADO DE FEROMONAS AGRÍCOLAS DE LA INDIA, POR CATEGORÍA, 2022-2031 (MILLONES DE USD)

CUADRO 291 CEREALES DE LA INDIA Y AUMENTOS DEL MERCADO DE FEROMONAS AGRÍCOLAS, POR CATEGORÍA, 2022-2031 (MILLONES DE USD)

CUADRO 292 MERCADO DE FEROMONAS AGRÍCOLAS DE LA INDIA, POR CANAL DE DISTRIBUCIÓN, 2022-2031 (MILLONES DE USD)

CUADRO 293 MERCADO DE FEROMONAS AGRÍCOLAS DE AUSTRALIA, POR TIPO, 2022-2031 (MILLONES DE USD)

TABLA 294 FEROMONAS SEXUALES DE AUSTRALIA EN EL MERCADO DE FEROMONAS AGRÍCOLAS, POR TIPO, 2022-2031 (MILLONES DE USD)

CUADRO 295 MERCADO DE FEROMONAS AGRÍCOLAS DE AUSTRALIA, POR ESPECIE, 2022-2031 (MILLONES DE USD)

CUADRO 296 MERCADO DE FEROMONAS AGRÍCOLAS DE AUSTRALIA, POR FUNCIÓN, 2022-2031 (MILLONES DE USD)

CUADRO 297 AUSTRALIA OTROS EN EL MERCADO DE FEROMONAS AGRÍCOLAS, POR FUNCIÓN, 2022-2031 (MILLONES DE USD)

CUADRO 298 MERCADO DE FEROMONAS AGRÍCOLAS DE AUSTRALIA, POR MODO DE APLICACIÓN, 2022-2031 (MILLONES DE USD)

TABLA 299 TRAMPAS DE AUSTRALIA EN EL MERCADO DE FEROMONAS AGRÍCOLAS, POR TIPO, 2022-2031 (MILLONES DE USD)

CUADRO 300 MERCADO DE FEROMONAS AGRÍCOLAS DE AUSTRALIA, POR TIPO DE CULTIVO, 2022-2031 (MILLONES DE USD)

CUADRO 301 FRUTAS DE AUSTRALIA EN EL MERCADO DE FEROMONAS AGRÍCOLAS, POR CATEGORÍA, 2022-2031 (MILLONES DE USD)

CUADRO 302 VEGETALES DE AUSTRALIA EN EL MERCADO DE FEROMONAS AGRÍCOLAS, POR CATEGORÍA, 2022-2031 (MILLONES DE USD)

CUADRO 303 SEMILLAS Y LEGUMBRES OLEAGINOSAS EN AUSTRALIA EN EL MERCADO DE FEROMONAS AGRÍCOLAS, POR CATEGORÍA, 2022-2031 (MILLONES DE USD)

CUADRO 304 CEREALES DE AUSTRALIA Y AUMENTOS DEL MERCADO DE FEROMONAS AGRÍCOLAS, POR CATEGORÍA, 2022-2031 (MILLONES DE USD)

CUADRO 305 MERCADO DE FEROMONAS AGRÍCOLAS DE AUSTRALIA, POR CANAL DE DISTRIBUCIÓN, 2022-2031 (MILLONES DE USD)

CUADRO 306 MERCADO DE FEROMONAS AGRÍCOLAS DE COREA DEL SUR, POR TIPO, 2022-2031 (MILLONES DE USD)

TABLA 307 FEROMONAS SEXUALES DE COREA DEL SUR EN EL MERCADO DE FEROMONAS AGRÍCOLAS, POR TIPO, 2022-2031 (MILLONES DE USD)

CUADRO 308 MERCADO DE FEROMONAS AGRÍCOLAS DE COREA DEL SUR, POR ESPECIE, 2022-2031 (MILLONES DE USD)

CUADRO 309 MERCADO DE FEROMONAS AGRÍCOLAS DE COREA DEL SUR, POR FUNCIÓN, 2022-2031 (MILLONES DE USD)

CUADRO 310 COREA DEL SUR OTROS EN EL MERCADO DE FEROMONAS AGRÍCOLAS, POR FUNCIÓN, 2022-2031 (MILLONES DE USD)

CUADRO 311 MERCADO DE FEROMONAS AGRÍCOLAS DE COREA DEL SUR, POR MODO DE APLICACIÓN, 2022-2031 (MILLONES DE USD)

TABLA 312 TRAMPAS DE COREA DEL SUR EN EL MERCADO DE FEROMONAS AGRÍCOLAS, POR TIPO, 2022-2031 (MILLONES DE USD)

CUADRO 313 MERCADO DE FEROMONAS AGRÍCOLAS DE COREA DEL SUR, POR TIPO DE CULTIVO, 2022-2031 (MILLONES DE USD)

CUADRO 314 FRUTAS DE COREA DEL SUR EN EL MERCADO DE FEROMONAS AGRÍCOLAS, POR CATEGORÍA, 2022-2031 (MILLONES DE USD)

CUADRO 315 VEGETALES DE COREA DEL SUR EN EL MERCADO DE FEROMONAS AGRÍCOLAS, POR CATEGORÍA, 2022-2031 (MILLONES DE USD)

CUADRO 316 MERCADO DE SEMILLAS OLEAGINOSAS Y LEGUMBRES DE COREA DEL SUR EN FEROMONAS AGRÍCOLAS, POR CATEGORÍA, 2022-2031 (MILLONES DE USD)

CUADRO 317 CEREALES DE COREA DEL SUR Y AUMENTOS DEL MERCADO DE FEROMONAS AGRÍCOLAS, POR CATEGORÍA, 2022-2031 (MILLONES DE USD)

CUADRO 318 MERCADO DE FEROMONAS AGRÍCOLAS DE COREA DEL SUR, POR CANAL DE DISTRIBUCIÓN, 2022-2031 (MILLONES DE USD)

TABLA 319 MERCADO DE FEROMONAS AGRÍCOLAS DE TAILANDIA, POR TIPO, 2022-2031 (MILLONES DE USD)

TABLA 320 FEROMONAS SEXUALES EN EL MERCADO DE FEROMONAS AGRÍCOLAS DE TAILANDIA, POR TIPO, 2022-2031 (MILLONES DE USD)

CUADRO 321 MERCADO DE FEROMONAS AGRÍCOLAS DE TAILANDIA, POR ESPECIE, 2022-2031 (MILLONES DE USD)

CUADRO 322 MERCADO DE FEROMONAS AGRÍCOLAS DE TAILANDIA, POR FUNCIÓN, 2022-2031 (MILLONES DE USD)

CUADRO 323 TAILANDIA OTROS EN EL MERCADO DE FEROMONAS AGRÍCOLAS, POR FUNCIÓN, 2022-2031 (MILLONES DE USD)

CUADRO 324 MERCADO DE FEROMONAS AGRÍCOLAS DE TAILANDIA, POR MODO DE APLICACIÓN, 2022-2031 (MILLONES DE USD)

TABLA 325 TRAMPAS DE TAILANDIA EN EL MERCADO DE FEROMONAS AGRÍCOLAS, POR TIPO, 2022-2031 (MILLONES DE USD)

CUADRO 326 MERCADO DE FEROMONAS AGRÍCOLAS DE TAILANDIA, POR TIPO DE CULTIVO, 2022-2031 (MILLONES DE USD)

CUADRO 327 FRUTAS DE TAILANDIA EN EL MERCADO DE FEROMONAS AGRÍCOLAS, POR CATEGORÍA, 2022-2031 (MILLONES DE USD)

CUADRO 328 VERDURAS DE TAILANDIA EN EL MERCADO DE FEROMONAS AGRÍCOLAS, POR CATEGORÍA, 2022-2031 (MILLONES DE USD)

CUADRO 329 SEMILLAS OLEAGINOSAS Y LEGUMBRES EN EL MERCADO DE FEROMONAS AGRÍCOLAS DE TAILANDIA, POR CATEGORÍA, 2022-2031 (MILLONES DE USD)

CUADRO 330 CEREALES DE TAILANDIA Y AUMENTOS DEL MERCADO DE FEROMONAS AGRÍCOLAS, POR CATEGORÍA, 2022-2031 (MILLONES DE USD)

CUADRO 331 MERCADO DE FEROMONAS AGRÍCOLAS DE TAILANDIA, POR CANAL DE DISTRIBUCIÓN, 2022-2031 (MILLONES DE USD)

CUADRO 332 MERCADO DE FEROMONAS AGRÍCOLAS DE SINGAPUR, POR TIPO, 2022-2031 (MILLONES DE USD)

TABLA 333 FEROMONAS SEXUALES DE SINGAPUR EN EL MERCADO DE FEROMONAS AGRÍCOLAS, POR TIPO, 2022-2031 (MILLONES DE USD)

CUADRO 334 MERCADO DE FEROMONAS AGRÍCOLAS DE SINGAPUR, POR ESPECIE, 2022-2031 (MILLONES DE USD)

CUADRO 335 MERCADO DE FEROMONAS AGRÍCOLAS DE SINGAPUR, POR FUNCIÓN, 2022-2031 (MILLONES DE USD)

CUADRO 336 SINGAPUR OTROS EN EL MERCADO DE FEROMONAS AGRÍCOLAS, POR FUNCIÓN, 2022-2031 (MILLONES DE USD)

CUADRO 337 MERCADO DE FEROMONAS AGRÍCOLAS DE SINGAPUR, POR MODO DE APLICACIÓN, 2022-2031 (MILLONES DE USD)

TABLA 338 TRAMPAS DE SINGAPUR EN EL MERCADO DE FEROMONAS AGRÍCOLAS, POR TIPO, 2022-2031 (MILLONES DE USD)

CUADRO 339 MERCADO DE FEROMONAS AGRÍCOLAS DE SINGAPUR, POR TIPO DE CULTIVO, 2022-2031 (MILLONES DE USD)

CUADRO 340 FRUTAS DE SINGAPUR EN EL MERCADO DE FEROMONAS AGRÍCOLAS, POR CATEGORÍA, 2022-2031 (MILLONES DE USD)

CUADRO 341 VERDURAS DE SINGAPUR EN EL MERCADO DE FEROMONAS AGRÍCOLAS, POR CATEGORÍA, 2022-2031 (MILLONES DE USD)

CUADRO 342 SEMILLAS Y LEGUMBRES OLEAGINOSAS EN EL MERCADO DE FEROMONAS AGRÍCOLAS DE SINGAPUR, POR CATEGORÍA, 2022-2031 (MILLONES DE USD)

CUADRO 343 CEREALES DE SINGAPUR Y AUMENTOS DEL MERCADO DE FEROMONAS AGRÍCOLAS, POR CATEGORÍA, 2022-2031 (MILLONES DE USD)

CUADRO 344 MERCADO DE FEROMONAS AGRÍCOLAS DE SINGAPUR, POR CANAL DE DISTRIBUCIÓN, 2022-2031 (MILLONES DE USD)

CUADRO 345 MERCADO DE FEROMONAS AGRÍCOLAS DE MALASIA, POR TIPO, 2022-2031 (MILLONES DE USD)

TABLA 346 FEROMONAS SEXUALES DE MALASIA EN EL MERCADO DE FEROMONAS AGRÍCOLAS, POR TIPO, 2022-2031 (MILLONES DE USD)

CUADRO 347 MERCADO DE FEROMONAS AGRÍCOLAS DE MALASIA, POR ESPECIE, 2022-2031 (MILLONES DE USD)

CUADRO 348 MERCADO DE FEROMONAS AGRÍCOLAS DE MALASIA, POR FUNCIÓN, 2022-2031 (MILLONES DE USD)

CUADRO 349 MALASIA OTROS EN EL MERCADO DE FEROMONAS AGRÍCOLAS, POR FUNCIÓN, 2022-2031 (MILLONES DE USD)

CUADRO 350 MERCADO DE FEROMONAS AGRÍCOLAS DE MALASIA, POR MODO DE APLICACIÓN, 2022-2031 (MILLONES DE USD)

TABLA 351 TRAMPAS DE MALASIA EN EL MERCADO DE FEROMONAS AGRÍCOLAS, POR TIPO, 2022-2031 (MILLONES DE USD)

CUADRO 352 MERCADO DE FEROMONAS AGRÍCOLAS DE MALASIA, POR TIPO DE CULTIVO, 2022-2031 (MILLONES DE USD)

CUADRO 353 FRUTAS DE MALASIA EN EL MERCADO DE FEROMONAS AGRÍCOLAS, POR CATEGORÍA, 2022-2031 (MILLONES DE USD)

CUADRO 354 VERDURAS DE MALASIA EN EL MERCADO DE FEROMONAS AGRÍCOLAS, POR CATEGORÍA, 2022-2031 (MILLONES DE USD)

CUADRO 355 SEMILLAS Y LEGUMBRES OLEAGINOSAS DE MALASIA EN EL MERCADO DE FEROMONAS AGRÍCOLAS, POR CATEGORÍA, 2022-2031 (MILLONES DE USD)

CUADRO 356 CEREALES DE MALASIA Y AUMENTOS DEL MERCADO DE FEROMONAS AGRÍCOLAS, POR CATEGORÍA, 2022-2031 (MILLONES DE USD)

CUADRO 357 MERCADO DE FEROMONAS AGRÍCOLAS DE MALASIA, POR CANAL DE DISTRIBUCIÓN, 2022-2031 (MILLONES DE USD)

CUADRO 358 MERCADO DE FEROMONAS AGRÍCOLAS DE INDONESIA, POR TIPO, 2022-2031 (MILLONES DE USD)

TABLA 359 FEROMONAS SEXUALES DE INDONESIA EN EL MERCADO DE FEROMONAS AGRÍCOLAS, POR TIPO, 2022-2031 (MILLONES DE USD)

TABLA 360 MERCADO DE FEROMONAS AGRÍCOLAS DE INDONESIA, POR ESPECIE, 2022-2031 (MILLONES DE USD)

CUADRO 361 MERCADO DE FEROMONAS AGRÍCOLAS DE INDONESIA, POR FUNCIÓN, 2022-2031 (MILLONES DE USD)

CUADRO 362 INDONESIA OTROS EN EL MERCADO DE FEROMONAS AGRÍCOLAS, POR FUNCIÓN, 2022-2031 (MILLONES DE USD)

CUADRO 363 MERCADO DE FEROMONAS AGRÍCOLAS DE INDONESIA, POR MODO DE APLICACIÓN, 2022-2031 (MILLONES DE USD)

TABLA 364 TRAMPAS DE INDONESIA EN EL MERCADO DE FEROMONAS AGRÍCOLAS, POR TIPO, 2022-2031 (MILLONES DE USD)

CUADRO 365 MERCADO DE FEROMONAS AGRÍCOLAS DE INDONESIA, POR TIPO DE CULTIVO, 2022-2031 (MILLONES DE USD)

CUADRO 366 FRUTAS DE INDONESIA EN EL MERCADO DE FEROMONAS AGRÍCOLAS, POR CATEGORÍA, 2022-2031 (MILLONES DE USD)

CUADRO 367 VEGETALES DE INDONESIA EN EL MERCADO DE FEROMONAS AGRÍCOLAS, POR CATEGORÍA, 2022-2031 (MILLONES DE USD)

CUADRO 368 SEMILLAS Y LEGUMBRES OLEAGINOSAS EN EL MERCADO DE FEROMONAS AGRÍCOLAS DE INDONESIA, POR CATEGORÍA, 2022-2031 (MILLONES DE USD)

CUADRO 369 CEREALES DE INDONESIA Y AUMENTOS DEL MERCADO DE FEROMONAS AGRÍCOLAS, POR CATEGORÍA, 2022-2031 (MILLONES DE USD)

CUADRO 370 MERCADO DE FEROMONAS AGRÍCOLAS DE INDONESIA, POR CANAL DE DISTRIBUCIÓN, 2022-2031 (MILLONES DE USD)

CUADRO 371 MERCADO DE FEROMONAS AGRÍCOLAS DE FILIPINAS, POR TIPO, 2022-2031 (MILLONES DE USD)

TABLA 372 FEROMONAS SEXUALES EN EL MERCADO DE FEROMONAS AGRÍCOLAS DE FILIPINAS, POR TIPO, 2022-2031 (MILLONES DE USD)

CUADRO 373 MERCADO DE FEROMONAS AGRÍCOLAS DE FILIPINAS, POR ESPECIE, 2022-2031 (MILLONES DE USD)

CUADRO 374 MERCADO DE FEROMONAS AGRÍCOLAS DE FILIPINAS, POR FUNCIÓN, 2022-2031 (MILLONES DE USD)

CUADRO 375 FILIPINAS OTROS EN EL MERCADO DE FEROMONAS AGRÍCOLAS, POR FUNCIÓN, 2022-2031 (MILLONES DE USD)

CUADRO 376 MERCADO DE FEROMONAS AGRÍCOLAS DE FILIPINAS, POR MODO DE APLICACIÓN, 2022-2031 (MILLONES DE USD)

TABLA 377 TRAMPAS DE FILIPINAS EN EL MERCADO DE FEROMONAS AGRÍCOLAS, POR TIPO, 2022-2031 (MILLONES DE USD)

CUADRO 378 MERCADO DE FEROMONAS AGRÍCOLAS DE FILIPINAS, POR TIPO DE CULTIVO, 2022-2031 (MILLONES DE USD)

CUADRO 379 FRUTAS DE FILIPINAS EN EL MERCADO DE FEROMONAS AGRÍCOLAS, POR CATEGORÍA, 2022-2031 (MILLONES DE USD)

CUADRO 380 VERDURAS DE FILIPINAS EN EL MERCADO DE FEROMONAS AGRÍCOLAS, POR CATEGORÍA, 2022-2031 (MILLONES DE USD)

CUADRO 381 FILIPINAS SEMILLAS Y LEGUMBRES OLEAGINOSAS EN EL MERCADO DE FEROMONAS AGRÍCOLAS, POR CATEGORÍA, 2022-2031 (MILLONES DE USD)

CUADRO 382 FILIPINAS CEREALES Y AUMENTOS EN EL MERCADO DE FEROMONAS AGRÍCOLAS, POR CATEGORÍA, 2022-2031 (MILLONES DE USD)

CUADRO 383 MERCADO DE FEROMONAS AGRÍCOLAS DE FILIPINAS, POR CANAL DE DISTRIBUCIÓN, 2022-2031 (MILLONES DE USD)

CUADRO 384 RESTO DEL MERCADO DE FEROMONAS AGRÍCOLAS DE ASIA Y EL PACÍFICO, POR TIPO, 2022-2031 (MILLONES DE USD)

CUADRO 385 MERCADO DE FEROMONAS AGRÍCOLAS DE AMÉRICA DEL SUR, POR PAÍS, 2022-2031 (MILLONES DE USD)

CUADRO 386 MERCADO DE FEROMONAS AGRÍCOLAS DE AMÉRICA DEL SUR, POR TIPO, 2022-2031 (MILLONES DE USD)

TABLA 387 FEROMONAS SEXUALES EN EL MERCADO DE FEROMONAS AGRÍCOLAS DE AMÉRICA DEL SUR, POR TIPO, 2022-2031 (MILLONES DE USD)

CUADRO 388 MERCADO DE FEROMONAS AGRÍCOLAS DE AMÉRICA DEL SUR, POR ESPECIES, 2022-2031 (MILLONES DE USD)

CUADRO 389 MERCADO DE FEROMONAS AGRÍCOLAS DE AMÉRICA DEL SUR, POR FUNCIÓN, 2022-2031 (MILLONES DE USD)

CUADRO 390 OTROS MERCADO DE FEROMONAS AGRÍCOLAS DE AMÉRICA DEL SUR, POR FUNCIÓN, 2022-2031 (MILLONES DE USD)

CUADRO 391 MERCADO DE FEROMONAS AGRÍCOLAS DE AMÉRICA DEL SUR, POR MODO DE APLICACIÓN, 2022-2031 (MILLONES DE USD)

TABLA 392 TRAMPAS EN EL MERCADO DE FEROMONAS AGRÍCOLAS DE AMÉRICA DEL SUR, POR TIPO, 2022-2031 (MILLONES DE USD)

CUADRO 393 MERCADO DE FEROMONAS AGRÍCOLAS DE AMÉRICA DEL SUR, POR TIPO DE CULTIVO, 2022-2031 (MILLONES DE USD)

CUADRO 394 FRUTAS DE AMÉRICA DEL SUR EN EL MERCADO DE FEROMONAS AGRÍCOLAS, POR CATEGORÍA, 2022-2031 (MILLONES DE USD)

CUADRO 395 VEGETALES DE AMÉRICA DEL SUR EN EL MERCADO DE FEROMONAS AGRÍCOLAS, POR CATEGORÍA, 2022-2031 (MILLONES DE USD)

CUADRO 396 MERCADO DE FEROMONAS AGRÍCOLAS DE SEMILLAS Y LEGUMBRES OLEAGINOSAS DE AMÉRICA DEL SUR, POR CATEGORÍA, 2022-2031 (MILLONES DE USD)

CUADRO 397 CEREALES DE AMÉRICA DEL SUR Y AUMENTOS DEL MERCADO DE FEROMONAS AGRÍCOLAS, POR CATEGORÍA, 2022-2031 (MILLONES DE USD)

CUADRO 398 MERCADO DE FEROMONAS AGRÍCOLAS DE AMÉRICA DEL SUR, POR CANAL DE DISTRIBUCIÓN, 2022-2031 (MILLONES DE USD)

CUADRO 399 MERCADO DE FEROMONAS AGRÍCOLAS DE BRASIL, POR TIPO, 2022-2031 (MILLONES DE USD)

TABLA 400 FEROMONAS SEXUALES EN EL MERCADO DE FEROMONAS AGRÍCOLAS DE BRASIL, POR TIPO, 2022-2031 (MILLONES DE USD)

CUADRO 401 MERCADO DE FEROMONAS AGRÍCOLAS DE BRASIL, POR ESPECIES, 2022-2031 (MILLONES DE USD)

CUADRO 402 MERCADO DE FEROMONAS AGRÍCOLAS DE BRASIL, POR FUNCIÓN, 2022-2031 (MILLONES DE USD)

CUADRO 403 BRASIL OTROS EN EL MERCADO DE FEROMONAS AGRÍCOLAS, POR FUNCIÓN, 2022-2031 (MILLONES DE USD)

CUADRO 404 MERCADO DE FEROMONAS AGRÍCOLAS DE BRASIL, POR MODO DE APLICACIÓN, 2022-2031 (MILLONES DE USD)

TABLA 405 TRAMPAS DE BRASIL EN EL MERCADO DE FEROMONAS AGRÍCOLAS, POR TIPO, 2022-2031 (MILLONES DE USD)

CUADRO 406 MERCADO DE FEROMONAS AGRÍCOLAS DE BRASIL, POR TIPO DE CULTIVO, 2022-2031 (MILLONES DE USD)

CUADRO 407 FRUTAS DE BRASIL EN EL MERCADO DE FEROMONAS AGRÍCOLAS, POR CATEGORÍA, 2022-2031 (MILLONES DE USD)

CUADRO 408 HORTALIZAS DE BRASIL EN EL MERCADO DE FEROMONAS AGRÍCOLAS, POR CATEGORÍA, 2022-2031 (MILLONES DE USD)

CUADRO 409 SEMILLAS Y LEGUMBRES OLEAGINOSAS EN EL MERCADO DE FEROMONAS AGRÍCOLAS DE BRASIL, POR CATEGORÍA, 2022-2031 (MILLONES DE USD)

CUADRO 410 CEREALES DE BRASIL Y AUMENTOS DEL MERCADO DE FEROMONAS AGRÍCOLAS, POR CATEGORÍA, 2022-2031 (MILLONES DE USD)

CUADRO 411 MERCADO DE FEROMONAS AGRÍCOLAS DE BRASIL, POR CANAL DE DISTRIBUCIÓN, 2022-2031 (MILLONES DE USD)

CUADRO 412 MERCADO DE FEROMONAS AGRÍCOLAS DE ARGENTINA, POR TIPO, 2022-2031 (MILLONES DE USD)

CUADRO 413 FEROMONAS SEXUALES EN ARGENTINA EN EL MERCADO DE FEROMONAS AGRÍCOLAS, POR TIPO, 2022-2031 (MILLONES DE USD)

CUADRO 414 MERCADO ARGENTINO DE FEROMONAS AGRÍCOLAS, POR ESPECIES, 2022-2031 (MILLONES DE USD)

CUADRO 415 MERCADO ARGENTINO DE FEROMONAS AGRÍCOLAS, POR FUNCIÓN, 2022-2031 (MILLONES DE USD)

CUADRO 416 ARGENTINA OTROS EN EL MERCADO DE FEROMONAS AGRÍCOLAS, POR FUNCIÓN, 2022-2031 (MILLONES DE USD)

CUADRO 417 MERCADO ARGENTINO DE FEROMONAS AGRÍCOLAS, POR MODO DE APLICACIÓN, 2022-2031 (MILLONES DE USD)

CUADRO 418 TRAMPAS ARGENTINA EN EL MERCADO DE FEROMONAS AGRÍCOLAS, POR TIPO, 2022-2031 (MILLONES DE USD)

CUADRO 419 MERCADO DE FEROMONAS AGRÍCOLAS DE ARGENTINA, POR TIPO DE CULTIVO, 2022-2031 (MILLONES DE USD)

CUADRO 420 FRUTAS ARGENTINA EN EL MERCADO DE FEROMONAS AGRÍCOLAS, POR CATEGORÍA, 2022-2031 (MILLONES DE USD)

CUADRO 421 HORTALIZAS ARGENTINAS EN EL MERCADO DE FEROMONAS AGRÍCOLAS, POR CATEGORÍA, 2022-2031 (MILLONES DE USD)

CUADRO 422 SEMILLAS Y LEGUMBRES OLEAGINOSAS EN ARGENTINA EN EL MERCADO DE FEROMONAS AGRÍCOLAS, POR CATEGORÍA, 2022-2031 (MILLONES DE USD)

CUADRO 423 CEREALES ARGENTINA Y AUMENTO DEL MERCADO DE FEROMONAS AGRÍCOLAS, POR CATEGORÍA, 2022-2031 (MILLONES DE USD)

CUADRO 424 MERCADO ARGENTINO DE FEROMONAS AGRÍCOLAS, POR CANAL DE DISTRIBUCIÓN, 2022-2031 (MILLONES DE USD)

CUADRO 425 MERCADO DE FEROMONAS AGRÍCOLAS DEL RESTO DE AMÉRICA DEL SUR, POR TIPO, 2022-2031 (MILLONES DE USD)

CUADRO 426 MERCADO DE FEROMONAS AGRÍCOLAS DE ORIENTE MEDIO Y ÁFRICA, POR PAÍS, 2022-2031 (MILLONES DE USD)

TABLA 427 MERCADO DE FEROMONAS AGRÍCOLAS DE ORIENTE MEDIO Y ÁFRICA, POR TIPO, 2022-2031 (MILLONES DE USD)

TABLA 428 FEROMONAS SEXUALES DE ORIENTE MEDIO Y ÁFRICA EN EL MERCADO DE FEROMONAS AGRÍCOLAS, POR TIPO, 2022-2031 (MILLONES DE USD)

CUADRO 429 MERCADO DE FEROMONAS AGRÍCOLAS DE ORIENTE MEDIO Y ÁFRICA, POR ESPECIE, 2022-2031 (MILLONES DE USD)

CUADRO 430 MERCADO DE FEROMONAS AGRÍCOLAS DE ORIENTE MEDIO Y ÁFRICA, POR FUNCIÓN, 2022-2031 (MILLONES DE USD)

CUADRO 431 ORIENTE MEDIO Y ÁFRICA OTROS EN EL MERCADO DE FEROMONAS AGRÍCOLAS, POR FUNCIÓN, 2022-2031 (MILLONES DE USD)

CUADRO 432 MERCADO DE FEROMONAS AGRÍCOLAS DE ORIENTE MEDIO Y ÁFRICA, POR MODO DE APLICACIÓN, 2022-2031 (MILLONES DE USD)

TABLA 433 TRAMPAS DE ORIENTE MEDIO Y ÁFRICA EN EL MERCADO DE FEROMONAS AGRÍCOLAS, POR TIPO, 2022-2031 (MILLONES DE USD)

CUADRO 434 MERCADO DE FEROMONAS AGRÍCOLAS DE ORIENTE MEDIO Y ÁFRICA, POR TIPO DE CULTIVO, 2022-2031 (MILLONES DE USD)

CUADRO 435 FRUTAS DE ORIENTE MEDIO Y ÁFRICA EN EL MERCADO DE FEROMONAS AGRÍCOLAS, POR CATEGORÍA, 2022-2031 (MILLONES DE USD)

CUADRO 436 VEGETALES DE ORIENTE MEDIO Y ÁFRICA EN EL MERCADO DE FEROMONAS AGRÍCOLAS, POR CATEGORÍA, 2022-2031 (MILLONES DE USD)

CUADRO 437 MERCADO DE SEMILLAS Y LEGUMBRES OLEAGINOSAS EN ORIENTE MEDIO Y ÁFRICA EN FEROMONAS AGRÍCOLAS, POR CATEGORÍA, 2022-2031 (MILLONES DE USD)

CUADRO 438 CEREALES DE ORIENTE MEDIO Y ÁFRICA Y AUMENTOS DEL MERCADO DE FEROMONAS AGRÍCOLAS, POR CATEGORÍA, 2022-2031 (MILLONES DE USD)

CUADRO 439 MERCADO DE FEROMONAS AGRÍCOLAS DE ORIENTE MEDIO Y ÁFRICA, POR CANAL DE DISTRIBUCIÓN, 2022-2031 (MILLONES DE USD)

TABLA 440 MERCADO DE FEROMONAS AGRÍCOLAS DE SUDÁFRICA, POR TIPO, 2022-2031 (MILLONES DE USD)

TABLA 441 FEROMONAS SEXUALES EN EL MERCADO DE FEROMONAS AGRÍCOLAS DE SUDÁFRICA, POR TIPO, 2022-2031 (MILLONES DE USD)

CUADRO 442 MERCADO DE FEROMONAS AGRÍCOLAS DE SUDÁFRICA, POR ESPECIE, 2022-2031 (MILLONES DE USD)

CUADRO 443 MERCADO DE FEROMONAS AGRÍCOLAS DE SUDÁFRICA, POR FUNCIÓN, 2022-2031 (MILLONES DE USD)

CUADRO 444 SUDÁFRICA OTROS EN EL MERCADO DE FEROMONAS AGRÍCOLAS, POR FUNCIÓN, 2022-2031 (MILLONES DE USD)

CUADRO 445 MERCADO DE FEROMONAS AGRÍCOLAS DE SUDÁFRICA, POR MODO DE APLICACIÓN, 2022-2031 (MILLONES DE USD)

TABLA 446 TRAMPAS DE SUDÁFRICA EN EL MERCADO DE FEROMONAS AGRÍCOLAS, POR TIPO, 2022-2031 (MILLONES DE USD)

CUADRO 447 MERCADO DE FEROMONAS AGRÍCOLAS DE SUDÁFRICA, POR TIPO DE CULTIVO, 2022-2031 (MILLONES DE USD)

CUADRO 448 FRUTAS DE SUDÁFRICA EN EL MERCADO DE FEROMONAS AGRÍCOLAS, POR CATEGORÍA, 2022-2031 (MILLONES DE USD)

CUADRO 449 VEGETALES DE SUDÁFRICA EN EL MERCADO DE FEROMONAS AGRÍCOLAS, POR CATEGORÍA, 2022-2031 (MILLONES DE USD)

CUADRO 450 MERCADO DE SEMILLAS OLEAGINOSAS Y LEGUMBRES EN FEROMONAS AGRÍCOLAS DE SUDÁFRICA, POR CATEGORÍA, 2022-2031 (MILLONES DE USD)

CUADRO 451 CEREALES DE SUDÁFRICA Y AUMENTOS DEL MERCADO DE FEROMONAS AGRÍCOLAS, POR CATEGORÍA, 2022-2031 (MILLONES DE USD)

CUADRO 452 MERCADO DE FEROMONAS AGRÍCOLAS DE SUDÁFRICA, POR CANAL DE DISTRIBUCIÓN, 2022-2031 (MILLONES DE USD)

TABLA 453 MERCADO DE FEROMONAS AGRÍCOLAS DE ARABIA SAUDITA, POR TIPO, 2022-2031 (MILLONES DE USD)

TABLA 454 FEROMONAS SEXUALES DE ARABIA SAUDITA EN EL MERCADO DE FEROMONAS AGRÍCOLAS, POR TIPO, 2022-2031 (MILLONES DE USD)

CUADRO 455 MERCADO DE FEROMONAS AGRÍCOLAS DE ARABIA SAUDITA, POR ESPECIE, 2022-2031 (MILLONES DE USD)

CUADRO 456 MERCADO DE FEROMONAS AGRÍCOLAS DE ARABIA SAUDITA, POR FUNCIÓN, 2022-2031 (MILLONES DE USD)

CUADRO 457 ARABIA SAUDITA OTROS EN EL MERCADO DE FEROMONAS AGRÍCOLAS, POR FUNCIÓN, 2022-2031 (MILLONES DE USD)

CUADRO 458 MERCADO DE FEROMONAS AGRÍCOLAS DE ARABIA SAUDITA, POR MODO DE APLICACIÓN, 2022-2031 (MILLONES DE USD)

TABLA 459 TRAMPAS DE ARABIA SAUDITA EN EL MERCADO DE FEROMONAS AGRÍCOLAS, POR TIPO, 2022-2031 (MILLONES DE USD)

CUADRO 460 MERCADO DE FEROMONAS AGRÍCOLAS DE ARABIA SAUDITA, POR TIPO DE CULTIVO, 2022-2031 (MILLONES DE USD)

CUADRO 461 FRUTAS DE ARABIA SAUDITA EN EL MERCADO DE FEROMONAS AGRÍCOLAS, POR CATEGORÍA, 2022-2031 (MILLONES DE USD)

CUADRO 462 HORTALIZAS DE ARABIA SAUDITA EN EL MERCADO DE FEROMONAS AGRÍCOLAS, POR CATEGORÍA, 2022-2031 (MILLONES DE USD)

CUADRO 463 SEMILLAS Y LEGUMBRES OLEAGINOSAS DE ARABIA SAUDITA EN EL MERCADO DE FEROMONAS AGRÍCOLAS, POR CATEGORÍA, 2022-2031 (MILLONES DE USD)

CUADRO 464 CEREALES DE ARABIA SAUDITA Y AUMENTOS DEL MERCADO DE FEROMONAS AGRÍCOLAS, POR CATEGORÍA, 2022-2031 (MILLONES DE USD)

CUADRO 465 MERCADO DE FEROMONAS AGRÍCOLAS DE ARABIA SAUDITA, POR CANAL DE DISTRIBUCIÓN, 2022-2031 (MILLONES DE USD)

TABLA 466 MERCADO DE FEROMONAS AGRÍCOLAS DE LOS EAU, POR TIPO, 2022-2031 (MILLONES DE USD)

TABLA 467 FEROMONAS SEXUALES DE LOS EAU EN EL MERCADO DE FEROMONAS AGRÍCOLAS, POR TIPO, 2022-2031 (MILLONES DE USD)

TABLA 468 MERCADO DE FEROMONAS AGRÍCOLAS DE LOS EAU, POR ESPECIE, 2022-2031 (MILLONES DE USD)

TABLA 469 MERCADO DE FEROMONAS AGRÍCOLAS DE LOS EAU, POR FUNCIÓN, 2022-2031 (MILLONES DE USD)

TABLA 470 OTROS EAU EN EL MERCADO DE FEROMONAS AGRÍCOLAS, POR FUNCIÓN, 2022-2031 (MILLONES DE USD)

CUADRO 471 MERCADO DE FEROMONAS AGRÍCOLAS DE LOS EAU, POR MODO DE APLICACIÓN, 2022-2031 (MILLONES DE USD)

TABLA 472 TRAMPAS DE LOS EAU EN EL MERCADO DE FEROMONAS AGRÍCOLAS, POR TIPO, 2022-2031 (MILLONES DE USD)

CUADRO 473 MERCADO DE FEROMONAS AGRÍCOLAS DE LOS EAU, POR TIPO DE CULTIVO, 2022-2031 (MILLONES DE USD)

CUADRO 474 FRUTAS DE LOS EAU EN EL MERCADO DE FEROMONAS AGRÍCOLAS, POR CATEGORÍA, 2022-2031 (MILLONES DE USD)

CUADRO 475 VEGETALES DE LOS EAU EN EL MERCADO DE FEROMONAS AGRÍCOLAS, POR CATEGORÍA, 2022-2031 (MILLONES DE USD)

CUADRO 476 MERCADO DE FEROMONAS AGRÍCOLAS DE SEMILLAS Y LEGUMBRES OLEAGINOSAS DE LOS EAU, POR CATEGORÍA, 2022-2031 (MILLONES DE USD)

CUADRO 477 CEREALES DE LOS EAU Y AUMENTOS EN EL MERCADO DE FEROMONAS AGRÍCOLAS, POR CATEGORÍA, 2022-2031 (MILLONES DE USD)

TABLA 478 MERCADO DE FEROMONAS AGRÍCOLAS DE LOS EAU, POR CANAL DE DISTRIBUCIÓN, 2022-2031 (MILLONES DE USD)

TABLA 479 MERCADO DE FEROMONAS AGRÍCOLAS DE KUWAIT, POR TIPO, 2022-2031 (MILLONES DE USD)

TABLA 480 FEROMONAS SEXUALES DE KUWAIT EN EL MERCADO DE FEROMONAS AGRÍCOLAS, POR TIPO, 2022-2031 (MILLONES DE USD)

CUADRO 481 MERCADO DE FEROMONAS AGRÍCOLAS DE KUWAIT, POR ESPECIE, 2022-2031 (MILLONES DE USD)

CUADRO 482 MERCADO DE FEROMONAS AGRÍCOLAS DE KUWAIT, POR FUNCIÓN, 2022-2031 (MILLONES DE USD)

CUADRO 483 KUWAIT OTROS EN EL MERCADO DE FEROMONAS AGRÍCOLAS, POR FUNCIÓN, 2022-2031 (MILLONES DE USD)

CUADRO 484 MERCADO DE FEROMONAS AGRÍCOLAS DE KUWAIT, POR MODO DE APLICACIÓN, 2022-2031 (MILLONES DE USD)

TABLA 485 TRAMPAS KUWAIT EN EL MERCADO DE FEROMONAS AGRÍCOLAS, POR TIPO, 2022-2031 (MILLONES DE USD)

CUADRO 486 MERCADO DE FEROMONAS AGRÍCOLAS DE KUWAIT, POR TIPO DE CULTIVO, 2022-2031 (MILLONES DE USD)

TABLA 487 FRUTAS DE KUWAIT EN EL MERCADO DE FEROMONAS AGRÍCOLAS, POR CATEGORÍA, 2022-2031 (MILLONES DE USD)

CUADRO 488 VERDURAS DE KUWAIT EN EL MERCADO DE FEROMONAS AGRÍCOLAS, POR CATEGORÍA, 2022-2031 (MILLONES DE USD)

CUADRO 489 SEMILLAS Y LEGUMBRES OLEAGINOSAS DE KUWAIT EN EL MERCADO DE FEROMONAS AGRÍCOLAS, POR CATEGORÍA, 2022-2031 (MILLONES DE USD)

CUADRO 490 CEREALES DE KUWAIT Y AUMENTOS DEL MERCADO DE FEROMONAS AGRÍCOLAS, POR CATEGORÍA, 2022-2031 (MILLONES DE USD)

CUADRO 491 MERCADO DE FEROMONAS AGRÍCOLAS DE KUWAIT, POR CANAL DE DISTRIBUCIÓN, 2022-2031 (MILLONES DE USD)

CUADRO 492 MERCADO DE FEROMONAS AGRÍCOLAS DEL RESTO DE ORIENTE MEDIO Y ÁFRICA, POR TIPO, 2022-2031 (MILLONES DE USD)

Por favor complete el siguiente formulario para Infografías

Al hacer clic en el botón "Enviar", usted acepta la investigación de mercado de Data Bridge. política de privacidad y Términos y condiciones

Metodología de investigación:

La recopilación de datos y el análisis del año base se realizan mediante módulos de recopilación de datos con muestras de gran tamaño. La etapa incluye la obtención de información de mercado o datos relacionados a través de diversas fuentes y estrategias. Incluye examinar y planificar de antemano todos los datos adquiridos del pasado. Asimismo, abarca el examen de las inconsistencias de la información observadas en diferentes fuentes de información. Los datos de mercado se analizan y estiman utilizando modelos estadísticos y coherentes de mercado. Además, el análisis de la cuota de mercado y el análisis de tendencias clave son los principales factores de éxito en el informe de mercado. Para saber más, solicite una llamada de analista o envíe su consulta.

La metodología de investigación clave utilizada por el equipo de investigación de DBMR es la triangulación de datos, que implica extracción de datos, análisis del impacto de las variables de datos en el mercado y validación primaria (experto de la industria). Los modelos de datos incluyen cuadrícula de posicionamiento de proveedores, análisis de la línea de tiempo del mercado, descripción general y guía del mercado, cuadrícula de posicionamiento de la empresa, análisis de patentes, análisis de precios, análisis de participación de mercado de la empresa, estándares de medición, análisis global versus regional y de participación de proveedores. Para saber más sobre la metodología de investigación, envíe una consulta para hablar con nuestros expertos de la industria.

Por favor complete el siguiente formulario para Metodología de Investigación

Al hacer clic en el botón "Enviar", usted acepta la investigación de mercado de Data Bridge. política de privacidad y Términos y condiciones

Personalización disponible:

Data Bridge Market Research es líder en investigación formativa avanzada. Estamos orgullosos de brindar servicios a nuestros clientes nuevos y existentes con datos y análisis que coinciden y se adaptan a sus objetivos. El informe se puede personalizar para incluir análisis de tendencias de precios de marcas objetivo que comprendan el mercado de países adicionales (solicite la lista de países), datos de resultados de ensayos clínicos, revisión de literatura, mercado renovado y análisis de la base de productos. El análisis de mercado de los competidores objetivo se puede analizar desde análisis basados ​​en tecnología hasta estrategias de cartera de mercado. Podemos agregar tantos competidores sobre los que necesite datos en el formato y estilo de datos que esté buscando. Nuestro equipo de analistas también puede proporcionarle datos en tablas dinámicas de archivos de Excel sin procesar (libro de datos) o puede ayudarlo a crear presentaciones a partir de los conjuntos de datos disponibles en el informe.

Complete el siguiente formulario para personalizar disponible

Al hacer clic en el botón "Enviar", usted acepta la investigación de mercado de Data Bridge. política de privacidad y Términos y condiciones

HAGA PREGUNTAS FRECUENTES

Los principales actores en el mercado de feromonas agrícolas son International Pheromone Systems Ltd (Reino Unido), Novagrica (Grecia), ATGC (India), Pacific Biocontrol Corporation (EE.UU.), Pherobank (Países Bajos), Certis Europe (Países Bajos), SEDQ Healthy Crops SL ( España), etc.
Los países cubiertos en el mercado de feromonas agrícolas son EE. UU., Canadá y México en América del Norte, Alemania, Francia, Reino Unido, Países Bajos, Suiza, Bélgica, Rusia, Italia, España, Turquía, resto de Europa en Europa, China, Japón, India. etc.
Informe de muestra gratuito

ELEGIR TIPO DE LICENCIA

  • 7000.00
  • 4800.00
  • 3000.00
  • 8000.00
  • 12000.00

Por qué elegirnos

Cobertura de la industria

DBMR trabaja en todo el mundo en múltiples industrias, lo que nos brinda conocimiento en todos los sectores verticales y brinda a nuestros clientes información no solo de su industria sino también de cómo otras industrias afectarán su ecosistema.

Cobertura Regional

La cobertura de Data Bridge no se limita a las economías desarrolladas o emergentes. Trabajamos en todo el mundo cubriendo la mayor variedad de países donde ninguna otra firma de investigación de mercado o consultoría de negocios ha realizado investigaciones; creando oportunidades de crecimiento para nuestros clientes en áreas aún desconocidas.

Cobertura Tecnológica

En el mundo actual, la tecnología impulsa el sentimiento del mercado, por lo que nuestra visión es brindar a nuestros clientes información no solo sobre las tecnologías desarrolladas, sino también sobre los cambios tecnológicos futuros e disruptivos a lo largo del ciclo de vida del producto, brindándoles oportunidades imprevistas en el mercado que crearán disrupciones en su industria. . Esto lleva a la innovación y a que nuestros clientes salgan ganadores.

Soluciones orientadas a objetivos

El objetivo de DBMR es ayudar a nuestros clientes a alcanzar sus objetivos a través de nuestras soluciones; por lo tanto, creamos de manera formativa las soluciones más adecuadas para las necesidades de nuestros clientes, ahorrándoles tiempo y esfuerzos para impulsar sus grandes estrategias.

Soporte de analista incomparable

Nuestros analistas se enorgullecen del éxito de nuestros clientes. A diferencia de otros, creemos en trabajar junto a nuestros clientes para lograr sus objetivos con soporte de analistas las 24 horas para determinar las necesidades correctas e inspirar la innovación a través del servicio.

Banner

testimonios de clientes