
Mercado global de automatización de cuentas a pagar, por componente (soluciones y servicios), tamaño de la organización (gran empresa, pequeña y mediana empresa), proceso (captura de facturas, aprobación de facturas, autorización de pagos, ejecución de pagos y exportación), modo de implementación (nube y local), vertical (fabricación, bienes de consumo y venta minorista, energía y servicios públicos, atención médica, banca, servicios financieros y seguros, TI y telecomunicaciones, gobierno, automotriz y otros): tendencias de la industria y pronóstico hasta 2029.
Análisis y tamaño del mercado de automatización de cuentas por pagar
La automatización de cuentas por pagar es importante para garantizar el pago puntual de las facturas, lo que mejora la calificación crediticia de la empresa. Esta creciente demanda de generación de facturas por pagar se debe al pago puntual de las facturas, lo que garantiza un flujo ininterrumpido de suministros y servicios, y el pago puntual evita pagos atrasados y multas. El mercado global de automatización de cuentas por pagar está creciendo rápidamente debido a AL, ML y servicios en la nube. Las empresas incluso están lanzando nuevo software para ganar una mayor participación de mercado.
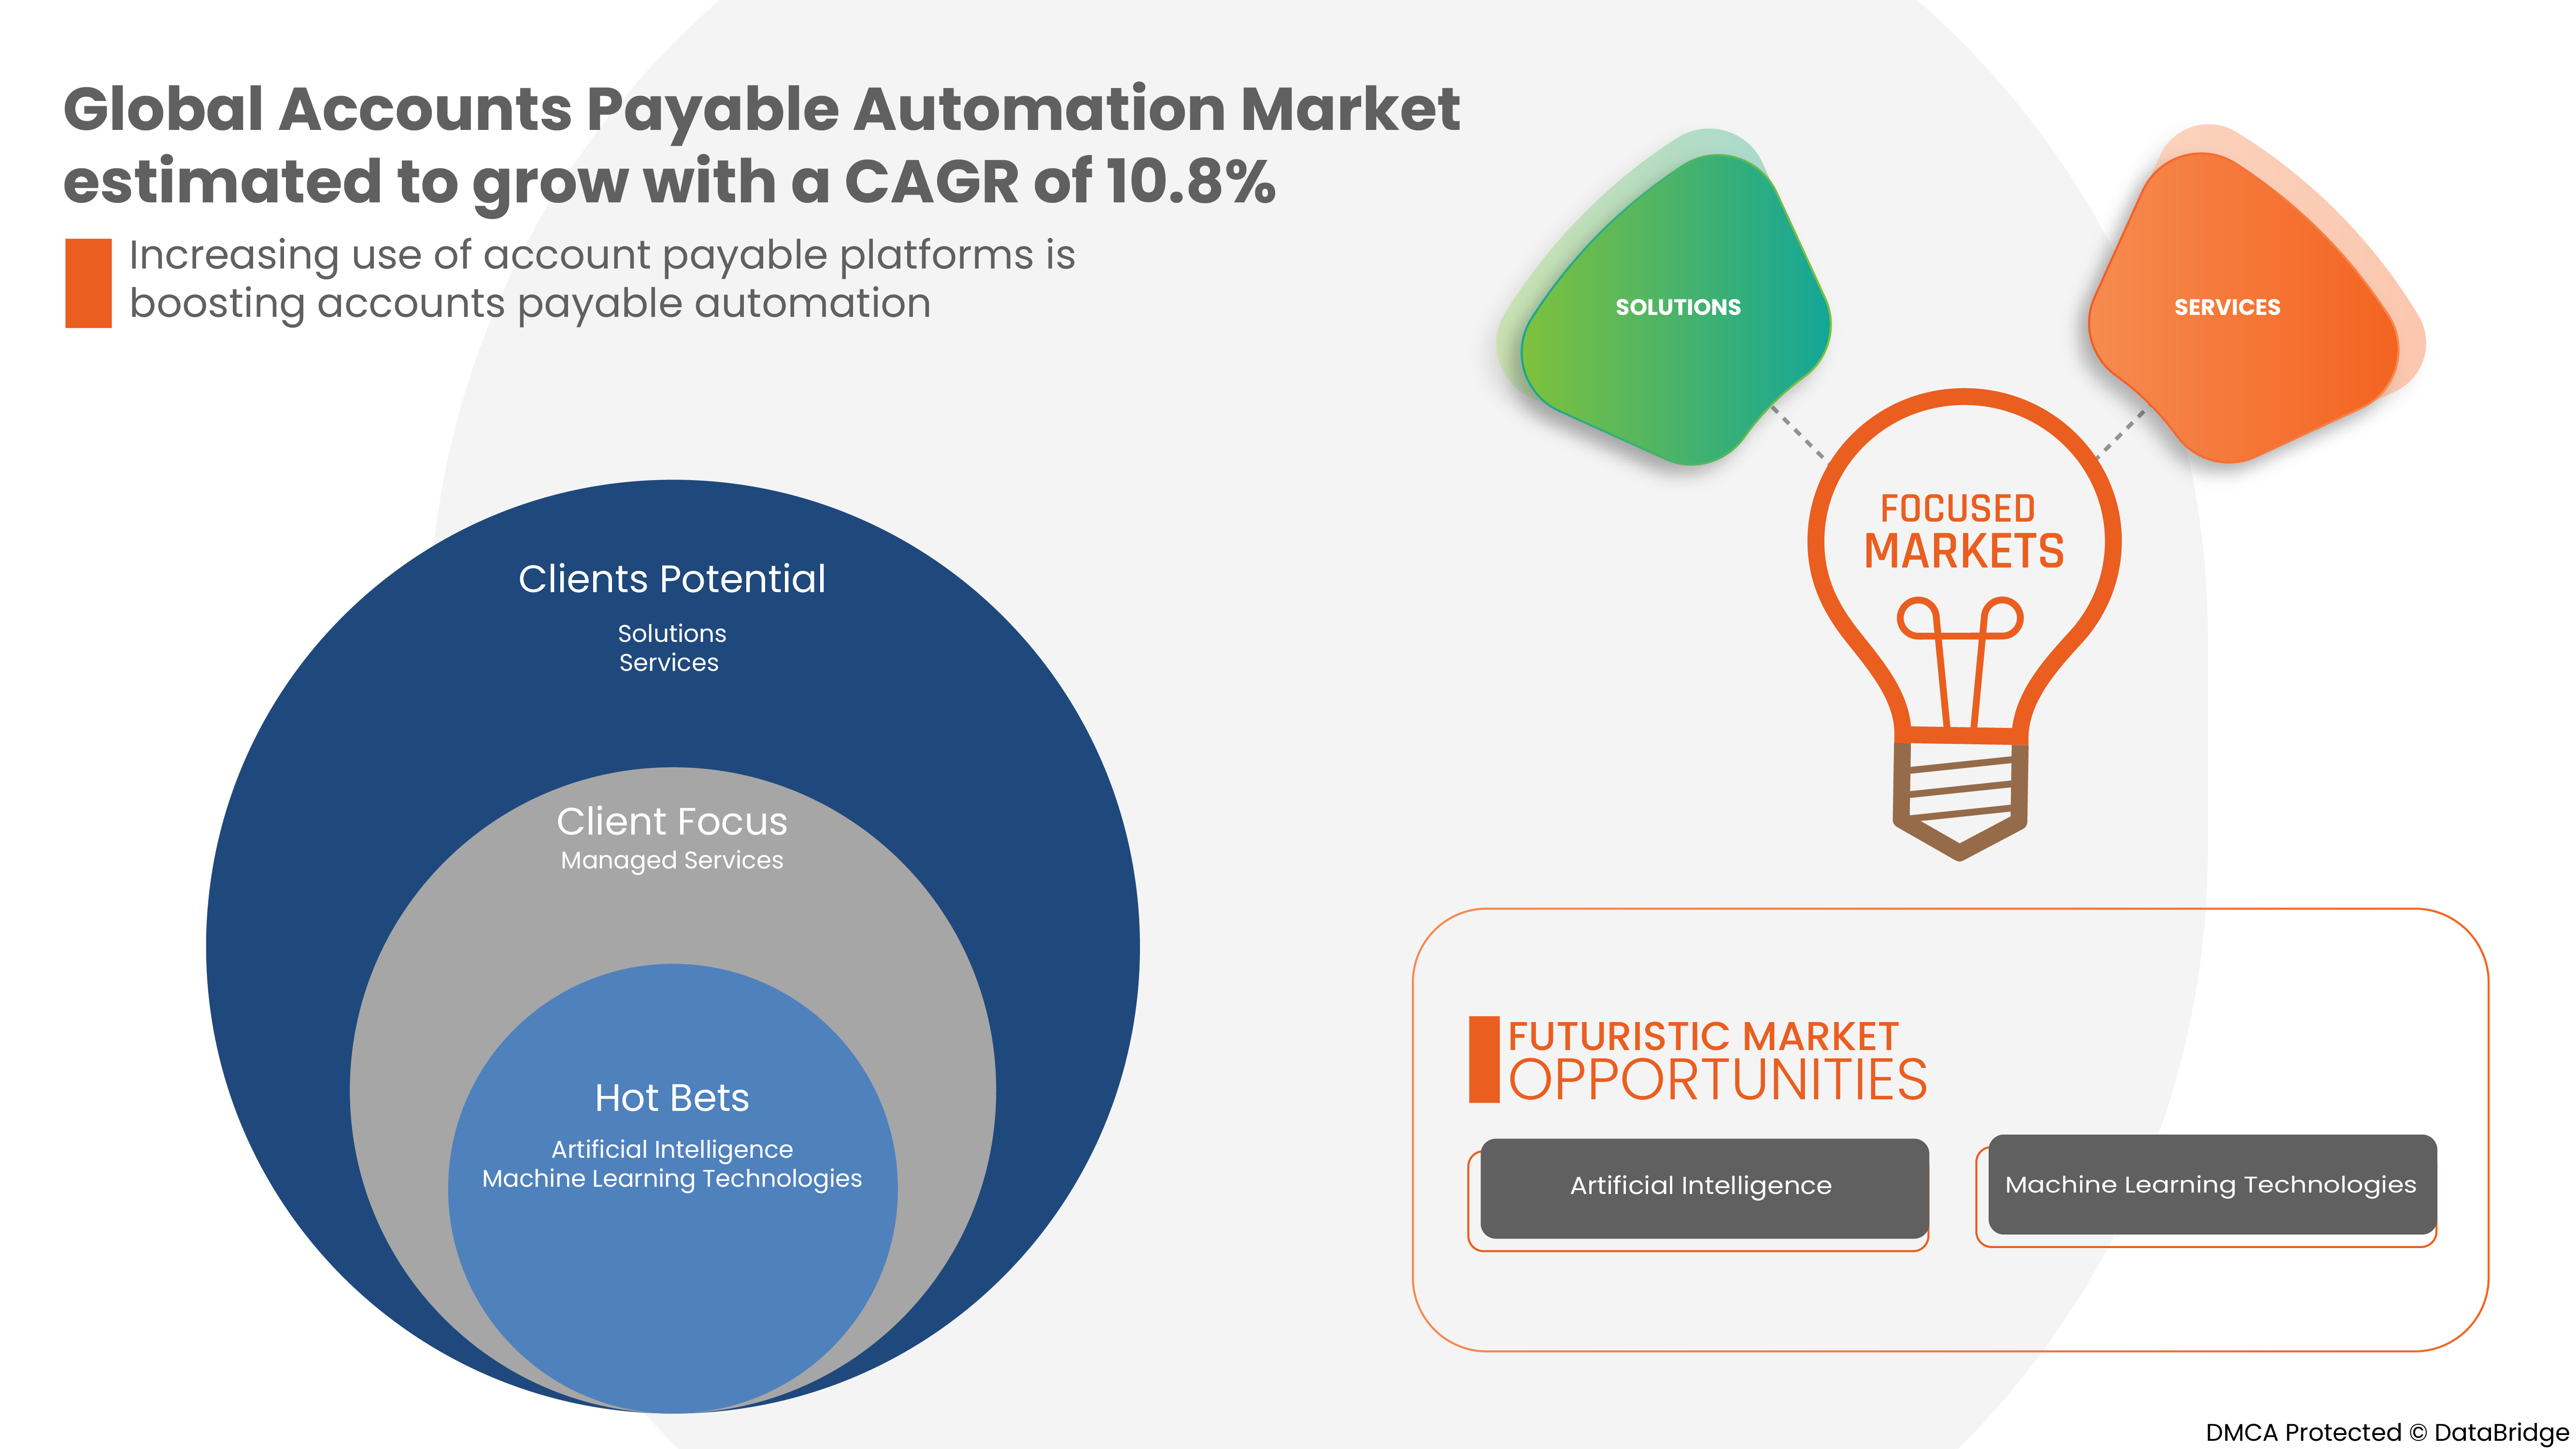
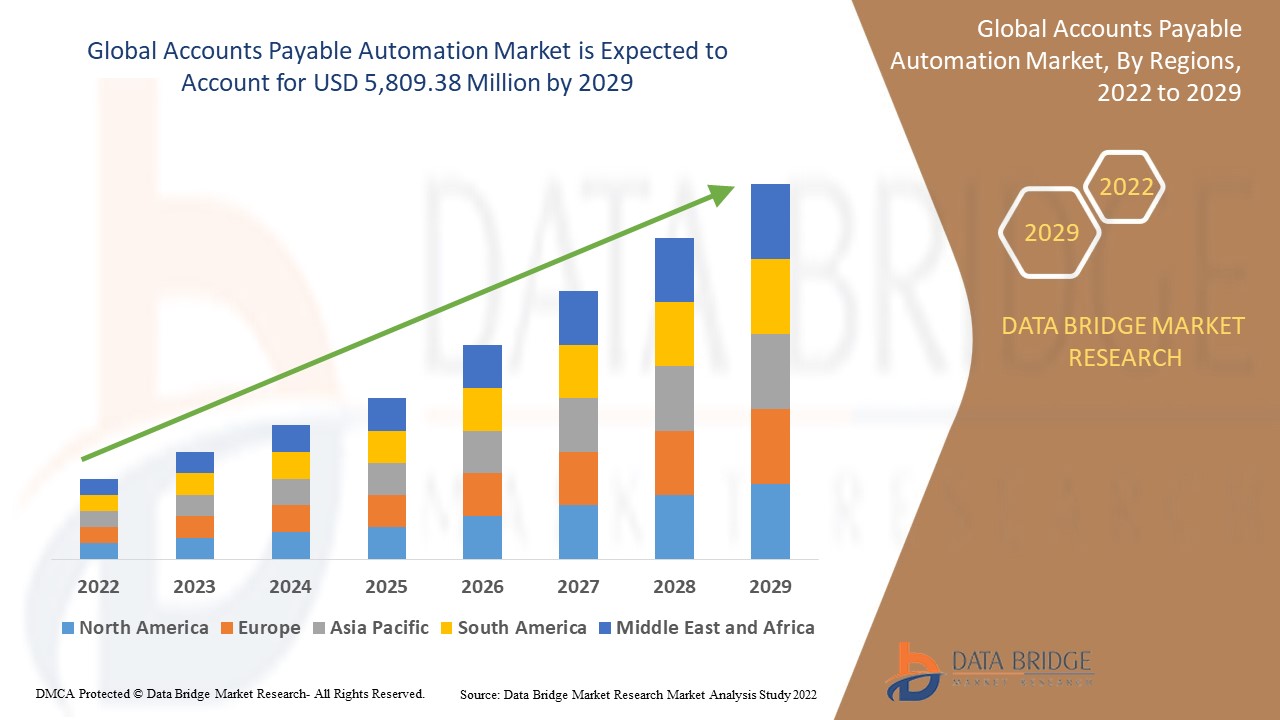
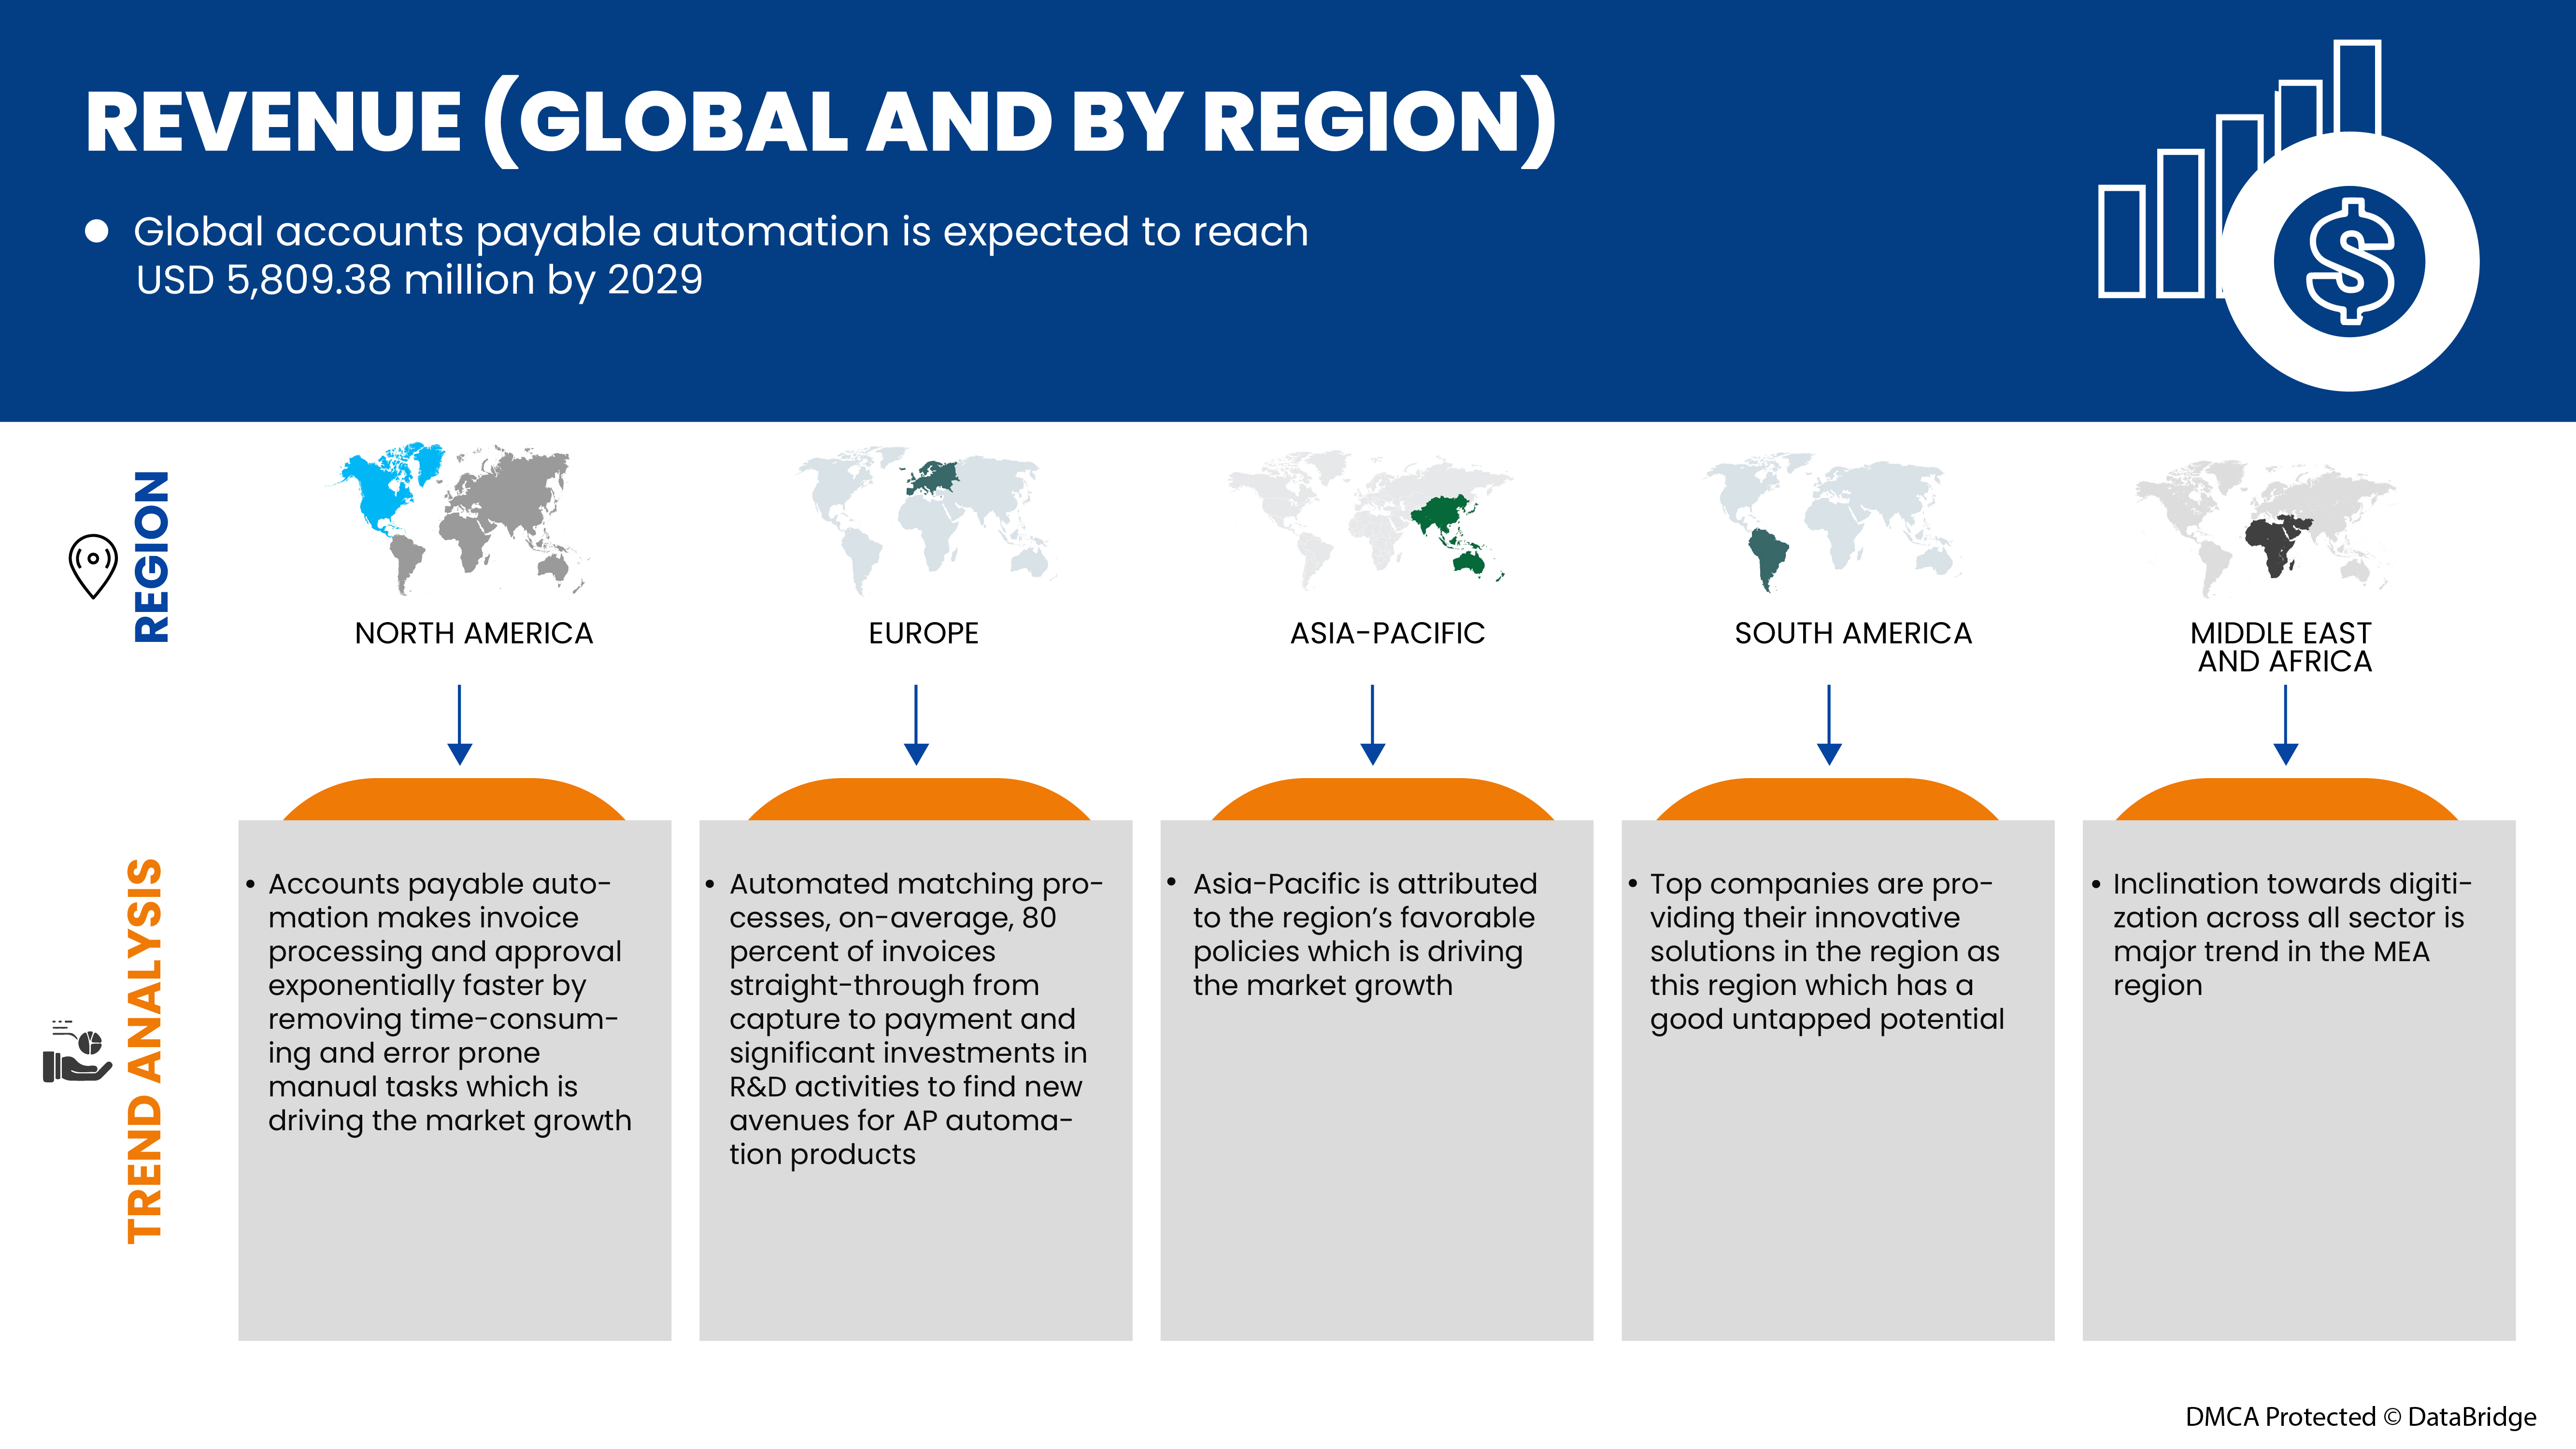
Data Bridge Market Research analiza que se espera que el mercado de automatización de cuentas por pagar alcance los USD 5.809,38 millones para 2029, con una CAGR del 10,8 % durante el período de pronóstico. Las "soluciones" representan el segmento de modo de módulos más destacado. El informe Global Accounts Payable Automation Market también cubre en profundidad el análisis de precios, el análisis de patentes y los avances tecnológicos.
|
Métrica del informe |
Detalles |
|
Período de pronóstico |
2022 a 2029 |
|
Año base |
2021 |
|
Años históricos |
2020 (Personalizable para 2019 - 2014) |
|
Unidades cuantitativas |
Millones de dólares |
|
Segmentos cubiertos |
Por componente (soluciones y servicios), tamaño de la organización (gran empresa, pequeña y mediana empresa), proceso (captura de facturas, aprobación de facturas, autorización de pagos, ejecución de pagos y exportación), modo de implementación (nube y local), vertical (fabricación, bienes de consumo y venta minorista, energía y servicios públicos, atención médica, banca, servicios financieros y seguros, TI y telecomunicaciones, gobierno, automotriz y otros) |
|
Países cubiertos |
Sudáfrica, Arabia Saudita, Emiratos Árabes Unidos, Egipto, Israel, Resto de Medio Oriente y África, EE. UU., Canadá, México, Alemania, Reino Unido, Francia, Italia, España, Rusia, Países Bajos, Bélgica, Suiza, Turquía, Resto de Europa, China, Japón, India, Corea del Sur, Australia, Singapur, Tailandia, Malasia, Indonesia, Filipinas, Resto de Asia-Pacífico, Brasil, Argentina y Resto de Sudamérica. |
|
Actores del mercado cubiertos |
SAP SE, Oracle Corporation, Sage Group plc, Tipalti Inc., FreshBooks, Zycus Inc., Airbase Inc., FIS., Coupa Software Inc., Comarch SA., FinancialForce, MHC Automation, Procurify Technologies Inc., Zoho Corporation Pvt. Ltd., MineralTree, Kofax Inc., AvidXchange, Bottomline Technologies, Inc., FLEETCOR TECHNOLOGIES, INC. y Bill.com, entre otros. |
Definición de mercado
La automatización de cuentas por pagar (AP) es el acto de procesar facturas en formato digital y a través de un proceso sin contacto utilizando una solución de automatización de AP. En una situación ideal, el 100 % de las facturas que recibe una empresa se pueden procesar automáticamente sin intervención humana. La automatización de AP es más que solo reconocimiento óptico de caracteres (OCR) . Es la automatización de todo el proceso de AP, desde la captura de datos mediante OCR o formatos de facturas digitales (como EDI y facturas electrónicas) hasta el flujo de trabajo de AP, como el enrutamiento, la codificación, la revisión y la aprobación de facturas y su vinculación automática con las órdenes de compra (OC), hasta la integración perfecta con su sistema de planificación de recursos empresariales.
Dinámica del mercado global de automatización de cuentas por pagar
En esta sección se aborda la comprensión de los factores impulsores, las ventajas, las oportunidades, las limitaciones y los desafíos del mercado. Todo esto se analiza en detalle a continuación:
Conductores
- Crecimiento de la necesidad de digitalizar el proceso de pago y reducción del tiempo de procesamiento de facturas
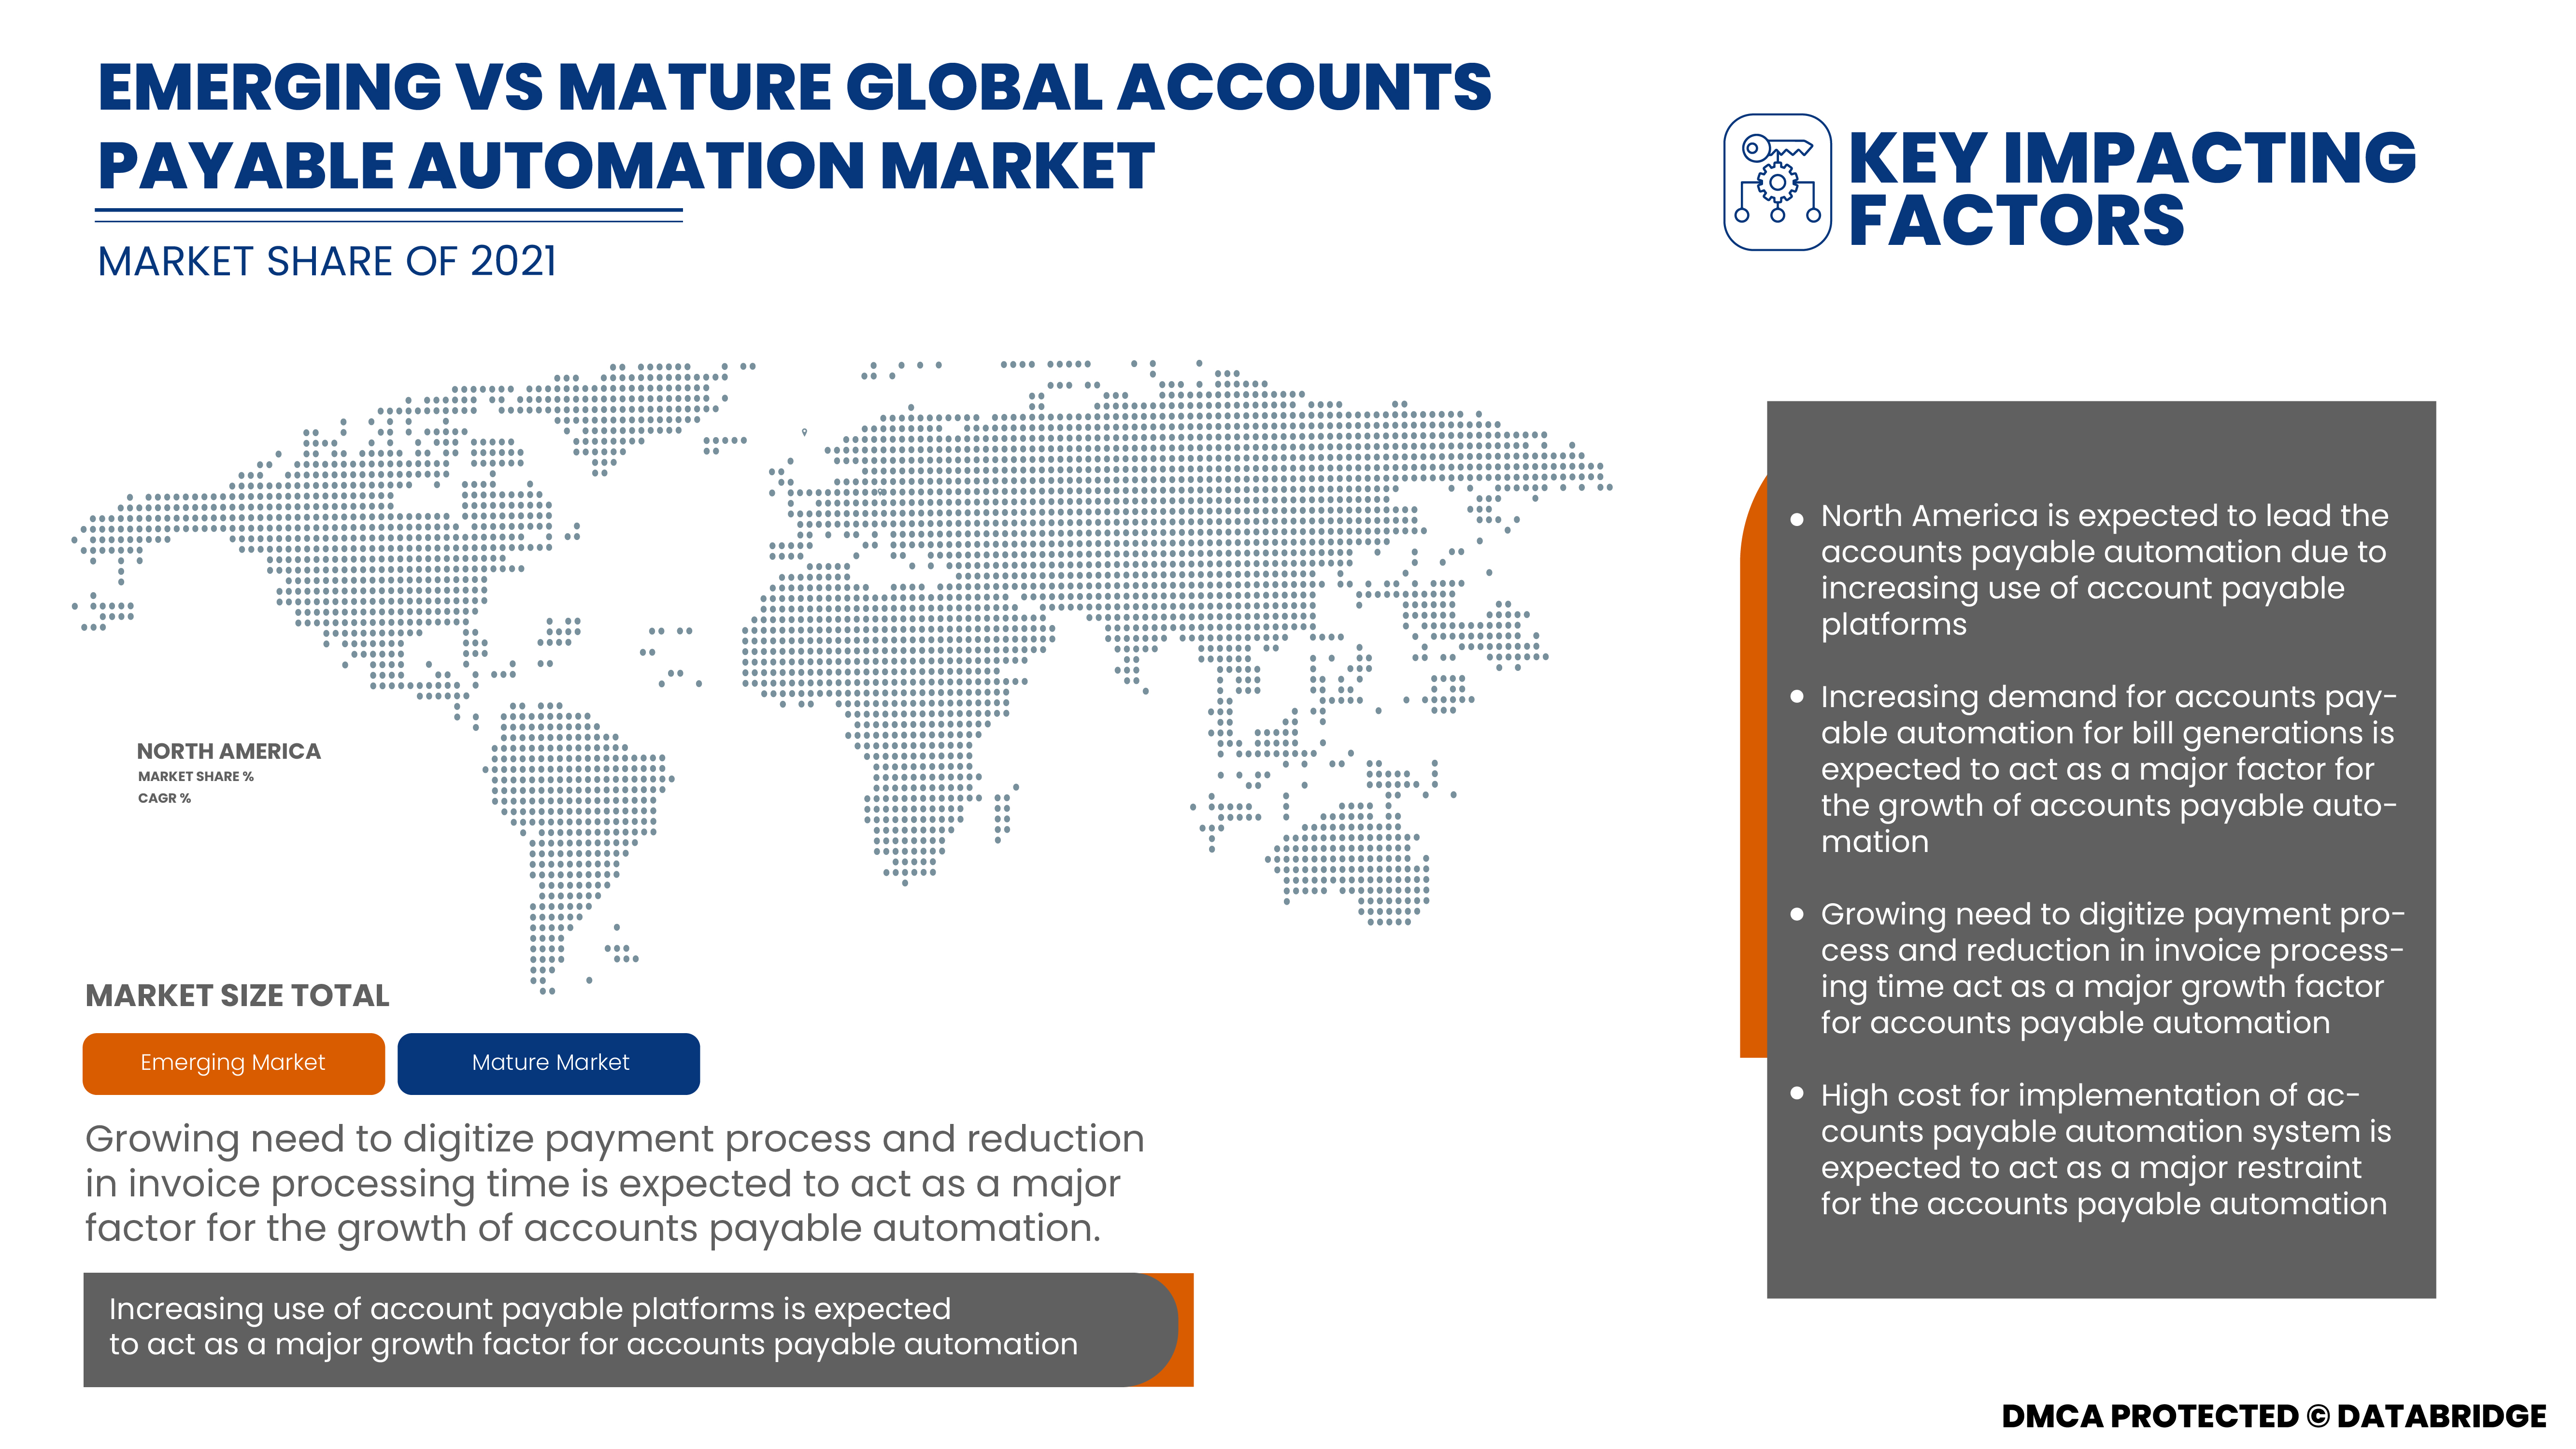
El crecimiento de la digitalización está revolucionando la interacción entre clientes y empresas y construyendo una nueva plataforma para la interacción de ideas. La digitalización es el proceso de convertir información en información digital mediante el uso de diversos datos y software. Desde 2009, se ha producido una transformación de las instituciones financieras hacia la digitalización mediante la integración de tecnologías digitales. La transformación digital ha proporcionado automatización, mejores servicios y eficiencia a los procesos financieros. Incluso los clientes se inclinan más por las plataformas digitales para la transacción de sus activos financieros; esto se ha incrementado aún más durante esta pandemia. La creciente necesidad de digitalizar el proceso de pago y reducir el tiempo de facturación está dando lugar al crecimiento del mercado de automatización de cuentas por pagar.
- Creciente demanda de automatización de cuentas por pagar para la generación de facturas
La gestión de cuentas por pagar es importante para garantizar el pago puntual de las facturas, lo que mejora la calificación crediticia de la empresa. Esta creciente demanda de generación de facturas por pagar debido al pago puntual de las facturas garantiza un flujo ininterrumpido de suministros y servicios. El pago puntual evita pagos atrasados, multas y otros cargos por pagos atrasados entre las organizaciones, lo que genera un gran crecimiento para el mercado global de automatización de cuentas por pagar.
- Aumento del uso de plataformas de cuentas a pagar
Las empresas individuales se están acostumbrando cada vez más a las plataformas de cuentas por pagar para realizar transacciones para su uso básico, como obtener información básica, comprar bienes o usarlas como plataforma para sus negocios.
Restricciones/Desafíos
- Mayor costo de implementación de sistemas de automatización de cuentas a pagar
En general, el costo de la automatización de cuentas por pagar depende de las necesidades y aplicaciones específicas. Sin embargo, la compra e implementación de software de automatización en varios sistemas para agilizar los procesos de transacción puede parecer abrumadora y costosa. Por lo tanto, el mayor costo puede plantear un problema en algunas empresas, donde el presupuesto asignado para el sistema establecido por la empresa permanece invariable.
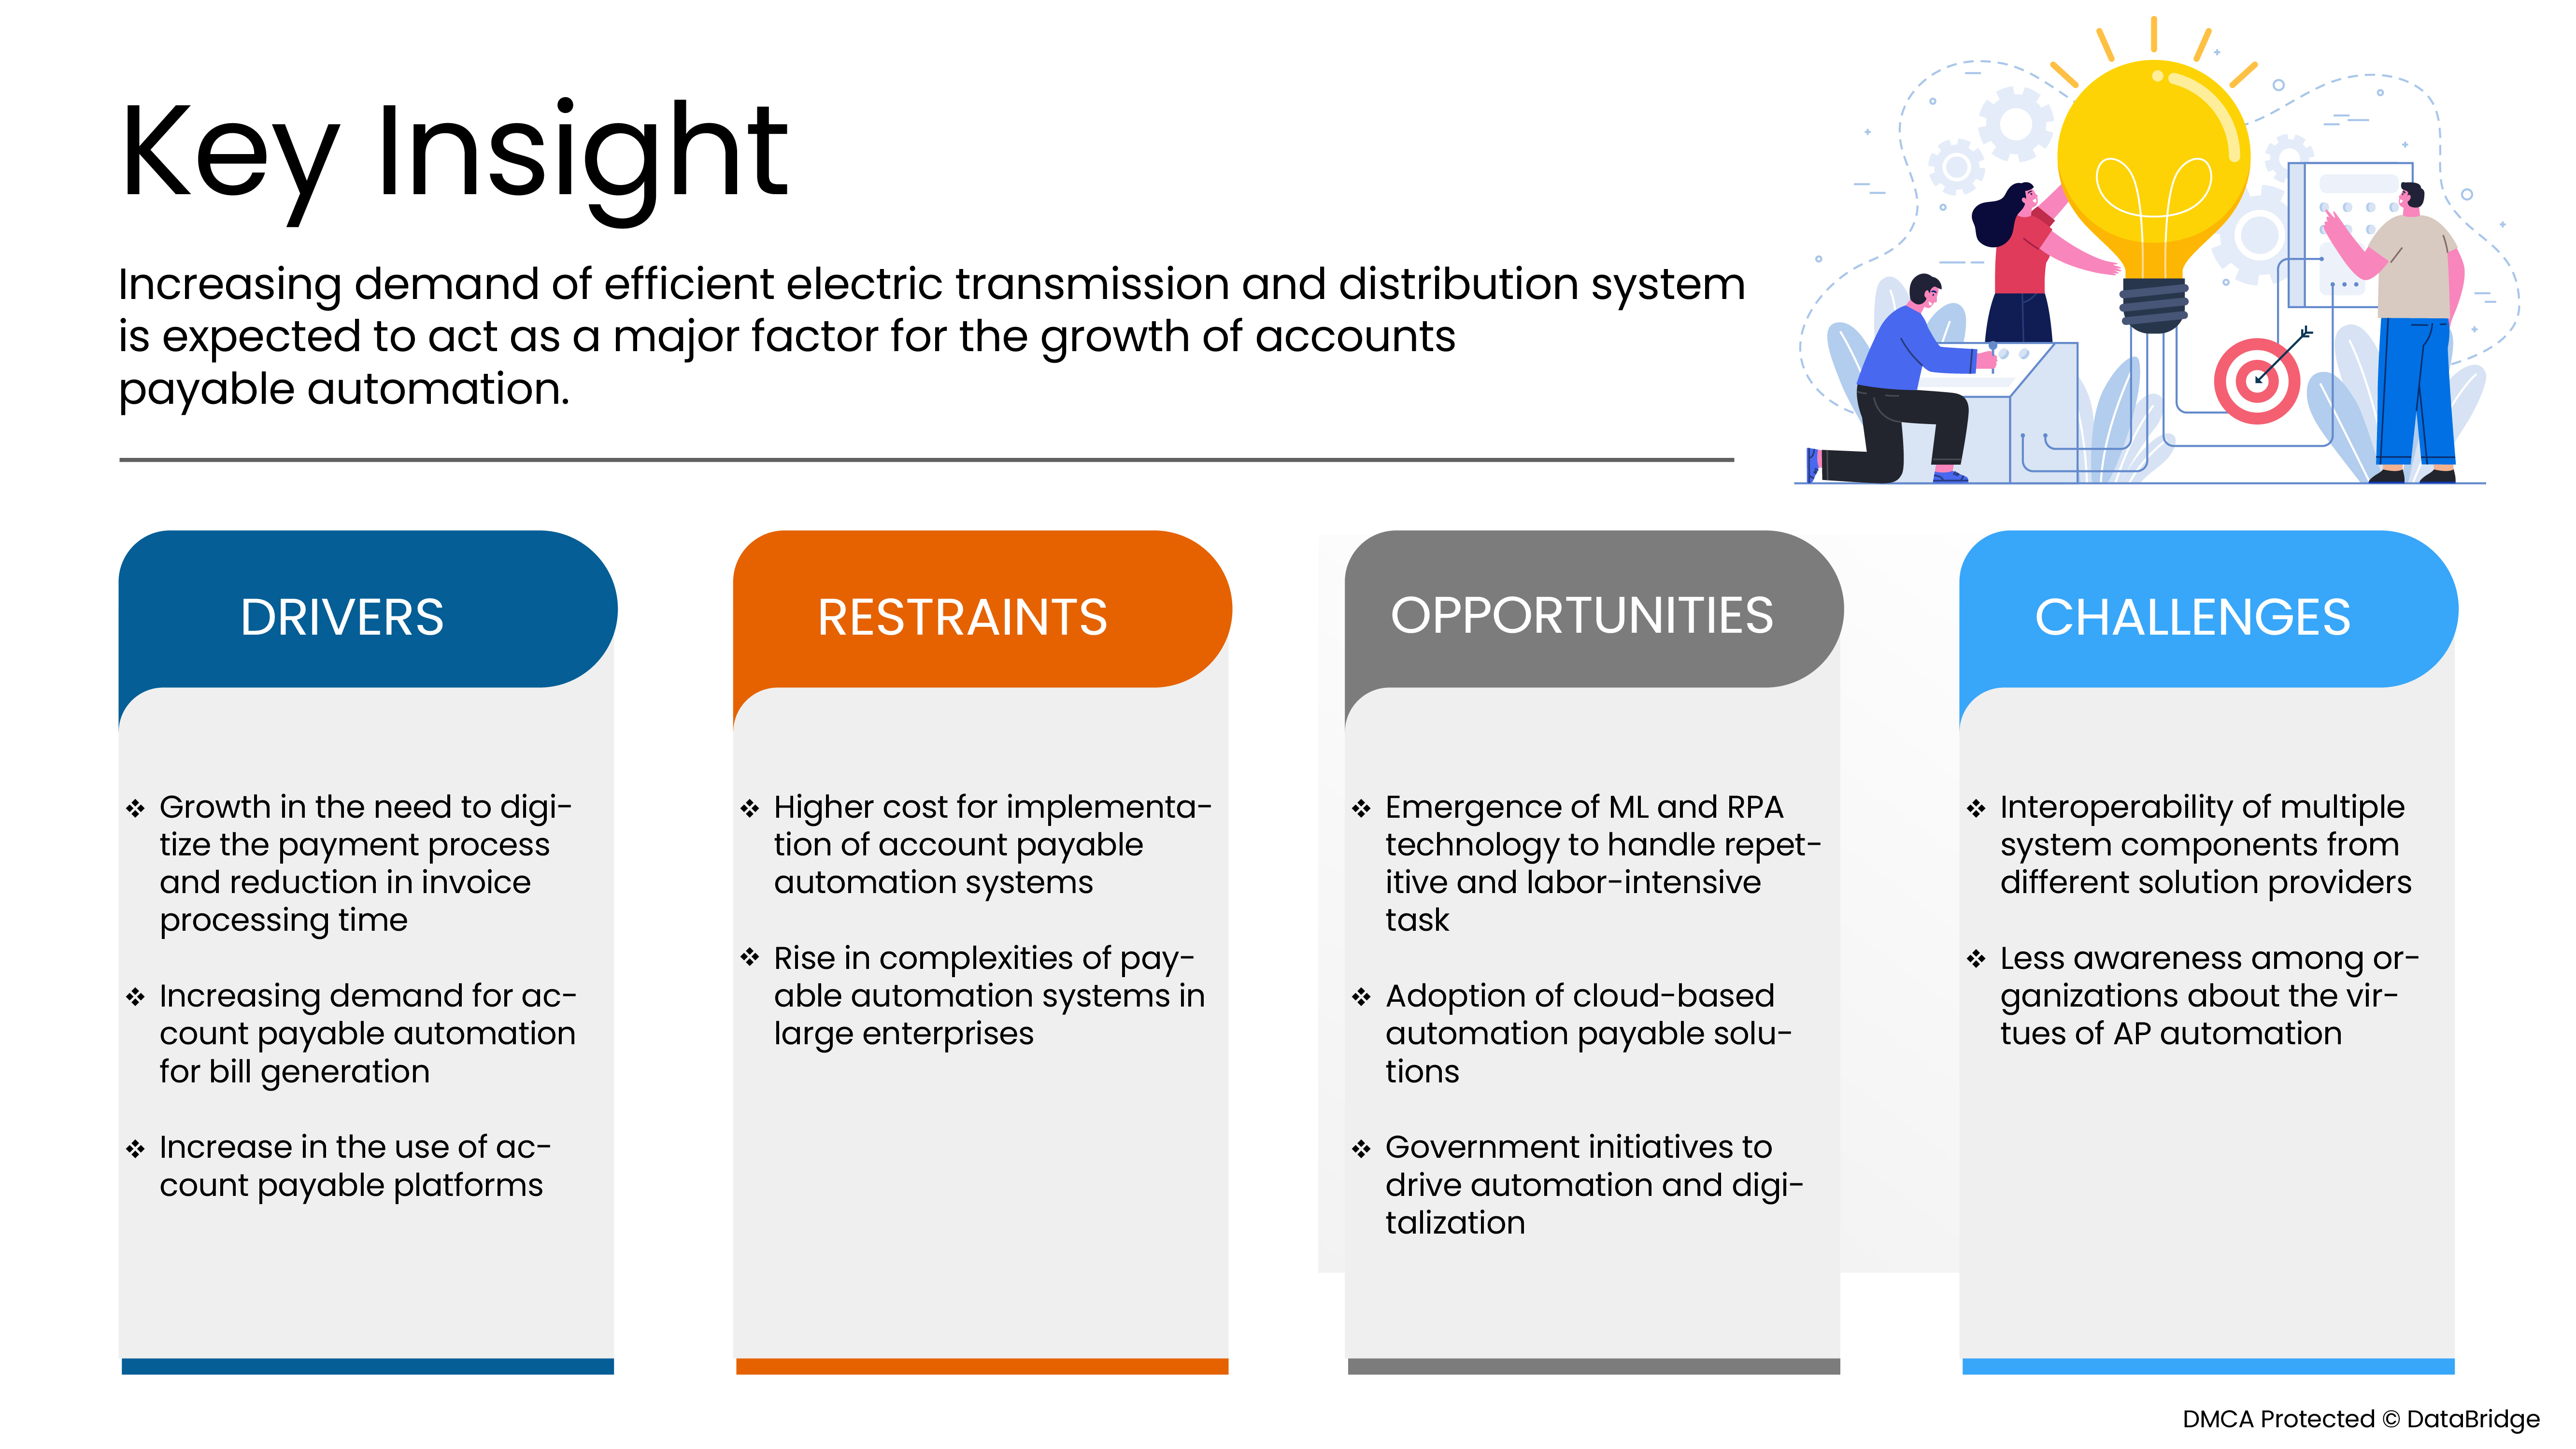
- Aumento de la complejidad de los sistemas de automatización de pagos en las grandes empresas
En todo el mundo se han implementado sistemas y software de automatización de pagos para beneficiarse de la reducción de la necesidad de personal humano y de realizar tareas repetitivas mediante la implementación de procesos automatizados de máquinas. Pero cuanto mayor sea la complejidad del sistema, mayor será el riesgo de que una falla del sistema afecte gravemente el funcionamiento relacionado con los pagos. Muchas fallas críticas del sistema, especialmente las que afectan a las líneas de ensamblaje, requerirían restablecer procedimientos manuales para administrar datos e información de pago de diferentes clientes. Sin embargo, en la mayoría de las empresas, se ha descubierto que los recursos son un factor limitante para el desarrollo. Una forma tradicional de administrar las facturas y coordinar los cronogramas de pagos a las conexiones del proveedor es manualmente.
Impacto posterior al COVID-19 en el mercado global de automatización de cuentas por pagar
El período de confinamiento y encierro durante la crisis de COVID-19 ha demostrado la importancia de una buena y confiable conectividad a Internet en las grandes industrias. Una conexión de alta velocidad en la gran industria ha permitido un teletrabajo eficiente, manteniendo los hábitos de entretenimiento y manteniendo contactos cercanos. El tráfico de datos en todas las redes ha aumentado significativamente durante el período de pandemia. COVID-19 ha aumentado la demanda de integración de datos en el mercado. Las redes de banda ancha fija han ganado una inmensa popularidad para mantener al mundo conectado. El tráfico creció un 30-40% de la noche a la mañana, impulsado principalmente por el trabajo desde grandes industrias (videoconferencias y colaboración, VPN), el aprendizaje desde grandes industrias (videoconferencias y colaboración, plataformas de aprendizaje electrónico) y el entretenimiento (juegos en línea, transmisión de video, redes sociales). Además, la oferta limitada y la escasez de software han afectado significativamente a la integración de datos en el mercado. El flujo de nuevos equipos, como computadoras, servidores, conmutadores y equipos en las instalaciones del cliente (CPE), se ha detenido por completo o se ha retrasado, con plazos de entrega de hasta 12 meses para diferentes artículos.
Los fabricantes están tomando diversas decisiones estratégicas para recuperarse tras la COVID-19. Las empresas están llevando a cabo múltiples actividades de investigación y desarrollo para mejorar la tecnología involucrada en la integración de datos. Con esto, las empresas traerán la integración de datos avanzada al mercado.
Desarrollo reciente
- En enero de 2022, SAP SE se asoció con Icertis para brindar inteligencia de contratos empresariales. La asociación se llevó a cabo para ampliar la cartera de soluciones de gestión de contratos. La asociación aprovechará la tecnología de la empresa para brindar servicios más valiosos a su base de clientes.
- En noviembre de 2021, Oracle Corporation lanzó una herramienta de análisis de ERP Oracle Fusion para obtener información financiera. Esta solución fue diseñada para facilitar el procesamiento de datos. Esta solución fue una solución confiable para empresas grandes y medianas, lo que ayudó a la empresa a expandir su mercado.
Alcance del mercado global de automatización de cuentas por pagar
El mercado global de automatización de cuentas por pagar está segmentado en función de los componentes, el tamaño de la organización, el proceso, la vertical y el modo de implementación. El crecimiento entre estos segmentos le ayudará a analizar los segmentos de crecimiento reducido en las industrias y brindará a los usuarios una valiosa descripción general del mercado y conocimientos del mercado para ayudarlos a tomar decisiones estratégicas para identificar las principales aplicaciones del mercado.
Por componente
- Soluciones
- Servicios
Sobre la base del componente, el mercado global de automatización de cuentas a pagar se segmenta en soluciones y servicios.
Por tamaño de la organización
- Gran empresa
- Pequeña y mediana empresa
Sobre la base del tamaño de la organización, el mercado global de automatización de cuentas a pagar se ha segmentado en grandes empresas y pequeñas y medianas empresas.
Por proceso
- Captura de facturas,
- Aprobación de factura
- Autorización de pago
- Ejecución de pago
- Exportar
Sobre la base del proceso, el mercado global de automatización de cuentas por pagar se ha segmentado en captura de facturas, aprobación de facturas, autorización de pagos, ejecución de pagos y exportación.
Por modo de implementación
- Nube
- En las instalaciones
Sobre la base del modo de implementación, el mercado global de automatización de cuentas a pagar se ha segmentado en nube y local.
Por vertical
- Fabricación
- Bienes de consumo y venta minorista
- Energía y servicios públicos
- Cuidado de la salud
- Banca, servicios financieros
- Seguro
- TI y telecomunicaciones
- Gobierno
- Automotor
- Otros
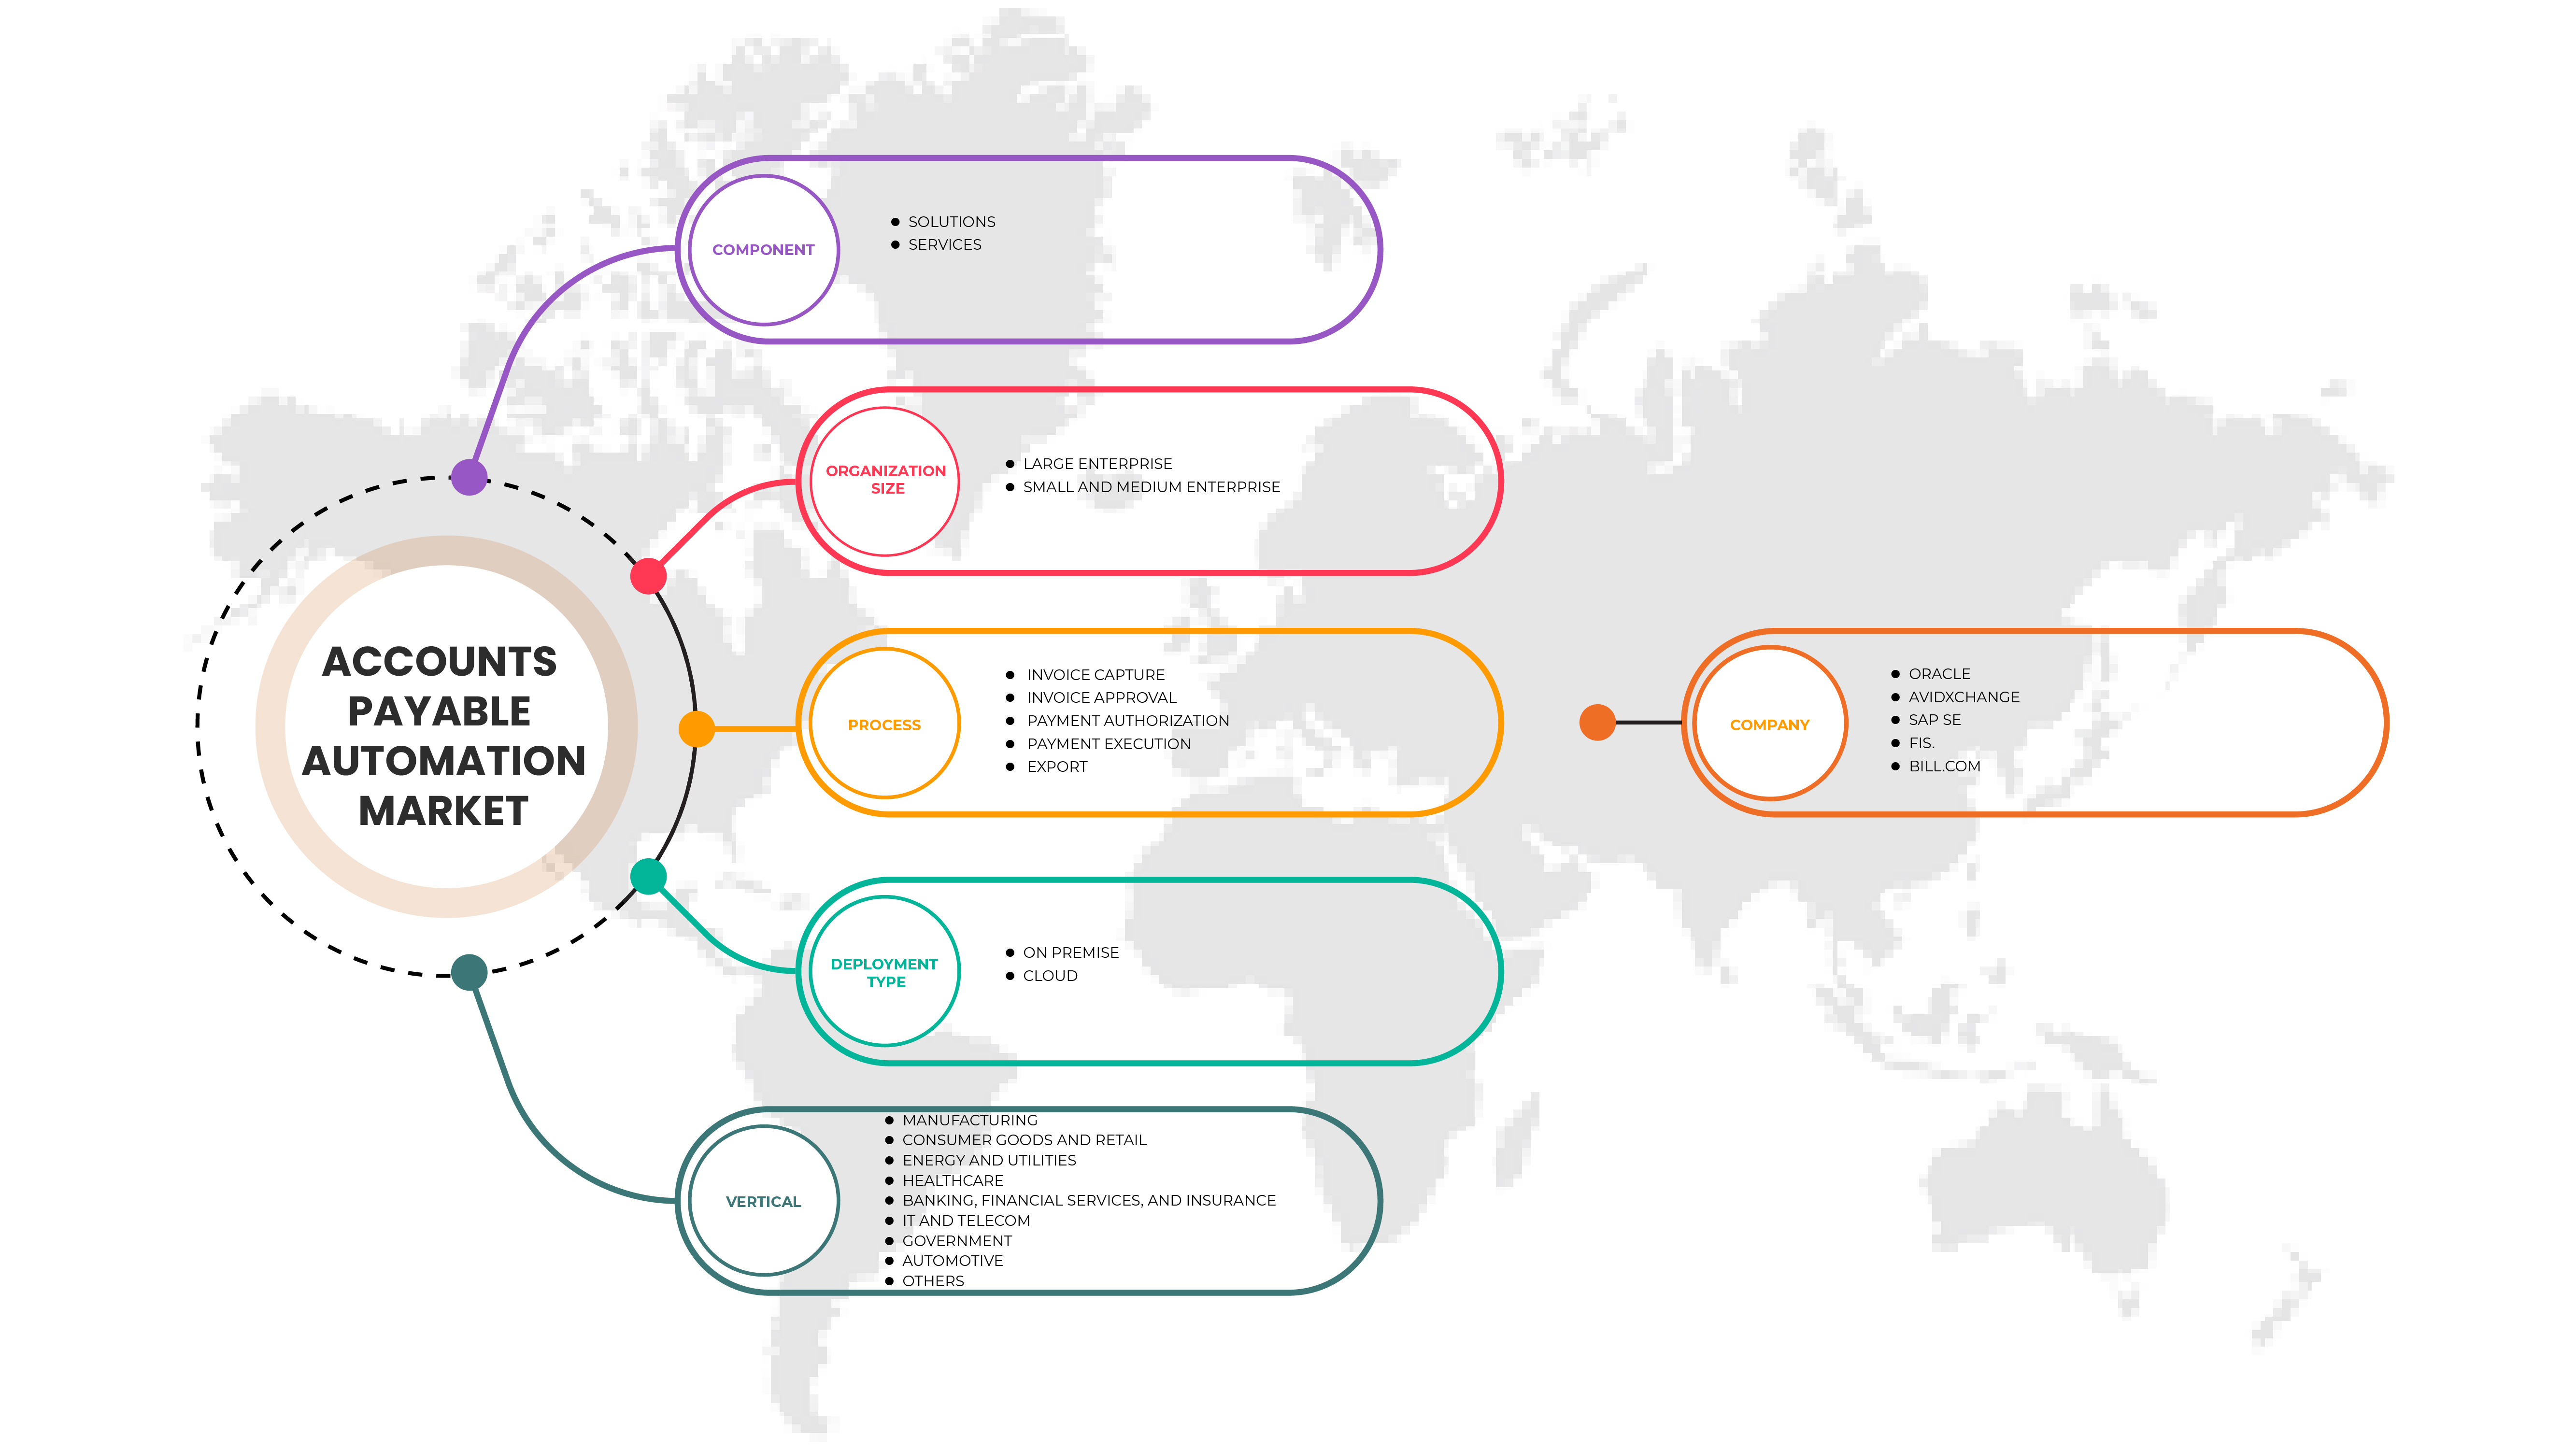
Sobre la base vertical, el mercado global de automatización de cuentas a pagar se ha segmentado en manufactura, bienes de consumo y venta minorista, energía y servicios públicos, atención médica, banca, servicios financieros y seguros, TI y telecomunicaciones, gobierno, automotriz y otros.
Análisis y perspectivas regionales del mercado global de automatización de cuentas por pagar
Se analiza el mercado global de automatización de cuentas a pagar y se proporcionan información y tendencias del tamaño del mercado por país, tamaño de la organización, componentes, modos de implementación, vertical y proceso como se menciona anteriormente.
Los países cubiertos en el informe del mercado global de automatización de cuentas a pagar son Sudáfrica, Arabia Saudita, Emiratos Árabes Unidos, Egipto, Israel, resto de Medio Oriente y África, EE. UU., Canadá, México, Alemania, Reino Unido, Francia, Italia, España, Rusia, Países Bajos, Bélgica, Suiza, Turquía, resto de Europa, China, Japón, India, Corea del Sur, Australia, Singapur, Tailandia, Malasia, Indonesia, Filipinas, resto de Asia-Pacífico, Brasil, Argentina y resto de Sudamérica.
América del Norte domina el mercado global de automatización de cuentas por pagar. Es probable que China sea el mercado global de automatización de cuentas por pagar de más rápido crecimiento. El creciente desarrollo de infraestructura, comercial e industrial en países emergentes como China y Estados Unidos se atribuye al predominio del mercado.
La sección de países del informe también proporciona factores individuales que impactan en el mercado y cambios en la regulación del mercado que afectan las tendencias actuales y futuras del mercado. Los puntos de datos como el análisis de la cadena de valor aguas abajo y aguas arriba, las tendencias técnicas, el análisis de las cinco fuerzas de Porter y los estudios de casos son algunos de los indicadores utilizados para pronosticar el escenario del mercado para países individuales. Además, la presencia y disponibilidad de marcas globales y sus desafíos afrontados debido a la competencia grande o escasa de las marcas locales y nacionales, el impacto de los aranceles nacionales y las rutas comerciales se consideran al proporcionar un análisis de pronóstico de los datos del país.
Análisis del panorama competitivo y de la cuota de mercado global de la automatización de cuentas por pagar
El panorama competitivo del mercado global de automatización de cuentas por pagar proporciona detalles de los competidores. Los detalles incluyen una descripción general de la empresa, las finanzas de la empresa, los ingresos generados, el potencial de mercado, la inversión en investigación y desarrollo, las nuevas iniciativas de mercado, la presencia global, los sitios e instalaciones de producción, las capacidades de producción, las fortalezas y debilidades de la empresa, el lanzamiento de productos, la amplitud y variedad de productos y el dominio de las aplicaciones. Los puntos de datos anteriores solo están relacionados con el enfoque de las empresas en la automatización global de cuentas por pagar.
Algunos de los principales actores que operan en el mercado global de automatización de cuentas a pagar son:
- SAP SE
- Corporación Oracle
- Grupo Sage plc,
- Tienda de campaña Tipalti Inc.
- Libros frescos
- Compañía Inc.
- Base aérea inc.
- Estado Islámico.
- Software de Coupa Inc.
- Comarca SA.
- Fuerza financiera
- Automatización MHC
- Tecnologías Procurify Inc.
- Corporación Zoho Pvt. Limitada.
- Árbol mineral
- Compañía de seguros Kofax Inc.
- Cambio de Avid
- Tecnologías Bottomline, Inc.
- TECNOLOGÍAS FLEETCOR, INC.
- Bill.com
SKU-
Obtenga acceso en línea al informe sobre la primera nube de inteligencia de mercado del mundo

- Panel de análisis de datos interactivo
- Panel de análisis de empresas para oportunidades con alto potencial de crecimiento
- Acceso de analista de investigación para personalización y consultas
- Análisis de la competencia con panel interactivo
- Últimas noticias, actualizaciones y análisis de tendencias
- Aproveche el poder del análisis de referencia para un seguimiento integral de la competencia
Tabla de contenido
1 INTRODUCTION
1.1 OBJECTIVES OF THE STUDY
1.2 MARKET DEFINITION
1.3 OVERVIEW OF GLOBAL ACCOUNTS PAYABLE AUTOMATION MARKET
1.4 CURRENCY AND PRICING
1.5 LIMITATIONS
1.6 MARKETS COVERED
2 MARKET SEGMENTATION
2.1 MARKETS COVERED
2.2 YEARS CONSIDERED FOR THE STUDY
2.3 GEOGRAPHIC SCOPE
2.4 DBMR TRIPOD DATA VALIDATION MODEL
2.5 PRIMARY INTERVIEWS WITH KEY OPINION LEADERS
2.6 DBMR MARKET POSITION GRID
2.7 VENDOR SHARE ANALYSIS
2.8 MARKET VERTICAL COVERAGE GRID
2.9 MULTIVARIATE MODELLING
2.1 COMPONENT CURVE
2.11 CHALLENGE MATRIX
2.12 SECONDARY SOURCES
2.13 ASSUMPTIONS
3 EXECUTIVE SUMMARY
4 PREMIUM INSIGHTS
5 REGIONAL SUMMARY: GLOBAL ACCOUNTS PAYABLE AUTOMATION MARKET
6 DBMR ANALYSIS
6.1 STRENGTH:
6.2 THREAT:
6.3 OPPORTUNITY:
6.4 WEAKNESS:
7 MARKET OVERVIEW
7.1 DRIVERS
7.1.1 GROWTH IN THE NEED TO DIGITIZE THE PAYMENT PROCESS AND REDUCTION IN INVOICE PROCESSING TIME
7.1.2 INCREASED DEMAND FOR ACCOUNTS PAYABLE AUTOMATION FOR BILL GENERATION
7.1.3 INCREASE IN THE USE OF ACCOUNTS PAYABLE PLATFORMS
7.2 RESTRAINTS
7.2.1 HIGHER COST FOR IMPLEMENTATION OF ACCOUNTS PAYABLE AUTOMATION SYSTEMS
7.2.2 RISE IN COMPLEXITY OF PAYABLE AUTOMATION SYSTEMS IN LARGE ENTERPRISES
7.3 OPPORTUNITIES
7.3.1 EMERGENCE OF AI, ML, AND RPA TECHNOLOGY TO HANDLE REPETITIVE AND LABOR-INTENSIVE TASK
7.3.2 ARTIFICIAL INTELLIGENCE (AI) AND MACHINE LEARNING (ML) APPLICATIONS
7.3.3 ROBOTIC PROCESS AUTOMATION (RPA)
7.3.4 ADOPTION OF CLOUD-BASED AUTOMATION PAYABLE SOLUTIONS
7.3.5 GOVERNMENT INITIATIVES TO DRIVE AUTOMATION AND DIGITALIZATION
7.4 CHALLENGES
7.4.1 INTEROPERABILITY OF MULTIPLE SYSTEM COMPONENTS FROM DIFFERENT SOLUTION PROVIDERS
7.4.2 LESS AWARENESS AMONG ORGANIZATIONS ABOUT THE VIRTUES OF AP AUTOMATION
8 GLOBAL ACCOUNTS PAYABLE AUTOMATION MARKET, BY COMPONENT
8.1 OVERVIEW
8.2 SOLUTIONS
8.3 SERVICES
8.3.1 MANAGED SERVICES
8.3.2 IMPLEMENTATION AND INTEGRATION
8.3.3 PROFESSIONAL SERVICES
8.3.4 SUPPORT AND MAINTENANCE
8.3.5 ADVISORY
9 GLOBAL ACCOUNTS PAYABLE AUTOMATION MARKET, BY ORGANIZATION SIZE
9.1 OVERVIEW
9.2 LARGE ENTERPRISE
9.3 SMALL AND MEDIUM ENTERPRISE
10 GLOBAL ACCOUNTS PAYABLE AUTOMATION MARKET, BY PROCESS
10.1 OVERVIEW
10.2 INVOICE CAPTURE
10.2.1 OPTICAL CHARACTER RECOGNITION (OCR)
10.2.2 COMPUTER VISION
10.2.3 INTELLIGENT DOCUMENT PROCESSING (IDP)
10.2.4 OTHERS
10.3 INVOICE APPROVAL
10.4 PAYMENT AUTHORIZATION
10.5 PAYMENT EXECUTION
10.6 EXPORT
11 GLOBAL ACCOUNTS PAYABLE AUTOMATION MARKET, BY DEPLOYMENT TYPE
11.1 OVERVIEW
11.2 ON PREMISE
11.3 CLOUD
11.3.1 PUBLIC
11.3.2 PRIVATE
12 GLOBAL ACCOUNTS PAYABLE AUTOMATION MARKET, BY VERTICAL
12.1 OVERVIEW
12.2 MANUFACTURING
12.3 CONSUMER GOODS AND RETAIL
12.4 ENERGY AND UTILITIES
12.5 HEALTHCARE
12.6 BANKING, FINANCIAL SERVICES, AND INSURANCE
12.7 IT AND TELECOM
12.8 GOVERNMENT
12.9 AUTOMOTIVE
12.1 OTHERS
13 GLOBAL ACCOUNTS PAYABLE AUTOMATION MARKET, BY REGION
13.1 OVERVIEW
13.2 NORTH AMERICA
13.2.1 U.S.
13.2.2 CANADA
13.2.3 MEXICO
13.3 EUROPE
13.3.1 U.K.
13.3.2 GERMANY
13.3.3 FRANCE
13.3.4 ITALY
13.3.5 SPAIN
13.3.6 RUSSIA
13.3.7 TURKEY
13.3.8 SWITZERLAND
13.3.9 NETHERLANDS
13.3.10 BELGIUM
13.3.11 REST OF EUROPE
13.4 ASIA-PACIFIC
13.4.1 CHINA
13.4.2 JAPAN
13.4.3 INDIA
13.4.4 SOUTH KOREA
13.4.5 AUSTRALIA
13.4.6 SINGAPORE
13.4.7 MALAYSIA
13.4.8 THAILAND
13.4.9 INDONESIA
13.4.10 PHILIPPINES
13.4.11 REST OF ASIA-PACIFIC
13.5 MIDDLE EAST AND AFRICA
13.5.1 U.A.E.
13.5.2 SOUTH AFRICA
13.5.3 SAUDI ARABIA
13.5.4 ISRAEL
13.5.5 EGYPT
13.5.6 REST OF MIDDLE EAST AND AFRICA
13.6 SOUTH AMERICA
13.6.1 BRAZIL
13.6.2 ARGENTINA
13.6.3 REST OF SOUTH AMERICA
14 GLOBAL ACCOUNTS PAYABLE AUTOMATION MARKET, COMPANY LANDSCAPE
14.1 COMPANY SHARE ANALYSIS: GLOBAL
14.2 COMPANY SHARE ANALYSIS: NORTH AMERICA
14.3 COMPANY SHARE ANALYSIS: EUROPE
14.4 COMPANY SHARE ANALYSIS: ASIA-PACIFIC
15 SWOT ANALYSIS
16 COMPANY PROFILE
16.1 ORACLE
16.1.1 COMPANY SNAPSHOT
16.1.2 REVENUE ANALYSIS
16.1.3 COMPANY SHARE ANALYSIS
16.1.4 PRODUCT PORTFOLIO
16.1.5 RECENT DEVELOPMENTS
16.2 AVIDXCHANGE
16.2.1 COMPANY SNAPSHOT
16.2.2 REVENUE ANALYSIS
16.2.3 PRODUCT PORTFOLIO
16.2.4 RECENT DEVELOPMENT
16.3 SAP SE
16.3.1 COMPANY SNAPSHOT
16.3.2 REVENUE ANALYSIS
16.3.3 COMPANY SHARE ANALYSIS
16.3.4 PRODUCT PORTFOLIO
16.3.5 RECENT DEVELOPMENTS
16.4 FIS.
16.4.1 COMPANY SNAPSHOT
16.4.2 REVENUE ANALYSIS
16.4.3 COMPANY SHARE ANALYSIS
16.4.4 SOLUTION PORTFOLIO
16.4.5 RECENT DEVELOPMENTS
16.5 BILL.COM
16.5.1 COMPANY SNAPSHOT
16.5.2 REVENUE ANALYSIS
16.5.3 COMPANY SHARE ANALYSIS
16.5.4 PRODUCT PORTFOLIO
16.5.5 RECENT DEVELOPMENT
16.6 AIRBASE INC.
16.6.1 COMPANY SNAPSHOT
16.6.2 PRODUCT PORTFOLIO
16.6.3 RECENT DEVELOPMENT
16.7 BOTTOMLINE TECHNOLOGIES, INC.
16.7.1 COMPANY SNAPSHOT
16.7.2 REVENUE ANALYSIS
16.7.3 PRODUCT PORTFOLIO
16.7.4 RECENT DEVELOPMENT
16.8 COMARCH SA.
16.8.1 COMPANY SNAPSHOT
16.8.2 REVENUE ANALYSIS
16.8.3 SOLUTION & PRODUCT PORTFOLIO
16.8.4 RECENT DEVELOPMENT
16.9 COUPA SOFTWARE INC.
16.9.1 COMPANY SNAPSHOT
16.9.2 REVENUE ANALYSIS
16.9.3 SOLUTION & PRODUCT PORTFOLIO
16.9.4 RECENT DEVELOPMENT
16.1 FINANCIALFORCE
16.10.1 COMPANY SNAPSHOT
16.10.2 PRODUCT PORTFOLIO
16.10.3 RECENT DEVELOPMENTS
16.11 FLEETCOR TECHNOLOGIES, INC.
16.11.1 COMPANY SNAPSHOT
16.11.2 REVENUE ANALYSIS
16.11.3 PRODUCT PORTFOLIO
16.11.4 RECENT DEVELOPMENT
16.12 FRESHBOOKS
16.12.1 COMPANY SNAPSHOT
16.12.2 PRODUCT PORTFOLIO
16.12.3 RECENT DEVELOPMENT
16.13 KOFAX INC.
16.13.1 COMPANY SNAPSHOT
16.13.2 PRODUCT PORTFOLIO
16.13.3 RECENT DEVELOPMENTS
16.14 MINERALTREE
16.14.1 COMPANY SNAPSHOT
16.14.2 PRODUCT PORTFOLIO
16.14.3 RECENT DEVELOPMENTS
16.15 MHC AUTOMATION
16.15.1 COMPANY SNAPSHOT
16.15.2 PRODUCT PORTFOLIO
16.15.3 RECENT DEVELOPMENTS
16.16 PROCURIFY TECHNOLOGIES INC.
16.16.1 COMPANY SNAPSHOT
16.16.2 PRODUCT PORTFOLIO
16.16.3 RECENT DEVELOPMENT
16.17 SAGE GROUP PLC
16.17.1 COMPANY SNAPSHOT
16.17.2 REVENUE ANALYSIS
16.17.3 SOLUTION PORTFOLIO
16.17.4 RECENT DEVELOPMENTS
16.18 TIPALTI INC.
16.18.1 COMPANY SNAPSHOT
16.18.2 SOLUTION PORTFOLIO
16.18.3 RECENT DEVELOPMENTS
16.19 ZOHO CORPORATION PVT. LTD.
16.19.1 COMPANY SNAPSHOT
16.19.2 PRODUCT PORTFOLIO
16.19.3 RECENT DEVELOPMENTS
16.2 ZYCUS INC.
16.20.1 COMPANY SNAPSHOT
16.20.2 SOLUTION PORTFOLIO
16.20.3 RECENT DEVELOPMENTS
17 QUESTIONNAIRE
18 RELATED REPORTS
Lista de Tablas
TABLE 1 GLOBAL ACCOUNTS PAYABLE AUTOMATION MARKET, BY COMPONENT, 2020-2029 (USD MILLION)
TABLE 2 GLOBAL SOLUTIONS IN ACCOUNTS PAYABLE AUTOMATION MARKET, BY REGION, 2020-2029 (USD MILLION)
TABLE 3 GLOBAL SERVICES IN ACCOUNTS PAYABLE AUTOMATION MARKET, BY REGION, 2020-2029 (USD MILLION)
TABLE 4 GLOBAL SERVICES IN ACCOUNTS PAYABLE AUTOMATION MARKET, BY TYPE, 2020-2029 (USD MILLION)
TABLE 5 GLOBAL ACCOUNTS PAYABLE AUTOMATION MARKET, BY ORGANIZATION SIZE, 2020-2029 (USD MILLION)
TABLE 6 GLOBAL LARGE ENTERPRISE IN ACCOUNTS PAYABLE AUTOMATION MARKET, BY REGION, 2020-2029 (USD MILLION)
TABLE 7 GLOBAL SMALL AND MEDIUM ENTERPRISE IN ACCOUNTS PAYABLE AUTOMATION MARKET, BY REGION, 2020-2029 (USD MILLION)
TABLE 8 GLOBAL ACCOUNTS PAYABLE AUTOMATION MARKET, BY PROCESS, 2020-2029 (USD MILLION)
TABLE 9 GLOBAL INVOICE CAPTURE IN ACCOUNTS PAYABLE AUTOMATION MARKET, BY REGION, 2020-2029 (USD MILLION)
TABLE 10 GLOBAL INVOICE CAPTURE IN ACCOUNTS PAYABLE AUTOMATION MARKET, BY METHOD, 2020-2029 (USD MILLION)
TABLE 11 GLOBAL INVOICE APPROVAL IN ACCOUNTS PAYABLE AUTOMATION MARKET, BY REGION, 2020-2029 (USD MILLION)
TABLE 12 GLOBAL PAYMENT AUTHORIZATION IN ACCOUNTS PAYABLE AUTOMATION MARKET, BY REGION, 2020-2029 (USD MILLION)
TABLE 13 GLOBAL PAYMENT EXECUTION IN ACCOUNTS PAYABLE AUTOMATION MARKET, BY REGION, 2020-2029 (USD MILLION)
TABLE 14 GLOBAL EXPORT IN ACCOUNTS PAYABLE AUTOMATION MARKET, BY REGION, 2020-2029 (USD MILLION)
TABLE 15 GLOBAL ACCOUNTS PAYABLE AUTOMATION MARKET, BY DEPLOYMENT TYPE, 2020-2029 (USD MILLION)
TABLE 16 GLOBAL ON PREMISE IN ACCOUNTS PAYABLE AUTOMATION MARKET, BY REGION, 2020-2029 (USD MILLION)
TABLE 17 GLOBAL CLOUD IN ACCOUNTS PAYABLE AUTOMATION MARKET, BY REGION, 2020-2029 (USD MILLION)
TABLE 18 GLOBAL CLOUD IN ACCOUNTS PAYABLE AUTOMATION MARKET, BY TYPE, 2020-2029 (USD MILLION)
TABLE 19 GLOBAL ACCOUNTS PAYABLE AUTOMATION MARKET, BY VERTICAL, 2020-2029 (USD MILLION)
TABLE 20 GLOBAL MANUFACTURING IN ACCOUNTS PAYABLE AUTOMATION MARKET, BY REGION, 2020-2029 (USD MILLION)
TABLE 21 GLOBAL CONSUMER GOODS AND RETAIL IN ACCOUNTS PAYABLE AUTOMATION MARKET, BY REGION, 2020-2029 (USD MILLION)
TABLE 22 GLOBAL ENERGY AND UTILITIES IN ACCOUNTS PAYABLE AUTOMATION MARKET, BY REGION, 2020-2029 (USD MILLION)
TABLE 23 GLOBAL HEALTHCARE IN ACCOUNTS PAYABLE AUTOMATION MARKET, BY REGION, 2020-2029 (USD MILLION)
TABLE 24 GLOBAL BANKING, FINANCIAL SERVICES, AND INSURANCE IN ACCOUNTS PAYABLE AUTOMATION MARKET, BY REGION, 2020-2029 (USD MILLION)
TABLE 25 GLOBAL IT AND TELECOM IN ACCOUNTS PAYABLE AUTOMATION MARKET, BY REGION, 2020-2029 (USD MILLION)
TABLE 26 GLOBAL GOVERNMENT IN ACCOUNTS PAYABLE AUTOMATION MARKET, BY REGION, 2020-2029 (USD MILLION)
TABLE 27 GLOBAL AUTOMOTIVE IN ACCOUNTS PAYABLE AUTOMATION MARKET, BY REGION, 2020-2029 (USD MILLION)
TABLE 28 GLOBAL OTHERS IN ACCOUNTS PAYABLE AUTOMATION MARKET, BY REGION, 2020-2029 (USD MILLION)
TABLE 29 GLOBAL ACCOUNTS PAYABLE AUTOMATION MARKET, BY REGION, 2020-2029 (USD MILLION)
TABLE 30 NORTH AMERICA ACCOUNTS PAYABLE AUTOMATION MARKET, BY COUNTRY, 2020-2029 (USD MILLION)
TABLE 31 NORTH AMERICA ACCOUNTS PAYABLE AUTOMATION MARKET, BY COMPONENT, 2020-2029 (USD MILLION)
TABLE 32 NORTH AMERICA SERVICES IN ACCOUNTS PAYABLE AUTOMATION MARKET, BY TYPE, 2020-2029 (USD MILLION)
TABLE 33 NORTH AMERICA ACCOUNTS PAYABLE AUTOMATION MARKET, BY ORGANIZATION SIZE, 2020-2029 (USD MILLION)
TABLE 34 NORTH AMERICA ACCOUNTS PAYABLE AUTOMATION MARKET, BY PROCESS, 2020-2029 (USD MILLION)
TABLE 35 NORTH AMERICA INVOICE CAPTURE IN ACCOUNTS PAYABLE AUTOMATION MARKET, BY METHOD, 2020-2029 (USD MILLION)
TABLE 36 NORTH AMERICA ACCOUNTS PAYABLE AUTOMATION MARKET, BY DEPLOYMENT TYPE, 2020-2029 (USD MILLION)
TABLE 37 NORTH AMERICA CLOUD IN ACCOUNTS PAYABLE AUTOMATION MARKET, BY TYPE, 2020-2029 (USD MILLION)
TABLE 38 NORTH AMERICA ACCOUNTS PAYABLE AUTOMATION MARKET, BY VERTICAL, 2020-2029 (USD MILLION)
TABLE 39 U.S. ACCOUNTS PAYABLE AUTOMATION MARKET, BY COMPONENT, 2020-2029 (USD MILLION)
TABLE 40 U.S. SERVICES IN ACCOUNTS PAYABLE AUTOMATION MARKET, BY TYPE, 2020-2029 (USD MILLION)
TABLE 41 U.S. ACCOUNTS PAYABLE AUTOMATION MARKET, BY ORGANIZATION SIZE, 2020-2029 (USD MILLION)
TABLE 42 U.S. ACCOUNTS PAYABLE AUTOMATION MARKET, BY PROCESS, 2020-2029 (USD MILLION)
TABLE 43 U.S. INVOICE CAPTURE IN ACCOUNTS PAYABLE AUTOMATION MARKET, BY METHOD, 2020-2029 (USD MILLION)
TABLE 44 U.S. ACCOUNTS PAYABLE AUTOMATION MARKET, BY DEPLOYMENT TYPE, 2020-2029 (USD MILLION)
TABLE 45 U.S. CLOUD IN ACCOUNTS PAYABLE AUTOMATION MARKET, BY TYPE, 2020-2029 (USD MILLION)
TABLE 46 U.S. ACCOUNTS PAYABLE AUTOMATION MARKET, BY VERTICAL, 2020-2029 (USD MILLION)
TABLE 47 CANADA ACCOUNTS PAYABLE AUTOMATION MARKET, BY COMPONENT, 2020-2029 (USD MILLION)
TABLE 48 CANADA SERVICES IN ACCOUNTS PAYABLE AUTOMATION MARKET, BY TYPE, 2020-2029 (USD MILLION)
TABLE 49 CANADA ACCOUNTS PAYABLE AUTOMATION MARKET, BY ORGANIZATION SIZE, 2020-2029 (USD MILLION)
TABLE 50 CANADA ACCOUNTS PAYABLE AUTOMATION MARKET, BY PROCESS, 2020-2029 (USD MILLION)
TABLE 51 CANADA INVOICE CAPTURE IN ACCOUNTS PAYABLE AUTOMATION MARKET, BY METHOD, 2020-2029 (USD MILLION)
TABLE 52 CANADA ACCOUNTS PAYABLE AUTOMATION MARKET, BY DEPLOYMENT TYPE, 2020-2029 (USD MILLION)
TABLE 53 CANADA CLOUD IN ACCOUNTS PAYABLE AUTOMATION MARKET, BY TYPE, 2020-2029 (USD MILLION)
TABLE 54 CANADA ACCOUNTS PAYABLE AUTOMATION MARKET, BY VERTICAL, 2020-2029 (USD MILLION)
TABLE 55 MEXICO ACCOUNTS PAYABLE AUTOMATION MARKET, BY COMPONENT, 2020-2029 (USD MILLION)
TABLE 56 MEXICO SERVICES IN ACCOUNTS PAYABLE AUTOMATION MARKET, BY TYPE, 2020-2029 (USD MILLION)
TABLE 57 MEXICO ACCOUNTS PAYABLE AUTOMATION MARKET, BY ORGANIZATION SIZE, 2020-2029 (USD MILLION)
TABLE 58 MEXICO ACCOUNTS PAYABLE AUTOMATION MARKET, BY PROCESS, 2020-2029 (USD MILLION)
TABLE 59 MEXICO INVOICE CAPTURE IN ACCOUNTS PAYABLE AUTOMATION MARKET, BY METHOD, 2020-2029 (USD MILLION)
TABLE 60 MEXICO ACCOUNTS PAYABLE AUTOMATION MARKET, BY DEPLOYMENT TYPE, 2020-2029 (USD MILLION)
TABLE 61 MEXICO CLOUD IN ACCOUNTS PAYABLE AUTOMATION MARKET, BY TYPE, 2020-2029 (USD MILLION)
TABLE 62 MEXICO ACCOUNTS PAYABLE AUTOMATION MARKET, BY VERTICAL, 2020-2029 (USD MILLION)
TABLE 63 EUROPE ACCOUNTS PAYABLE AUTOMATION MARKET, BY COUNTRY, 2020-2029 (USD MILLION)
TABLE 64 EUROPE ACCOUNTS PAYABLE AUTOMATION MARKET, BY COMPONENT, 2020-2029 (USD MILLION)
TABLE 65 EUROPE SERVICES IN ACCOUNTS PAYABLE AUTOMATION MARKET, BY TYPE, 2020-2029 (USD MILLION)
TABLE 66 EUROPE ACCOUNTS PAYABLE AUTOMATION MARKET, BY ORGANIZATION SIZE, 2020-2029 (USD MILLION)
TABLE 67 EUROPE ACCOUNTS PAYABLE AUTOMATION MARKET, BY PROCESS, 2020-2029 (USD MILLION)
TABLE 68 EUROPE INVOICE CAPTURE IN ACCOUNTS PAYABLE AUTOMATION MARKET, BY METHOD, 2020-2029 (USD MILLION)
TABLE 69 EUROPE ACCOUNTS PAYABLE AUTOMATION MARKET, BY DEPLOYMENT TYPE, 2020-2029 (USD MILLION)
TABLE 70 EUROPE CLOUD IN ACCOUNTS PAYABLE AUTOMATION MARKET, BY TYPE, 2020-2029 (USD MILLION)
TABLE 71 EUROPE ACCOUNTS PAYABLE AUTOMATION MARKET, BY VERTICAL, 2020-2029 (USD MILLION)
TABLE 72 U.K. ACCOUNTS PAYABLE AUTOMATION MARKET, BY COMPONENT, 2020-2029 (USD MILLION)
TABLE 73 U.K. SERVICES IN ACCOUNTS PAYABLE AUTOMATION MARKET, BY TYPE, 2020-2029 (USD MILLION)
TABLE 74 U.K. ACCOUNTS PAYABLE AUTOMATION MARKET, BY ORGANIZATION SIZE, 2020-2029 (USD MILLION)
TABLE 75 U.K. ACCOUNTS PAYABLE AUTOMATION MARKET, BY PROCESS, 2020-2029 (USD MILLION)
TABLE 76 U.K. INVOICE CAPTURE IN ACCOUNTS PAYABLE AUTOMATION MARKET, BY METHOD, 2020-2029 (USD MILLION)
TABLE 77 U.K. ACCOUNTS PAYABLE AUTOMATION MARKET, BY DEPLOYMENT TYPE, 2020-2029 (USD MILLION)
TABLE 78 U.K. CLOUD IN ACCOUNTS PAYABLE AUTOMATION MARKET, BY TYPE, 2020-2029 (USD MILLION)
TABLE 79 U.K. ACCOUNTS PAYABLE AUTOMATION MARKET, BY VERTICAL, 2020-2029 (USD MILLION)
TABLE 80 GERMANY ACCOUNTS PAYABLE AUTOMATION MARKET, BY COMPONENT, 2020-2029 (USD MILLION)
TABLE 81 GERMANY SERVICES IN ACCOUNTS PAYABLE AUTOMATION MARKET, BY TYPE, 2020-2029 (USD MILLION)
TABLE 82 GERMANY ACCOUNTS PAYABLE AUTOMATION MARKET, BY ORGANIZATION SIZE, 2020-2029 (USD MILLION)
TABLE 83 GERMANY ACCOUNTS PAYABLE AUTOMATION MARKET, BY PROCESS, 2020-2029 (USD MILLION)
TABLE 84 GERMANY INVOICE CAPTURE IN ACCOUNTS PAYABLE AUTOMATION MARKET, BY METHOD, 2020-2029 (USD MILLION)
TABLE 85 GERMANY ACCOUNTS PAYABLE AUTOMATION MARKET, BY DEPLOYMENT TYPE, 2020-2029 (USD MILLION)
TABLE 86 GERMANY CLOUD IN ACCOUNTS PAYABLE AUTOMATION MARKET, BY TYPE, 2020-2029 (USD MILLION)
TABLE 87 GERMANY ACCOUNTS PAYABLE AUTOMATION MARKET, BY VERTICAL, 2020-2029 (USD MILLION)
TABLE 88 FRANCE ACCOUNTS PAYABLE AUTOMATION MARKET, BY COMPONENT, 2020-2029 (USD MILLION)
TABLE 89 FRANCE SERVICES IN ACCOUNTS PAYABLE AUTOMATION MARKET, BY TYPE, 2020-2029 (USD MILLION)
TABLE 90 FRANCE ACCOUNTS PAYABLE AUTOMATION MARKET, BY ORGANIZATION SIZE, 2020-2029 (USD MILLION)
TABLE 91 FRANCE ACCOUNTS PAYABLE AUTOMATION MARKET, BY PROCESS, 2020-2029 (USD MILLION)
TABLE 92 FRANCE INVOICE CAPTURE IN ACCOUNTS PAYABLE AUTOMATION MARKET, BY METHOD, 2020-2029 (USD MILLION)
TABLE 93 FRANCE ACCOUNTS PAYABLE AUTOMATION MARKET, BY DEPLOYMENT TYPE, 2020-2029 (USD MILLION)
TABLE 94 FRANCE CLOUD IN ACCOUNTS PAYABLE AUTOMATION MARKET, BY TYPE, 2020-2029 (USD MILLION)
TABLE 95 FRANCE ACCOUNTS PAYABLE AUTOMATION MARKET, BY VERTICAL, 2020-2029 (USD MILLION)
TABLE 96 ITALY ACCOUNTS PAYABLE AUTOMATION MARKET, BY COMPONENT, 2020-2029 (USD MILLION)
TABLE 97 ITALY SERVICES IN ACCOUNTS PAYABLE AUTOMATION MARKET, BY TYPE, 2020-2029 (USD MILLION)
TABLE 98 ITALY ACCOUNTS PAYABLE AUTOMATION MARKET, BY ORGANIZATION SIZE, 2020-2029 (USD MILLION)
TABLE 99 ITALY ACCOUNTS PAYABLE AUTOMATION MARKET, BY PROCESS, 2020-2029 (USD MILLION)
TABLE 100 ITALY INVOICE CAPTURE IN ACCOUNTS PAYABLE AUTOMATION MARKET, BY METHOD, 2020-2029 (USD MILLION)
TABLE 101 ITALY ACCOUNTS PAYABLE AUTOMATION MARKET, BY DEPLOYMENT TYPE, 2020-2029 (USD MILLION)
TABLE 102 ITALY CLOUD IN ACCOUNTS PAYABLE AUTOMATION MARKET, BY TYPE, 2020-2029 (USD MILLION)
TABLE 103 ITALY ACCOUNTS PAYABLE AUTOMATION MARKET, BY VERTICAL, 2020-2029 (USD MILLION)
TABLE 104 SPAIN ACCOUNTS PAYABLE AUTOMATION MARKET, BY COMPONENT, 2020-2029 (USD MILLION)
TABLE 105 SPAIN SERVICES IN ACCOUNTS PAYABLE AUTOMATION MARKET, BY TYPE, 2020-2029 (USD MILLION)
TABLE 106 SPAIN ACCOUNTS PAYABLE AUTOMATION MARKET, BY ORGANIZATION SIZE, 2020-2029 (USD MILLION)
TABLE 107 SPAIN ACCOUNTS PAYABLE AUTOMATION MARKET, BY PROCESS, 2020-2029 (USD MILLION)
TABLE 108 SPAIN INVOICE CAPTURE IN ACCOUNTS PAYABLE AUTOMATION MARKET, BY METHOD, 2020-2029 (USD MILLION)
TABLE 109 SPAIN ACCOUNTS PAYABLE AUTOMATION MARKET, BY DEPLOYMENT TYPE, 2020-2029 (USD MILLION)
TABLE 110 SPAIN CLOUD IN ACCOUNTS PAYABLE AUTOMATION MARKET, BY TYPE, 2020-2029 (USD MILLION)
TABLE 111 SPAIN ACCOUNTS PAYABLE AUTOMATION MARKET, BY VERTICAL, 2020-2029 (USD MILLION)
TABLE 112 RUSSIA ACCOUNTS PAYABLE AUTOMATION MARKET, BY COMPONENT, 2020-2029 (USD MILLION)
TABLE 113 RUSSIA SERVICES IN ACCOUNTS PAYABLE AUTOMATION MARKET, BY TYPE, 2020-2029 (USD MILLION)
TABLE 114 RUSSIA ACCOUNTS PAYABLE AUTOMATION MARKET, BY ORGANIZATION SIZE, 2020-2029 (USD MILLION)
TABLE 115 RUSSIA ACCOUNTS PAYABLE AUTOMATION MARKET, BY PROCESS, 2020-2029 (USD MILLION)
TABLE 116 RUSSIA INVOICE CAPTURE IN ACCOUNTS PAYABLE AUTOMATION MARKET, BY METHOD, 2020-2029 (USD MILLION)
TABLE 117 RUSSIA ACCOUNTS PAYABLE AUTOMATION MARKET, BY DEPLOYMENT TYPE, 2020-2029 (USD MILLION)
TABLE 118 RUSSIA CLOUD IN ACCOUNTS PAYABLE AUTOMATION MARKET, BY TYPE, 2020-2029 (USD MILLION)
TABLE 119 RUSSIA ACCOUNTS PAYABLE AUTOMATION MARKET, BY VERTICAL, 2020-2029 (USD MILLION)
TABLE 120 TURKEY ACCOUNTS PAYABLE AUTOMATION MARKET, BY COMPONENT, 2020-2029 (USD MILLION)
TABLE 121 TURKEY SERVICES IN ACCOUNTS PAYABLE AUTOMATION MARKET, BY TYPE, 2020-2029 (USD MILLION)
TABLE 122 TURKEY ACCOUNTS PAYABLE AUTOMATION MARKET, BY ORGANIZATION SIZE, 2020-2029 (USD MILLION)
TABLE 123 TURKEY ACCOUNTS PAYABLE AUTOMATION MARKET, BY PROCESS, 2020-2029 (USD MILLION)
TABLE 124 TURKEY INVOICE CAPTURE IN ACCOUNTS PAYABLE AUTOMATION MARKET, BY METHOD, 2020-2029 (USD MILLION)
TABLE 125 TURKEY ACCOUNTS PAYABLE AUTOMATION MARKET, BY DEPLOYMENT TYPE, 2020-2029 (USD MILLION)
TABLE 126 TURKEY CLOUD IN ACCOUNTS PAYABLE AUTOMATION MARKET, BY TYPE, 2020-2029 (USD MILLION)
TABLE 127 TURKEY ACCOUNTS PAYABLE AUTOMATION MARKET, BY VERTICAL, 2020-2029 (USD MILLION)
TABLE 128 SWITZERLAND ACCOUNTS PAYABLE AUTOMATION MARKET, BY COMPONENT, 2020-2029 (USD MILLION)
TABLE 129 SWITZERLAND SERVICES IN ACCOUNTS PAYABLE AUTOMATION MARKET, BY TYPE, 2020-2029 (USD MILLION)
TABLE 130 SWITZERLAND ACCOUNTS PAYABLE AUTOMATION MARKET, BY ORGANIZATION SIZE, 2020-2029 (USD MILLION)
TABLE 131 SWITZERLAND ACCOUNTS PAYABLE AUTOMATION MARKET, BY PROCESS, 2020-2029 (USD MILLION)
TABLE 132 SWITZERLAND INVOICE CAPTURE IN ACCOUNTS PAYABLE AUTOMATION MARKET, BY METHOD, 2020-2029 (USD MILLION)
TABLE 133 SWITZERLAND ACCOUNTS PAYABLE AUTOMATION MARKET, BY DEPLOYMENT TYPE, 2020-2029 (USD MILLION)
TABLE 134 SWITZERLAND CLOUD IN ACCOUNTS PAYABLE AUTOMATION MARKET, BY TYPE, 2020-2029 (USD MILLION)
TABLE 135 SWITZERLAND ACCOUNTS PAYABLE AUTOMATION MARKET, BY VERTICAL, 2020-2029 (USD MILLION)
TABLE 136 NETHERLANDS ACCOUNTS PAYABLE AUTOMATION MARKET, BY COMPONENT, 2020-2029 (USD MILLION)
TABLE 137 NETHERLANDS SERVICES IN ACCOUNTS PAYABLE AUTOMATION MARKET, BY TYPE, 2020-2029 (USD MILLION)
TABLE 138 NETHERLANDS ACCOUNTS PAYABLE AUTOMATION MARKET, BY ORGANIZATION SIZE, 2020-2029 (USD MILLION)
TABLE 139 NETHERLANDS ACCOUNTS PAYABLE AUTOMATION MARKET, BY PROCESS, 2020-2029 (USD MILLION)
TABLE 140 NETHERLANDS INVOICE CAPTURE IN ACCOUNTS PAYABLE AUTOMATION MARKET, BY METHOD, 2020-2029 (USD MILLION)
TABLE 141 NETHERLANDS ACCOUNTS PAYABLE AUTOMATION MARKET, BY DEPLOYMENT TYPE, 2020-2029 (USD MILLION)
TABLE 142 NETHERLANDS CLOUD IN ACCOUNTS PAYABLE AUTOMATION MARKET, BY TYPE, 2020-2029 (USD MILLION)
TABLE 143 NETHERLANDS ACCOUNTS PAYABLE AUTOMATION MARKET, BY VERTICAL, 2020-2029 (USD MILLION)
TABLE 144 BELGIUM ACCOUNTS PAYABLE AUTOMATION MARKET, BY COMPONENT, 2020-2029 (USD MILLION)
TABLE 145 BELGIUM SERVICES IN ACCOUNTS PAYABLE AUTOMATION MARKET, BY TYPE, 2020-2029 (USD MILLION)
TABLE 146 BELGIUM ACCOUNTS PAYABLE AUTOMATION MARKET, BY ORGANIZATION SIZE, 2020-2029 (USD MILLION)
TABLE 147 BELGIUM ACCOUNTS PAYABLE AUTOMATION MARKET, BY PROCESS, 2020-2029 (USD MILLION)
TABLE 148 BELGIUM INVOICE CAPTURE IN ACCOUNTS PAYABLE AUTOMATION MARKET, BY METHOD, 2020-2029 (USD MILLION)
TABLE 149 BELGIUM ACCOUNTS PAYABLE AUTOMATION MARKET, BY DEPLOYMENT TYPE, 2020-2029 (USD MILLION)
TABLE 150 BELGIUM CLOUD IN ACCOUNTS PAYABLE AUTOMATION MARKET, BY TYPE, 2020-2029 (USD MILLION)
TABLE 151 BELGIUM ACCOUNTS PAYABLE AUTOMATION MARKET, BY VERTICAL, 2020-2029 (USD MILLION)
TABLE 152 REST OF EUROPE ACCOUNTS PAYABLE AUTOMATION MARKET, BY COMPONENT, 2020-2029 (USD MILLION)
TABLE 153 ASIA-PACIFIC ACCOUNTS PAYABLE AUTOMATION MARKET, BY COUNTRY, 2020-2029 (USD MILLION)
TABLE 154 ASIA-PACIFIC ACCOUNTS PAYABLE AUTOMATION MARKET, BY COMPONENT, 2020-2029 (USD MILLION)
TABLE 155 ASIA-PACIFIC SERVICES IN ACCOUNTS PAYABLE AUTOMATION MARKET, BY TYPE, 2020-2029 (USD MILLION)
TABLE 156 ASIA-PACIFIC ACCOUNTS PAYABLE AUTOMATION MARKET, BY ORGANIZATION SIZE, 2020-2029 (USD MILLION)
TABLE 157 ASIA-PACIFIC ACCOUNTS PAYABLE AUTOMATION MARKET, BY PROCESS, 2020-2029 (USD MILLION)
TABLE 158 ASIA-PACIFIC INVOICE CAPTURE IN ACCOUNTS PAYABLE AUTOMATION MARKET, BY METHOD, 2020-2029 (USD MILLION)
TABLE 159 ASIA-PACIFIC ACCOUNTS PAYABLE AUTOMATION MARKET, BY DEPLOYMENT TYPE, 2020-2029 (USD MILLION)
TABLE 160 ASIA-PACIFIC CLOUD IN ACCOUNTS PAYABLE AUTOMATION MARKET, BY TYPE, 2020-2029 (USD MILLION)
TABLE 161 ASIA-PACIFIC ACCOUNTS PAYABLE AUTOMATION MARKET, BY VERTICAL, 2020-2029 (USD MILLION)
TABLE 162 CHINA ACCOUNTS PAYABLE AUTOMATION MARKET, BY COMPONENT, 2020-2029 (USD MILLION)
TABLE 163 CHINA SERVICES IN ACCOUNTS PAYABLE AUTOMATION MARKET, BY TYPE, 2020-2029 (USD MILLION)
TABLE 164 CHINA ACCOUNTS PAYABLE AUTOMATION MARKET, BY ORGANIZATION SIZE, 2020-2029 (USD MILLION)
TABLE 165 CHINA ACCOUNTS PAYABLE AUTOMATION MARKET, BY PROCESS, 2020-2029 (USD MILLION)
TABLE 166 CHINA INVOICE CAPTURE IN ACCOUNTS PAYABLE AUTOMATION MARKET, BY METHOD, 2020-2029 (USD MILLION)
TABLE 167 CHINA ACCOUNTS PAYABLE AUTOMATION MARKET, BY DEPLOYMENT TYPE, 2020-2029 (USD MILLION)
TABLE 168 CHINA CLOUD IN ACCOUNTS PAYABLE AUTOMATION MARKET, BY TYPE, 2020-2029 (USD MILLION)
TABLE 169 CHINA ACCOUNTS PAYABLE AUTOMATION MARKET, BY VERTICAL, 2020-2029 (USD MILLION)
TABLE 170 JAPAN ACCOUNTS PAYABLE AUTOMATION MARKET, BY COMPONENT, 2020-2029 (USD MILLION)
TABLE 171 JAPAN SERVICES IN ACCOUNTS PAYABLE AUTOMATION MARKET, BY TYPE, 2020-2029 (USD MILLION)
TABLE 172 JAPAN ACCOUNTS PAYABLE AUTOMATION MARKET, BY ORGANIZATION SIZE, 2020-2029 (USD MILLION)
TABLE 173 JAPAN ACCOUNTS PAYABLE AUTOMATION MARKET, BY PROCESS, 2020-2029 (USD MILLION)
TABLE 174 JAPAN INVOICE CAPTURE IN ACCOUNTS PAYABLE AUTOMATION MARKET, BY METHOD, 2020-2029 (USD MILLION)
TABLE 175 JAPAN ACCOUNTS PAYABLE AUTOMATION MARKET, BY DEPLOYMENT TYPE, 2020-2029 (USD MILLION)
TABLE 176 JAPAN CLOUD IN ACCOUNTS PAYABLE AUTOMATION MARKET, BY TYPE, 2020-2029 (USD MILLION)
TABLE 177 JAPAN ACCOUNTS PAYABLE AUTOMATION MARKET, BY VERTICAL, 2020-2029 (USD MILLION)
TABLE 178 INDIA ACCOUNTS PAYABLE AUTOMATION MARKET, BY COMPONENT, 2020-2029 (USD MILLION)
TABLE 179 INDIA SERVICES IN ACCOUNTS PAYABLE AUTOMATION MARKET, BY TYPE, 2020-2029 (USD MILLION)
TABLE 180 INDIA ACCOUNTS PAYABLE AUTOMATION MARKET, BY ORGANIZATION SIZE, 2020-2029 (USD MILLION)
TABLE 181 INDIA ACCOUNTS PAYABLE AUTOMATION MARKET, BY PROCESS, 2020-2029 (USD MILLION)
TABLE 182 INDIA INVOICE CAPTURE IN ACCOUNTS PAYABLE AUTOMATION MARKET, BY METHOD, 2020-2029 (USD MILLION)
TABLE 183 INDIA ACCOUNTS PAYABLE AUTOMATION MARKET, BY DEPLOYMENT TYPE, 2020-2029 (USD MILLION)
TABLE 184 INDIA CLOUD IN ACCOUNTS PAYABLE AUTOMATION MARKET, BY TYPE, 2020-2029 (USD MILLION)
TABLE 185 INDIA ACCOUNTS PAYABLE AUTOMATION MARKET, BY VERTICAL, 2020-2029 (USD MILLION)
TABLE 186 SOUTH KOREA ACCOUNTS PAYABLE AUTOMATION MARKET, BY COMPONENT, 2020-2029 (USD MILLION)
TABLE 187 SOUTH KOREA SERVICES IN ACCOUNTS PAYABLE AUTOMATION MARKET, BY TYPE, 2020-2029 (USD MILLION)
TABLE 188 SOUTH KOREA ACCOUNTS PAYABLE AUTOMATION MARKET, BY ORGANIZATION SIZE, 2020-2029 (USD MILLION)
TABLE 189 SOUTH KOREA ACCOUNTS PAYABLE AUTOMATION MARKET, BY PROCESS, 2020-2029 (USD MILLION)
TABLE 190 SOUTH KOREA INVOICE CAPTURE IN ACCOUNTS PAYABLE AUTOMATION MARKET, BY METHOD, 2020-2029 (USD MILLION)
TABLE 191 SOUTH KOREA ACCOUNTS PAYABLE AUTOMATION MARKET, BY DEPLOYMENT TYPE, 2020-2029 (USD MILLION)
TABLE 192 SOUTH KOREA CLOUD IN ACCOUNTS PAYABLE AUTOMATION MARKET, BY TYPE, 2020-2029 (USD MILLION)
TABLE 193 SOUTH KOREA ACCOUNTS PAYABLE AUTOMATION MARKET, BY VERTICAL, 2020-2029 (USD MILLION)
TABLE 194 AUSTRALIA ACCOUNTS PAYABLE AUTOMATION MARKET, BY COMPONENT, 2020-2029 (USD MILLION)
TABLE 195 AUSTRALIA SERVICES IN ACCOUNTS PAYABLE AUTOMATION MARKET, BY TYPE, 2020-2029 (USD MILLION)
TABLE 196 AUSTRALIA ACCOUNTS PAYABLE AUTOMATION MARKET, BY ORGANIZATION SIZE, 2020-2029 (USD MILLION)
TABLE 197 AUSTRALIA ACCOUNTS PAYABLE AUTOMATION MARKET, BY PROCESS, 2020-2029 (USD MILLION)
TABLE 198 AUSTRALIA INVOICE CAPTURE IN ACCOUNTS PAYABLE AUTOMATION MARKET, BY METHOD, 2020-2029 (USD MILLION)
TABLE 199 AUSTRALIA ACCOUNTS PAYABLE AUTOMATION MARKET, BY DEPLOYMENT TYPE, 2020-2029 (USD MILLION)
TABLE 200 AUSTRALIA CLOUD IN ACCOUNTS PAYABLE AUTOMATION MARKET, BY TYPE, 2020-2029 (USD MILLION)
TABLE 201 AUSTRALIA ACCOUNTS PAYABLE AUTOMATION MARKET, BY VERTICAL, 2020-2029 (USD MILLION)
TABLE 202 SINGAPORE ACCOUNTS PAYABLE AUTOMATION MARKET, BY COMPONENT, 2020-2029 (USD MILLION)
TABLE 203 SINGAPORE SERVICES IN ACCOUNTS PAYABLE AUTOMATION MARKET, BY TYPE, 2020-2029 (USD MILLION)
TABLE 204 SINGAPORE ACCOUNTS PAYABLE AUTOMATION MARKET, BY ORGANIZATION SIZE, 2020-2029 (USD MILLION)
TABLE 205 SINGAPORE ACCOUNTS PAYABLE AUTOMATION MARKET, BY PROCESS, 2020-2029 (USD MILLION)
TABLE 206 SINGAPORE INVOICE CAPTURE IN ACCOUNTS PAYABLE AUTOMATION MARKET, BY METHOD, 2020-2029 (USD MILLION)
TABLE 207 SINGAPORE ACCOUNTS PAYABLE AUTOMATION MARKET, BY DEPLOYMENT TYPE, 2020-2029 (USD MILLION)
TABLE 208 SINGAPORE CLOUD IN ACCOUNTS PAYABLE AUTOMATION MARKET, BY TYPE, 2020-2029 (USD MILLION)
TABLE 209 SINGAPORE ACCOUNTS PAYABLE AUTOMATION MARKET, BY VERTICAL, 2020-2029 (USD MILLION)
TABLE 210 MALAYSIA ACCOUNTS PAYABLE AUTOMATION MARKET, BY COMPONENT, 2020-2029 (USD MILLION)
TABLE 211 MALAYSIA SERVICES IN ACCOUNTS PAYABLE AUTOMATION MARKET, BY TYPE, 2020-2029 (USD MILLION)
TABLE 212 MALAYSIA ACCOUNTS PAYABLE AUTOMATION MARKET, BY ORGANIZATION SIZE, 2020-2029 (USD MILLION)
TABLE 213 MALAYSIA ACCOUNTS PAYABLE AUTOMATION MARKET, BY PROCESS, 2020-2029 (USD MILLION)
TABLE 214 MALAYSIA INVOICE CAPTURE IN ACCOUNTS PAYABLE AUTOMATION MARKET, BY METHOD, 2020-2029 (USD MILLION)
TABLE 215 MALAYSIA ACCOUNTS PAYABLE AUTOMATION MARKET, BY DEPLOYMENT TYPE, 2020-2029 (USD MILLION)
TABLE 216 MALAYSIA CLOUD IN ACCOUNTS PAYABLE AUTOMATION MARKET, BY TYPE, 2020-2029 (USD MILLION)
TABLE 217 MALAYSIA ACCOUNTS PAYABLE AUTOMATION MARKET, BY VERTICAL, 2020-2029 (USD MILLION)
TABLE 218 THAILAND ACCOUNTS PAYABLE AUTOMATION MARKET, BY COMPONENT, 2020-2029 (USD MILLION)
TABLE 219 THAILAND SERVICES IN ACCOUNTS PAYABLE AUTOMATION MARKET, BY TYPE, 2020-2029 (USD MILLION)
TABLE 220 THAILAND ACCOUNTS PAYABLE AUTOMATION MARKET, BY ORGANIZATION SIZE, 2020-2029 (USD MILLION)
TABLE 221 THAILAND ACCOUNTS PAYABLE AUTOMATION MARKET, BY PROCESS, 2020-2029 (USD MILLION)
TABLE 222 THAILAND INVOICE CAPTURE IN ACCOUNTS PAYABLE AUTOMATION MARKET, BY METHOD, 2020-2029 (USD MILLION)
TABLE 223 THAILAND ACCOUNTS PAYABLE AUTOMATION MARKET, BY DEPLOYMENT TYPE, 2020-2029 (USD MILLION)
TABLE 224 THAILAND CLOUD IN ACCOUNTS PAYABLE AUTOMATION MARKET, BY TYPE, 2020-2029 (USD MILLION)
TABLE 225 THAILAND ACCOUNTS PAYABLE AUTOMATION MARKET, BY VERTICAL, 2020-2029 (USD MILLION)
TABLE 226 INDONESIA ACCOUNTS PAYABLE AUTOMATION MARKET, BY COMPONENT, 2020-2029 (USD MILLION)
TABLE 227 INDONESIA SERVICES IN ACCOUNTS PAYABLE AUTOMATION MARKET, BY TYPE, 2020-2029 (USD MILLION)
TABLE 228 INDONESIA ACCOUNTS PAYABLE AUTOMATION MARKET, BY ORGANIZATION SIZE, 2020-2029 (USD MILLION)
TABLE 229 INDONESIA ACCOUNTS PAYABLE AUTOMATION MARKET, BY PROCESS, 2020-2029 (USD MILLION)
TABLE 230 INDONESIA INVOICE CAPTURE IN ACCOUNTS PAYABLE AUTOMATION MARKET, BY METHOD, 2020-2029 (USD MILLION)
TABLE 231 INDONESIA ACCOUNTS PAYABLE AUTOMATION MARKET, BY DEPLOYMENT TYPE, 2020-2029 (USD MILLION)
TABLE 232 INDONESIA CLOUD IN ACCOUNTS PAYABLE AUTOMATION MARKET, BY TYPE, 2020-2029 (USD MILLION)
TABLE 233 INDONESIA ACCOUNTS PAYABLE AUTOMATION MARKET, BY VERTICAL, 2020-2029 (USD MILLION)
TABLE 234 PHILIPPINES ACCOUNTS PAYABLE AUTOMATION MARKET, BY COMPONENT, 2020-2029 (USD MILLION)
TABLE 235 PHILIPPINES SERVICES IN ACCOUNTS PAYABLE AUTOMATION MARKET, BY TYPE, 2020-2029 (USD MILLION)
TABLE 236 PHILIPPINES ACCOUNTS PAYABLE AUTOMATION MARKET, BY ORGANIZATION SIZE, 2020-2029 (USD MILLION)
TABLE 237 PHILIPPINES ACCOUNTS PAYABLE AUTOMATION MARKET, BY PROCESS, 2020-2029 (USD MILLION)
TABLE 238 PHILIPPINES INVOICE CAPTURE IN ACCOUNTS PAYABLE AUTOMATION MARKET, BY METHOD, 2020-2029 (USD MILLION)
TABLE 239 PHILIPPINES ACCOUNTS PAYABLE AUTOMATION MARKET, BY DEPLOYMENT TYPE, 2020-2029 (USD MILLION)
TABLE 240 PHILIPPINES CLOUD IN ACCOUNTS PAYABLE AUTOMATION MARKET, BY TYPE, 2020-2029 (USD MILLION)
TABLE 241 PHILIPPINES ACCOUNTS PAYABLE AUTOMATION MARKET, BY VERTICAL, 2020-2029 (USD MILLION)
TABLE 242 REST OF ASIA-PACIFIC ACCOUNTS PAYABLE AUTOMATION MARKET, BY COMPONENT, 2020-2029 (USD MILLION)
TABLE 243 MIDDLE EAST AND AFRICA ACCOUNTS PAYABLE AUTOMATION MARKET, BY COUNTRY, 2020-2029 (USD MILLION)
TABLE 244 MIDDLE EAST AND AFRICA ACCOUNTS PAYABLE AUTOMATION MARKET, BY COMPONENT, 2020-2029 (USD MILLION)
TABLE 245 MIDDLE EAST AND AFRICA SERVICES IN ACCOUNTS PAYABLE AUTOMATION MARKET, BY TYPE, 2020-2029 (USD MILLION)
TABLE 246 MIDDLE EAST AND AFRICA ACCOUNTS PAYABLE AUTOMATION MARKET, BY ORGANIZATION SIZE, 2020-2029 (USD MILLION)
TABLE 247 MIDDLE EAST AND AFRICA ACCOUNTS PAYABLE AUTOMATION MARKET, BY PROCESS, 2020-2029 (USD MILLION)
TABLE 248 MIDDLE EAST AND AFRICA INVOICE CAPTURE IN ACCOUNTS PAYABLE AUTOMATION MARKET, BY METHOD, 2020-2029 (USD MILLION)
TABLE 249 MIDDLE EAST AND AFRICA ACCOUNTS PAYABLE AUTOMATION MARKET, BY DEPLOYMENT TYPE, 2020-2029 (USD MILLION)
TABLE 250 MIDDLE EAST AND AFRICA CLOUD IN ACCOUNTS PAYABLE AUTOMATION MARKET, BY TYPE, 2020-2029 (USD MILLION)
TABLE 251 MIDDLE EAST AND AFRICA ACCOUNTS PAYABLE AUTOMATION MARKET, BY VERTICAL, 2020-2029 (USD MILLION)
TABLE 252 U.A.E. ACCOUNTS PAYABLE AUTOMATION MARKET, BY COMPONENT, 2020-2029 (USD MILLION)
TABLE 253 U.A.E. SERVICES IN ACCOUNTS PAYABLE AUTOMATION MARKET, BY TYPE, 2020-2029 (USD MILLION)
TABLE 254 U.A.E. ACCOUNTS PAYABLE AUTOMATION MARKET, BY ORGANIZATION SIZE, 2020-2029 (USD MILLION)
TABLE 255 U.A.E. ACCOUNTS PAYABLE AUTOMATION MARKET, BY PROCESS, 2020-2029 (USD MILLION)
TABLE 256 U.A.E. INVOICE CAPTURE IN ACCOUNTS PAYABLE AUTOMATION MARKET, BY METHOD, 2020-2029 (USD MILLION)
TABLE 257 U.A.E. ACCOUNTS PAYABLE AUTOMATION MARKET, BY DEPLOYMENT TYPE, 2020-2029 (USD MILLION)
TABLE 258 U.A.E. CLOUD IN ACCOUNTS PAYABLE AUTOMATION MARKET, BY TYPE, 2020-2029 (USD MILLION)
TABLE 259 U.A.E. ACCOUNTS PAYABLE AUTOMATION MARKET, BY VERTICAL, 2020-2029 (USD MILLION)
TABLE 260 SOUTH AFRICA ACCOUNTS PAYABLE AUTOMATION MARKET, BY COMPONENT, 2020-2029 (USD MILLION)
TABLE 261 SOUTH AFRICA SERVICES IN ACCOUNTS PAYABLE AUTOMATION MARKET, BY TYPE, 2020-2029 (USD MILLION)
TABLE 262 SOUTH AFRICA ACCOUNTS PAYABLE AUTOMATION MARKET, BY ORGANIZATION SIZE, 2020-2029 (USD MILLION)
TABLE 263 SOUTH AFRICA ACCOUNTS PAYABLE AUTOMATION MARKET, BY PROCESS, 2020-2029 (USD MILLION)
TABLE 264 SOUTH AFRICA INVOICE CAPTURE IN ACCOUNTS PAYABLE AUTOMATION MARKET, BY METHOD, 2020-2029 (USD MILLION)
TABLE 265 SOUTH AFRICA ACCOUNTS PAYABLE AUTOMATION MARKET, BY DEPLOYMENT TYPE, 2020-2029 (USD MILLION)
TABLE 266 SOUTH AFRICA CLOUD IN ACCOUNTS PAYABLE AUTOMATION MARKET, BY TYPE, 2020-2029 (USD MILLION)
TABLE 267 SOUTH AFRICA ACCOUNTS PAYABLE AUTOMATION MARKET, BY VERTICAL, 2020-2029 (USD MILLION)
TABLE 268 SAUDI ARABIA ACCOUNTS PAYABLE AUTOMATION MARKET, BY COMPONENT, 2020-2029 (USD MILLION)
TABLE 269 SAUDI ARABIA SERVICES IN ACCOUNTS PAYABLE AUTOMATION MARKET, BY TYPE, 2020-2029 (USD MILLION)
TABLE 270 SAUDI ARABIA ACCOUNTS PAYABLE AUTOMATION MARKET, BY ORGANIZATION SIZE, 2020-2029 (USD MILLION)
TABLE 271 SAUDI ARABIA ACCOUNTS PAYABLE AUTOMATION MARKET, BY PROCESS, 2020-2029 (USD MILLION)
TABLE 272 SAUDI ARABIA INVOICE CAPTURE IN ACCOUNTS PAYABLE AUTOMATION MARKET, BY METHOD, 2020-2029 (USD MILLION)
TABLE 273 SAUDI ARABIA ACCOUNTS PAYABLE AUTOMATION MARKET, BY DEPLOYMENT TYPE, 2020-2029 (USD MILLION)
TABLE 274 SAUDI ARABIA CLOUD IN ACCOUNTS PAYABLE AUTOMATION MARKET, BY TYPE, 2020-2029 (USD MILLION)
TABLE 275 SAUDI ARABIA ACCOUNTS PAYABLE AUTOMATION MARKET, BY VERTICAL, 2020-2029 (USD MILLION)
TABLE 276 ISRAEL ACCOUNTS PAYABLE AUTOMATION MARKET, BY COMPONENT, 2020-2029 (USD MILLION)
TABLE 277 ISRAEL SERVICES IN ACCOUNTS PAYABLE AUTOMATION MARKET, BY TYPE, 2020-2029 (USD MILLION)
TABLE 278 ISRAEL ACCOUNTS PAYABLE AUTOMATION MARKET, BY ORGANIZATION SIZE, 2020-2029 (USD MILLION)
TABLE 279 ISRAEL ACCOUNTS PAYABLE AUTOMATION MARKET, BY PROCESS, 2020-2029 (USD MILLION)
TABLE 280 ISRAEL INVOICE CAPTURE IN ACCOUNTS PAYABLE AUTOMATION MARKET, BY METHOD, 2020-2029 (USD MILLION)
TABLE 281 ISRAEL ACCOUNTS PAYABLE AUTOMATION MARKET, BY DEPLOYMENT TYPE, 2020-2029 (USD MILLION)
TABLE 282 ISRAEL CLOUD IN ACCOUNTS PAYABLE AUTOMATION MARKET, BY TYPE, 2020-2029 (USD MILLION)
TABLE 283 ISRAEL ACCOUNTS PAYABLE AUTOMATION MARKET, BY VERTICAL, 2020-2029 (USD MILLION)
TABLE 284 EGYPT ACCOUNTS PAYABLE AUTOMATION MARKET, BY COMPONENT, 2020-2029 (USD MILLION)
TABLE 285 EGYPT SERVICES IN ACCOUNTS PAYABLE AUTOMATION MARKET, BY TYPE, 2020-2029 (USD MILLION)
TABLE 286 EGYPT ACCOUNTS PAYABLE AUTOMATION MARKET, BY ORGANIZATION SIZE, 2020-2029 (USD MILLION)
TABLE 287 EGYPT ACCOUNTS PAYABLE AUTOMATION MARKET, BY PROCESS, 2020-2029 (USD MILLION)
TABLE 288 EGYPT INVOICE CAPTURE IN ACCOUNTS PAYABLE AUTOMATION MARKET, BY METHOD, 2020-2029 (USD MILLION)
TABLE 289 EGYPT ACCOUNTS PAYABLE AUTOMATION MARKET, BY DEPLOYMENT TYPE, 2020-2029 (USD MILLION)
TABLE 290 EGYPT CLOUD IN ACCOUNTS PAYABLE AUTOMATION MARKET, BY TYPE, 2020-2029 (USD MILLION)
TABLE 291 EGYPT ACCOUNTS PAYABLE AUTOMATION MARKET, BY VERTICAL, 2020-2029 (USD MILLION)
TABLE 292 REST OF MIDDLE EAST AND AFRICA ACCOUNTS PAYABLE AUTOMATION MARKET, BY COMPONENT, 2020-2029 (USD MILLION)
TABLE 293 SOUTH AMERICA ACCOUNTS PAYABLE AUTOMATION MARKET, BY COUNTRY, 2020-2029 (USD MILLION)
TABLE 294 SOUTH AMERICA ACCOUNTS PAYABLE AUTOMATION MARKET, BY COMPONENT, 2020-2029 (USD MILLION)
TABLE 295 SOUTH AMERICA SERVICES IN ACCOUNTS PAYABLE AUTOMATION MARKET, BY TYPE, 2020-2029 (USD MILLION)
TABLE 296 SOUTH AMERICA ACCOUNTS PAYABLE AUTOMATION MARKET, BY ORGANIZATION SIZE, 2020-2029 (USD MILLION)
TABLE 297 SOUTH AMERICA ACCOUNTS PAYABLE AUTOMATION MARKET, BY PROCESS, 2020-2029 (USD MILLION)
TABLE 298 SOUTH AMERICA INVOICE CAPTURE IN ACCOUNTS PAYABLE AUTOMATION MARKET, BY METHOD, 2020-2029 (USD MILLION)
TABLE 299 SOUTH AMERICA ACCOUNTS PAYABLE AUTOMATION MARKET, BY DEPLOYMENT TYPE, 2020-2029 (USD MILLION)
TABLE 300 SOUTH AMERICA CLOUD IN ACCOUNTS PAYABLE AUTOMATION MARKET, BY TYPE, 2020-2029 (USD MILLION)
TABLE 301 SOUTH AMERICA ACCOUNTS PAYABLE AUTOMATION MARKET, BY VERTICAL, 2020-2029 (USD MILLION)
TABLE 302 BRAZIL ACCOUNTS PAYABLE AUTOMATION MARKET, BY COMPONENT, 2020-2029 (USD MILLION)
TABLE 303 BRAZIL SERVICES IN ACCOUNTS PAYABLE AUTOMATION MARKET, BY TYPE, 2020-2029 (USD MILLION)
TABLE 304 BRAZIL ACCOUNTS PAYABLE AUTOMATION MARKET, BY ORGANIZATION SIZE, 2020-2029 (USD MILLION)
TABLE 305 BRAZIL ACCOUNTS PAYABLE AUTOMATION MARKET, BY PROCESS, 2020-2029 (USD MILLION)
TABLE 306 BRAZIL INVOICE CAPTURE IN ACCOUNTS PAYABLE AUTOMATION MARKET, BY METHOD, 2020-2029 (USD MILLION)
TABLE 307 BRAZIL ACCOUNTS PAYABLE AUTOMATION MARKET, BY DEPLOYMENT TYPE, 2020-2029 (USD MILLION)
TABLE 308 BRAZIL CLOUD IN ACCOUNTS PAYABLE AUTOMATION MARKET, BY TYPE, 2020-2029 (USD MILLION)
TABLE 309 BRAZIL ACCOUNTS PAYABLE AUTOMATION MARKET, BY VERTICAL, 2020-2029 (USD MILLION)
TABLE 310 ARGENTINA ACCOUNTS PAYABLE AUTOMATION MARKET, BY COMPONENT, 2020-2029 (USD MILLION)
TABLE 311 ARGENTINA SERVICES IN ACCOUNTS PAYABLE AUTOMATION MARKET, BY TYPE, 2020-2029 (USD MILLION)
TABLE 312 ARGENTINA ACCOUNTS PAYABLE AUTOMATION MARKET, BY ORGANIZATION SIZE, 2020-2029 (USD MILLION)
TABLE 313 ARGENTINA ACCOUNTS PAYABLE AUTOMATION MARKET, BY PROCESS, 2020-2029 (USD MILLION)
TABLE 314 ARGENTINA INVOICE CAPTURE IN ACCOUNTS PAYABLE AUTOMATION MARKET, BY METHOD, 2020-2029 (USD MILLION)
TABLE 315 ARGENTINA ACCOUNTS PAYABLE AUTOMATION MARKET, BY DEPLOYMENT TYPE, 2020-2029 (USD MILLION)
TABLE 316 ARGENTINA CLOUD IN ACCOUNTS PAYABLE AUTOMATION MARKET, BY TYPE, 2020-2029 (USD MILLION)
TABLE 317 ARGENTINA ACCOUNTS PAYABLE AUTOMATION MARKET, BY VERTICAL, 2020-2029 (USD MILLION)
TABLE 318 REST OF SOUTH AMERICA ACCOUNTS PAYABLE AUTOMATION MARKET, BY COMPONENT, 2020-2029 (USD MILLION)
Lista de figuras
FIGURE 1 GLOBAL ACCOUNTS PAYABLE AUTOMATION MARKET: SEGMENTATION
FIGURE 2 GLOBAL ACCOUNTS PAYABLE AUTOMATION MARKET: DATA TRIANGULATION
FIGURE 3 GLOBAL ACCOUNTS PAYABLE AUTOMATION MARKET: DROC ANALYSIS
FIGURE 4 GLOBAL ACCOUNTS PAYABLE AUTOMATION MARKET: GLOBAL VS REGIONAL MARKET ANALYSIS
FIGURE 5 GLOBAL ACCOUNTS PAYABLE AUTOMATION MARKET: COMPANY RESEARCH ANALYSIS
FIGURE 6 GLOBAL ACCOUNTS PAYABLE AUTOMATION MARKET: INTERVIEW DEMOGRAPHICS
FIGURE 7 GLOBAL ACCOUNTS PAYABLE AUTOMATION MARKET: DBMR MARKET POSITION GRID
FIGURE 8 GLOBAL ACCOUNTS PAYABLE AUTOMATION MARKET: VENDOR SHARE ANALYSIS
FIGURE 9 GLOBAL ACCOUNTS PAYABLE AUTOMATION MARKET: MARKET VERTICAL COVERAGE GRID
FIGURE 10 GLOBAL ACCOUNTS PAYABLE AUTOMATION MARKET: SEGMENTATION
FIGURE 11 GROWING NEED TO DIGITIZE PAYMENT PROCESS AND REDUCTION IN INVOICE PROCESSING TIME IS EXPECTED TO BE KEY DRIVER OF THE MARKET FOR GLOBAL ACCOUNTS PAYABLE AUTOMATION MARKET IN THE FORECAST PERIOD OF 2022 TO 2029
FIGURE 12 SOLUTION SEGMENT IS EXPECTED TO ACCOUNTS FOR THE LARGEST SHARE OF THE GLOBAL ACCOUNTS PAYABLE AUTOMATION MARKET FROM 2022 TO 2029
FIGURE 13 DRIVERS, RESTRAINTS, OPPORTUNITIES AND CHALLENGES OF THE GLOBAL ACCOUNTS PAYABLE AUTOMATION MARKET
FIGURE 14 GLOBAL ACCOUNTS PAYABLE AUTOMATION MARKET: BY COMPONENT, 2021
FIGURE 15 GLOBAL ACCOUNTS PAYABLE AUTOMATION MARKET: BY ORGANIZATION SIZE, 2021
FIGURE 16 GLOBAL ACCOUNTS PAYABLE AUTOMATION MARKET: BY PROCESS, 2021
FIGURE 17 GLOBAL ACCOUNTS PAYABLE AUTOMATION MARKET: BY DEPLOYMENT TYPE, 2021
FIGURE 18 GLOBAL ACCOUNTS PAYABLE AUTOMATION MARKET: BY VERTICAL, 2021
FIGURE 19 GLOBAL ACCOUNTS PAYABLE AUTOMATION MARKET: SNAPSHOT (2021)
FIGURE 20 GLOBAL ACCOUNTS PAYABLE AUTOMATION MARKET: BY REGION (2021)
FIGURE 21 GLOBAL ACCOUNTS PAYABLE AUTOMATION MARKET: BY REGION (2022 & 2029)
FIGURE 22 GLOBAL ACCOUNTS PAYABLE AUTOMATION MARKET: BY REGION (2021 & 2029)
FIGURE 23 GLOBAL ACCOUNTS PAYABLE AUTOMATION MARKET: BY COMPONENT (2022-2029)
FIGURE 24 NORTH AMERICA ACCOUNTS PAYABLE AUTOMATION MARKET: SNAPSHOT (2021)
FIGURE 25 NORTH AMERICA ACCOUNTS PAYABLE AUTOMATION MARKET: BY COUNTRY (2021)
FIGURE 26 NORTH AMERICA ACCOUNTS PAYABLE AUTOMATION MARKET: BY COUNTRY (2022 & 2029)
FIGURE 27 NORTH AMERICA ACCOUNTS PAYABLE AUTOMATION MARKET: BY COUNTRY (2021 & 2029)
FIGURE 28 NORTH AMERICA ACCOUNTS PAYABLE AUTOMATION MARKET: BY COMPONENT (2022-2029)
FIGURE 29 EUROPE ACCOUNTS PAYABLE AUTOMATION MARKET: SNAPSHOT (2021)
FIGURE 30 EUROPE ACCOUNTS PAYABLE AUTOMATION MARKET: BY COUNTRY (2021)
FIGURE 31 EUROPE ACCOUNTS PAYABLE AUTOMATION MARKET: BY COUNTRY (2022 & 2029)
FIGURE 32 EUROPE ACCOUNTS PAYABLE AUTOMATION MARKET: BY COUNTRY (2021 & 2029)
FIGURE 33 EUROPE ACCOUNTS PAYABLE AUTOMATION MARKET: BY COMPONENT (2022-2029)
FIGURE 34 ASIA-PACIFIC ACCOUNTS PAYABLE AUTOMATION MARKET: SNAPSHOT (2021)
FIGURE 35 ASIA-PACIFIC ACCOUNTS PAYABLE AUTOMATION MARKET: BY COUNTRY (2021)
FIGURE 36 ASIA-PACIFIC ACCOUNTS PAYABLE AUTOMATION MARKET: BY COUNTRY (2022 & 2029)
FIGURE 37 ASIA-PACIFIC ACCOUNTS PAYABLE AUTOMATION MARKET: BY COUNTRY (2021 & 2029)
FIGURE 38 ASIA-PACIFIC ACCOUNTS PAYABLE AUTOMATION MARKET: BY COMPONENT (2022-2029)
FIGURE 39 MIDDLE EAST AND AFRICA ACCOUNTS PAYABLE AUTOMATION MARKET: SNAPSHOT (2021)
FIGURE 40 MIDDLE EAST AND AFRICA ACCOUNTS PAYABLE AUTOMATION MARKET: BY COUNTRY (2021)
FIGURE 41 MIDDLE EAST AND AFRICA ACCOUNTS PAYABLE AUTOMATION MARKET: BY COUNTRY (2022 & 2029)
FIGURE 42 MIDDLE EAST AND AFRICA ACCOUNTS PAYABLE AUTOMATION MARKET: BY COUNTRY (2021 & 2029)
FIGURE 43 MIDDLE EAST AND AFRICA ACCOUNTS PAYABLE AUTOMATION MARKET: BY COMPONENT (2022-2029)
FIGURE 44 SOUTH AMERICA ACCOUNTS PAYABLE AUTOMATION MARKET: SNAPSHOT (2021)
FIGURE 45 SOUTH AMERICA ACCOUNTS PAYABLE AUTOMATION MARKET: BY COUNTRY (2021)
FIGURE 46 SOUTH AMERICA ACCOUNTS PAYABLE AUTOMATION MARKET: BY COUNTRY (2022 & 2029)
FIGURE 47 SOUTH AMERICA ACCOUNTS PAYABLE AUTOMATION MARKET: BY COUNTRY (2021 & 2029)
FIGURE 48 SOUTH AMERICA ACCOUNTS PAYABLE AUTOMATION MARKET: BY COMPONENT (2022-2029)
FIGURE 49 GLOBAL ACCOUNTS PAYABLE AUTOMATION MARKET: COMPANY SHARE 2021 (%)
FIGURE 50 NORTH AMERICA ACCOUNTS PAYABLE AUTOMATION MARKET: COMPANY SHARE 2021 (%)
FIGURE 51 EUROPE ACCOUNTS PAYABLE AUTOMATION MARKET: COMPANY SHARE 2021 (%)
FIGURE 52 ASIA-PACIFIC ACCOUNTS PAYABLE AUTOMATION MARKET: COMPANY SHARE 2021 (%)
Metodología de investigación
La recopilación de datos y el análisis del año base se realizan utilizando módulos de recopilación de datos con muestras de gran tamaño. La etapa incluye la obtención de información de mercado o datos relacionados a través de varias fuentes y estrategias. Incluye el examen y la planificación de todos los datos adquiridos del pasado con antelación. Asimismo, abarca el examen de las inconsistencias de información observadas en diferentes fuentes de información. Los datos de mercado se analizan y estiman utilizando modelos estadísticos y coherentes de mercado. Además, el análisis de la participación de mercado y el análisis de tendencias clave son los principales factores de éxito en el informe de mercado. Para obtener más información, solicite una llamada de un analista o envíe su consulta.
La metodología de investigación clave utilizada por el equipo de investigación de DBMR es la triangulación de datos, que implica la extracción de datos, el análisis del impacto de las variables de datos en el mercado y la validación primaria (experto en la industria). Los modelos de datos incluyen cuadrícula de posicionamiento de proveedores, análisis de línea de tiempo de mercado, descripción general y guía del mercado, cuadrícula de posicionamiento de la empresa, análisis de patentes, análisis de precios, análisis de participación de mercado de la empresa, estándares de medición, análisis global versus regional y de participación de proveedores. Para obtener más información sobre la metodología de investigación, envíe una consulta para hablar con nuestros expertos de la industria.
Personalización disponible
Data Bridge Market Research es líder en investigación formativa avanzada. Nos enorgullecemos de brindar servicios a nuestros clientes existentes y nuevos con datos y análisis que coinciden y se adaptan a sus objetivos. El informe se puede personalizar para incluir análisis de tendencias de precios de marcas objetivo, comprensión del mercado de países adicionales (solicite la lista de países), datos de resultados de ensayos clínicos, revisión de literatura, análisis de mercado renovado y base de productos. El análisis de mercado de competidores objetivo se puede analizar desde análisis basados en tecnología hasta estrategias de cartera de mercado. Podemos agregar tantos competidores sobre los que necesite datos en el formato y estilo de datos que esté buscando. Nuestro equipo de analistas también puede proporcionarle datos en archivos de Excel sin procesar, tablas dinámicas (libro de datos) o puede ayudarlo a crear presentaciones a partir de los conjuntos de datos disponibles en el informe.

