

Global 3d Printing Materials Market
Tamaño del mercado en miles de millones de dólares
Tasa de crecimiento anual compuesta (CAGR) :
% 
 USD
3.13 Billion
USD
13.56 Billion
2024
2032
USD
3.13 Billion
USD
13.56 Billion
2024
2032
| 2025 –2032 | |
| USD 3.13 Billion | |
| USD 13.56 Billion | |
| % | |
|
Segmentación del mercado global de materiales de impresión 3D por tipo (plásticos/polímeros, metal, cerámica, etc.), forma (polvo, filamento y líquido), tecnología (modelado por deposición fundida [FDM], sinterización selectiva por láser [SLS], estereolitografía [SLA], sinterización directa por láser de metal [DMLS], fabricación aditiva de área grande [BAAM], fabricación aditiva por arco de alambre [WAAM], ColorJet, etc.), uso final (fabricación industrial, automoción, sanidad, aeroespacial y defensa, bienes de consumo, electrónica, educación, construcción, etc.): tendencias y pronóstico del sector hasta 2032.
Tamaño del mercado de materiales de impresión 3D
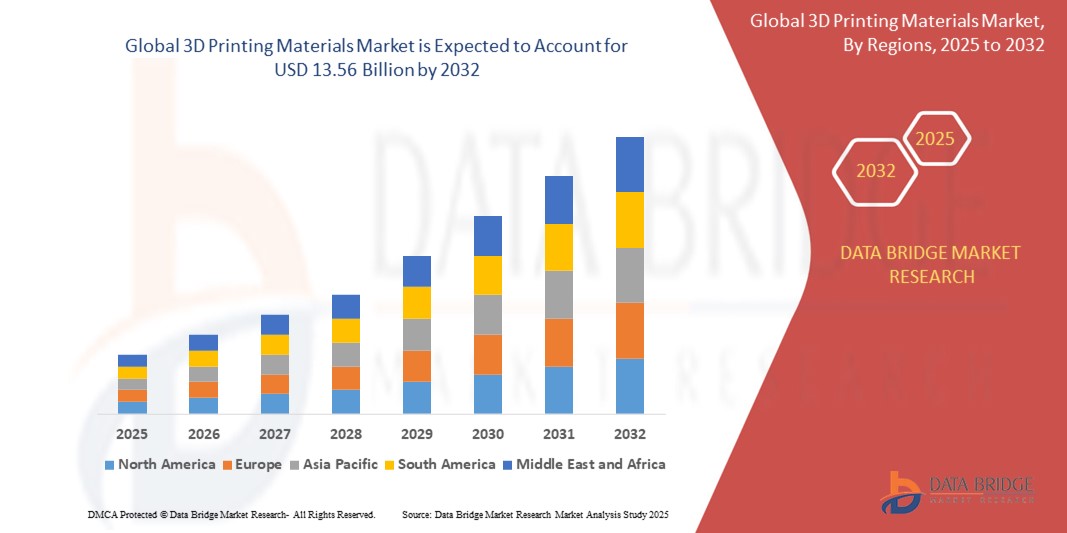
- El tamaño del mercado global de materiales de impresión 3D se valoró en USD 3,13 mil millones en 2024 y se espera que alcance los USD 13,56 mil millones para 2032 , con una CAGR del 20,10% durante el período de pronóstico.
- El crecimiento del mercado está impulsado en gran medida por el uso creciente de la impresión 3D en industrias clave como la aeroespacial, la automotriz y la atención médica, respaldada por avances en tecnologías de fabricación aditiva y ciencia de los materiales.
- Además, la creciente demanda de componentes ligeros, de alto rendimiento y personalizables está impulsando la innovación en materiales como metales, polímeros y compuestos, acelerando la adopción de materiales de impresión 3D e impulsando significativamente el crecimiento de la industria.
Análisis del mercado de materiales de impresión 3D
- Los materiales de impresión 3D, que abarcan polímeros, metales y cerámicas, son componentes esenciales en los procesos de fabricación aditiva en diversos sectores debido a su capacidad para permitir la creación rápida de prototipos, la personalización y la producción de geometrías complejas con menos desperdicio.
- La creciente demanda de materiales de impresión 3D se ve impulsada principalmente por la creciente adopción industrial de la fabricación aditiva, los avances en las propiedades de los materiales y la creciente necesidad de soluciones de producción a pedido y rentables.
- América del Norte dominó el mercado de materiales de impresión 3D con una participación del 39,5 % en 2024, debido a la fuerte presencia de empresas líderes en fabricación aditiva, las altas inversiones en I+D y la adopción generalizada en industrias como la aeroespacial, la atención médica y la automotriz.
- Se espera que Asia-Pacífico sea la región de más rápido crecimiento en el mercado de materiales de impresión 3D durante el período de pronóstico debido a la expansión de la industrialización, el respaldo gubernamental a las tecnologías digitales y la creciente asequibilidad de los sistemas y materiales de impresión 3D.
- El segmento de plásticos/polímeros dominó el mercado con una cuota de mercado del 38,4 % en 2024, gracias a su amplio uso en aplicaciones tanto de consumo como industriales. Los termoplásticos como el PLA, el ABS y el nailon gozan de gran popularidad por su asequibilidad, facilidad de uso y versatilidad en diversas tecnologías de impresión 3D. Sus propiedades mecánicas, su reciclabilidad y su idoneidad para el prototipado y la producción de piezas funcionales han consolidado su dominio en los sectores de la educación, el diseño y los bienes de consumo.
Alcance del informe y segmentación del mercado de materiales de impresión 3D
|
Atributos |
Perspectivas clave del mercado de materiales de impresión 3D |
|
Segmentos cubiertos |
|
|
Países cubiertos |
América del norte
Europa
Asia-Pacífico
Oriente Medio y África
Sudamerica
|
|
Actores clave del mercado |
|
|
Oportunidades de mercado |
|
|
Conjuntos de información de datos de valor añadido |
Además de los conocimientos sobre escenarios de mercado como valor de mercado, tasa de crecimiento, segmentación, cobertura geográfica y actores principales, los informes de mercado seleccionados por Data Bridge Market Research también incluyen análisis de importación y exportación, descripción general de la capacidad de producción, análisis del consumo de producción, análisis de tendencias de precios, escenario de cambio climático, análisis de la cadena de suministro, análisis de la cadena de valor, descripción general de materias primas/consumibles, criterios de selección de proveedores, análisis PESTLE, análisis de Porter y marco regulatorio. |
Tendencias del mercado de materiales de impresión 3D
Aumento del uso de materiales sostenibles y reciclados en la fabricación aditiva
- Una tendencia significativa y en aceleración en el mercado global de materiales de impresión 3D es el cambio hacia materiales sustentables, incluidos polímeros de origen biológico y compuestos reciclados, en respuesta a la creciente conciencia ambiental y la presión de la industria para reducir los desechos y las emisiones.
- Por ejemplo, en junio de 2023, CRP Technology lanzó Windform XT 2.0 IMG, un material de moldeo por inyección de alto rendimiento fabricado completamente con Windform XT 2.0 reciclado, que permite transiciones fluidas desde la creación de prototipos hasta la producción al tiempo que reduce la huella de carbono.
- La adopción de materiales ecológicos se ve impulsada por el aumento de los requisitos regulatorios, los objetivos de sostenibilidad corporativa y la demanda de cadenas de suministro más ecológicas. Las empresas están invirtiendo en la fabricación de ciclo cerrado y la reutilización de materiales durante todo el ciclo de vida para minimizar el impacto ambiental.
- La incorporación de materiales de impresión 3D sostenibles está ganando impulso en industrias como la aeroespacial, la automotriz y la de bienes de consumo, donde las credenciales de sostenibilidad juegan un papel cada vez más importante en la selección de proveedores y las estrategias de desarrollo de productos.
- Los principales fabricantes de materiales como BASF, Arkema y Stratasys están ampliando sus carteras de materiales sostenibles, lo que refuerza el cambio del mercado hacia alternativas más ecológicas que ofrecen rendimiento sin comprometer el medio ambiente.
- Esta tendencia hacia materiales de impresión 3D reciclables y de base biológica está transformando fundamentalmente el panorama de la fabricación aditiva, fomentando modelos de producción más circulares e impulsando la adopción de la impresión 3D en industrias impulsadas por la sostenibilidad.
Dinámica del mercado de materiales de impresión 3D
Conductor
Expansión de la adopción de la fabricación aditiva en sectores industriales clave
- El creciente uso de la fabricación aditiva en los sectores automotriz, aeroespacial y de la salud es un impulsor clave que acelera la demanda de materiales de impresión 3D de alto rendimiento que puedan soportar aplicaciones complejas, livianas y personalizadas.
- Por ejemplo, la adquisición en abril de 2023 del negocio de materiales de fabricación aditiva de Covestro por parte de Stratasys amplió su cartera con alrededor de 60 nuevos materiales, lo que le permitió brindar un mejor servicio a las aplicaciones aeroespaciales y de atención médica.
- Las industrias están aprovechando la impresión 3D para la creación rápida de prototipos, herramientas y producción de piezas para uso final, beneficiándose de plazos de entrega reducidos, desperdicios minimizados y una mayor flexibilidad de diseño que ofrecen los materiales avanzados.
- En el sector aeroespacial, materiales como los compuestos de fibra de carbono y los polvos metálicos son fundamentales para producir componentes livianos con relaciones resistencia-peso superiores, mientras que en el sector de la salud, los polímeros y resinas biocompatibles permiten implantes y dispositivos médicos personalizados.
- Esta adopción industrial generalizada, junto con los avances tecnológicos y la mayor disponibilidad de materiales, continúa impulsando el crecimiento del mercado, posicionando los materiales de impresión 3D como una piedra angular de las estrategias de fabricación de próxima generación.
Restricción/Desafío
“Altos costos de materiales y estandarización limitada”
- El alto costo de los materiales avanzados de impresión 3D, incluidos polvos metálicos especiales, polímeros de ingeniería y compuestos de alto rendimiento, plantea una barrera importante para una adopción más amplia, en particular entre las pequeñas y medianas empresas.
- Por ejemplo, si bien polímeros como PEEK y ULTEM ofrecen una resistencia al calor y propiedades mecánicas superiores, su alto precio en comparación con los termoplásticos convencionales limita su uso a aplicaciones específicas en los sectores aeroespacial y médico.
- La falta de parámetros de calidad estandarizados y especificaciones de rendimiento entre los proveedores de materiales también contribuye a la complejidad de las adquisiciones y obstaculiza la adopción a gran escala en industrias reguladas como la atención médica y la defensa.
- Además, las limitaciones en la compatibilidad de los materiales con diferentes tecnologías de impresión 3D restringen la flexibilidad del usuario final, lo que obliga a las organizaciones a invertir en múltiples máquinas o comprometer el rendimiento.
- Para superar estos desafíos, los fabricantes se están centrando en la reducción de costos a través de economías de escala, formulaciones de materiales mejoradas y el desarrollo de protocolos de certificación para una calidad constante, pero las barreras de adopción siguen siendo una preocupación en mercados sensibles a los precios y con alta regulación.
Alcance del mercado de materiales de impresión 3D
El mercado está segmentado según tipo, forma, tecnología y uso final.
• Por tipo
Según el tipo, el mercado de materiales de impresión 3D se segmenta en plásticos/polímeros, metal, cerámica y otros. El segmento de plásticos/polímeros dominó la mayor cuota de mercado con un 38,4 % en 2024, principalmente debido a su amplio uso en aplicaciones tanto de consumo como industriales. Los termoplásticos como el PLA, el ABS y el nailon son muy populares por su asequibilidad, facilidad de uso y versatilidad en diversas tecnologías de impresión 3D. Sus propiedades mecánicas, reciclabilidad e idoneidad para el prototipado y la producción de piezas funcionales han consolidado su dominio en los sectores de la educación, el diseño y los bienes de consumo.
Se prevé que el segmento de metales experimente el mayor crecimiento entre 2025 y 2032, impulsado por la creciente demanda de aplicaciones de alto rendimiento en las industrias aeroespacial, automotriz y sanitaria. Materiales metálicos como el titanio, el acero inoxidable y el aluminio permiten la producción de piezas resistentes, ligeras y complejas, difíciles de fabricar con métodos convencionales. La creciente adopción de la fabricación aditiva de metales en la producción de componentes críticos e implantes está impulsando el crecimiento del segmento.
• Por formulario
Según su forma, el mercado se clasifica en polvo, filamento y líquido. El segmento de filamentos representó la mayor cuota de ingresos en 2024, gracias a su dominio en la impresión 3D de consumo y de escritorio. Los materiales basados en filamentos son rentables, fáciles de manejar y compatibles con las impresoras FDM de uso generalizado, lo que los convierte en la opción preferida para el prototipado rápido y aplicaciones para aficionados. La disponibilidad de una amplia gama de materiales de filamentos con diferentes propiedades mecánicas y estéticas refuerza aún más su adopción generalizada.
Se prevé que el segmento de polvos registre la mayor tasa de crecimiento anual compuesta (TCAC) entre 2025 y 2032, impulsado por su papel crucial en tecnologías de impresión de grado industrial como SLS y DMLS. Los materiales a base de polvos permiten una estratificación precisa, mayor resolución e integridad estructural, lo que los hace adecuados para componentes complejos de alta resistencia utilizados en la industria aeroespacial, implantes médicos y aplicaciones de herramientas.
• Por tecnología
Según la tecnología, el mercado de materiales de impresión 3D se segmenta en FDM, SLS, SLA, DMLS, BAAM, WAAM, ColorJet, entre otros. El modelado por deposición fundida (FDM) mantuvo la mayor cuota de mercado en 2024 gracias a su rentabilidad, disponibilidad de materiales y amplio uso en aplicaciones educativas, de consumo y de prototipado. Su compatibilidad con diversos filamentos termoplásticos y su facilidad de uso en impresoras de escritorio han propiciado su amplia implantación a nivel mundial.
Se proyecta que la sinterización directa de metales por láser (DMLS) experimente su mayor crecimiento entre 2025 y 2032, debido a su creciente adopción en la fabricación de piezas metálicas de alta precisión en sectores como el aeroespacial, el automotriz y el médico. El DMLS permite la creación de geometrías complejas y piezas de alta durabilidad directamente a partir de polvos metálicos, lo que ofrece una ventaja transformadora sobre los métodos de fabricación sustractiva.
• Por uso final
Por uso final, el mercado se segmenta en manufactura industrial, automoción, salud, aeroespacial y defensa, bienes de consumo, electrónica, educación, construcción, entre otros. El segmento de manufactura industrial generó los mayores ingresos en 2024, gracias al creciente uso de materiales de impresión 3D en herramientas, plantillas y accesorios, y en la fabricación de piezas a medida. La capacidad de iterar diseños rápidamente, reducir el desperdicio de material y acortar los plazos de entrega ha convertido la fabricación aditiva en una parte integral de los flujos de trabajo industriales modernos.
Se proyecta que el sector de la salud registre la tasa de crecimiento anual compuesta (TCAC) más rápida entre 2025 y 2032, impulsada por el crecimiento de las aplicaciones en implantes personalizados, prótesis dentales, modelos anatómicos y bioimpresión. La precisión y la personalización que permite la impresión 3D, junto con el desarrollo de materiales biocompatibles, están transformando la forma en que se brinda la atención personalizada en el ámbito médico.
Análisis regional del mercado de materiales de impresión 3D
- América del Norte dominó el mercado de materiales de impresión 3D con la mayor participación en los ingresos del 39,5 % en 2024, impulsada por la fuerte presencia de empresas líderes en fabricación aditiva, altas inversiones en I+D y una adopción generalizada en industrias como la aeroespacial, la atención médica y la automotriz.
- La región se beneficia de una infraestructura tecnológica avanzada y una alta concentración de manufactura impulsada por la innovación, lo que apoya el uso a gran escala de polímeros, metales y compuestos avanzados.
- Las iniciativas gubernamentales que promueven la fabricación digital y la presencia de los primeros usuarios consolidan aún más el liderazgo de América del Norte en el espacio de los materiales de impresión 3D, especialmente en aplicaciones industriales y médicas.
Perspectiva del mercado de materiales de impresión 3D en EE. UU.
El mercado estadounidense de materiales de impresión 3D capturó la mayor participación en los ingresos en 2024 en Norteamérica, impulsado por la sólida expansión de la fabricación aditiva en los sectores aeroespacial, de defensa y médico. El ecosistema de innovación del país, respaldado por los principales fabricantes de impresoras 3D e instituciones de investigación, promueve el desarrollo de materiales para aplicaciones de alto rendimiento. La creciente demanda de implantes personalizados, piezas ligeras para vehículos y prototipado avanzado continúa impulsando el consumo de materiales metálicos y poliméricos en todas las industrias.
Perspectivas del mercado europeo de materiales de impresión 3D
Se proyecta que el mercado europeo de materiales de impresión 3D se expandirá a una tasa de crecimiento anual compuesta (TCAC) notable durante el período de pronóstico, gracias a una sólida base manufacturera, innovaciones impulsadas por la sostenibilidad e iniciativas de transformación digital impulsadas por los gobiernos. Las empresas europeas se centran cada vez más en polímeros de origen biológico, materiales reciclables y métodos de producción eficientes para reducir el impacto ambiental, cumpliendo al mismo tiempo con los altos estándares regulatorios. El crecimiento de la región se ve reforzado por la creciente adopción en los sectores automotriz y médico, junto con la expansión de su uso en bienes de consumo y aplicaciones educativas.
Perspectivas del mercado de materiales de impresión 3D del Reino Unido
Se prevé que el mercado británico de materiales de impresión 3D crezca a una tasa de crecimiento anual compuesta (TCAC) notable durante el período de pronóstico, impulsado por la creciente inversión en tecnologías de la Industria 4.0 y la demanda de fabricación localizada y rápida. Los sectores sanitario y aeroespacial del país están adoptando activamente la fabricación aditiva, impulsando el uso de polímeros avanzados y polvos metálicos. Las iniciativas gubernamentales y las colaboraciones entre la academia y la industria están impulsando la innovación y la comercialización de materiales.
Análisis del mercado alemán de materiales de impresión 3D
Se espera que el mercado alemán de materiales de impresión 3D se expanda a una tasa de crecimiento anual compuesta (TCAC) considerable durante el período de pronóstico, gracias a su sólida base industrial, su énfasis en la excelencia en ingeniería y su innovación en la ciencia de los materiales. Alemania está a la vanguardia de la fabricación aditiva de metales y realiza importantes inversiones en investigación relacionada con aleaciones de alto rendimiento, compuestos cerámicos y polímeros sostenibles. La demanda de los sectores automotriz, de herramientas y médico continúa impulsando la necesidad de materiales especializados.
Análisis del mercado de materiales de impresión 3D en Asia-Pacífico
Se prevé que el mercado de materiales de impresión 3D en Asia-Pacífico crezca a la tasa de crecimiento anual compuesta (TCAC) más alta durante el período de pronóstico de 2025 a 2032, impulsado por la expansión de la industrialización, el respaldo gubernamental a las tecnologías digitales y la creciente asequibilidad de los sistemas y materiales de impresión 3D. El rápido crecimiento económico, en particular en China, Japón e India, está impulsando la adopción en sectores como la educación, la electrónica, la construcción y la salud. La región también se beneficia de una sólida base de proveedores de materiales y de una creciente producción nacional, lo que facilita el acceso a la impresión 3D para las pymes.
Análisis del mercado de materiales de impresión 3D en Japón
El mercado japonés de materiales de impresión 3D experimenta un crecimiento constante gracias al enfoque del país en la ingeniería de precisión, la miniaturización y la fabricación inteligente. La alta demanda de los sectores de la electrónica, los dispositivos médicos y la automoción impulsa el desarrollo de polímeros funcionales y cerámicas avanzadas. El énfasis estratégico de Japón en la sostenibilidad y el rendimiento avanzado de los materiales está acelerando su adopción, especialmente en las industrias orientadas a la investigación y la exportación.
Análisis del mercado de materiales de impresión 3D en China
El mercado chino de materiales de impresión 3D representó la mayor participación en los ingresos de Asia-Pacífico en 2024, impulsado por una fuerte inversión en tecnologías de fabricación y la creciente demanda de productos impresos en 3D. La amplia capacidad de producción nacional del país y las políticas de incentivos a la innovación están impulsando el uso de polímeros, metales y materiales cerámicos. Como parte de la estrategia de fabricación inteligente de China, la impresión 3D se está integrando en los sectores de la automoción, la salud y la electrónica de consumo, impulsando la demanda de materiales.
Cuota de mercado de materiales de impresión 3D
La industria de materiales de impresión 3D está liderada principalmente por empresas bien establecidas, entre las que se incluyen:
- Formlabs (EE. UU.)
- EOS (Alemania)
- ENVISIONTEC US LLC (EE. UU.)
- Elementos americanos (EE. UU.)
- Höganäs AB (Suecia)
- UltiMaker (Países Bajos)
- Carbon, Inc. (EE. UU.)
- KRAIBURG TPE GmbH & Co. KG (Alemania)
- Covestro AG (Alemania)
- Markforged, Inc. (EE. UU.)
- Stratasys (EE. UU./Israel)
- ExOne (EE. UU.)
- Arkema (Francia)
- 3D Systems, Inc. (EE. UU.)
- Evonik Industries AG (Alemania)
- Materialise (Bélgica)
- BASF (Alemania)
- Sandvik AB (Suecia)
- Solvay (Bélgica)
Últimos avances en el mercado global de materiales de impresión 3D
- En octubre de 2023, EOS lanzó su red de Arquitectos de Espuma Digital, diseñada para acelerar el desarrollo y la fabricación aditiva (FA) de productos de consumo, médicos e industriales con aplicaciones de Espuma Digital. Espuma Digital no es un producto, sino un enfoque para la impresión 3D de productos similares a la espuma. Esto marcará una nueva dirección para la empresa en el sector de los materiales de impresión 3D.
- En junio de 2023, CRP Technology lanzó Windform XT 2.0 IMG, el primer material de moldeo por inyección fabricado íntegramente con materiales de impresión 3D Windform XT 2.0 reciclados. Este compuesto de nailon PA12 reforzado con fibra de carbono impulsa la transición del mercado hacia la fabricación sostenible, permitiendo una transición fluida del prototipado a la producción en masa, a la vez que reduce el impacto ambiental. Esta innovación fortalece el mercado de materiales de impresión 3D al responder a la creciente demanda de soluciones ecológicas y de alto rendimiento en aplicaciones industriales.
- En abril de 2023, Stratasys completó la adquisición del negocio de materiales de fabricación aditiva de Covestro, incorporando aproximadamente 60 materiales avanzados y una sólida cartera de propiedad intelectual a su oferta. Esta operación fortalece significativamente la posición de Stratasys en el mercado de materiales de impresión 3D, ampliando su alcance en sectores como el aeroespacial y el sanitario. La adquisición impulsa la capacidad de innovación, especialmente en las tecnologías de estereolitografía y fusión de lecho de polvo, acelerando así el crecimiento del mercado y la diferenciación competitiva.
- En febrero de 2023, Bauer Hockey, líder mundial en innovación de equipamiento de hockey, y EOS, empresa pionera y líder del mercado en la impresión 3D industrial, colaboraron para incorporar la fabricación aditiva (FA o impresión 3D) al programa de equipos personalizados MyBauer de Bauer. EOS y su enfoque patentado de Espuma Digital para la impresión de polímeros proporcionaron a Bauer una ventaja distintiva. Esto fortalecerá la presencia de EOS en el mercado de materiales de impresión 3D.
SKU-
Obtenga acceso en línea al informe sobre la primera nube de inteligencia de mercado del mundo

- Panel de análisis de datos interactivo
- Panel de análisis de empresas para oportunidades con alto potencial de crecimiento
- Acceso de analista de investigación para personalización y consultas
- Análisis de la competencia con panel interactivo
- Últimas noticias, actualizaciones y análisis de tendencias
- Aproveche el poder del análisis de referencia para un seguimiento integral de la competencia
Tabla de contenido
1 INTRODUCTION
1.1 OBJECTIVES OF THE STUDY
1.2 MARKET DEFINITION
1.3 OVERVIEW
1.4 LIMITATIONS
1.5 MARKETS COVERED
2 MARKET SEGMENTATION
2.1 MARKETS COVERED
2.2 GEOGRAPHICAL SCOPE
2.3 YEARS CONSIDERED FOR THE STUDY
2.4 CURRENCY AND PRICING
2.5 DBMR TRIPOD DATA VALIDATION MODEL
2.6 MULTIVARIATE MODELING
2.7 PRIMARY INTERVIEWS WITH KEY OPINION LEADERS
2.8 DBMR MARKET POSITION GRID
2.9 MARKET END USER COVERAGE GRID
2.1 DBMR VENDOR SHARE ANALYSIS
2.11 SECONDARY SOURCES
2.12 ASSUMPTIONS
3 EXECUTIVE SUMMARY
4 PREMIUM INSIGHTS
4.1 PORTER’S FIVE FORCES
4.1.1 THREAT OF NEW ENTRANTS
4.1.2 THREAT OF SUBSTITUTES
4.1.3 BARGAINING POWER OF BUYERS
4.1.4 BARGAINING POWER OF SUPPLIERS
4.1.5 COMPETITIVE RIVALRY
4.2 PRICE TREND ANALYSIS
4.3 PRODUCTION CONSUMPTION ANALYSIS
4.3.1 ESTIMATED PRODUCTION CONSUMPTION ANALYSIS
4.4 SUPPLY CHAIN ANALYSIS
4.4.1 OVERVIEW
4.4.1.1 RAW MATERIAL SUPPLIERS
4.4.1.2 MATERIAL MANUFACTURERS
4.4.1.3 DISTRIBUTION AND LOGISTICS
4.4.1.4 3D PRINTER MANUFACTURERS
4.4.1.5 END-USERS
4.4.1.6 RESEARCH AND DEVELOPMENT
4.4.1.7 REGULATORY COMPLIANCE AND QUALITY ASSURANCE
4.4.2 LOGISTIC COST SCENARIO
4.4.3 IMPORTANCE OF LOGISTICS SERVICE PROVIDERS
4.5 TECHNOLOGICAL ADVANCEMENTS BY MANUFACTURERS
4.6 IMPORT-EXPORT ANALYSIS (USD THOUSAND)
4.6.1 IMPORT DATA
4.6.2 EXPORT DATA
5 REGULATION COVERAGE
6 MARKET OVERVIEW
6.1 DRIVERS
6.1.1 INCREASED ADOPTION OF 3D PRINTING IN VARIOUS INDUSTRIES
6.1.2 RISE IN PROTOTYPING AND RAPID TOOLING
6.1.3 EXPANDING ACCESSIBILITY AND AFFORDABILITY OF 3D PRINTING TECHNOLOGIES
6.1.4 DEVELOPMENT OF NEW MATERIALS WITH DIFFERENT PROPERTIES AND APPLICATIONS
6.2 RESTRAINTS
6.2.1 STRINGENT STANDARDIZATION, REGULATIONS AND CERTIFICATIONS ASSOCIATED WITH 3D PRINTING MATERIALS
6.2.2 LACK OF SKILLED LABORS IN 3D PRINTING SECTOR
6.3 OPPORTUNITIES
6.3.1 ADVANCEMENTS IN 3D PRINTING TECHNOLOGIES
6.3.2 EXTENSIVE DEMAND FOR BIOCOMPATIBLE MATERIALS FOR MEDICAL APPLICATIONS
6.3.3 EASE OF PERSONALIZATION AND CUSTOMIZATION OF PRODUCTS
6.4 CHALLENGES
6.4.1 HIGH COSTS ASSOCIATED WITH ADVANCED OR SPECIALTY 3D PRINTING MATERIALS
6.4.2 EXTENSIVE POST-PROCESSING REQUIREMENTS
7 GLOBAL 3D PRINTING MATERIALS MARKET, BY TYPE
7.1 OVERVIEW
7.2 PLASTICS/POLYMERS
7.3 METAL
7.4 CERAMIC
7.5 OTHERS
8 GLOBAL 3D PRINTING MATERIALS MARKET, BY FORM
8.1 OVERVIEW
8.2 POWDER
8.3 FILAMENT
8.4 LIQUID
9 GLOBAL 3D PRINTING MATERIALS MARKET, BY TECHNOLOGY
9.1 OVERVIEW
9.2 FUSED DEPOSITION MODELING (FDM)
9.3 SELECTIVE LASER SINTERING (SLS)
9.4 STEREOLITHOGRAPHY (SLA)
9.5 DIRECT METAL LASER SINTERING (DMLS)
9.6 BIG AREA ADDITIVE MANUFACTURING (BAAM)
9.7 WIRE ARC ADDITIVE MANUFACTURING (WAAM)
9.8 COLORJET
9.9 OTHERS
10 GLOBAL 3D PRINTING MATERIALS MARKET, BY END-USE
10.1 OVERVIEW
10.2 INDUSTRIAL MANUFACTURING
10.3 AUTOMOTIVE
10.4 HEALTHCARE
10.5 AEROSPACE & DEFENSE
10.6 CONSUMER GOODS
10.7 ELECTRONICS
10.8 EDUCATION
10.9 CONSTRUCTION
10.1 OTHERS
11 GLOBAL 3D PRINTING MATERIALS MARKET, BY REGION
11.1 OVERVIEW
1.1 NORTH AMERICA
11.1.1 U.S.
11.1.2 CANADA
11.1.3 MEXICO
11.2 EUROPE
11.2.1 GERMANY
11.2.2 ITALY
11.2.3 U.K.
11.2.4 FRANCE
11.2.5 SPAIN
11.2.6 TURKEY
11.2.7 RUSSIA
11.2.8 SWITZERLAND
11.2.9 BELGIUM
11.2.10 NETHERLANDS
11.2.11 LUXEMBOURG
11.2.12 REST OF EUROPE
11.3 ASIA PACIFIC
11.3.1 CHINA
11.3.2 JAPAN
11.3.3 INDIA
11.3.4 SOUTH KOREA
11.3.5 SINGAPORE
11.3.6 INDONESIA
11.3.7 THAILAND
11.3.8 PHILIPPINES
11.3.9 AUSTRALIA & NEW ZEALAND
11.3.10 MALAYSIA
11.3.11 REST OF ASIA-PACIFIC
11.4 MIDDLE EAST AND AFRICA
11.4.1 UNITED ARAB EMIRATES
11.4.2 SAUDI ARABIA
11.4.3 EGYPT
11.4.4 SOUTH AFRICA
11.4.5 ISRAEL
11.4.6 REST OF MIDDLE EAST AND AFRICA
11.5 SOUTH AMERICA
11.5.1 BRAZIL
11.5.2 ARGENTINA
11.5.3 REST OF SOUTH AMERICA
12 GLOBAL 3D PRINTING MATERIALS MARKET: COMPANY LANDSCAPE
12.1 COMPANY SHARE ANALYSIS: GLOBAL
12.2 COMPANY SHARE ANALYSIS: EUROPE
12.3 COMPANY SHARE ANALYSIS: ASIA-PACIFIC
12.4 COMPANY SHARE ANALYSIS: NORTH AMERICA
13 SWOT ANALYSIS
14 COMPANY PROFILES
14.1 STRATASYS
14.1.1 COMPANY SNAPSHOT
14.1.2 REVENUE ANALYSIS
14.1.3 COMPANY SHARE ANALYSIS
14.1.4 PRODUCT PORTFOLIO
14.1.5 RECENT DEVELOPMENTS
14.2 EOS
14.2.1 COMPANY SNAPSHOT
14.2.2 COMPANY SHARE ANALYSIS
14.2.3 PRODUCT PORTFOLIO
14.2.4 RECENT DEVELOPMENTS
14.3 3D SYSTEMS, INC.
14.3.1 COMPANY SNAPSHOT
14.3.2 REVENUE ANALYSIS
14.3.3 COMPANY SHARE ANALYSIS
14.3.4 PRODUCT PORTFOLIO
14.3.5 RECENT DEVELOPMENTS
14.4 BASF SE
14.4.1 COMPANY SNAPSHOT
14.4.2 REVENUE ANALYSIS
14.4.3 COMPANY SHARE ANALYSIS
14.4.4 PRODUCT PORTFOLIO
14.4.5 RECENT DEVELOPMENT
14.5 FORMLABS
14.5.1 COMPANY SNAPSHOT
14.5.2 COMPANY SHARE ANALYSIS
14.5.3 PRODUCT PORTFOLIO
14.5.4 RECENT DEVELOPMENTS
14.6 AMERICAN ELEMENTS
14.6.1 COMPANY SNAPSHOT
14.6.2 PRODUCT PORTFOLIO
14.6.3 RECENT DEVELOPMENTS
14.7 ARKEMA
14.7.1 COMPANY SNAPSHOT
14.7.2 REVENUE ANALYSIS
14.7.3 PRODUCT PORTFOLIO
14.7.4 RECENT DEVELOPMENT
14.8 CARBON, INC.
14.8.1 COMPANY SNAPSHOT
14.8.2 PRODUCT PORTFOLIO
14.8.3 RECENT DEVELOPMENTS
14.9 COVESTRO AG
14.9.1 COMPANY SNAPSHOT
14.9.2 REVENUE ANALYSIS
14.9.3 PRODUCT PORTFOLIO
14.9.4 RECENT DEVELOPMENTS
14.1 ENVISIONTEC US LLC
14.10.1 COMPANY SNAPSHOT
14.10.2 PRODUCT PORTFOLIO
14.10.3 RECENT DEVELOPMENTS
14.11 EVONIK INDUSTRIES AG
14.11.1 COMPANY SNAPSHOT
14.11.2 REVENUE ANALYSIS
14.11.3 PRODUCT PORTFOLIO
14.11.4 RECENT DEVELOPMENTS
14.12 EXONE
14.12.1 COMPANY SNAPSHOT
14.12.2 PRODUCT PORTFOLIO
14.12.3 RECENT DEVELOPMENTS
14.13 HÖGANÄS AB
14.13.1 COMPANY SNAPSHOT
14.13.2 PRODUCT PORTFOLIO
14.13.3 RECENT DEVELOPMENTS
14.14 KRAIBURG TPE GMBH & CO. KG
14.14.1 COMPANY SNAPSHOT
14.14.2 PRODUCT PORTFOLIO
14.14.3 RECENT DEVELOPMENTS
14.15 MARKFORGED, INC.
14.15.1 COMPANY SNAPSHOT
14.15.2 REVENUE ANALYSIS
14.15.3 PRODUCT PORTFOLIO
14.15.4 RECENT DEVELOPMENTS
14.16 MATERIALISE
14.16.1 COMPANY SNAPSHOT
14.16.2 REVENUE ANALYSIS
14.16.3 PRODUCT PORTFOLIO
14.16.4 RECENT DEVELOPMENT
14.17 SANDVIK AB
14.17.1 COMPANY SNAPSHOT
14.17.2 REVENUE ANALYSIS
14.17.3 PRODUCT PORTFOLIO
14.17.4 RECENT DEVELOPMENT
14.18 SOLVAY
14.18.1 COMPANY SNAPSHOT
14.18.2 REVENUE ANALYSIS
14.18.3 PRODUCT PORTFOLIO
14.18.4 RECENT DEVELOPMENT
14.19 ULTIMAKER
14.19.1 COMPANY SNAPSHOT
14.19.2 PRODUCT PORTFOLIO
14.19.3 RECENT DEVELOPMENTS
15 QUESTIONNAIRE
16 RELATED REPORTS
Metodología de investigación
La recopilación de datos y el análisis del año base se realizan utilizando módulos de recopilación de datos con muestras de gran tamaño. La etapa incluye la obtención de información de mercado o datos relacionados a través de varias fuentes y estrategias. Incluye el examen y la planificación de todos los datos adquiridos del pasado con antelación. Asimismo, abarca el examen de las inconsistencias de información observadas en diferentes fuentes de información. Los datos de mercado se analizan y estiman utilizando modelos estadísticos y coherentes de mercado. Además, el análisis de la participación de mercado y el análisis de tendencias clave son los principales factores de éxito en el informe de mercado. Para obtener más información, solicite una llamada de un analista o envíe su consulta.
La metodología de investigación clave utilizada por el equipo de investigación de DBMR es la triangulación de datos, que implica la extracción de datos, el análisis del impacto de las variables de datos en el mercado y la validación primaria (experto en la industria). Los modelos de datos incluyen cuadrícula de posicionamiento de proveedores, análisis de línea de tiempo de mercado, descripción general y guía del mercado, cuadrícula de posicionamiento de la empresa, análisis de patentes, análisis de precios, análisis de participación de mercado de la empresa, estándares de medición, análisis global versus regional y de participación de proveedores. Para obtener más información sobre la metodología de investigación, envíe una consulta para hablar con nuestros expertos de la industria.
Personalización disponible
Data Bridge Market Research es líder en investigación formativa avanzada. Nos enorgullecemos de brindar servicios a nuestros clientes existentes y nuevos con datos y análisis que coinciden y se adaptan a sus objetivos. El informe se puede personalizar para incluir análisis de tendencias de precios de marcas objetivo, comprensión del mercado de países adicionales (solicite la lista de países), datos de resultados de ensayos clínicos, revisión de literatura, análisis de mercado renovado y base de productos. El análisis de mercado de competidores objetivo se puede analizar desde análisis basados en tecnología hasta estrategias de cartera de mercado. Podemos agregar tantos competidores sobre los que necesite datos en el formato y estilo de datos que esté buscando. Nuestro equipo de analistas también puede proporcionarle datos en archivos de Excel sin procesar, tablas dinámicas (libro de datos) o puede ayudarlo a crear presentaciones a partir de los conjuntos de datos disponibles en el informe.

