
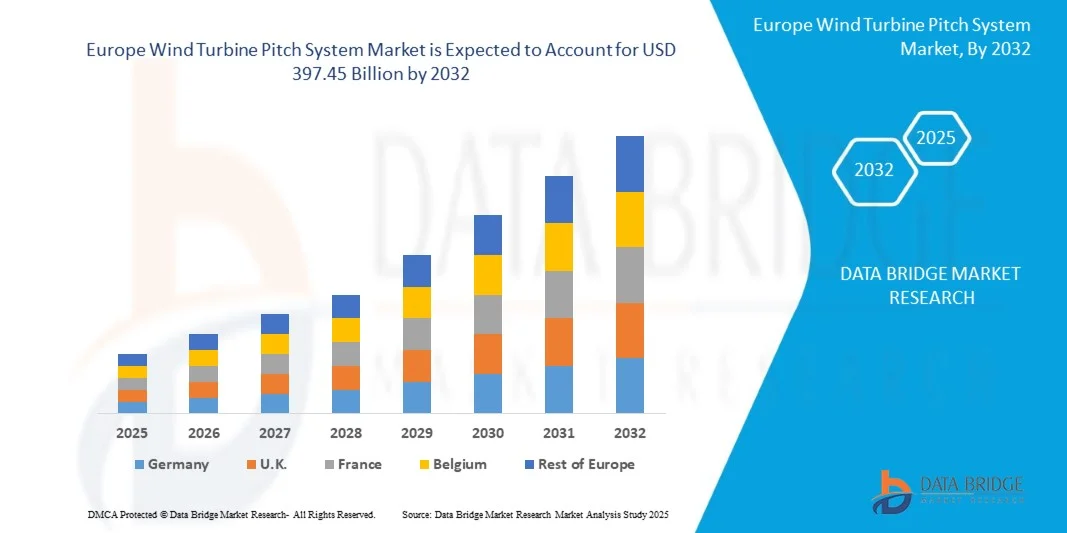
Europe Wind Turbine Pitch System Market
Tamaño del mercado en miles de millones de dólares
Tasa de crecimiento anual compuesta (CAGR) :
% 
 USD
285.99 Million
USD
397.45 Million
2024
2032
USD
285.99 Million
USD
397.45 Million
2024
2032
| 2025 –2032 | |
| USD 285.99 Million | |
| USD 397.45 Million | |
| % | |
|
Segmentación del mercado europeo de sistemas de paso de turbinas eólicas por tipo de producto (válvulas de paso, bombas de paso, motores de paso, servoaccionamientos de paso, solución de terminal remoto, etc.), función (alta fiabilidad de rodamientos, control y monitorización de vibraciones, ajustes del ángulo del viento, sistema de monitorización de estado, etc.), diámetro (menos de 80 m y más de 80 ms), potencia de la turbina (más de 3 MW, de 1 MW a 3 MW y menos de 1 MW), servicios (servicios de campo, servicios de ingeniería, servicios técnicos, mediciones y registro de datos, servicios posventa, etc.), tipo de sistema (sistema de paso eléctrico y sistema de paso hidráulico), aplicación (turbinas marinas y terrestres): tendencias del sector y pronóstico hasta 2032.
Tamaño del mercado de sistemas de paso de turbinas eólicas en Europa
- El tamaño del mercado de sistemas de paso de turbinas eólicas de Europa se valoró en USD 285,99 millones en 2024 y se espera que alcance los USD 397,45 millones para 2032 , con una CAGR del 4,2% durante el período de pronóstico.
- El crecimiento del mercado se debe en gran medida al creciente despliegue de turbinas eólicas terrestres y marinas en todo el mundo, impulsado por el impulso a las energías renovables y la reducción de las emisiones de carbono. Los avances tecnológicos en los componentes del sistema de paso, como motores, servoaccionamientos y sistemas de control, están mejorando la eficiencia, la fiabilidad y la producción energética de las turbinas.
- Además, el aumento de las inversiones en proyectos eólicos a gran escala y el creciente énfasis en el mantenimiento predictivo y los sistemas de monitorización inteligente están consolidando los sistemas avanzados de paso como componentes esenciales para el rendimiento óptimo de las turbinas. Estos factores convergentes están acelerando la adopción de soluciones de paso de alta precisión, impulsando así significativamente el crecimiento de la industria.
Análisis del mercado de sistemas de paso de turbinas eólicas en Europa
- Los sistemas de paso de las turbinas eólicas son mecanismos que controlan el ángulo de las palas para optimizar la captación de energía, reducir la tensión mecánica y garantizar la seguridad operativa. Estos sistemas incluyen motores de paso, válvulas, servoaccionamientos y soluciones de monitorización que se integran con las plataformas de control de turbinas para mejorar el rendimiento y la longevidad.
- La creciente demanda de sistemas de paso de turbinas eólicas se debe principalmente a la expansión de la infraestructura de energías renovables, el aumento del tamaño de las turbinas y la necesidad de alta eficiencia y fiabilidad en instalaciones tanto terrestres como marinas. La innovación continua en el diseño y la automatización de sistemas impulsa aún más el crecimiento del mercado.
- Alemania dominó el mercado de sistemas de paso de turbinas eólicas en 2024, debido a sus extensas instalaciones eólicas terrestres y marinas, los fuertes compromisos gubernamentales con las energías renovables y las capacidades de ingeniería avanzadas en la fabricación de turbinas eólicas.
- Se espera que el Reino Unido sea el país de más rápido crecimiento en el mercado de sistemas de paso de turbinas eólicas durante el período de pronóstico debido a proyectos eólicos marinos a gran escala, objetivos de energía renovable respaldados por el gobierno y la rápida adopción de tecnologías avanzadas de control de paso.
- El segmento de turbinas marinas dominó el mercado con una cuota de mercado del 87,9 % en 2024, gracias al despliegue de turbinas a gran escala en parques eólicos que maximizan la generación de energía. Las turbinas marinas requieren sistemas de paso de alta fiabilidad para soportar entornos marinos hostiles y fuertes cargas de viento. El control avanzado de las palas garantiza la seguridad operativa, una captura óptima de energía y una mayor vida útil de las turbinas. La elevada inversión en infraestructura eólica marina a nivel mundial impulsa aún más este segmento. Las innovaciones tecnológicas en los sistemas de paso de las palas contribuyen a la durabilidad y la eficiencia.
Alcance del informe y segmentación del mercado de sistemas de paso de turbinas eólicas en Europa
|
Atributos |
Perspectivas clave del mercado de sistemas de paso de turbinas eólicas en Europa |
|
Segmentos cubiertos |
|
|
Países cubiertos |
Europa
|
|
Actores clave del mercado |
|
|
Oportunidades de mercado |
|
|
Conjuntos de información de datos de valor añadido |
Además de los conocimientos sobre escenarios de mercado como valor de mercado, tasa de crecimiento, segmentación, cobertura geográfica y actores principales, los informes de mercado seleccionados por Data Bridge Market Research también incluyen un análisis profundo de expertos, producción y capacidad por empresa representadas geográficamente, diseños de red de distribuidores y socios, análisis detallado y actualizado de tendencias de precios y análisis deficitario de la cadena de suministro y la demanda. |
Tendencias del mercado de sistemas de paso de turbinas eólicas en Europa
Aumento de la capacidad de energía eólica
- El mercado de sistemas de paso de turbinas eólicas está experimentando un sólido crecimiento gracias a la continua expansión de proyectos de energía eólica, impulsada por la urgente necesidad de generación de energía renovable. Los sistemas de paso son esenciales para controlar el ángulo de las palas de las turbinas, garantizando la máxima eficiencia, seguridad y fiabilidad de la producción en condiciones de viento variables.
- Por ejemplo, empresas como Vestas y Siemens Gamesa han invertido en sistemas avanzados de control de paso de palas que mejoran el rendimiento de las turbinas y reducen el tiempo de inactividad operativa. Sus innovaciones subrayan la importancia de la tecnología de control de paso para lograr mayores índices de utilización de la capacidad en parques eólicos terrestres y marinos.
- A medida que la capacidad mundial de energía eólica continúa expandiéndose, los sistemas de paso desempeñan un papel crucial para permitir diseños de turbinas más grandes y con mayor eficiencia. Los sistemas de control avanzados garantizan una mayor vida útil de los componentes y curvas de potencia optimizadas, lo que mejora la rentabilidad de los proyectos eólicos.
- Las crecientes inversiones en parques eólicos marinos han intensificado aún más la demanda de soluciones fiables de control de paso. Las turbinas marinas, sujetas a condiciones ambientales más adversas, dependen de sistemas avanzados de control de paso hidráulico y eléctrico para soportar la variabilidad y mejorar la resiliencia, a la vez que maximizan la producción de electricidad.
- Los avances tecnológicos en digitalización y mantenimiento predictivo se están integrando en los sistemas de paso modernos, lo que permite la monitorización en tiempo real y la detección de fallos. Estas innovaciones mejoran la fiabilidad de las turbinas, reducen los costes de mantenimiento y aumentan la eficiencia operativa a largo plazo de los productores de energía.
- El aumento de la capacidad eólica pone de relieve el papel fundamental de los sistemas de paso para garantizar una generación de energía eólica segura, eficiente y rentable. Esta tendencia seguirá reforzando su importancia a medida que las energías renovables se conviertan en un elemento central de las estrategias de infraestructura energética.
Dinámica del mercado de sistemas de paso de turbinas eólicas en Europa
Conductor
Políticas gubernamentales favorables
- Las políticas gubernamentales favorables que apoyan el desarrollo de las energías renovables son un importante impulsor del mercado de sistemas de control de paso de aerogeneradores, ya que los incentivos y los marcos regulatorios fomentan la expansión de la infraestructura eólica. Los subsidios, los créditos fiscales y los objetivos de energía renovable están impulsando la inversión en nuevos proyectos eólicos en todo el mundo.
- Por ejemplo, el Crédito Fiscal a la Producción (CFP) del gobierno estadounidense y las políticas del Pacto Verde Europeo han acelerado la instalación de capacidad eólica. Empresas globales de aerogeneradores como GE Renewable Energy y Nordex están ampliando su oferta de sistemas de pitch para satisfacer la demanda generada por proyectos impulsados por políticas.
- Las iniciativas gubernamentales suelen centrarse en objetivos de neutralidad de carbono a largo plazo, impulsando a las empresas de servicios públicos y a los promotores a adoptar turbinas más grandes con componentes innovadores, como sistemas de paso avanzados. Esto garantiza el cumplimiento de los objetivos climáticos, a la vez que mejora la eficiencia y reduce el coste de la electricidad renovable.
- En las economías emergentes, las políticas favorables de energías renovables en países como India y China están impulsando una rápida expansión de las instalaciones eólicas. Estos programas impulsan directamente la demanda de sistemas de pitch, ya que los proveedores de tecnología buscan acelerar la implementación de proyectos.
- La alineación de los compromisos climáticos globales, el apoyo financiero público y las inversiones del sector privado garantizan que las políticas gubernamentales seguirán siendo un impulsor clave para la adopción generalizada de turbinas eólicas y sus sistemas de paso asociados en todos los mercados.
Restricción/Desafío
Alta inversión inicial
- Un desafío importante en el mercado de sistemas de control de paso de aerogeneradores es el elevado capital inicial que requieren las tecnologías avanzadas de control de paso, lo que incrementa el coste total de instalación y financiación de los proyectos. Esta sensibilidad al coste disuade a los pequeños promotores y a los mercados emergentes.
- Por ejemplo, muchos productores independientes de energía en regiones en desarrollo tienen dificultades para obtener financiación para proyectos que requieren sistemas de paso premium de proveedores como Siemens Gamesa y Vestas. Los mayores costes de adquisición e instalación limitan la accesibilidad para los operadores sensibles a los precios, a pesar de los beneficios operativos a largo plazo.
- En comparación con las fuentes de energía convencionales, los proyectos eólicos ya requieren grandes inversiones en infraestructura de turbinas, integración en la red eléctrica y adquisición de terrenos. Los costos adicionales asociados a los sistemas avanzados de ajuste del paso de las palas aumentan la carga financiera durante las primeras fases del proyecto.
- La complejidad de la instalación y el mantenimiento incrementa aún más los costos del ciclo de vida, ya que los sistemas de paso avanzados requieren técnicos cualificados y la sustitución periódica de componentes. Esto puede suponer un reto para proyectos en regiones remotas o emergentes con infraestructura técnica limitada.
- Para afrontar el reto de los elevados costes iniciales se requerirán estructuras de financiación innovadoras, asociaciones y tecnologías de lanzamiento optimizadas en costes que reduzcan los gastos sin comprometer la eficiencia. Estas soluciones serán fundamentales para garantizar una adopción más amplia y la competitividad a largo plazo de la energía eólica a nivel mundial.
Alcance del mercado de sistemas de paso de turbinas eólicas en Europa
El mercado está segmentado según el tipo de producto, la función, el diámetro, la potencia de la turbina, los servicios, el tipo de sistema y la aplicación.
• Por tipo de producto
Según el tipo de producto, el mercado de sistemas de control de paso de turbinas eólicas se segmenta en válvulas de paso, bombas de paso, motores de paso, servoaccionamientos de paso, soluciones de terminal remoto, entre otros. El segmento de motores de paso dominó la mayor cuota de mercado en 2024, impulsado por su papel fundamental en el control preciso del ángulo de las palas y la maximización de la captura de energía. Los motores de paso garantizan un movimiento suave de las palas en condiciones de viento variables, lo que mejora la eficiencia operativa y reduce la tensión mecánica. Su compatibilidad con los sistemas de control de turbinas y su capacidad para soportar turbinas terrestres y marinas impulsan aún más su adopción. Los avances tecnológicos están mejorando la durabilidad de los motores y reduciendo los ciclos de mantenimiento, aumentando así su fiabilidad. Los fabricantes prefieren los motores de paso para la modernización y la instalación de nuevas turbinas debido a estas ventajas operativas.
Se prevé que el segmento de servoaccionamientos de paso registre el mayor crecimiento entre 2025 y 2032, impulsado por la creciente demanda de automatización y sistemas de control de alta capacidad de respuesta. Los servoaccionamientos permiten ajustes precisos del paso de las palas en tiempo real, optimizando la producción de energía y minimizando el desgaste de los componentes de la turbina. Su integración con software avanzado de control de turbinas y sistemas de mantenimiento predictivo mejora la monitorización del rendimiento. La adopción de soluciones de turbinas inteligentes y tecnologías de la Industria 4.0 impulsa aún más el crecimiento. El aumento de las inversiones en infraestructuras de energía renovable impulsa la implantación generalizada de estos componentes de alta precisión.
• Por función
En función de su función, el mercado se segmenta en alta fiabilidad de rodamientos, control y monitorización de vibraciones, ajustes del ángulo del viento, sistemas de monitorización de estado, entre otros. El segmento de ajustes del ángulo del viento dominó en 2024 debido a su papel crucial para maximizar la eficiencia de las turbinas. Un control preciso del ángulo del viento garantiza la orientación óptima de las palas para captar la energía eólica, a la vez que reduce la fatiga mecánica. Aumenta la vida útil de la turbina, mejora la producción de energía y minimiza el tiempo de inactividad. Tanto las turbinas terrestres como las marinas se benefician de sistemas avanzados de ajuste del ángulo del viento que se adaptan a las velocidades y direcciones cambiantes del viento. Las innovaciones continuas en algoritmos de control y sensores facilitan aún más la precisión de los ajustes.
Se prevé que el segmento de sistemas de monitorización de condición registre el mayor crecimiento entre 2025 y 2032, impulsado por la adopción del mantenimiento predictivo y la monitorización remota. Estos sistemas proporcionan información en tiempo real sobre el rendimiento de las turbinas, detectando posibles problemas antes de que se produzcan. La monitorización reduce las interrupciones operativas, disminuye los costes de mantenimiento y garantiza la seguridad. La integración con tecnologías de gemelos digitales e IoT permite la gestión proactiva de las flotas de turbinas. La creciente inversión en soluciones de optimización del rendimiento y fiabilidad impulsa el crecimiento de este segmento.
• Por tamaño de diámetro
Según el diámetro, el mercado se segmenta en turbinas de menos de 80 m y de más de 80 m. El segmento de más de 80 m dominó en 2024 debido al despliegue de turbinas marinas a gran escala. Los diámetros de rotor más grandes captan más energía eólica, lo que requiere sistemas avanzados de paso de palas para un control preciso. Estos sistemas reducen la tensión mecánica en las palas y los rodamientos, garantizando un funcionamiento estable con fuertes cargas de viento. Los proyectos a gran escala prefieren turbinas de mayor tamaño para una máxima eficiencia energética. Las mejoras tecnológicas en motores y variadores refuerzan aún más el rendimiento de las turbinas de gran diámetro. Este segmento se beneficia del aumento de la instalación de parques eólicos marinos a nivel mundial.
Se prevé que el segmento de menos de 80 mts experimente el mayor crecimiento entre 2025 y 2032, impulsado por proyectos terrestres de pequeña y mediana escala. Estas turbinas ofrecen soluciones rentables para la generación de energía distribuida y localizada. Las turbinas de menor diámetro requieren sistemas de paso compactos y eficientes, fáciles de instalar y mantener. El crecimiento en las economías emergentes y los proyectos eólicos residenciales o industriales impulsa este segmento. La flexibilidad en la implementación y la modernización de turbinas más antiguas también contribuye a su adopción.
• Por energía de turbina
Según la potencia de las turbinas, el mercado se segmenta en más de 3 MW, de 1 MW a 3 MW y menos de 1 MW. El segmento de más de 3 MW dominó en 2024 debido a su amplio despliegue en proyectos eólicos a gran escala. Las turbinas de alta capacidad requieren sistemas de paso sofisticados para un control preciso de las palas, la gestión de la carga y la optimización energética. Los sistemas avanzados de paso reducen la tensión mecánica y garantizan la fiabilidad a largo plazo. Las innovaciones tecnológicas mejoran el rendimiento, la eficiencia y la integración con soluciones inteligentes de gestión de turbinas. Los parques eólicos marinos utilizan principalmente turbinas de esta categoría para maximizar la producción energética. Estos sistemas son los preferidos para nuevas instalaciones en mercados eólicos consolidados.
Se prevé que el segmento de 1 MW a 3 MW experimente el mayor crecimiento entre 2025 y 2032, impulsado por su adopción en proyectos comerciales de pequeña y mediana escala. Las turbinas de este rango equilibran la rentabilidad y la capacidad de generación de energía. Los sistemas de paso fiables se utilizan cada vez más en proyectos de energía renovable industriales y comunitarios. La creciente adopción de energías renovables en los mercados emergentes impulsa el crecimiento del segmento. Las oportunidades de modernización y la expansión de las instalaciones de turbinas de tamaño mediano impulsan aún más la demanda.
• Por Servicios
En cuanto a los servicios, el mercado se segmenta en servicios de campo, servicios de ingeniería, servicios técnicos, mediciones y registro de datos, servicios posventa, entre otros. El segmento de servicios posventa dominó en 2024, impulsado por la creciente demanda de mantenimiento, reparaciones y reemplazo de componentes del sistema de paso a lo largo de la vida útil de la turbina. Los servicios posventa garantizan la continuidad operativa, prolongan la vida útil de la turbina y minimizan el tiempo de inactividad. Este segmento es especialmente crucial para las turbinas marinas, donde los costos de mantenimiento son elevados. El aumento del tamaño de la flota de turbinas a nivel mundial impulsa la adopción de servicios posventa. Los proveedores que ofrecen servicios predictivos y remotos obtienen ventajas competitivas en este segmento.
Se prevé que el segmento de medición y registro de datos experimente el mayor crecimiento entre 2025 y 2032, impulsado por la adopción de tecnologías de monitorización digital y optimización del rendimiento. La recopilación precisa de datos facilita el mantenimiento predictivo, la optimización del rendimiento energético y la prevención de fallos. La integración con el IoT, la analítica en la nube y los sistemas de control inteligente mejora la eficiencia operativa. El creciente enfoque en la fiabilidad de las turbinas, la previsión energética y el cumplimiento normativo acelera el crecimiento. Las continuas actualizaciones tecnológicas impulsan la adopción de soluciones de medición.
• Por tipo de sistema
Según el tipo de sistema, el mercado se segmenta en sistemas de paso eléctrico y sistemas de paso hidráulico. El segmento de sistemas de paso eléctrico dominó en 2024 gracias a su alta eficiencia, precisión y bajos requisitos de mantenimiento. Los sistemas eléctricos permiten una integración perfecta con el software de control de turbinas y las soluciones de mantenimiento predictivo. Proporcionan un rendimiento fiable en condiciones de viento variables y reducen los costes operativos. La creciente preferencia por soluciones de turbinas inteligentes en parques eólicos terrestres y marinos impulsa aún más su adopción. Los avances tecnológicos en el diseño compacto de motores y variadores mejoran la fiabilidad y la eficiencia energética.
Se prevé que el segmento de sistemas de paso hidráulico experimente el mayor crecimiento entre 2025 y 2032, impulsado por su robustez en condiciones de alta carga y su idoneidad para la modernización de turbinas antiguas. Los sistemas hidráulicos pueden soportar pares extremos y son los preferidos en instalaciones de servicio pesado. Su fiabilidad en condiciones ambientales adversas impulsa la demanda, especialmente en parques eólicos marinos. El aumento de los proyectos de mantenimiento y modernización impulsa el crecimiento del segmento. El sistema se adopta cada vez más en turbinas de gran tamaño, donde la precisión y la gestión de la carga son fundamentales.
• Por aplicación
Según su aplicación, el mercado se segmenta en turbinas marinas y terrestres. El segmento de turbinas marinas dominó el mercado con una participación del 87,9 % en 2024 gracias al despliegue de turbinas a gran escala en parques eólicos que maximizan la generación de energía. Las turbinas marinas requieren sistemas de paso altamente fiables para soportar entornos marinos hostiles y fuertes cargas de viento. El control avanzado de las palas garantiza la seguridad operativa, una captura óptima de energía y una mayor vida útil de la turbina. La elevada inversión en infraestructura eólica marina a nivel mundial impulsa aún más este segmento. Las innovaciones tecnológicas en los sistemas de paso contribuyen a la durabilidad y la eficiencia.
Se prevé que el segmento de turbinas terrestres experimente el mayor crecimiento entre 2025 y 2032, impulsado por proyectos de pequeña y mediana escala en economías emergentes. Las instalaciones terrestres se benefician de sistemas de paso rentables y de fácil mantenimiento. La creciente adopción de energías renovables y los incentivos gubernamentales impulsan el crecimiento del segmento. La flexibilidad para modernizar turbinas antiguas y expandir la generación de energía distribuida impulsa su adopción. El aumento de la implementación en ubicaciones remotas o descentralizadas impulsa aún más la demanda.
Análisis regional del mercado de sistemas de paso de turbinas eólicas en Europa
- Alemania dominó el mercado de sistemas de paso de turbinas eólicas con la mayor participación en los ingresos en 2024, impulsada por sus extensas instalaciones eólicas terrestres y marinas, los fuertes compromisos gubernamentales con las energías renovables y las capacidades de ingeniería avanzadas en la fabricación de turbinas eólicas.
- El liderazgo del país se ve reforzado por las continuas innovaciones tecnológicas en sistemas de control de paso, la adopción generalizada de turbinas de alto rendimiento y las importantes inversiones en expansiones de parques eólicos marinos.
- La creciente demanda de soluciones de precisión para optimizar el rendimiento energético y reducir los costes de mantenimiento refuerza aún más la posición de Alemania. Las colaboraciones estratégicas entre los principales proveedores mundiales de tecnología eólica y los fabricantes nacionales siguen consolidando el liderazgo de Alemania en el mercado regional.
Análisis del mercado de sistemas de paso de turbinas eólicas en el Reino Unido
Se proyecta que el mercado del Reino Unido registre la tasa de crecimiento anual compuesta (TCAC) más rápida de Europa durante el período 2025-2032, impulsado por proyectos eólicos marinos a gran escala, objetivos de energía renovable respaldados por el gobierno y la rápida adopción de tecnologías avanzadas de control de paso. El aumento de las inversiones en turbinas marinas de nueva generación, junto con la integración de sistemas de monitorización inteligente y mantenimiento predictivo, está acelerando la penetración en el mercado. El sólido apoyo político a la neutralidad de carbono, junto con las alianzas entre proveedores globales de turbinas y desarrolladores locales, mejora aún más las perspectivas de crecimiento. El enfoque del Reino Unido en la innovación tecnológica, la modernización de la red eléctrica y la transición energética sostenible respalda su consolidación como el mercado de mayor crecimiento de la región.
Análisis del mercado de sistemas de paso de turbinas eólicas en Francia
Se prevé que Francia experimente un crecimiento sostenido durante el período 2025-2032, impulsado por la expansión de proyectos eólicos marinos, incentivos gubernamentales favorables y el aumento de la inversión en infraestructura de energía limpia. La creciente adopción de sistemas de paso de alta fiabilidad para garantizar una generación de energía estable en condiciones eólicas variables está impulsando la expansión del mercado. Las colaboraciones entre proveedores internacionales de tecnología eólica y empresas energéticas nacionales están mejorando la disponibilidad y la experiencia técnica de los sistemas. Los compromisos gubernamentales para cumplir los objetivos de energía renovable, junto con un enfoque creciente en la monitorización digital y soluciones de mantenimiento rentables, refuerzan las sólidas perspectivas de mercado de Francia a largo plazo.
Cuota de mercado de sistemas de paso de turbinas eólicas en Europa
La industria de sistemas de paso de turbinas eólicas está liderada principalmente por empresas bien establecidas, entre las que se incluyen:
- Vestas (Dinamarca)
- Siemens Gamesa Energías Renovables (España)
- General Electric Renewable Energy (EE. UU.)
- Senvion (Alemania)
- Nordex SE (Alemania)
- Viento dorado (China)
- Suzlon Energy (India)
- Envision Energy (China)
- Energía inteligente Mingyang (China)
- Enercon (Alemania)
- Acciona Energía (España)
- Mita-Teknik (Dinamarca)
- Moog Inc. (EE. UU.)
- Atech Antriebstechnik (Alemania)
- Parker Hannifin Corporation (EE. UU.)
Últimos avances en el mercado europeo de sistemas de paso de turbinas eólicas
- En octubre de 2021, General Electric lanzó su segundo molde de palas para aerogeneradores de 107 metros en sus instalaciones de Cherburgo (Francia), con el objetivo de producir palas para aerogeneradores marinos de más de 100 metros para sus turbinas Haliade-X. Esta iniciativa subraya el compromiso de GE de satisfacer la creciente demanda de soluciones eólicas marinas de alta capacidad y consolida su posición como actor clave en el mercado eólico marino. Al ampliar su capacidad de producción de palas, GE mejora la eficiencia, impulsa el despliegue de turbinas a gran escala y atiende la creciente necesidad de generación de energía renovable en todo el mundo.
- En febrero de 2021, KEB Automation informó de un aumento repentino en la demanda de sus controladores de accionamiento, frenos y motores para aerogeneradores terrestres y marinos, lo que pone de relieve su papel fundamental en el fomento de la eficiencia y el rendimiento de las turbinas. Este avance pone de relieve la capacidad de KEB para atender al creciente sector de la energía eólica, incluyendo soluciones eléctricas económicas fuera de la red. Al proporcionar componentes fiables para proyectos energéticos tanto a escala de servicios públicos como descentralizados, KEB consolida su presencia en el mercado y aprovecha el rápido crecimiento de la industria de las energías renovables.
- En febrero de 2021, Hydroxycut presentó CUT Energy, una bebida energética limpia formulada para consumidores habituales, entusiastas del fitness y personas que buscan soluciones para el control de peso. Este lanzamiento demuestra el enfoque de Hydroxycut en aprovechar el creciente mercado de bebidas saludables y funcionales. Al ofrecer una solución innovadora de energía limpia, la compañía expande su presencia de marca, atiende las preferencias cambiantes de los consumidores y consolida su posición en el competitivo segmento de las bebidas energéticas.
- En enero de 2021, KEBA anunció planes para ampliar sus instalaciones en Technologiering en los municipios para aumentar la capacidad de producción y la plantilla. Esta expansión pone de manifiesto el compromiso de KEBA de satisfacer la creciente demanda de tecnologías de automatización y control, garantizando al mismo tiempo la estabilidad operativa. Mediante la inversión en infraestructura y talento, la empresa refuerza su capacidad para atender los mercados industriales y de energías renovables, mejorando la competitividad y apoyando el crecimiento sostenible en un sector en rápida evolución.
- En marzo de 2020, ABB anunció medidas para mejorar la fiabilidad, la seguridad y la protección de la energía eólica marina, con el fin de garantizar una transmisión estable de energía a la red eléctrica nacional alemana. Mediante la implementación de un sistema integral que abarca infraestructura de TI, seguridad OT, monitorización del estado de toda la planta, SCADA y servicios de acceso remoto para DolWin5 (Epsilon), ABB refuerza la eficiencia y la estabilidad de la red de energía renovable alemana. Esta iniciativa subraya el compromiso de la compañía con el suministro de energía limpia y fiable, a la vez que apoya los objetivos de transición energética del país, consolidando aún más la posición de ABB en el mercado de soluciones de energía eólica.
SKU-
Obtenga acceso en línea al informe sobre la primera nube de inteligencia de mercado del mundo

- Panel de análisis de datos interactivo
- Panel de análisis de empresas para oportunidades con alto potencial de crecimiento
- Acceso de analista de investigación para personalización y consultas
- Análisis de la competencia con panel interactivo
- Últimas noticias, actualizaciones y análisis de tendencias
- Aproveche el poder del análisis de referencia para un seguimiento integral de la competencia
Metodología de investigación
La recopilación de datos y el análisis del año base se realizan utilizando módulos de recopilación de datos con muestras de gran tamaño. La etapa incluye la obtención de información de mercado o datos relacionados a través de varias fuentes y estrategias. Incluye el examen y la planificación de todos los datos adquiridos del pasado con antelación. Asimismo, abarca el examen de las inconsistencias de información observadas en diferentes fuentes de información. Los datos de mercado se analizan y estiman utilizando modelos estadísticos y coherentes de mercado. Además, el análisis de la participación de mercado y el análisis de tendencias clave son los principales factores de éxito en el informe de mercado. Para obtener más información, solicite una llamada de un analista o envíe su consulta.
La metodología de investigación clave utilizada por el equipo de investigación de DBMR es la triangulación de datos, que implica la extracción de datos, el análisis del impacto de las variables de datos en el mercado y la validación primaria (experto en la industria). Los modelos de datos incluyen cuadrícula de posicionamiento de proveedores, análisis de línea de tiempo de mercado, descripción general y guía del mercado, cuadrícula de posicionamiento de la empresa, análisis de patentes, análisis de precios, análisis de participación de mercado de la empresa, estándares de medición, análisis global versus regional y de participación de proveedores. Para obtener más información sobre la metodología de investigación, envíe una consulta para hablar con nuestros expertos de la industria.
Personalización disponible
Data Bridge Market Research es líder en investigación formativa avanzada. Nos enorgullecemos de brindar servicios a nuestros clientes existentes y nuevos con datos y análisis que coinciden y se adaptan a sus objetivos. El informe se puede personalizar para incluir análisis de tendencias de precios de marcas objetivo, comprensión del mercado de países adicionales (solicite la lista de países), datos de resultados de ensayos clínicos, revisión de literatura, análisis de mercado renovado y base de productos. El análisis de mercado de competidores objetivo se puede analizar desde análisis basados en tecnología hasta estrategias de cartera de mercado. Podemos agregar tantos competidores sobre los que necesite datos en el formato y estilo de datos que esté buscando. Nuestro equipo de analistas también puede proporcionarle datos en archivos de Excel sin procesar, tablas dinámicas (libro de datos) o puede ayudarlo a crear presentaciones a partir de los conjuntos de datos disponibles en el informe.

