Image

Mercado europeo de purificación de vectores virales: tendencias de la industria y pronóstico hasta 2028

Cuidado de la salud

Image

Mercado europeo de purificación de vectores virales: tendencias de la industria y pronóstico hasta 2028

  • Cuidado de la salud
  • Informe publicado
  • mayo 2021
  • Europa
  • 350 páginas
  • Número de mesas: 227
  • Número de figuras: 42

Mercado europeo de purificación de vectores virales, por producto y servicios (productos y servicios), tipo (vectores retrovirales, virus de vacuna, vectores adenovirales, vectores virales adenoasociados, lentivirus y otros), flujo de trabajo (procesamiento ascendente y descendente), técnica de purificación ( Ultracentrifugación en gradiente de densidad, ultrafiltración, precipitación, sistemas de extracción de dos fases y cromatografía), escala de operación (preclínica/clínica y comercial), método de administración (in vivo y ex vivo), indicación de enfermedad (cáncer, trastornos genéticos, enfermedades infecciosas, Enfermedades veterinarias y otras), Aplicación (Antisentido y ARNi, Terapia génica, Terapia celular y Vacunología), Usuario final (Empresas de biotecnología, Compañías farmacéuticas, Organizaciones de investigación por contrato, Organización de fabricación y desarrollo por contrato (CDMO) e Institutos académicos/de investigación), País (Reino Unido, Alemania, Francia, España, Italia, Países Bajos, Suiza, Rusia, Bélgica, Turquía, resto de Europa) Tendencias de la industria y pronóstico para 2028

Europe Viral Vector Purification Market Análisis e información del mercado: mercado europeo de purificación de vectores virales

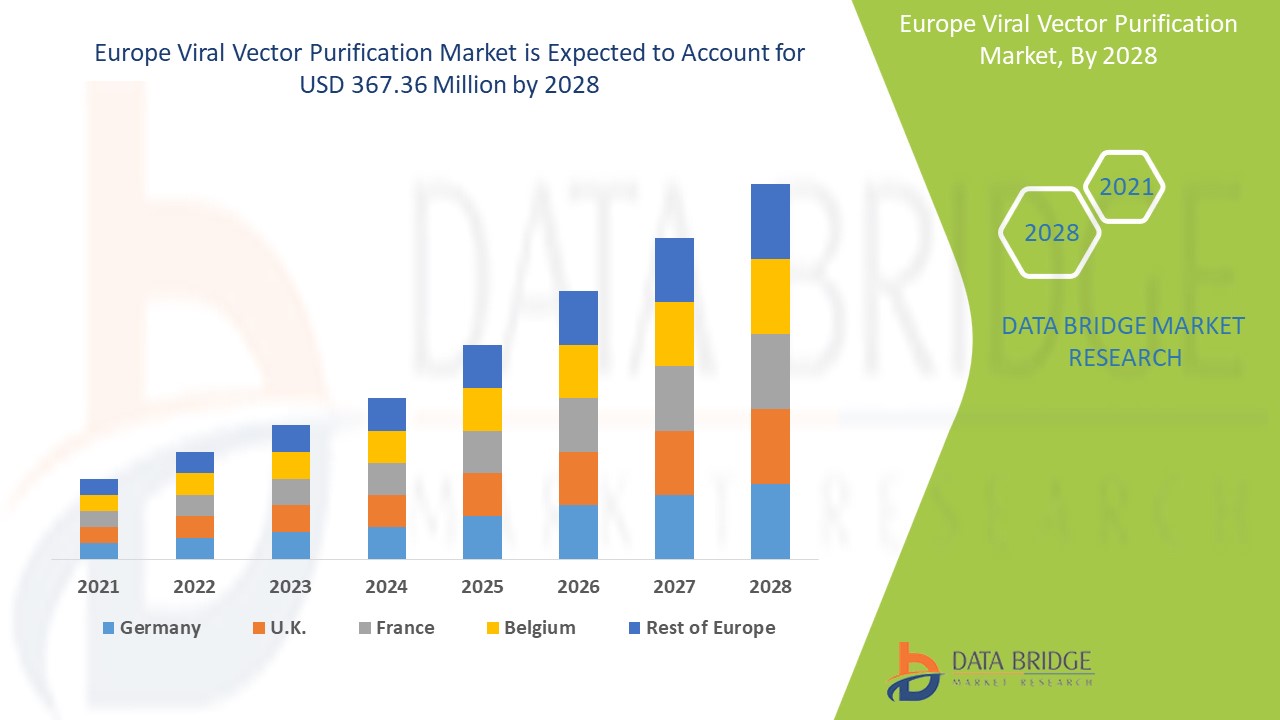
Se espera que el mercado de purificación de vectores virales gane crecimiento en el período de pronóstico de 2021 a 2028. Data Bridge Market Research analiza que el mercado está creciendo con una tasa compuesta anual del 14,5% en el período de pronóstico de 2021 a 2028 y se espera que alcance los USD. 367,36 millones para 2028. La creciente demanda de vectores virales está actuando como impulsor del mercado de purificación de vectores virales.

Los biólogos moleculares utilizan con frecuencia vectores virales para introducir material genético en las células. Este procedimiento se puede realizar in vivo (dentro de un organismo vivo) o en cultivo celular (in vitro). Los virus han desarrollado mecanismos moleculares especializados para transportar sus genomas de manera eficiente dentro de las células que infectan. La transducción es la entrega de genes u otro material genético mediante un vector y las células infectadas se denominan transducidas.

La aparición de COVID-19 y la demanda de vacunas virales están impulsando el mercado de purificación de vectores virales. La falta de escalabilidad es una limitación para el mercado de purificación de vectores virales. El creciente número de enfermedades infecciosas actúa como una oportunidad para el mercado de purificación de vectores virales. La escasez de personal capacitado es un desafío para el mercado de purificación de vectores virales.

El informe de mercado de Purificación de vectores virales proporciona detalles de la participación de mercado, los nuevos desarrollos y el análisis de la cartera de productos, el impacto de los actores del mercado nacional y localizado, analiza las oportunidades en términos de bolsillos de ingresos emergentes, cambios en las regulaciones del mercado, aprobaciones de productos, decisiones estratégicas, lanzamientos de productos. , expansiones geográficas e innovaciones tecnológicas en el mercado. Para comprender el análisis y el escenario del mercado de purificación de vectores virales, comuníquese con Data Bridge Market Research para obtener un resumen del analista; nuestro equipo lo ayudará a crear una solución de impacto en los ingresos para lograr el objetivo deseado.

Europe Viral Vector Purification Market Ámbito Purificación de vectores virales Mercado y el Tamaño de mercado

El mercado de purificación de vectores virales se clasifica en nueve segmentos notables que se basan en el producto y servicios, el tipo, el flujo de trabajo, la técnica de purificación, la escala de operación, el método de entrega, la indicación de enfermedad, la aplicación y el usuario final. El crecimiento entre segmentos le ayuda a analizar nichos de crecimiento y estrategias para acercarse al mercado y determinar sus áreas de aplicación principales y la diferencia en sus mercados objetivo.
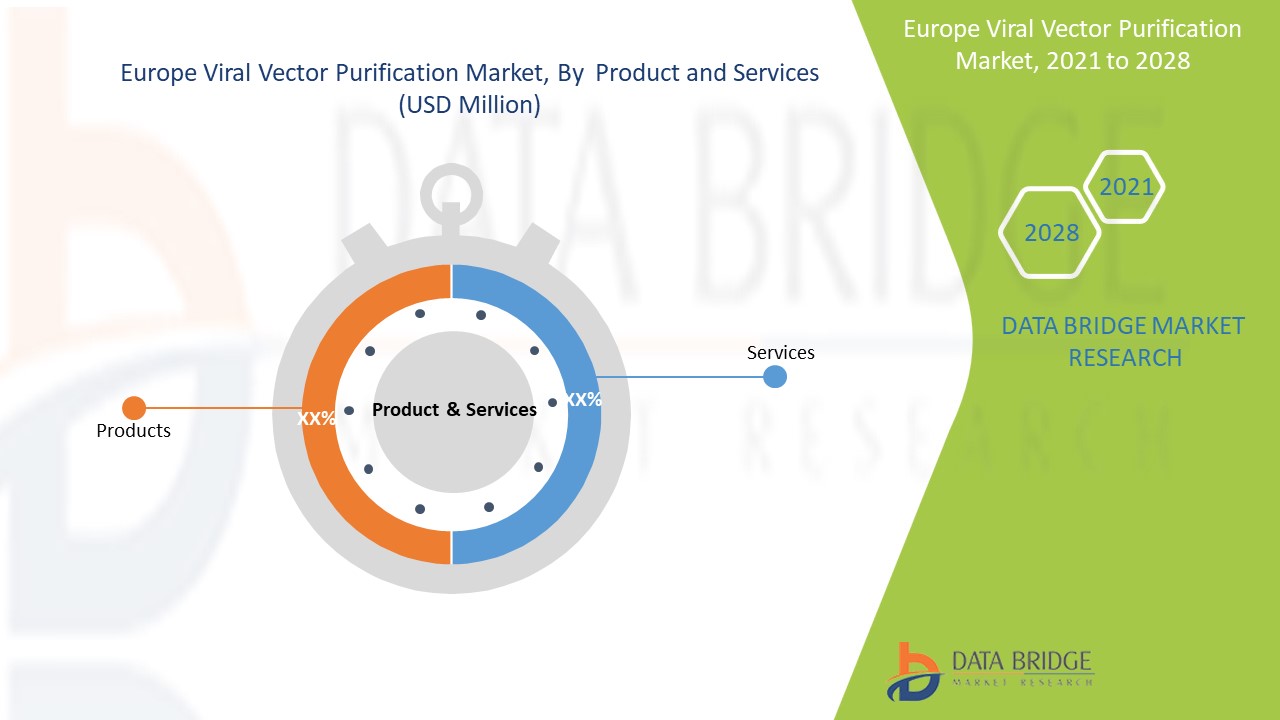
  • Sobre la base de productos y servicios, el mercado de purificación de vectores virales se segmenta en productos y servicios. En 2021, se espera que el segmento de productos domine el mercado de purificación de vectores virales debido a la disponibilidad de una amplia gama de soluciones innovadoras para la purificación de vectores.
  • Según el tipo, el mercado de purificación de vectores virales se segmenta en vectores retrovirales, virus vacunales, vectores adenovirales, vectores virales adenoasociados, lentivirus y otros. En 2021, se espera que el segmento de vectores virales adenoasociados domine el mercado de purificación de vectores virales debido al amplio rango de infectividad del AAV.
  • Sobre la base del flujo de trabajo, el mercado de purificación de vectores virales se segmenta en procesamiento ascendente y procesamiento descendente. En 2021, se espera que el segmento de procesamiento ascendente domine el mercado de purificación de vectores virales porque los vectores virales producidos mediante este proceso se pueden recolectar de las células en un corto período de tiempo después de la transfección.
  • Sobre la base de la técnica de purificación, el mercado de purificación de vectores virales se segmenta en ultracentrifugación en gradiente de densidad, ultrafiltración, precipitación, sistemas de extracción de dos fases y cromatografía. En 2021, se espera que el segmento de cromatografía domine el mercado de purificación de vectores virales porque se ha utilizado ampliamente para la purificación de vacunas y vectores de terapia génica.
  • Según la escala de operación, el mercado de purificación de vectores virales se segmenta en preclínico/clínico y comercial. En 2021, se espera que el segmento preclínico/clínico domine el mercado de purificación de vectores virales debido a la creciente inversión en actividades de investigación y desarrollo por parte de las principales organizaciones sanitarias.
  • Según el método de administración, el mercado de purificación de vectores virales se segmenta en in vivo y ex vivo. En 2021, se espera que el segmento in vivo domine el mercado de purificación de vectores virales debido a su alta disponibilidad y confiabilidad del proceso.
  • Según la indicación de la enfermedad, el mercado de purificación de vectores virales se segmenta en cáncer, trastornos genéticos, enfermedades infecciosas, enfermedades veterinarias y otras. En 2021, se espera que el segmento de trastornos genéticos domine el mercado de purificación de vectores virales debido a la creciente incidencia y prevalencia de trastornos genéticos.
  • Según la aplicación, el mercado de purificación de vectores virales se segmenta en antisentido y ARNi, terapia génica, terapia celular y vacunología. En 2021, se espera que el segmento de terapia génica domine el mercado de purificación de vectores virales debido a la amplia gama de aplicaciones en el sector médico.
  • Según el usuario final, el mercado de purificación de vectores virales se segmenta en empresas de biotecnología, empresas farmacéuticas, organizaciones de investigación por contrato, organizaciones de fabricación y desarrollo por contrato (CDMO) e institutos académicos/de investigación. En 2021, se espera que el segmento de institutos académicos/de investigación domine el mercado de purificación de vectores virales debido al aumento de las actividades de iniciativa de varias organizaciones sanitarias y organismos gubernamentales para fomentar los esfuerzos de investigación.

Análisis a nivel de país del mercado de purificación de vectores virales de Europa

Se analiza el mercado europeo de purificación de vectores virales y la información sobre el tamaño del mercado se proporciona por país, producto y servicios, tipo, flujo de trabajo, técnica de purificación, escala de operación, método de entrega, indicación de enfermedad, aplicación y usuario final como se menciona anteriormente.

Los países cubiertos en el informe del mercado europeo de purificación de vectores virales son el Reino Unido, Alemania, Francia, España, Italia, Países Bajos, Suiza, Rusia, Bélgica, Turquía y el resto de Europa.

Se espera que Europa crezca con una tasa de crecimiento significativa en el período previsto de 2021 a 2028 debido a la infraestructura sanitaria basada en alta tecnología y al aumento del gasto sanitario en la región. Alemania está dominando el mercado europeo con el creciente avance de la industria de purificación de vectores virales en la región.

La sección de países del informe también proporciona factores que impactan el mercado individual y cambios en la regulación en el mercado a nivel nacional que impactan las tendencias actuales y futuras del mercado. Datos como ventas nuevas, ventas de reemplazo, demografía de los países, leyes regulatorias y aranceles de importación y exportación son algunos de los principales indicadores utilizados para pronosticar el escenario del mercado para cada país. Además, se consideran la presencia y disponibilidad de las marcas europeas y los desafíos que enfrentan debido a la competencia grande o escasa de las marcas locales y nacionales, y el impacto de los canales de ventas al tiempo que se proporciona un análisis de pronóstico de los datos del país.

Las iniciativas estratégicas de los fabricantes están creando nuevas oportunidades para los actores del mercado de purificación de vectores virales

El mercado de purificación de vectores virales también le proporciona un análisis de mercado detallado para el crecimiento de cada país. Además, proporciona datos detallados sobre el crecimiento de las ventas, asociaciones, adquisiciones y acuerdos de distribución de purificación de vectores virales entre los actores del mercado de purificación de vectores virales de la región europea. Los datos están disponibles para el período histórico 2010 a 2019.

Panorama competitivo y cuota de mercado Análisis Purificación de vectores virales

El panorama competitivo del mercado de purificación de vectores virales proporciona detalles por competidor. Los detalles incluidos son descripción general de la empresa, finanzas de la empresa, ingresos generados, potencial de mercado, inversión en investigación y desarrollo, nuevas iniciativas de mercado, sitios e instalaciones de producción, fortalezas y debilidades de la empresa, lanzamiento de productos, proyectos de pruebas de productos, aprobaciones de productos, patentes, ancho del producto y amplitud, dominio de la aplicación, curva de línea de vida tecnológica. Los puntos de datos anteriores proporcionados solo están relacionados con el enfoque de la empresa en el mercado de purificación de vectores virales.

Los principales actores cubiertos en el informe del mercado europeo de purificación de vectores virales son Applied Biological Materials Inc., Creative Biolabs, Bio-Rad Laboratories, Inc., Sirion-Biotech GmbH, Merck KGaA, Batavia Biosciences BV, Agilent Technologies, Inc., Addgene, Takara Bio Inc., Thermo Fisher Scientific Inc., uniQure NV, BioVision Inc., Cytiva (una subsidiaria de Danaher), entre otros actores nacionales. Los analistas de DBMR comprenden las fortalezas competitivas y brindan análisis competitivos para cada competidor por separado.

Numerosos contratos y acuerdos también son iniciados por empresas de todo el mundo que también están acelerando el mercado de purificación de vectores virales.

Por ejemplo,

  • En enero de 2021, Thermo Fisher Scientific Inc. anunció que había completado la adquisición del negocio de fabricación de vectores virales de Novsep en Bélgica, lo que ayudará a la empresa a diversificar aún más su mercado.

La colaboración, las empresas conjuntas y otras estrategias de los actores del mercado están mejorando la impresión de la empresa en el mercado de purificación de vectores virales, lo que también brinda el beneficio a la organización de mejorar el crecimiento de sus ventas.


SKU-

LISTA DE TABLAS

TABLA 1 MERCADO EUROPEO DE PURIFICACIÓN DE VECTORES VIRALES, POR PRODUCTOS Y SERVICIOS, 2019-2028 (MILLONES DE USD)

TABLA 2 PRODUCTOS EUROPEOS EN EL MERCADO DE PURIFICACIÓN DE VECTORES VIRALES, POR REGIÓN, 2019-2028 (MILLONES DE USD)

TABLA 3 PRODUCTOS EUROPEOS EN EL MERCADO DE PURIFICACIÓN DE VECTORES VIRALES, POR PRODUCTOS Y SERVICIOS, 2019-2028 (MILLONES DE USD)

TABLA 4 SERVICIOS EUROPEOS EN EL MERCADO DE PURIFICACIÓN DE VECTORES VIRALES, POR REGIÓN, 2019-2028 (MILLONES DE USD)

TABLA 5 MERCADO EUROPEO DE PURIFICACIÓN DE VECTORES VIRALES, POR TÉCNICA DE PURIFICACIÓN, 2019-2028 (MILLONES DE USD)

TABLA 6 CROMATOGRAFÍA EUROPEA EN EL MERCADO DE PURIFICACIÓN DE VECTORES VIRALES, POR REGIÓN, 2019-2028 (MILLONES DE USD)

TABLA 7 CROMATOGRAFÍA EUROPEA EN EL MERCADO DE PURIFICACIÓN DE VECTORES VIRALES, POR TÉCNICA DE PURIFICACIÓN, 2019-2028 (MILLONES DE USD)

TABLA 8 ULTRACENTRIFUGACIÓN POR GRADIENTE DE DENSIDAD EN EL MERCADO DE PURIFICACIÓN DE VECTORES VIRALES DE EUROPA, POR REGIÓN, 2019-2028 (MILLONES DE USD)

TABLA 9 MERCADO EUROPEO DE ULTRAFILTRACIÓN EN PURIFICACIÓN DE VECTORES VIRALES, POR REGIÓN, 2019-2028 (MILLONES DE USD)

TABLA 10 PRECIPITACIÓN EN EUROPA EN EL MERCADO DE PURIFICACIÓN DE VECTORES VIRALES, POR REGIÓN, 2019-2028 (MILLONES DE USD)

TABLA 11 SISTEMAS DE EXTRACCIÓN BIFÁSICA DE EUROPA EN EL MERCADO DE PURIFICACIÓN DE VECTORES VIRALES, POR REGIÓN, 2019-2028 (MILLONES DE USD)

TABLA 12 MERCADO EUROPEO DE PURIFICACIÓN DE VECTORES VIRALES, POR TIPO, 2019-2028 (MILLONES DE USD)

TABLA 13 VECTORES VIRALES ADENOASOCIADOS EN EUROPA EN EL MERCADO DE PURIFICACIÓN DE VECTORES VIRALES, POR REGIÓN, 2019-2028 (MILLONES DE USD)

TABLA 14 VECTORES ADENOVIRALES DE EUROPA EN EL MERCADO DE PURIFICACIÓN DE VECTORES VIRALES, POR REGIÓN, 2019-2028 (MILLONES DE USD)

TABLA 15 VECTORES ADENOVIRALES DE EUROPA EN EL MERCADO DE PURIFICACIÓN DE VECTORES VIRALES, POR TIPO, 2019-2028 (MILLONES DE USD)

TABLA 16 MERCADO EUROPEO DE LENTIVIRUS EN LA PURIFICACIÓN DE VECTORES VIRALES, POR REGIÓN, 2019-2028 (MILLONES DE USD)

TABLA 17 VECTORES RETROVIRALES DE EUROPA EN EL MERCADO DE PURIFICACIÓN DE VECTORES VIRALES, POR REGIÓN, 2019-2028 (MILLONES DE USD)

TABLA 18 VECTORES RETROVIRALES DE EUROPA EN EL MERCADO DE PURIFICACIÓN DE VECTORES VIRALES, POR TIPO, 2019-2028 (MILLONES DE USD)

TABLA 19 VIRUS DE VACUNA EN EL MERCADO DE PURIFICACIÓN DE VECTORES VIRALES DE EUROPA, POR REGIÓN, 2019-2028 (MILLONES DE USD)

TABLA 20 EUROPA OTROS EN EL MERCADO DE PURIFICACIÓN DE VECTORES VIRALES, POR REGIÓN, 2019-2028 (MILLONES DE USD)

TABLA 21 MERCADO EUROPEO DE PURIFICACIÓN DE VECTORES VIRALES, POR FLUJO DE TRABAJO, 2019-2028 (MILLONES DE USD)

TABLA 22 PROCESAMIENTO UPSTREAMENTE EN EL MERCADO DE PURIFICACIÓN DE VECTORES VIRALES DE EUROPA, POR REGIÓN, 2019-2028 (MILLONES DE USD)

TABLA 23 PROCESAMIENTO FINAL EN EL MERCADO DE PURIFICACIÓN DE VECTORES VIRALES DE EUROPA, POR REGIÓN, 2019-2028 (MILLONES DE USD)

TABLA 24 MERCADO EUROPEO DE PURIFICACIÓN DE VECTORES VIRALES, POR ESCALA DE OPERACIÓN, 2019-2028 (MILLONES DE USD)

TABLA 25 MERCADO EUROPEO DE PURIFICACIÓN PRECLÍNICA/CLÍNICA DE VECTORES VIRALES, POR REGIÓN, 2019-2028 (MILLONES DE USD)

TABLA 26 COMERCIAL EUROPEO EN EL MERCADO DE PURIFICACIÓN DE VECTORES VIRALES, POR REGIÓN, 2019-2028 (MILLONES DE USD)

TABLA 27 MERCADO EUROPEO DE PURIFICACIÓN DE VECTORES VIRALES, POR MODO DE ENTREGA, 2019-2028 (MILLONES DE USD)

TABLA 28 EUROPA IN VIVO EN EL MERCADO DE PURIFICACIÓN DE VECTORES VIRALES, POR REGIÓN, 2019-2028 (MILLONES DE USD)

TABLA 29 EUROPA EX VIVO EN EL MERCADO DE PURIFICACIÓN DE VECTORES VIRALES, POR REGIÓN, 2019-2028 (MILLONES DE USD)

TABLA 30 MERCADO EUROPEO DE PURIFICACIÓN DE VECTORES VIRALES, POR INDICACIÓN DE ENFERMEDAD, 2019-2028 (MILLONES DE USD)

TABLA 31 TRASTORNOS GENÉTICOS EN EL MERCADO DE PURIFICACIÓN DE VECTORES VIRALES DE EUROPA, POR REGIÓN, 2019-2028 (MILLONES DE USD)

TABLA 32 TRASTORNOS GENÉTICOS EN EL MERCADO DE PURIFICACIÓN DE VECTORES VIRALES DE EUROPA, POR INDICACIÓN DE ENFERMEDAD, 2019-2028 (MILLONES DE USD)

TABLA 33 ENFERMEDADES INFECCIOSAS EN EL MERCADO DE PURIFICACIÓN DE VECTORES VIRALES DE EUROPA, POR REGIÓN, 2019-2028 (MILLONES DE USD)

TABLA 34 ENFERMEDADES INFECCIOSAS EN EL MERCADO DE PURIFICACIÓN DE VECTORES VIRALES EN EUROPA, POR INDICACIÓN DE ENFERMEDAD, 2019-2028 (MILLONES DE USD)

TABLA 35 ENFERMEDADES VETERINARIAS EN EL MERCADO DE PURIFICACIÓN DE VECTORES VIRALES DE EUROPA, POR REGIÓN, 2019-2028 (MILLONES DE USD)

TABLA 36 MERCADO EUROPEO DE CÁNCER EN PURIFICACIÓN DE VECTORES VIRALES, POR REGIÓN, 2019-2028 (MILLONES DE USD)

TABLA 37 EUROPA OTROS EN EL MERCADO DE PURIFICACIÓN DE VECTORES VIRALES, POR REGIÓN, 2019-2028 (MILLONES DE USD)

TABLA 38 MERCADO EUROPEO DE PURIFICACIÓN DE VECTORES VIRALES, POR APLICACIÓN, 2019-2028 (MILLONES DE USD)

TABLA 39 MERCADO EUROPEO DE TERAPIA GÉNICA EN LA PURIFICACIÓN DE VECTORES VIRALES, POR REGIÓN, 2019-2028 (MILLONES DE USD)

TABLA 40 MERCADO EUROPEO DE TERAPIA GÉNICA EN LA PURIFICACIÓN DE VECTORES VIRALES, POR APLICACIÓN, 2019-2028 (MILLONES DE USD)

TABLA 41 MERCADO EUROPEO DE TERAPIA CELULAR EN LA PURIFICACIÓN DE VECTORES VIRALES, POR REGIÓN, 2019-2028 (MILLONES DE USD)

CUADRO 42 VACUNOLOGÍA EN EL MERCADO DE PURIFICACIÓN DE VECTORES VIRALES DE EUROPA, POR REGIÓN, 2019-2028 (MILLONES DE USD)

TABLA 43 EUROPA ANTISENTIDO Y ARNI EN EL MERCADO DE PURIFICACIÓN DE VECTORES VIRALES, POR REGIÓN, 2019-2028 (MILLONES DE USD)

TABLA 44 MERCADO EUROPEO DE PURIFICACIÓN DE VECTORES VIRALES, POR USUARIO FINAL, 2019-2028 (MILLONES DE USD)

TABLA 45 INSTITUTOS ACADÉMICOS/ DE INVESTIGACIÓN DE EUROPA EN EL MERCADO DE PURIFICACIÓN DE VECTORES VIRALES, POR REGIÓN, 2019-2028 (MILLONES DE USD)

TABLA 46 EMPRESAS FARMACÉUTICAS DE EUROPA EN EL MERCADO DE PURIFICACIÓN DE VECTORES VIRALES, POR REGIÓN, 2019-2028 (MILLONES DE USD)

TABLA 47 ORGANIZACIÓN EUROPEA DE DESARROLLO Y FABRICACIÓN DE CONTRATOS (CDMO) EN EL MERCADO DE PURIFICACIÓN DE VECTORES VIRALES, POR REGIÓN, 2019-2028 (MILLONES DE USD)

TABLA 48 EMPRESAS EUROPEAS DE BIOTECNOLOGÍA EN EL MERCADO DE PURIFICACIÓN DE VECTORES VIRALES, POR REGIÓN, 2019-2028 (MILLONES DE USD)

TABLA 49 ORGANIZACIONES EUROPEAS DE INVESTIGACIÓN POR CONTRATO EN EL MERCADO DE PURIFICACIÓN DE VECTORES VIRALES, POR REGIÓN, 2019-2028 (MILLONES DE USD)

TABLA 50 MERCADO EUROPEO DE PURIFICACIÓN DE VECTORES VIRALES, POR PAÍS, 2021-2028 (MILLONES DE USD)

TABLA 51 MERCADO EUROPEO DE PURIFICACIÓN DE VECTORES VIRALES, POR PRODUCTOS Y SERVICIOS, 2019-2028 (MILLONES DE USD)

TABLA 52 PRODUCTOS EUROPEOS EN EL MERCADO DE PURIFICACIÓN DE VECTORES VIRALES, POR PRODUCTOS Y SERVICIOS, 2019-2028 (MILLONES DE USD)

TABLA 53 MERCADO EUROPEO DE PURIFICACIÓN DE VECTORES VIRALES, POR TÉCNICA DE PURIFICACIÓN, 2019-2028 (MILLONES DE USD)

TABLA 54 CROMATOGRAFÍA EUROPEA EN EL MERCADO DE PURIFICACIÓN DE VECTORES VIRALES, POR TÉCNICA DE PURIFICACIÓN, 2019-2028 (MILLONES DE USD)

TABLA 55 MERCADO EUROPEO DE PURIFICACIÓN DE VECTORES VIRALES, POR TIPO, 2019-2028 (MILLONES DE USD)

TABLA 56 VECTORES RETROVIRALES DE EUROPA EN EL MERCADO DE PURIFICACIÓN DE VECTORES VIRALES, POR TIPO, 2019-2028 (MILLONES DE USD)

TABLA 57 VECTORES ADENOVIRALES DE EUROPA EN EL MERCADO DE PURIFICACIÓN DE VECTORES VIRALES, POR TIPO, 2019-2028 (MILLONES DE USD)

TABLA 58 MERCADO EUROPEO DE PURIFICACIÓN DE VECTORES VIRALES, POR FLUJO DE TRABAJO, 2019-2028 (MILLONES DE USD)

TABLA 59 MERCADO EUROPEO DE PURIFICACIÓN DE VECTORES VIRALES, POR ESCALA DE OPERACIÓN, 2019-2028 (MILLONES DE USD)

TABLA 60 MERCADO EUROPEO DE PURIFICACIÓN DE VECTORES VIRALES, POR MÉTODO DE ENTREGA, 2019-2028 (MILLONES DE USD)

TABLA 61 MERCADO EUROPEO DE PURIFICACIÓN DE VECTORES VIRALES, POR INDICACIÓN DE ENFERMEDAD, 2019-2028 (MILLONES DE USD)

TABLA 62 TRASTORNOS GENÉTICOS EN EL MERCADO DE PURIFICACIÓN DE VECTORES VIRALES DE EUROPA, POR INDICACIÓN DE ENFERMEDAD, 2019-2028 (MILLONES DE USD)

TABLA 63 ENFERMEDADES INFECCIOSAS EN EL MERCADO DE PURIFICACIÓN DE VECTORES VIRALES EN EUROPA, POR INDICACIÓN DE ENFERMEDAD, 2019-2028 (MILLONES DE USD)

TABLA 64 MERCADO EUROPEO DE PURIFICACIÓN DE VECTORES VIRALES, POR APLICACIÓN, 2019-2028 (MILLONES DE USD)

TABLA 65 MERCADO EUROPEO DE TERAPIA GÉNICA EN LA PURIFICACIÓN DE VECTORES VIRALES, POR APLICACIÓN, 2019-2028 (MILLONES DE USD)

TABLA 66 MERCADO EUROPEO DE PURIFICACIÓN DE VECTORES VIRALES, POR USUARIO FINAL, 2019-2028 (MILLONES DE USD)

TABLA 67 MERCADO DE PURIFICACIÓN DE VECTORES VIRALES DE ALEMANIA, POR PRODUCTOS Y SERVICIOS, 2019-2028 (MILLONES DE USD)

TABLA 68 PRODUCTOS DE ALEMANIA EN EL MERCADO DE PURIFICACIÓN DE VECTORES VIRALES, POR PRODUCTOS Y SERVICIOS, 2019-2028 (MILLONES DE USD)

TABLA 69 MERCADO DE PURIFICACIÓN DE VECTORES VIRALES DE ALEMANIA, POR TÉCNICA DE PURIFICACIÓN, 2019-2028 (MILLONES DE USD)

TABLA 70 CROMATOGRAFÍA DE ALEMANIA EN EL MERCADO DE PURIFICACIÓN DE VECTORES VIRALES, POR TÉCNICA DE PURIFICACIÓN, 2019-2028 (MILLONES DE USD)

TABLA 71 MERCADO DE PURIFICACIÓN DE VECTORES VIRALES DE ALEMANIA, POR TIPO, 2019-2028 (MILLONES DE USD)

TABLA 72 VECTORES RETROVIRALES DE ALEMANIA EN EL MERCADO DE PURIFICACIÓN DE VECTORES VIRALES, POR TIPO, 2019-2028 (MILLONES DE USD)

TABLA 73 VECTORES ADENOVIRALES DE ALEMANIA EN EL MERCADO DE PURIFICACIÓN DE VECTORES VIRALES, POR TIPO, 2019-2028 (MILLONES DE USD)

TABLA 74 MERCADO DE PURIFICACIÓN DE VECTORES VIRALES DE ALEMANIA, POR FLUJO DE TRABAJO, 2019-2028 (MILLONES DE USD)

TABLA 75 MERCADO DE PURIFICACIÓN DE VECTORES VIRALES DE ALEMANIA, POR ESCALA DE OPERACIÓN, 2019-2028 (MILLONES DE USD)

TABLA 76 MERCADO DE PURIFICACIÓN DE VECTORES VIRALES DE ALEMANIA, POR MÉTODO DE ENTREGA, 2019-2028 (MILLONES DE USD)

TABLA 77 MERCADO DE PURIFICACIÓN DE VECTORES VIRALES DE ALEMANIA, POR INDICACIÓN DE ENFERMEDAD, 2019-2028 (MILLONES DE USD)

TABLA 78 TRASTORNOS GENÉTICOS EN ALEMANIA EN EL MERCADO DE PURIFICACIÓN DE VECTORES VIRALES, POR INDICACIÓN DE ENFERMEDAD, 2019-2028 (MILLONES DE USD)

TABLA 79 ENFERMEDADES INFECCIOSAS EN ALEMANIA EN EL MERCADO DE PURIFICACIÓN DE VECTORES VIRALES, POR INDICACIÓN DE ENFERMEDAD, 2019-2028 (MILLONES DE USD)

TABLA 80 MERCADO DE PURIFICACIÓN DE VECTORES VIRALES DE ALEMANIA, POR APLICACIÓN, 2019-2028 (MILLONES DE USD)

TABLA 81 MERCADO DE TERAPIA GÉNICA DE ALEMANIA EN LA PURIFICACIÓN DE VECTORES VIRALES, POR APLICACIÓN, 2019-2028 (MILLONES DE USD)

TABLA 82 MERCADO DE PURIFICACIÓN DE VECTORES VIRALES DE ALEMANIA, POR USUARIO FINAL, 2019-2028 (MILLONES DE USD)

TABLA 83 MERCADO DE PURIFICACIÓN DE VECTORES VIRALES DE FRANCIA, POR PRODUCTOS Y SERVICIOS, 2019-2028 (MILLONES DE USD)

TABLA 84 PRODUCTOS DE FRANCIA EN EL MERCADO DE PURIFICACIÓN DE VECTORES VIRALES, POR PRODUCTOS Y SERVICIOS, 2019-2028 (MILLONES DE USD)

TABLA 85 MERCADO DE PURIFICACIÓN DE VECTORES VIRALES DE FRANCIA, POR TÉCNICA DE PURIFICACIÓN, 2019-2028 (MILLONES DE USD)

TABLA 86 CROMATOGRAFÍA DE FRANCIA EN EL MERCADO DE PURIFICACIÓN DE VECTORES VIRALES, POR TÉCNICA DE PURIFICACIÓN, 2019-2028 (MILLONES DE USD)

TABLA 87 MERCADO DE PURIFICACIÓN DE VECTORES VIRALES DE FRANCIA, POR TIPO, 2019-2028 (MILLONES DE USD)

TABLA 88 VECTORES RETROVIRALES DE FRANCIA EN EL MERCADO DE PURIFICACIÓN DE VECTORES VIRALES, POR TIPO, 2019-2028 (MILLONES DE USD)

TABLA 89 VECTORES ADENOVIRALES EN FRANCIA EN EL MERCADO DE PURIFICACIÓN DE VECTORES VIRALES, POR TIPO, 2019-2028 (MILLONES DE USD)

TABLA 90 MERCADO DE PURIFICACIÓN DE VECTORES VIRALES DE FRANCIA, POR FLUJO DE TRABAJO, 2019-2028 (MILLONES DE USD)

TABLA 91 MERCADO DE PURIFICACIÓN DE VECTORES VIRALES DE FRANCIA, POR ESCALA DE OPERACIÓN, 2019-2028 (MILLONES DE USD)

TABLA 92 MERCADO DE PURIFICACIÓN DE VECTORES VIRALES DE FRANCIA, POR MÉTODO DE ENTREGA, 2019-2028 (MILLONES DE USD)

TABLA 93 MERCADO DE PURIFICACIÓN DE VECTORES VIRALES DE FRANCIA, POR INDICACIÓN DE ENFERMEDAD, 2019-2028 (MILLONES DE USD)

TABLA 94 TRASTORNOS GENÉTICOS EN FRANCIA EN EL MERCADO DE PURIFICACIÓN DE VECTORES VIRALES, POR INDICACIÓN DE ENFERMEDAD, 2019-2028 (MILLONES DE USD)

CUADRO 95 ENFERMEDADES INFECCIOSAS EN FRANCIA EN EL MERCADO DE PURIFICACIÓN DE VECTORES VIRALES, POR INDICACIÓN DE ENFERMEDAD, 2019-2028 (MILLONES DE USD)

TABLA 96 MERCADO DE PURIFICACIÓN DE VECTORES VIRALES DE FRANCIA, POR APLICACIÓN, 2019-2028 (MILLONES DE USD)

TABLA 97 MERCADO DE TERAPIA GÉNICA DE FRANCIA EN LA PURIFICACIÓN DE VECTORES VIRALES, POR APLICACIÓN, 2019-2028 (MILLONES DE USD)

TABLA 98 MERCADO DE PURIFICACIÓN DE VECTORES VIRALES DE FRANCIA, POR USUARIO FINAL, 2019-2028 (MILLONES DE USD)

TABLA 99 MERCADO DE PURIFICACIÓN DE VECTORES VIRALES DEL REINO UNIDO, POR PRODUCTOS Y SERVICIOS, 2019-2028 (MILLONES DE USD)

TABLA 100 PRODUCTOS DEL REINO UNIDO EN EL MERCADO DE PURIFICACIÓN DE VECTORES VIRALES, POR PRODUCTOS Y SERVICIOS, 2019-2028 (MILLONES DE USD)

TABLA 101 MERCADO DE PURIFICACIÓN DE VECTORES VIRALES DEL REINO UNIDO, POR TÉCNICA DE PURIFICACIÓN, 2019-2028 (MILLONES DE USD)

TABLA 102 CROMATOGRAFÍA DEL REINO UNIDO EN EL MERCADO DE PURIFICACIÓN DE VECTORES VIRALES, POR TÉCNICA DE PURIFICACIÓN, 2019-2028 (MILLONES DE USD)

TABLA 103 MERCADO DE PURIFICACIÓN DE VECTORES VIRALES DEL REINO UNIDO, POR TIPO, 2019-2028 (MILLONES DE USD)

TABLA 104 VECTORES RETROVIRALES DEL REINO UNIDO EN EL MERCADO DE PURIFICACIÓN DE VECTORES VIRALES, POR TIPO, 2019-2028 (MILLONES DE USD)

TABLA 105 VECTORES ADENOVIRALES DEL REINO UNIDO EN EL MERCADO DE PURIFICACIÓN DE VECTORES VIRALES, POR TIPO, 2019-2028 (MILLONES DE USD)

TABLA 106 MERCADO DE PURIFICACIÓN DE VECTORES VIRALES DEL REINO UNIDO, POR FLUJO DE TRABAJO, 2019-2028 (MILLONES DE USD)

TABLA 107 MERCADO DE PURIFICACIÓN DE VECTORES VIRALES DEL REINO UNIDO, POR ESCALA DE OPERACIÓN, 2019-2028 (MILLONES DE USD)

TABLA 108 MERCADO DE PURIFICACIÓN DE VECTORES VIRALES DEL REINO UNIDO, POR MÉTODO DE ENTREGA, 2019-2028 (MILLONES DE USD)

TABLA 109 MERCADO DE PURIFICACIÓN DE VECTORES VIRALES DEL REINO UNIDO, POR INDICACIÓN DE ENFERMEDAD, 2019-2028 (MILLONES DE USD)

TABLA 110 TRASTORNOS GENÉTICOS DEL REINO UNIDO EN EL MERCADO DE PURIFICACIÓN DE VECTORES VIRALES, POR INDICACIÓN DE ENFERMEDAD, 2019-2028 (MILLONES DE USD)

TABLA 111 ENFERMEDADES INFECCIOSAS DEL REINO UNIDO EN EL MERCADO DE PURIFICACIÓN DE VECTORES VIRALES, POR INDICACIÓN DE ENFERMEDAD, 2019-2028 (MILLONES DE USD)

TABLA 112 MERCADO DE PURIFICACIÓN DE VECTORES VIRALES DEL REINO UNIDO, POR APLICACIÓN, 2019-2028 (MILLONES DE USD)

TABLA 113 TERAPIA GÉNICA DEL REINO UNIDO EN EL MERCADO DE PURIFICACIÓN DE VECTORES VIRALES, POR APLICACIÓN, 2019-2028 (MILLONES DE USD)

TABLA 114 MERCADO DE PURIFICACIÓN DE VECTORES VIRALES DEL REINO UNIDO, POR USUARIO FINAL, 2019-2028 (MILLONES DE USD)

TABLA 115 MERCADO DE PURIFICACIÓN DE VECTORES VIRALES DE ITALIA, POR PRODUCTOS Y SERVICIOS, 2019-2028 (MILLONES DE USD)

TABLA 116 PRODUCTOS DE ITALIA EN EL MERCADO DE PURIFICACIÓN DE VECTORES VIRALES, POR PRODUCTOS Y SERVICIOS, 2019-2028 (MILLONES DE USD)

TABLA 117 MERCADO DE PURIFICACIÓN DE VECTORES VIRALES DE ITALIA, POR TÉCNICA DE PURIFICACIÓN, 2019-2028 (MILLONES DE USD)

TABLA 118 CROMATOGRAFÍA DE ITALIA EN EL MERCADO DE PURIFICACIÓN DE VECTORES VIRALES, POR TÉCNICA DE PURIFICACIÓN, 2019-2028 (MILLONES DE USD)

TABLA 119 MERCADO DE PURIFICACIÓN DE VECTORES VIRALES DE ITALIA, POR TIPO, 2019-2028 (MILLONES DE USD)

TABLA 120 VECTORES RETROVIRALES DE ITALIA EN EL MERCADO DE PURIFICACIÓN DE VECTORES VIRALES, POR TIPO, 2019-2028 (MILLONES DE USD)

TABLA 121 VECTORES ADENOVIRALES DE ITALIA EN EL MERCADO DE PURIFICACIÓN DE VECTORES VIRALES, POR TIPO, 2019-2028 (MILLONES DE USD)

TABLA 122 MERCADO DE PURIFICACIÓN DE VECTORES VIRALES DE ITALIA, POR FLUJO DE TRABAJO, 2019-2028 (MILLONES DE USD)

TABLA 123 MERCADO DE PURIFICACIÓN DE VECTORES VIRALES DE ITALIA, POR ESCALA DE OPERACIÓN, 2019-2028 (MILLONES DE USD)

TABLA 124 MERCADO DE PURIFICACIÓN DE VECTORES VIRALES DE ITALIA, POR MÉTODO DE ENTREGA, 2019-2028 (MILLONES DE USD)

CUADRO 125 MERCADO DE PURIFICACIÓN DE VECTORES VIRALES DE ITALIA, POR INDICACIÓN DE ENFERMEDAD, 2019-2028 (MILLONES DE USD)

TABLA 126 TRASTORNOS GENÉTICOS EN ITALIA EN EL MERCADO DE PURIFICACIÓN DE VECTORES VIRALES, POR INDICACIÓN DE ENFERMEDAD, 2019-2028 (MILLONES DE USD)

TABLA 127 ENFERMEDADES INFECCIOSAS EN ITALIA EN EL MERCADO DE PURIFICACIÓN DE VECTORES VIRALES, POR INDICACIÓN DE ENFERMEDAD, 2019-2028 (MILLONES DE USD)

TABLA 128 MERCADO DE PURIFICACIÓN DE VECTORES VIRALES DE ITALIA, POR APLICACIÓN, 2019-2028 (MILLONES DE USD)

TABLA 129 TERAPIA GÉNICA DE ITALIA EN EL MERCADO DE PURIFICACIÓN DE VECTORES VIRALES, POR APLICACIÓN, 2019-2028 (MILLONES DE USD)

TABLA 130 MERCADO DE PURIFICACIÓN DE VECTORES VIRALES DE ITALIA, POR USUARIO FINAL, 2019-2028 (MILLONES DE USD)

TABLA 131 MERCADO ESPAÑOL DE PURIFICACIÓN DE VECTORES VIRALES, POR PRODUCTOS Y SERVICIOS, 2019-2028 (MILLONES DE USD)

TABLA 132 PRODUCTOS DE ESPAÑA EN EL MERCADO DE PURIFICACIÓN DE VECTORES VIRALES, POR PRODUCTOS Y SERVICIOS, 2019-2028 (MILLONES DE USD)

TABLA 133 MERCADO DE PURIFICACIÓN DE VECTORES VIRALES EN ESPAÑA, POR TÉCNICA DE PURIFICACIÓN, 2019-2028 (MILLONES DE USD)

TABLA 134 CROMATOGRAFÍA DE ESPAÑA EN EL MERCADO DE PURIFICACIÓN DE VECTORES VIRALES, POR TÉCNICA DE PURIFICACIÓN, 2019-2028 (MILLONES DE USD)

TABLA 135 MERCADO DE PURIFICACIÓN DE VECTORES VIRALES DE ESPAÑA, POR TIPO, 2019-2028 (MILLONES DE USD)

TABLA 136 VECTORES RETROVIRALES DE ESPAÑA EN EL MERCADO DE PURIFICACIÓN DE VECTORES VIRALES, POR TIPO, 2019-2028 (MILLONES DE USD)

TABLA 137 VECTORES ADENOVIRALES DE ESPAÑA EN EL MERCADO DE PURIFICACIÓN DE VECTORES VIRALES, POR TIPO, 2019-2028 (MILLONES DE USD)

TABLA 138 MERCADO DE PURIFICACIÓN DE VECTORES VIRALES EN ESPAÑA, POR FLUJO DE TRABAJO, 2019-2028 (MILLONES DE USD)

TABLA 139 MERCADO DE PURIFICACIÓN DE VECTORES VIRALES EN ESPAÑA, POR ESCALA DE OPERACIÓN, 2019-2028 (MILLONES DE USD)

TABLA 140 MERCADO DE PURIFICACIÓN DE VECTORES VIRALES EN ESPAÑA, POR MÉTODO DE ENTREGA, 2019-2028 (MILLONES DE USD)

CUADRO 141 MERCADO DE PURIFICACIÓN DE VECTORES VIRALES EN ESPAÑA, POR INDICACIÓN DE ENFERMEDAD, 2019-2028 (MILLONES DE USD)

TABLA 142 TRASTORNOS GENÉTICOS EN EL MERCADO DE PURIFICACIÓN DE VECTORES VIRALES EN ESPAÑA, POR INDICACIÓN DE ENFERMEDAD, 2019-2028 (MILLONES DE USD)

TABLA 143 ENFERMEDADES INFECCIOSAS EN EL MERCADO DE PURIFICACIÓN DE VECTORES VIRALES EN ESPAÑA, POR INDICACIÓN DE ENFERMEDAD, 2019-2028 (MILLONES DE USD)

TABLA 144 MERCADO DE PURIFICACIÓN DE VECTORES VIRALES EN ESPAÑA, POR APLICACIÓN, 2019-2028 (MILLONES DE USD)

TABLA 145 MERCADO DE TERAPIA GÉNICA EN ESPAÑA EN LA PURIFICACIÓN DE VECTORES VIRALES, POR APLICACIÓN, 2019-2028 (MILLONES DE USD)

TABLA 146 MERCADO DE PURIFICACIÓN DE VECTORES VIRALES EN ESPAÑA, POR USUARIO FINAL, 2019-2028 (MILLONES DE USD)

TABLA 147 MERCADO DE PURIFICACIÓN DE VECTORES VIRALES DE LOS PAÍSES BAJOS, POR PRODUCTOS Y SERVICIOS, 2019-2028 (MILLONES DE USD)

TABLA 148 PRODUCTOS DE LOS PAÍSES BAJOS EN EL MERCADO DE PURIFICACIÓN DE VECTORES VIRALES, POR PRODUCTOS Y SERVICIOS, 2019-2028 (MILLONES DE USD)

TABLA 149 MERCADO DE PURIFICACIÓN DE VECTORES VIRALES DE LOS PAÍSES BAJOS, POR TÉCNICA DE PURIFICACIÓN, 2019-2028 (MILLONES DE USD)

TABLA 150 CROMATOGRAFÍA HOLANDA EN EL MERCADO DE PURIFICACIÓN DE VECTORES VIRALES, POR TÉCNICA DE PURIFICACIÓN, 2019-2028 (MILLONES DE USD)

TABLA 151 MERCADO DE PURIFICACIÓN DE VECTORES VIRALES DE LOS PAÍSES BAJOS, POR TIPO, 2019-2028 (MILLONES DE USD)

TABLA 152 VECTORES RETROVIRALES DE LOS PAÍSES BAJOS EN EL MERCADO DE PURIFICACIÓN DE VECTORES VIRALES, POR TIPO, 2019-2028 (MILLONES DE USD)

TABLA 153 VECTORES ADENOVIRALES DE LOS PAÍSES BAJOS EN EL MERCADO DE PURIFICACIÓN DE VECTORES VIRALES, POR TIPO, 2019-2028 (MILLONES DE USD)

CUADRO 154 MERCADO DE PURIFICACIÓN DE VECTORES VIRALES DE LOS PAÍSES BAJOS, POR FLUJO DE TRABAJO, 2019-2028 (MILLONES DE USD)

CUADRO 155 MERCADO DE PURIFICACIÓN DE VECTORES VIRALES DE LOS PAÍSES BAJOS, POR ESCALA DE OPERACIÓN, 2019-2028 (MILLONES DE USD)

CUADRO 156 MERCADO DE PURIFICACIÓN DE VECTORES VIRALES DE LOS PAÍSES BAJOS, POR MÉTODO DE ENTREGA, 2019-2028 (MILLONES DE USD)

CUADRO 157 MERCADO DE PURIFICACIÓN DE VECTORES VIRALES DE LOS PAÍSES BAJOS, POR INDICACIÓN DE ENFERMEDAD, 2019-2028 (MILLONES DE USD)

CUADRO 158 TRASTORNOS GENÉTICOS DE LOS PAÍSES BAJOS EN EL MERCADO DE PURIFICACIÓN DE VECTORES VIRALES, POR INDICACIÓN DE ENFERMEDAD, 2019-2028 (MILLONES DE USD)

CUADRO 159 ENFERMEDADES INFECCIOSAS DE LOS PAÍSES BAJOS EN EL MERCADO DE PURIFICACIÓN DE VECTORES VIRALES, POR INDICACIÓN DE ENFERMEDAD, 2019-2028 (MILLONES DE USD)

TABLA 160 MERCADO DE PURIFICACIÓN DE VECTORES VIRALES DE LOS PAÍSES BAJOS, POR APLICACIÓN, 2019-2028 (MILLONES DE USD)

TABLA 161 TERAPIA GÉNICA DE LOS PAÍSES BAJOS EN EL MERCADO DE PURIFICACIÓN DE VECTORES VIRALES, POR APLICACIÓN, 2019-2028 (MILLONES DE USD)

TABLA 162 MERCADO DE PURIFICACIÓN DE VECTORES VIRALES DE LOS PAÍSES BAJOS, POR USUARIO FINAL, 2019-2028 (MILLONES DE USD)

TABLA 163 MERCADO DE PURIFICACIÓN DE VECTORES VIRALES DE BÉLGICA, POR PRODUCTOS Y SERVICIOS, 2019-2028 (MILLONES DE USD)

TABLA 164 PRODUCTOS DE BÉLGICA EN EL MERCADO DE PURIFICACIÓN DE VECTORES VIRALES, POR PRODUCTOS Y SERVICIOS, 2019-2028 (MILLONES DE USD)

TABLA 165 MERCADO DE PURIFICACIÓN DE VECTORES VIRALES DE BÉLGICA, POR TÉCNICA DE PURIFICACIÓN, 2019-2028 (MILLONES DE USD)

TABLA 166 CROMATOGRAFÍA DE BÉLGICA EN EL MERCADO DE PURIFICACIÓN DE VECTORES VIRALES, POR TÉCNICA DE PURIFICACIÓN, 2019-2028 (MILLONES DE USD)

TABLA 167 MERCADO DE PURIFICACIÓN DE VECTORES VIRALES DE BÉLGICA, POR TIPO, 2019-2028 (MILLONES DE USD)

TABLA 168 VECTORES RETROVIRALES DE BÉLGICA EN EL MERCADO DE PURIFICACIÓN DE VECTORES VIRALES, POR TIPO, 2019-2028 (MILLONES DE USD)

TABLA 169 VECTORES ADENOVIRALES DE BÉLGICA EN EL MERCADO DE PURIFICACIÓN DE VECTORES VIRALES, POR TIPO, 2019-2028 (MILLONES DE USD)

CUADRO 170 MERCADO DE PURIFICACIÓN DE VECTORES VIRALES DE BÉLGICA, POR FLUJO DE TRABAJO, 2019-2028 (MILLONES DE USD)

CUADRO 171 MERCADO DE PURIFICACIÓN DE VECTORES VIRALES DE BÉLGICA, POR ESCALA DE OPERACIÓN, 2019-2028 (MILLONES DE USD)

CUADRO 172 MERCADO DE PURIFICACIÓN DE VECTORES VIRALES DE BÉLGICA, POR MÉTODO DE ENTREGA, 2019-2028 (MILLONES DE USD)

CUADRO 173 MERCADO DE PURIFICACIÓN DE VECTORES VIRALES DE BÉLGICA, POR INDICACIÓN DE ENFERMEDAD, 2019-2028 (MILLONES DE USD)

CUADRO 174 TRASTORNOS GENÉTICOS EN BÉLGICA EN EL MERCADO DE PURIFICACIÓN DE VECTORES VIRALES, POR INDICACIÓN DE ENFERMEDAD, 2019-2028 (MILLONES DE USD)

CUADRO 175 ENFERMEDADES INFECCIOSAS EN BÉLGICA EN EL MERCADO DE PURIFICACIÓN DE VECTORES VIRALES, POR INDICACIÓN DE ENFERMEDAD, 2019-2028 (MILLONES DE USD)

TABLA 176 MERCADO DE PURIFICACIÓN DE VECTORES VIRALES DE BÉLGICA, POR APLICACIÓN, 2019-2028 (MILLONES DE USD)

TABLA 177 TERAPIA GÉNICA DE BÉLGICA EN EL MERCADO DE PURIFICACIÓN DE VECTORES VIRALES, POR APLICACIÓN, 2019-2028 (MILLONES DE USD)

TABLA 178 MERCADO DE PURIFICACIÓN DE VECTORES VIRALES DE BÉLGICA, POR USUARIO FINAL, 2019-2028 (MILLONES DE USD)

TABLA 179 MERCADO DE PURIFICACIÓN DE VECTORES VIRALES DE SUIZA, POR PRODUCTOS Y SERVICIOS, 2019-2028 (MILLONES DE USD)

TABLA 180 PRODUCTOS DE SUIZA EN EL MERCADO DE PURIFICACIÓN DE VECTORES VIRALES, POR PRODUCTOS Y SERVICIOS, 2019-2028 (MILLONES DE USD)

TABLA 181 MERCADO DE PURIFICACIÓN DE VECTORES VIRALES DE SUIZA, POR TÉCNICA DE PURIFICACIÓN, 2019-2028 (MILLONES DE USD)

TABLA 182 CROMATOGRAFÍA DE SUIZA EN EL MERCADO DE PURIFICACIÓN DE VECTORES VIRALES, POR TÉCNICA DE PURIFICACIÓN, 2019-2028 (MILLONES DE USD)

TABLA 183 MERCADO DE PURIFICACIÓN DE VECTORES VIRALES DE SUIZA, POR TIPO, 2019-2028 (MILLONES DE USD)

TABLA 184 VECTORES RETROVIRALES DE SUIZA EN EL MERCADO DE PURIFICACIÓN DE VECTORES VIRALES, POR TIPO, 2019-2028 (MILLONES DE USD)

TABLA 185 VECTORES ADENOVIRALES DE SUIZA EN EL MERCADO DE PURIFICACIÓN DE VECTORES VIRALES, POR TIPO, 2019-2028 (MILLONES DE USD)

CUADRO 186 MERCADO DE PURIFICACIÓN DE VECTORES VIRALES DE SUIZA, POR FLUJO DE TRABAJO, 2019-2028 (MILLONES DE USD)

CUADRO 187 MERCADO DE PURIFICACIÓN DE VECTORES VIRALES DE SUIZA, POR ESCALA DE OPERACIÓN, 2019-2028 (MILLONES DE USD)

CUADRO 188 MERCADO DE PURIFICACIÓN DE VECTORES VIRALES DE SUIZA, POR MÉTODO DE ENTREGA, 2019-2028 (MILLONES DE USD)

CUADRO 189 MERCADO DE PURIFICACIÓN DE VECTORES VIRALES DE SUIZA, POR INDICACIÓN DE ENFERMEDAD, 2019-2028 (MILLONES DE USD)

CUADRO 190 TRASTORNOS GENÉTICOS EN EL MERCADO DE PURIFICACIÓN DE VECTORES VIRALES DE SUIZA, POR INDICACIÓN DE ENFERMEDAD, 2019-2028 (MILLONES DE USD)

CUADRO 191 ENFERMEDADES INFECCIOSAS EN EL MERCADO DE PURIFICACIÓN DE VECTORES VIRALES DE SUIZA, POR INDICACIÓN DE ENFERMEDAD, 2019-2028 (MILLONES DE USD)

TABLA 192 MERCADO DE PURIFICACIÓN DE VECTORES VIRALES DE SUIZA, POR APLICACIÓN, 2019-2028 (MILLONES DE USD)

TABLA 193 MERCADO DE TERAPIA GÉNICA EN SUIZA DE PURIFICACIÓN DE VECTORES VIRALES, POR APLICACIÓN, 2019-2028 (MILLONES DE USD)

TABLA 194 MERCADO DE PURIFICACIÓN DE VECTORES VIRALES DE SUIZA, POR USUARIO FINAL, 2019-2028 (MILLONES DE USD)

TABLA 195 MERCADO DE PURIFICACIÓN DE VECTORES VIRALES DE RUSIA, POR PRODUCTOS Y SERVICIOS, 2019-2028 (MILLONES DE USD)

TABLA 196 PRODUCTOS DE RUSIA EN EL MERCADO DE PURIFICACIÓN DE VECTORES VIRALES, POR PRODUCTOS Y SERVICIOS, 2019-2028 (MILLONES DE USD)

TABLA 197 MERCADO DE PURIFICACIÓN DE VECTORES VIRALES DE RUSIA, POR TÉCNICA DE PURIFICACIÓN, 2019-2028 (MILLONES DE USD)

TABLA 198 CROMATOGRAFÍA DE RUSIA EN EL MERCADO DE PURIFICACIÓN DE VECTORES VIRALES, POR TÉCNICA DE PURIFICACIÓN, 2019-2028 (MILLONES DE USD)

TABLA 199 MERCADO DE PURIFICACIÓN DE VECTORES VIRALES DE RUSIA, POR TIPO, 2019-2028 (MILLONES DE USD)

TABLA 200 VECTORES RETROVIRALES DE RUSIA EN EL MERCADO DE PURIFICACIÓN DE VECTORES VIRALES, POR TIPO, 2019-2028 (MILLONES DE USD)

TABLA 201 VECTORES ADENOVIRALES DE RUSIA EN EL MERCADO DE PURIFICACIÓN DE VECTORES VIRALES, POR TIPO, 2019-2028 (MILLONES DE USD)

TABLA 202 MERCADO DE PURIFICACIÓN DE VECTORES VIRALES DE RUSIA, POR FLUJO DE TRABAJO, 2019-2028 (MILLONES DE USD)

TABLA 203 MERCADO DE PURIFICACIÓN DE VECTORES VIRALES DE RUSIA, POR ESCALA DE OPERACIÓN, 2019-2028 (MILLONES DE USD)

TABLA 204 MERCADO DE PURIFICACIÓN DE VECTORES VIRALES DE RUSIA, POR MÉTODO DE ENTREGA, 2019-2028 (MILLONES DE USD)

TABLA 205 MERCADO DE PURIFICACIÓN DE VECTORES VIRALES DE RUSIA, POR INDICACIÓN DE ENFERMEDAD, 2019-2028 (MILLONES DE USD)

TABLA 206 TRASTORNOS GENÉTICOS EN RUSIA EN EL MERCADO DE PURIFICACIÓN DE VECTORES VIRALES, POR INDICACIÓN DE ENFERMEDAD, 2019-2028 (MILLONES DE USD)

TABLA 207 ENFERMEDADES INFECCIOSAS EN RUSIA EN EL MERCADO DE PURIFICACIÓN DE VECTORES VIRALES, POR INDICACIÓN DE ENFERMEDAD, 2019-2028 (MILLONES DE USD)

TABLA 208 MERCADO DE PURIFICACIÓN DE VECTORES VIRALES DE RUSIA, POR APLICACIÓN, 2019-2028 (MILLONES DE USD)

TABLA 209 TERAPIA GÉNICA DE RUSIA EN EL MERCADO DE PURIFICACIÓN DE VECTORES VIRALES, POR APLICACIÓN, 2019-2028 (MILLONES DE USD)

TABLA 210 MERCADO DE PURIFICACIÓN DE VECTORES VIRALES DE RUSIA, POR USUARIO FINAL, 2019-2028 (MILLONES DE USD)

TABLA 211 MERCADO DE PURIFICACIÓN DE VECTORES VIRALES DE TURQUÍA, POR PRODUCTOS Y SERVICIOS, 2019-2028 (MILLONES DE USD)

TABLA 212 PRODUCTOS DE TURQUÍA EN EL MERCADO DE PURIFICACIÓN DE VECTORES VIRALES, POR PRODUCTOS Y SERVICIOS, 2019-2028 (MILLONES DE USD)

TABLA 213 MERCADO DE PURIFICACIÓN DE VECTORES VIRALES DE TURQUÍA, POR TÉCNICA DE PURIFICACIÓN, 2019-2028 (MILLONES DE USD)

TABLA 214 CROMATOGRAFÍA DE TURQUÍA EN EL MERCADO DE PURIFICACIÓN DE VECTORES VIRALES, POR TÉCNICA DE PURIFICACIÓN, 2019-2028 (MILLONES DE USD)

TABLA 215 MERCADO DE PURIFICACIÓN DE VECTORES VIRALES DE TURQUÍA, POR TIPO, 2019-2028 (MILLONES DE USD)

TABLA 216 VECTORES RETROVIRALES DE TURQUÍA EN EL MERCADO DE PURIFICACIÓN DE VECTORES VIRALES, POR TIPO, 2019-2028 (MILLONES DE USD)

TABLA 217 VECTORES ADENOVIRALES DE TURQUÍA EN EL MERCADO DE PURIFICACIÓN DE VECTORES VIRALES, POR TIPO, 2019-2028 (MILLONES DE USD)

TABLA 218 MERCADO DE PURIFICACIÓN DE VECTORES VIRALES DE TURQUÍA, POR FLUJO DE TRABAJO, 2019-2028 (MILLONES DE USD)

TABLA 219 MERCADO DE PURIFICACIÓN DE VECTORES VIRALES DE TURQUÍA, POR ESCALA DE OPERACIÓN, 2019-2028 (MILLONES DE USD)

TABLA 220 MERCADO DE PURIFICACIÓN DE VECTORES VIRALES DE TURQUÍA, POR MÉTODO DE ENTREGA, 2019-2028 (MILLONES DE USD)

CUADRO 221 MERCADO DE PURIFICACIÓN DE VECTORES VIRALES DE TURQUÍA, POR INDICACIÓN DE ENFERMEDAD, 2019-2028 (MILLONES DE USD)

TABLA 222 TRASTORNOS GENÉTICOS DE TURQUÍA EN EL MERCADO DE PURIFICACIÓN DE VECTORES VIRALES, POR INDICACIÓN DE ENFERMEDAD, 2019-2028 (MILLONES DE USD)

CUADRO 223 ENFERMEDADES INFECCIOSAS DE TURQUÍA EN EL MERCADO DE PURIFICACIÓN DE VECTORES VIRALES, POR INDICACIÓN DE ENFERMEDAD, 2019-2028 (MILLONES DE USD)

TABLA 224 MERCADO DE PURIFICACIÓN DE VECTORES VIRALES DE TURQUÍA, POR APLICACIÓN, 2019-2028 (MILLONES DE USD)

TABLA 225 TERAPIA GÉNICA DE TURQUÍA EN EL MERCADO DE PURIFICACIÓN DE VECTORES VIRALES, POR APLICACIÓN, 2019-2028 (MILLONES DE USD)

TABLA 226 MERCADO DE PURIFICACIÓN DE VECTORES VIRALES DE TURQUÍA, POR USUARIO FINAL, 2019-2028 (MILLONES DE USD)

TABLA 227 MERCADO DE PURIFICACIÓN DE VECTORES VIRALES DEL RESTO DE EUROPA, POR PRODUCTOS Y SERVICIOS, 2019-2028 (MILLONES DE USD)


Por favor complete el siguiente formulario para Infografías

Al hacer clic en el botón "Enviar", usted acepta la investigación de mercado de Data Bridge. política de privacidad y Términos y condiciones

Metodología de investigación:

La recopilación de datos y el análisis del año base se realizan mediante módulos de recopilación de datos con muestras de gran tamaño. La etapa incluye la obtención de información de mercado o datos relacionados a través de diversas fuentes y estrategias. Incluye examinar y planificar de antemano todos los datos adquiridos del pasado. Asimismo, abarca el examen de las inconsistencias de la información observadas en diferentes fuentes de información. Los datos de mercado se analizan y estiman utilizando modelos estadísticos y coherentes de mercado. Además, el análisis de la cuota de mercado y el análisis de tendencias clave son los principales factores de éxito en el informe de mercado. Para saber más, solicite una llamada de analista o envíe su consulta.

La metodología de investigación clave utilizada por el equipo de investigación de DBMR es la triangulación de datos, que implica extracción de datos, análisis del impacto de las variables de datos en el mercado y validación primaria (experto de la industria). Los modelos de datos incluyen cuadrícula de posicionamiento de proveedores, análisis de la línea de tiempo del mercado, descripción general y guía del mercado, cuadrícula de posicionamiento de la empresa, análisis de patentes, análisis de precios, análisis de participación de mercado de la empresa, estándares de medición, análisis global versus regional y de participación de proveedores. Para saber más sobre la metodología de investigación, envíe una consulta para hablar con nuestros expertos de la industria.

Por favor complete el siguiente formulario para Metodología de Investigación

Al hacer clic en el botón "Enviar", usted acepta la investigación de mercado de Data Bridge. política de privacidad y Términos y condiciones

Personalización disponible:

Data Bridge Market Research es líder en investigación formativa avanzada. Estamos orgullosos de brindar servicios a nuestros clientes nuevos y existentes con datos y análisis que coinciden y se adaptan a sus objetivos. El informe se puede personalizar para incluir análisis de tendencias de precios de marcas objetivo que comprendan el mercado de países adicionales (solicite la lista de países), datos de resultados de ensayos clínicos, revisión de literatura, mercado renovado y análisis de la base de productos. El análisis de mercado de los competidores objetivo se puede analizar desde análisis basados ​​en tecnología hasta estrategias de cartera de mercado. Podemos agregar tantos competidores sobre los que necesite datos en el formato y estilo de datos que esté buscando. Nuestro equipo de analistas también puede proporcionarle datos en tablas dinámicas de archivos de Excel sin procesar (libro de datos) o puede ayudarlo a crear presentaciones a partir de los conjuntos de datos disponibles en el informe.

Complete el siguiente formulario para personalizar disponible

Al hacer clic en el botón "Enviar", usted acepta la investigación de mercado de Data Bridge. política de privacidad y Términos y condiciones

HAGA PREGUNTAS FRECUENTES

Se proyecta que el mercado europeo de purificación de vectores virales crecerá a una tasa compuesta anual del 14,5% durante el período previsto para 2028.
Se espera que el valor de mercado futuro del mercado europeo de purificación de vectores virales alcance los 367,36 millones de dólares en 2028.
Los principales actores en el mercado europeo de purificación de vectores virales son Applied Biological Materials Inc., Creative Biolabs, Bio-Rad Laboratories, Inc., Merck KGaA, Agilent Technologies, Inc., Thermo Fisher Scientific Inc., uniQure NV, etc.
Los países cubiertos en el mercado europeo de purificación de vectores virales son el Reino Unido, Alemania, Francia, España, Italia, Países Bajos, Suiza, Rusia, Bélgica, Turquía y el resto de Europa.
Sobre la base de la aplicación, el mercado europeo de purificación de vectores virales se segmenta en antisentido y ARNi, terapia génica, terapia celular y vacunología.
Informe de muestra gratuito

ELEGIR TIPO DE LICENCIA

  • 4200.00
  • 3500.00
  • 2000.00
  • 5500.00
  • 7500.00

Por qué elegirnos

Cobertura de la industria

DBMR trabaja en todo el mundo en múltiples industrias, lo que nos brinda conocimiento en todos los sectores verticales y brinda a nuestros clientes información no solo de su industria sino también de cómo otras industrias afectarán su ecosistema.

Cobertura Regional

La cobertura de Data Bridge no se limita a las economías desarrolladas o emergentes. Trabajamos en todo el mundo cubriendo la mayor variedad de países donde ninguna otra firma de investigación de mercado o consultoría de negocios ha realizado investigaciones; creando oportunidades de crecimiento para nuestros clientes en áreas aún desconocidas.

Cobertura Tecnológica

En el mundo actual, la tecnología impulsa el sentimiento del mercado, por lo que nuestra visión es brindar a nuestros clientes información no solo sobre las tecnologías desarrolladas, sino también sobre los cambios tecnológicos futuros e disruptivos a lo largo del ciclo de vida del producto, brindándoles oportunidades imprevistas en el mercado que crearán disrupciones en su industria. . Esto lleva a la innovación y a que nuestros clientes salgan ganadores.

Soluciones orientadas a objetivos

El objetivo de DBMR es ayudar a nuestros clientes a alcanzar sus objetivos a través de nuestras soluciones; por lo tanto, creamos de manera formativa las soluciones más adecuadas para las necesidades de nuestros clientes, ahorrándoles tiempo y esfuerzos para impulsar sus grandes estrategias.

Soporte de analista incomparable

Nuestros analistas se enorgullecen del éxito de nuestros clientes. A diferencia de otros, creemos en trabajar junto a nuestros clientes para lograr sus objetivos con soporte de analistas las 24 horas para determinar las necesidades correctas e inspirar la innovación a través del servicio.

Banner

testimonios de clientes