

Europe Vanilla Beans And Extracts Market
Tamaño del mercado en miles de millones de dólares
Tasa de crecimiento anual compuesta (CAGR) :
% 
 USD
270.03 Million
USD
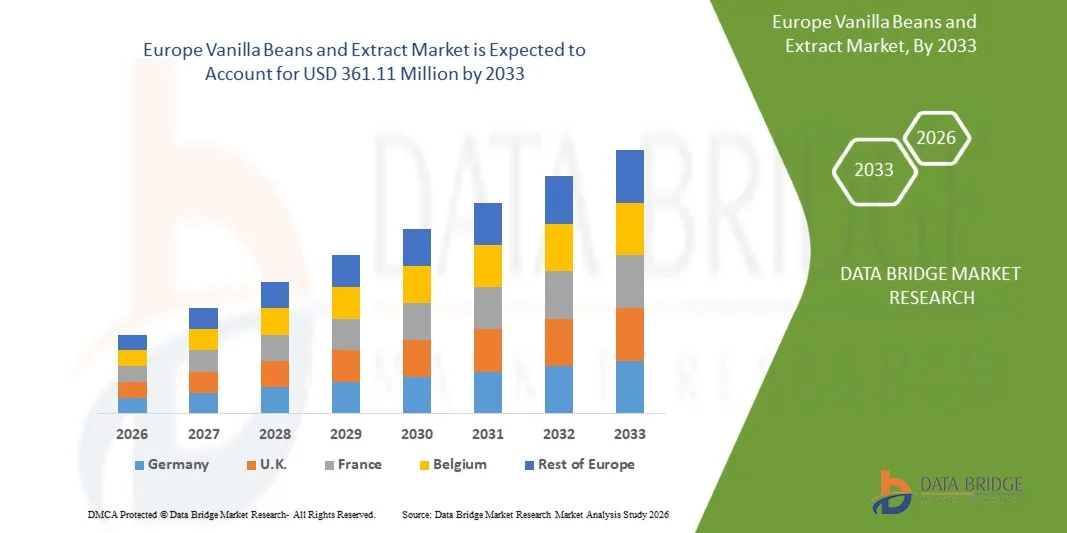
361.11 Million
2025
2033
USD
270.03 Million
USD
361.11 Million
2025
2033
| 2026 –2033 | |
| USD 270.03 Million | |
| USD 361.11 Million | |
| % | |
|
Segmentación del mercado europeo de vainilla en grano y extracto, por tipo de producto (Madagascar, México, India, Indonesia, Tahití, Tonga, Papúa, Uganda y otros), grados (Grado A, Grado B y otros), origen (natural y sintético), presentación (líquido, polvo y pasta), usuario final (alimentos, bebidas, productos de cuidado personal, industria farmacéutica, cocina casera y otros), canal de distribución (B2B y B2C) - Tendencias de la industria y pronóstico hasta 2033
Tamaño del mercado europeo de vainas y extracto de vainilla
- El tamaño del mercado europeo de vainilla y extracto se valoró en USD 270,03 millones en 2025 y se espera que alcance los USD 361,11 millones para 2033 , con una CAGR del 3,70 % durante el período de pronóstico.
- El crecimiento del mercado está impulsado en gran medida por la creciente demanda de sabores naturales en alimentos y bebidas, la creciente preferencia de los consumidores por productos de etiqueta limpia y de origen vegetal, y la creciente popularidad de los postres y artículos de confitería premium.
- La expansión en las industrias de panadería, lácteos y bebidas, junto con el creciente uso en cosméticos y productos de cuidado personal, está impulsando aún más la adopción en el mercado.
Análisis del mercado europeo de vainilla en grano y extracto
- La creciente conciencia de los consumidores respecto de los sabores naturales y auténticos está impulsando la demanda de vainas y extractos de vainilla de alta calidad en diversas industrias de uso final.
- La creciente adopción de vainilla en bebidas saborizadas, chocolates, helados y productos horneados está impulsando el crecimiento del mercado, respaldado por la expansión de los canales de distribución minorista y en línea.
- Alemania dominó el mercado de vainas y extracto de vainilla con la mayor participación en los ingresos en 2025, impulsada por la fuerte demanda de los sectores premium de panadería, confitería y bebidas. El consumidor valora la vainilla de alta calidad por sus aplicaciones de sabor auténtico y su posicionamiento de producto de etiqueta limpia.
- Se espera que el Reino Unido experimente la mayor tasa de crecimiento anual compuesta (TCAC) en el mercado europeo de vainilla en grano y extracto debido a la creciente demanda de ingredientes naturales y orgánicos, la creciente popularidad de los productos alimenticios artesanales y premium, y la creciente preferencia de los consumidores por sabores de etiqueta limpia y de origen sostenible. La creciente tendencia de repostería casera, la innovación en bebidas y postres, y la sólida penetración en el comercio minorista también contribuyen a un crecimiento acelerado del mercado.
- El segmento de Madagascar obtuvo la mayor participación en los ingresos del mercado en 2025, gracias a su perfil de sabor superior, calidad consistente y amplia preferencia entre los fabricantes de alimentos y bebidas premium. La vainilla de Madagascar se utiliza ampliamente en panadería, repostería y productos lácteos, lo que la convierte en una opción preferida para aplicaciones de sabor auténtico.
Alcance del informe y segmentación del mercado europeo de vainilla en grano y extracto
|
Atributos |
Información clave sobre el mercado de las vainas y el extracto de vainilla en Europa |
|
Segmentos cubiertos |
|
|
Países cubiertos |
Europa
|
|
Actores clave del mercado |
|
|
Oportunidades de mercado |
|
|
Conjuntos de información de datos de valor añadido |
Además de los conocimientos sobre escenarios de mercado como valor de mercado, tasa de crecimiento, segmentación, cobertura geográfica y actores principales, los informes de mercado seleccionados por Data Bridge Market Research también incluyen análisis de expertos en profundidad, análisis de precios, análisis de participación de marca, encuesta de consumidores, análisis demográfico, análisis de la cadena de suministro, análisis de la cadena de valor, descripción general de materias primas/consumibles, criterios de selección de proveedores, análisis PESTLE, análisis de Porter y marco regulatorio. |
Tendencias del mercado europeo de vainilla en grano y extracto
Creciente demanda de sabores naturales y de etiqueta limpia
La creciente preferencia de los consumidores por sabores naturales y mínimamente procesados está transformando significativamente el mercado de las vainas y extractos de vainilla. Los consumidores prefieren cada vez más ingredientes auténticos, no sintéticos y de origen vegetal. Los extractos de vainilla están ganando terreno gracias a su capacidad para realzar el sabor y el aroma sin aditivos artificiales, lo que anima a los fabricantes a innovar con nuevas formulaciones que satisfagan las cambiantes expectativas de sabor en aplicaciones de alimentos, bebidas y confitería.
La creciente conciencia sobre la salud, el bienestar y el consumo sostenible ha acelerado la demanda de vainilla en vainas y extractos para productos de panadería, lácteos, bebidas y confitería. Los consumidores preocupados por su salud buscan activamente productos formulados con ingredientes de origen natural, lo que impulsa a las marcas a priorizar la trazabilidad, el abastecimiento ecológico y las prácticas de producción sostenibles.
Las tendencias de etiquetado limpio y sostenibilidad influyen en las decisiones de compra, y los fabricantes destacan el abastecimiento transparente, las certificaciones orgánicas y la producción responsable con el medio ambiente. Estos factores ayudan a las marcas a diferenciar sus productos en un mercado competitivo, generar confianza en el consumidor e impulsar la adopción de productos de vainilla premium.
Por ejemplo, en 2024, marcas líderes como Starbucks y Nestlé ampliaron sus portafolios de productos incorporando extractos naturales de vainilla en bebidas, helados y confitería. Estos lanzamientos respondieron a la creciente preferencia de los consumidores por sabores auténticos y productos de marca limpia, distribuidos en canales minoristas, especializados y en línea, a la vez que reforzaron la fidelidad a la marca y la repetición de compras.
Si bien la demanda de vainas y extractos de vainilla está en aumento, la expansión sostenida del mercado depende de la I+D continua, una producción rentable y el mantenimiento de una calidad de sabor constante. Los fabricantes también se centran en mejorar la escalabilidad, la fiabilidad de la cadena de suministro y el desarrollo de fórmulas innovadoras que equilibren coste, calidad y sostenibilidad para una adopción más amplia.
Dinámica del mercado europeo de vainas y extractos de vainilla
Conductor
Creciente preferencia por sabores naturales y de etiqueta limpia
La creciente demanda de sabores auténticos de origen vegetal es un factor clave para el mercado de las vainas y extractos de vainilla. Los fabricantes están reemplazando cada vez más los saborizantes sintéticos por vainilla natural para cumplir con las expectativas de etiquetado limpio, mejorar el atractivo del producto y cumplir con las normas regulatorias. Esta tendencia también impulsa la innovación en métodos de extracción natural y técnicas de concentración de sabores.
La expansión de las aplicaciones en panadería, confitería, bebidas, lácteos y postres congelados está impulsando el crecimiento del mercado. Los extractos de vainilla mejoran el sabor, el aroma y la percepción del producto, a la vez que mantienen el etiquetado natural, lo que permite a los fabricantes satisfacer las expectativas de los consumidores de productos naturales y de alta calidad.
Los fabricantes de alimentos y bebidas promueven activamente productos formulados con vainilla natural mediante innovación, campañas de marketing y certificaciones. Estos esfuerzos se ven respaldados por la creciente preferencia de los consumidores por productos saludables y de origen sostenible, lo que fomenta la colaboración entre proveedores de ingredientes y marcas para mejorar la calidad funcional y la sostenibilidad.
Por ejemplo, en 2023, empresas como Ben & Jerry's y Häagen-Dazs incrementaron la incorporación de extractos de vainilla premium en helados y postres. Esta expansión se produjo tras la creciente demanda de sabores de etiqueta limpia, sin OMG y de origen sostenible, lo que impulsó las compras recurrentes y la diferenciación de productos. Ambas empresas destacaron el abastecimiento ético y la trazabilidad en sus campañas de marketing para fortalecer la confianza del consumidor y la fidelidad a la marca.
Si bien las tendencias en etiquetas limpias y sabores naturales impulsan el crecimiento, una adopción más amplia depende de la optimización de costos, la disponibilidad de materias primas y la escalabilidad de los procesos de producción. La inversión en la eficiencia de la cadena de suministro, el abastecimiento sostenible y la tecnología de extracción avanzada serán cruciales para satisfacer la demanda global y mantener la ventaja competitiva.
Restricción/Desafío
Mayor costo y volatilidad de suministro en comparación con los sabores sintéticos.
El costo relativamente más alto de las vainas y extractos de vainilla natural en comparación con los saborizantes sintéticos sigue siendo un desafío clave, lo que limita su adopción entre los fabricantes sensibles a los precios. Factores como la complejidad del cultivo, los métodos de extracción y las variaciones estacionales contribuyen a los precios elevados e impactan la penetración en el mercado.
Los desafíos de la cadena de suministro también afectan el crecimiento, ya que las vainas de vainilla requieren abastecerse en regiones específicas y cumplir con estrictos estándares de calidad. Las fluctuaciones en los rendimientos debido al clima, enfermedades o factores geopolíticos pueden interrumpir el suministro, lo que genera volatilidad de precios y una disponibilidad limitada de vainas de alta calidad.
El conocimiento del mercado y los conocimientos técnicos influyen en la adopción, especialmente entre los pequeños fabricantes. Un conocimiento limitado de los beneficios funcionales y de sabor de la vainilla natural puede limitar su adopción en ciertas categorías de productos y retrasar la innovación.
• Por ejemplo, en 2024, los productores de confitería informaron dificultades para asegurar suministros constantes de vainilla debido a la escasez de cultivos y los altos costos, lo que afectó la planificación de la producción, los precios y la visibilidad del producto.
Superar estos desafíos requerirá una producción rentable, redes de abastecimiento ampliadas e inversión en prácticas de cultivo sostenibles. La colaboración con agricultores, organismos de certificación y distribuidores puede ayudar a estabilizar el suministro y a liberar el potencial de crecimiento a largo plazo en el mercado mundial de vainilla en grano y extracto, a la vez que refuerza el abastecimiento ético y la reputación de la marca.
Mercado europeo de vainas y extracto de vainilla
El mercado europeo de vainilla y extracto está segmentado en seis segmentos notables según el tipo de producto, los grados, el origen, la forma, el usuario final y el canal de distribución.
• Por tipo de producto
Según el tipo de producto, el mercado europeo de vainilla en grano y extracto se segmenta en Madagascar, México, India, Indonesia, Tahití, Tonga, Papúa, Uganda y otros. El segmento de Madagascar obtuvo la mayor cuota de mercado en 2025, gracias a su perfil de sabor superior, calidad consistente y amplia preferencia entre los fabricantes de alimentos y bebidas premium. La vainilla de Madagascar se utiliza ampliamente en panadería, repostería y productos lácteos, lo que la convierte en una opción preferida para aplicaciones de sabor auténtico.
Se prevé que el segmento mexicano experimente el mayor crecimiento entre 2026 y 2033, impulsado por la creciente demanda de su rico aroma y su adaptabilidad a diversas aplicaciones culinarias y de bebidas. La vainilla mexicana está ganando popularidad gracias a su sabor equilibrado, su rentabilidad y su creciente reconocimiento en los mercados internacionales, lo que anima a los fabricantes a incorporarla en sus líneas de productos premium y convencionales.
• Por grados
En función de los grados, el mercado europeo de vainilla en grano y extracto se segmenta en Grado A, Grado B y otros. El segmento de Grado A obtuvo la mayor cuota de mercado en 2025, gracias a su alto contenido de vainillina, su intenso aroma y su idoneidad para productos alimenticios y bebidas de alta gama. El Grado A se utiliza ampliamente en panadería, repostería y productos lácteos, garantizando un sabor auténtico y altos estándares de calidad.
Se prevé que el segmento de Grado B experimente el mayor crecimiento entre 2026 y 2033, impulsado por su rentabilidad y versatilidad en productos procesados y extractos. El Grado B es cada vez más preferido por los fabricantes que buscan optimizar los costos de producción manteniendo una calidad de sabor aceptable, lo que lo hace ideal para aplicaciones a granel.
• Por origen
Según su origen, el mercado europeo de vainilla en grano y extracto se segmenta en natural y sintético. El segmento natural registró la mayor cuota de mercado en 2025, impulsado por la creciente preferencia de los consumidores por ingredientes vegetales de etiqueta limpia. La vainilla natural se utiliza ampliamente en productos de panadería, bebidas y cuidado personal gracias a su auténtico aroma y sabor.
Se prevé que el segmento sintético experimente el mayor crecimiento entre 2026 y 2033, impulsado por su calidad constante, menor costo y su idoneidad para aplicaciones industriales a gran escala. La vainilla sintética está ganando terreno en alimentos y bebidas procesados, donde el suministro de vainilla natural es limitado.
• Por formulario
En cuanto a su presentación, el mercado europeo de vainilla en grano y extracto se segmenta en líquido, polvo y pasta. El segmento líquido registró la mayor cuota de mercado en 2025, gracias a su facilidad de uso, mejor solubilidad y compatibilidad con productos de panadería, bebidas y lácteos. La vainilla líquida es ampliamente preferida por los fabricantes por su integración fluida en recetas y formulaciones.
Se prevé que el segmento de los polvos registre el mayor crecimiento entre 2026 y 2033, impulsado por su larga vida útil, su fácil almacenamiento y su uso en aplicaciones especiales. La pasta de vainilla también está ganando popularidad en productos culinarios y de repostería premium gracias a su perfil de sabor concentrado.
• Por el usuario final
En función del usuario final, el mercado europeo de vainilla en grano y extracto se segmenta en productos alimenticios, bebidas, productos de cuidado personal, industria farmacéutica, cocina casera y otros. El segmento de productos alimenticios registró la mayor participación en los ingresos del mercado en 2025, impulsado por la alta demanda de los sectores de panadería, confitería y lácteos. La vainilla se utiliza ampliamente para realzar el sabor, el aroma y el atractivo general del producto.
Se prevé que el segmento de bebidas experimente el mayor crecimiento entre 2026 y 2033, impulsado por el creciente consumo de bebidas saborizadas, café y lácteos. Los productos de cuidado personal y las aplicaciones culinarias para el hogar también están experimentando una creciente adopción debido a la demanda de ingredientes naturales y de primera calidad.
• Por canal de distribución
Según el canal de distribución, el mercado europeo de vainilla en grano y extracto se segmenta en B2B y B2C. El segmento B2B registró la mayor cuota de mercado en 2025, impulsado por la compra a granel por parte de los fabricantes de alimentos y bebidas. Las vainillas en grano y sus extractos se suministran ampliamente a fabricantes industriales para lograr un sabor uniforme en productos procesados.
Se prevé que el segmento B2C experimente el mayor crecimiento entre 2026 y 2033, impulsado por la creciente popularidad de la cocina casera, los canales de venta en línea y los productos de vainilla listos para usar. Los consumidores compran cada vez más productos de vainilla directamente para uso culinario y aplicaciones especiales.
Análisis regional del mercado europeo de vainilla en grano y extracto
Alemania dominó el mercado de vainas y extracto de vainilla con la mayor participación en los ingresos en 2025, impulsada por la fuerte demanda de los sectores de panadería, confitería y bebidas premium. Los consumidores valoran la vainilla de alta calidad por sus aplicaciones de sabor auténtico y su posicionamiento de marca limpia.
• El crecimiento del mercado se ve respaldado además por estrictos estándares de calidad, industrias de procesamiento de alimentos bien establecidas y la creciente preferencia de los consumidores por los ingredientes naturales.
• Además, la creciente tendencia de productos alimenticios gourmet y artesanales, junto con el aumento de las exportaciones a los países europeos vecinos, está impulsando la expansión del mercado de la vainilla, alentando a los fabricantes a invertir en abastecimiento sostenible y productos innovadores a base de vainilla.
Análisis del mercado de vainilla en grano y extracto en el Reino Unido
Se prevé que el mercado británico de vainilla en grano y extracto experimente el mayor crecimiento entre 2026 y 2033, impulsado por la creciente demanda de aromas naturales en panadería, confitería y bebidas. La creciente concienciación sobre la salud, la creciente popularidad de los productos vegetales y de etiqueta limpia, y la expansión de los canales de venta minorista y online están impulsando el crecimiento del mercado. Además, la innovación en productos con infusión de vainilla y las tendencias de premiumización están impulsando su adopción.
Cuota de mercado de vainas y extracto de vainilla en Europa
La industria europea de vainilla y extractos de vainilla está liderada principalmente por empresas bien establecidas, entre las que se incluyen:
- Balneario Vaniglia (Italia)
- Vainillas Nielsen-Massey (Reino Unido)
- Naturprodukte GmbH (Alemania)
- Vainillas Nielsen-Massey Europa (Francia)
- Monin (Francia)
- Bourbons SAS (Francia)
- Vanillaplan (Alemania)
- Prova GmbH (Alemania)
- Vanillaworld Europa (Reino Unido)
- Vanillina Ltd. (Reino Unido)
- Vanille de France (Francia)
- AgroVanilla GmbH (Alemania)
- Vanille Royale (Francia)
- Taste of Nature Ltd. (Reino Unido)
SKU-
Obtenga acceso en línea al informe sobre la primera nube de inteligencia de mercado del mundo

- Panel de análisis de datos interactivo
- Panel de análisis de empresas para oportunidades con alto potencial de crecimiento
- Acceso de analista de investigación para personalización y consultas
- Análisis de la competencia con panel interactivo
- Últimas noticias, actualizaciones y análisis de tendencias
- Aproveche el poder del análisis de referencia para un seguimiento integral de la competencia
Metodología de investigación
La recopilación de datos y el análisis del año base se realizan utilizando módulos de recopilación de datos con muestras de gran tamaño. La etapa incluye la obtención de información de mercado o datos relacionados a través de varias fuentes y estrategias. Incluye el examen y la planificación de todos los datos adquiridos del pasado con antelación. Asimismo, abarca el examen de las inconsistencias de información observadas en diferentes fuentes de información. Los datos de mercado se analizan y estiman utilizando modelos estadísticos y coherentes de mercado. Además, el análisis de la participación de mercado y el análisis de tendencias clave son los principales factores de éxito en el informe de mercado. Para obtener más información, solicite una llamada de un analista o envíe su consulta.
La metodología de investigación clave utilizada por el equipo de investigación de DBMR es la triangulación de datos, que implica la extracción de datos, el análisis del impacto de las variables de datos en el mercado y la validación primaria (experto en la industria). Los modelos de datos incluyen cuadrícula de posicionamiento de proveedores, análisis de línea de tiempo de mercado, descripción general y guía del mercado, cuadrícula de posicionamiento de la empresa, análisis de patentes, análisis de precios, análisis de participación de mercado de la empresa, estándares de medición, análisis global versus regional y de participación de proveedores. Para obtener más información sobre la metodología de investigación, envíe una consulta para hablar con nuestros expertos de la industria.
Personalización disponible
Data Bridge Market Research es líder en investigación formativa avanzada. Nos enorgullecemos de brindar servicios a nuestros clientes existentes y nuevos con datos y análisis que coinciden y se adaptan a sus objetivos. El informe se puede personalizar para incluir análisis de tendencias de precios de marcas objetivo, comprensión del mercado de países adicionales (solicite la lista de países), datos de resultados de ensayos clínicos, revisión de literatura, análisis de mercado renovado y base de productos. El análisis de mercado de competidores objetivo se puede analizar desde análisis basados en tecnología hasta estrategias de cartera de mercado. Podemos agregar tantos competidores sobre los que necesite datos en el formato y estilo de datos que esté buscando. Nuestro equipo de analistas también puede proporcionarle datos en archivos de Excel sin procesar, tablas dinámicas (libro de datos) o puede ayudarlo a crear presentaciones a partir de los conjuntos de datos disponibles en el informe.

