

Mercado europeo de gestión de gastos de telecomunicaciones, por oferta (solución, servicio), modo de prestación del servicio (software con licencia, servicios gestionados y subcontratación completa, hospedado), tamaño de la empresa (grandes empresas, pequeñas y medianas empresas), uso final (TI y telecomunicaciones, BFSI, fabricación, atención médica, transporte y logística, bienes de consumo y venta minorista, energía y electricidad, medios y entretenimiento, otros) y país (Reino Unido, Alemania, Francia, Italia, España, Rusia, Bélgica, Países Bajos, Suiza, Turquía y resto de Europa) Tendencias de la industria y pronóstico hasta 2028
 Análisis y perspectivas del mercado: mercado europeo de gestión de gastos de telecomunicaciones
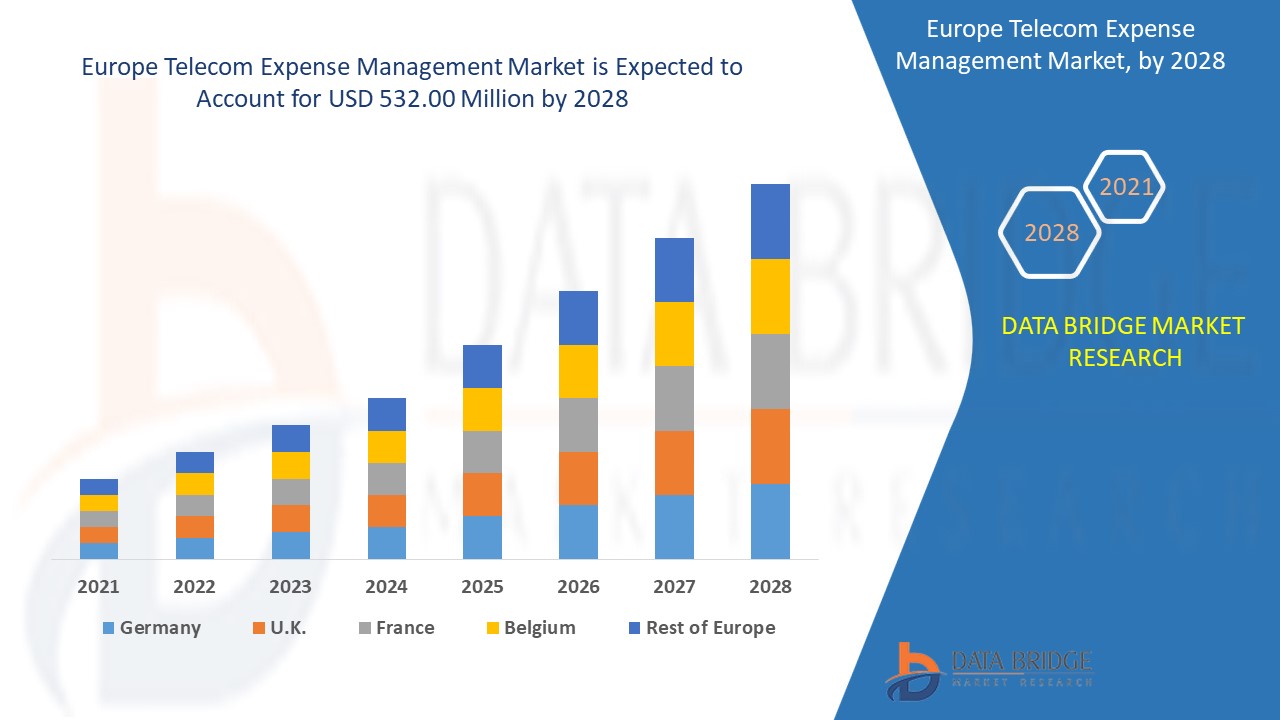
Se espera que el mercado de gestión de gastos de telecomunicaciones de Europa gane crecimiento de mercado en el período de pronóstico de 2021 a 2028. Data Bridge Market Research analiza que el mercado está creciendo con una CAGR del 4,0% en el período de pronóstico de 2021 a 2028 y se espera que alcance los USD 532,00 millones para 2028. El aumento de la demanda de TEM debido a IoT y las aplicaciones basadas en la nube está impulsando el mercado.
La gestión de gastos de telecomunicaciones (TEM) es un método para gestionar todos los gastos de servicios de telecomunicaciones , como voz, datos e inalámbricos, con una combinación de herramientas de software y auditoría manual. Al gestionar todos estos servicios y procesos relacionados, el objetivo principal es minimizar los costos y maximizar la eficiencia del proceso. Para una empresa pequeña, puede ser tan simple como revisar su factura telefónica todos los meses para asegurarse de que no le facturen servicios que no desea. Para las empresas más grandes, es un programa más formal para optimizar el gasto en servicios de telecomunicaciones. La mayor parte de la atención se destina a la auditoría de facturas y a la obtención de reembolsos por errores de facturación, pero un programa TEM eficaz puede hacer más que eso.
El aumento de la demanda de gestión de gastos de telecomunicaciones debido a la IoT y las aplicaciones basadas en la nube es el principal factor impulsor del mercado. La previsión de gastos futuros puede resultar un desafío, sin embargo, el bajo costo de implementación y la creciente demanda de soluciones de gestión de gastos de telecomunicaciones rentables resultan ser una oportunidad. Las restricciones debidas a la falta de interoperabilidad entre soluciones y diferentes proveedores son los factores limitantes.
El informe de mercado de gestión de gastos de telecomunicaciones proporciona detalles de la participación de mercado, nuevos desarrollos y análisis de la cartera de productos, el impacto de los actores del mercado nacional y localizado, analiza las oportunidades en términos de bolsillos de ingresos emergentes, cambios en las regulaciones del mercado, aprobaciones de productos, decisiones estratégicas, lanzamientos de productos, expansiones geográficas e innovaciones tecnológicas en el mercado. Para comprender el análisis y el escenario del mercado de gestión de gastos de telecomunicaciones, comuníquese con Data Bridge Market Research para obtener un informe de analista; nuestro equipo lo ayudará a crear una solución de impacto en los ingresos para lograr su objetivo deseado.
 Alcance y tamaño del mercado de gestión de gastos de telecomunicaciones en Europa
El mercado europeo de gestión de gastos de telecomunicaciones está segmentado en función de la oferta, el modo de prestación del servicio, el tamaño de la empresa y el uso final. El crecimiento entre segmentos le ayuda a analizar nichos de crecimiento y estrategias para abordar el mercado y determinar sus áreas de aplicación principales y la diferencia en sus mercados objetivo.
- En función de la oferta, el mercado global de gestión de gastos de telecomunicaciones se segmenta en soluciones y servicios . En 2021, se espera que el segmento de soluciones domine el mercado global de gestión de gastos de telecomunicaciones, ya que ayuda a reducir los costos innecesarios y optimizar el gasto en telecomunicaciones.
- En función del modo de prestación de servicios, el mercado global de gestión de gastos de telecomunicaciones se ha segmentado en software con licencia, servicios gestionados y externalización completa y alojada. En 2021, se espera que el segmento de software con licencia domine el mercado global de gestión de gastos de telecomunicaciones, ya que todas las operaciones las realiza el propio cliente, lo que brinda transparencia a todos los gastos realizados.
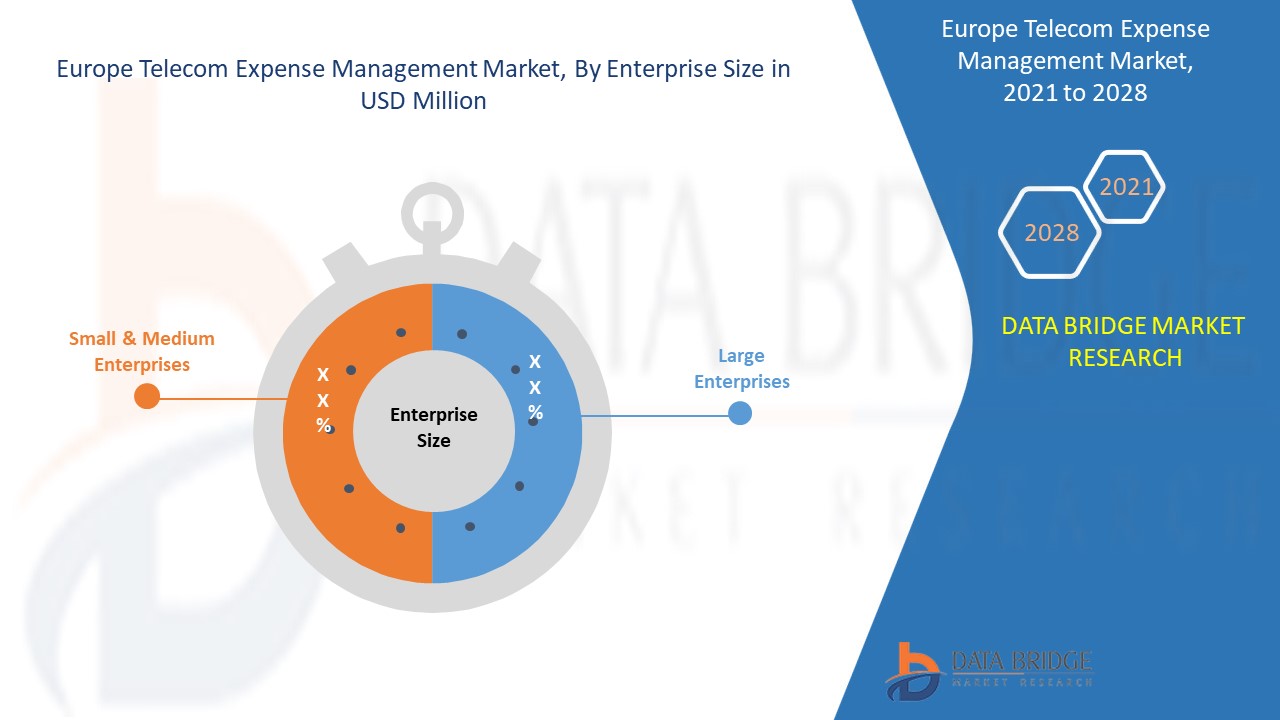
- En función del tamaño de las empresas, el mercado mundial de gestión de gastos de telecomunicaciones se ha segmentado en grandes empresas y pequeñas y medianas empresas. En 2021, se espera que el segmento de las grandes empresas domine el mercado mundial de gestión de gastos de telecomunicaciones, ya que la mayor parte del trabajo de muchas grandes empresas se lleva a cabo a través de las telecomunicaciones, lo que aumenta la demanda de soluciones TEM para reducir su gasto en telecomunicaciones.
- En función del uso final, el mercado global de gestión de gastos de telecomunicaciones se ha segmentado en TI y telecomunicaciones, BFSI , fabricación, atención médica, transporte y logística, bienes de consumo y venta minorista, energía y electricidad, medios y entretenimiento, entre otros. En 2021, se espera que el segmento de TI y telecomunicaciones domine el mercado global de gestión de gastos de telecomunicaciones, ya que el uso de teléfonos móviles con fines de comunicación ha aumentado enormemente y la necesidad de soluciones TEM en el mercado también está aumentando.
Análisis a nivel de país del mercado de gestión de gastos de telecomunicaciones en Europa
El mercado europeo de gestión de gastos de telecomunicaciones está segmentado en función de la oferta, el modo de prestación del servicio, el tamaño de la empresa y el uso final.
Los países incluidos en el informe sobre el mercado de gestión de gastos de telecomunicaciones son el Reino Unido, Alemania, Francia, Italia, España, Rusia, Bélgica, Países Bajos, Suiza, Turquía y el resto de Europa. El Reino Unido domina el mercado debido a la demanda y la presencia de proveedores clave para la gestión de gastos de telecomunicaciones.
La sección de países del informe también proporciona factores de impacto individuales en el mercado y cambios en la regulación en el mercado a nivel nacional que afectan las tendencias actuales y futuras del mercado. Los puntos de datos como nuevas ventas, ventas de reemplazo, demografía del país, leyes regulatorias y aranceles de importación y exportación son algunos de los principales indicadores utilizados para pronosticar el escenario del mercado para países individuales. Además, se considera la presencia y disponibilidad de marcas europeas y los desafíos que enfrentan debido a la competencia grande o escasa de las marcas locales y nacionales, el impacto de los canales de venta al proporcionar un análisis de pronóstico de los datos del país.
El creciente uso de la biometría en el gobierno para fines de seguridad y vigilancia está impulsando el crecimiento del mercado de gestión de gastos de telecomunicaciones en Europa.
El mercado europeo de gestión de gastos de telecomunicaciones también le ofrece un análisis detallado del mercado para el crecimiento de cada país en un mercado en particular. Además, proporciona información detallada sobre la estrategia de los actores del mercado y su presencia geográfica. Los datos están disponibles para el período histórico de 2010 a 2019.
Análisis del panorama competitivo y de la cuota de mercado de la gestión de gastos de telecomunicaciones en Europa
El panorama competitivo del mercado de gestión de gastos de telecomunicaciones proporciona detalles por competidor. Los detalles incluidos son una descripción general de la empresa, las finanzas de la empresa, los ingresos generados, el potencial de mercado, la inversión en investigación y desarrollo, las nuevas iniciativas de mercado, los sitios e instalaciones de producción, las fortalezas y debilidades de la empresa, el lanzamiento de productos, los procesos de prueba de productos, las aprobaciones de productos, las patentes, la amplitud y la profundidad de los productos, el dominio de las aplicaciones y la curva de la línea de vida de la tecnología. Los puntos de datos anteriores proporcionados solo están relacionados con el enfoque de la empresa relacionado con el mercado de gestión de gastos de telecomunicaciones.
Las principales empresas que se dedican a la gestión de gastos de telecomunicaciones son Vodafone Group, CGI Inc., Dimension Data, Accenture, Econocom, Asignet, Technology DNA, AVOTUS, Calero-MDSL, Cass Information Systems, Inc., Network Control, One Source, RadiusPoint, Saaswedo, Sakon, Tangoe, Tellennium, Upland Software, Inc., VALICOM, vMOX, LLC., WidePoint Corporation y otras empresas nacionales. Los analistas de DBMR comprenden las fortalezas competitivas y proporcionan un análisis competitivo para cada competidor por separado.
Numerosos contratos y acuerdos son iniciados también por empresas de todo el mundo, lo que también está acelerando el mercado de gestión de gastos de telecomunicaciones.
Por ejemplo,
- En abril de 2021, Calero-MDSL, una empresa con sede en EE. UU., anunció la adquisición de MetaPort, una empresa con sede en EE. UU. que es una empresa líder en software de mapeo de redes de telecomunicaciones. Con esta adquisición, la empresa podrá ofrecer a las organizaciones de CIO y CTO una visualización de inventario única que proporcionará un nuevo nivel de visibilidad de sus activos de telecomunicaciones. De este modo, la empresa podrá expandir su negocio en el espacio del software de gestión de gastos de tecnología.
- En julio de 2020, WidePoint Corporation, una empresa con sede en EE. UU., anunció que había obtenido un nuevo contrato con la Autoridad de Control de Bebidas Alcohólicas de Virginia (Virginia ABC) para brindarles servicios de gestión de gastos de telecomunicaciones. El contrato tiene una duración de un año y contiene cuatro períodos de renovación adicionales de un año. De esta manera, la empresa ayudará a Virginia ABC a enfrentar los desafíos de la pandemia mediante la gestión de los gastos de telecomunicaciones de las empresas.
SKU-
Obtenga acceso en línea al informe sobre la primera nube de inteligencia de mercado del mundo

- Panel de análisis de datos interactivo
- Panel de análisis de empresas para oportunidades con alto potencial de crecimiento
- Acceso de analista de investigación para personalización y consultas
- Análisis de la competencia con panel interactivo
- Últimas noticias, actualizaciones y análisis de tendencias
- Aproveche el poder del análisis de referencia para un seguimiento integral de la competencia
Tabla de contenido
- introduction
- OBJECTIVES OF THE STUDY
- MARKET DEFINITION
- OVERVIEW OF Europe Telecom expense management Market
- Currency and Pricing
- LIMITATIONS
- MARKETS COVERED
- MARKET SEGMENTATION
- MARKETS COVERED
- geographicAL scope
- years considered for the study
- DBMR TRIPOD DATA VALIDATION MODEL
- primary interviews with key opinion leaders
- DBMR MARKET POSITION GRID
- vendor share analysis
- Multivariate Modeling
- OFFERING timeline curve
- MARKET APPLICATION COVERAGE GRID
- secondary sourcEs
- assumptions
- EXECUTIVE SUMMARY
- premium insights
- Use Case Analysis
- Case Study 1:
- Case Study 2:
- porters five forces analysis
- MARKET OVERVIEW
- DRIVERS
- SIGNIFICANT COST REDUCTION
- INCREASE IN ADOPTION OF MOBILE PHONES AND OTHER PORTABLE DEVICES
- PROVIDING EXPENSE TRANSPARENCY
- INCREASE IN DEMAND FOR TEM DUE TO IOT AND CLOUD-BASED APPLICATION
- RISE IN DEMAND OF TEM IN THE HEALTHCARE SECTOR
- RISE IN DEMAND FOR TEM MARKET FOR MID-SIZED BUSINESSES
- RESTRAINT
- LACK OF INTEROPERABILITY BETWEEN SOLUTIONS AND DIFFERENT VENDORS
- OPPORTUNITIES
- AUTOMATION TECHNOLOGY FOR TEM
- OUTSOURCING OF TEM MARKET
- LOW DEPLOYMENT COST AND GROWING DEMAND FOR COST-EFFICIENT TEM SOLUTIONS
- CHALLENGES
- FORECASTING FUTURE SPEND
- TRACKING INVENTORY ON BILLS
- IMPACT OF COVID-19 ON THE EUROPE TELECOM EXPENSE MNAGEMENT MARKET
- ANALYSIS ON IMPACT OF COVID-19 ON THE MARKET
- AFTERMATH OF COVID-19
- STRATEGIC DECISIONS FOR MANUFACTURERS AFTER COVID-19 TO GAIN COMPETITIVE MARKET SHARE
- IMPACT ON DEMAND
- CONCLUSION
- Europe telecom expense management market, By offering
- overview
- Solution
- Ordering & Provisioning Management
- Sourcing Management
- Reporting & Business Management
- Invoice Management
- Usage Management
- Dispute Management
- others
- services
- Implementation & Integration
- Training & Consulting
- Support & Maintenance
- Europe telecom expense management market, By Service delivery mode
- overview
- Licensed Software
- Managed Services and Complete Outsourcing
- Hosted
- Europe telecom expense management market, By enterprise size
- overview
- Large Enterprises
- Small & Medium Enterprises
- Europe telecom expense management market, By end use
- overview
- IT & Telecom
- solution
- services
- BFSI
- solution
- services
- Manufacturing
- solution
- services
- Healthcare
- solution
- services
- Transportation & Logistics
- solution
- services
- Consumer Goods & Retail
- solution
- services
- Energy & Power
- solution
- services
- Media & Entertainment
- solution
- services
- others
- solution
- services
- Europe Telecom expense management Market, by REGION
- EUROPE
- U.K.
- Germany
- FRANCE
- Italy
- Spain
- Russia
- Belgium
- Netherlands
- Switzerland
- Turkey
- Rest of Europe
- EUROPE Telecom expense management market, COMPANY landscape
- company share analysis: EUROPE
- swot analysis
- company profile
- VODAFONE GROUP
- COMPANY SNAPSHOT
- REVENUE ANALYSIS
- company share analysis
- PRODUCT PORTFOLIO
- RECENT DEVELOPMENTS
- CGI INC.
- COMPANY SNAPSHOT
- REVENUE ANALYSIS
- company share analysis
- PRODUCT PORTFOLIO
- RECENT DEVELOPMENTS
- DIMENSION DATA
- COMPANY SNAPSHOT
- REVENUE ANALYSIS
- company share analysis
- PRODUCT PORTFOLIO
- RECENT DEVELOPMENTS
- ACCENTURE
- COMPANY SNAPSHOT
- REVENUE ANALYSIS
- company share analysis
- PRODUCT PORTFOLIO
- RECENT DEVELOPMENT
- ECONOCOM
- COMPANY SNAPSHOT
- REVENUE ANALYSIS
- company share analysis
- PRODUCT PORTFOLIO
- RECENT DEVELOPMENTS
- ASIGNET. TECHNOLOGY DNA
- COMPANY SNAPSHOT
- PRODUCT PORTFOLIO
- RECENT DEVELOPMENTS
- AVOTUS
- COMPANY SNAPSHOT
- PRODUCT PORTFOLIO
- RECENT DEVELOPMENT
- CALERO-MDSL
- COMPANY SNAPSHOT
- PRODUCT PORTFOLIO
- RECENT DEVELOPMENTS
- CASS INFORMATION SYSTEMS, INC.
- COMPANY SNAPSHOT
- REVENUE ANALYSIS
- PRODUCT PORTFOLIO
- RECENT DEVELOPMENTS
- NETWORK CONTROL
- COMPANY SNAPSHOT
- PRODUCT PORTFOLIO
- RECENT DEVELOPMENTS
- ONE SOURCE
- COMPANY SNAPSHOT
- PRODUCT PORTFOLIO
- RECENT DEVELOPMENTS
- RADIUSPOINT
- COMPANY SNAPSHOT
- PRODUCT PORTFOLIO
- RECENT DEVELOPMENTS
- SAASWEDO
- COMPANY SNAPSHOT
- PRODUCT PORTFOLIO
- RECENT DEVELOPMENTS
- SAKON
- COMPANY SNAPSHOT
- PRODUCT PORTFOLIO
- RECENT DEVELOPMENTS
- TANGOE
- COMPANY SNAPSHOT
- PRODUCT PORTFOLIO
- RECENT DEVELOPMENTS
- TELLENNIUM
- COMPANY SNAPSHOT
- PRODUCT PORTFOLIO
- RECENT DEVELOPMENTS
- UPLAND SOFTWARE, INC.
- COMPANY SNAPSHOT
- REVENUE ANALYSIS
- PRODUCT PORTFOLIO
- RECENT DEVELOPMENT
- VALICOM
- COMPANY SNAPSHOT
- PRODUCT PORTFOLIO
- RECENT DEVELOPMENT
- VMOX, LLC
- COMPANY SNAPSHOT
- PRODUCT PORTFOLIO
- RECENT DEVELOPMENTS
- WIDEPOINT CORPORATION
- COMPANY SNAPSHOT
- REVENUE ANALYSIS
- PRODUCT PORTFOLIO
- RECENT DEVELOPMENTS
- questionnaire
- related reports
Lista de Tablas
TABLE 1 Europe telecom expense management market, By offering, 2019-2028 (USD MILLION)
TABLE 2 Europe Solution in Telecom expense management market, By Region, 2019-2028 (USD MILLION)
TABLE 3 Europe Solution in Telecom expense management market, By Type, 2019-2028 (USD MILLION)
TABLE 4 Europe Services in Telecom expense management market, By Region, 2019-2028 (USD MILLION)
TABLE 5 Europe Services in Telecom expense management market, By Type, 2019-2028 (USD MILLION)
TABLE 6 Europe telecom expense management market, By service delivery mode, 2019-2028 (USD MILLION)
TABLE 7 Europe Licensed Software in Telecom expense management market, By Region, 2019-2028 (USD MILLION)
TABLE 8 Europe Managed Services and Complete Outsourcing in Telecom expense management market, By Region, 2019-2028 (USD MILLION)
TABLE 9 Europe Hosted in Telecom expense management market, By Region, 2019-2028 (USD MILLION)
TABLE 10 Europe telecom expense management market, By enterprise size, 2019-2028 (USD MILLION)
TABLE 11 Europe Large Enterprises in Telecom expense management market, By Region, 2019-2028 (USD MILLION)
TABLE 12 Europe Small & Medium Enterprises in Telecom expense management market, By Region, 2019-2028 (USD MILLION)
TABLE 13 Europe telecom expense management market, By end user, 2019-2028 (USD MILLION)
TABLE 14 Europe IT & Telecom in Telecom expense management market, By Region, 2019-2028 (USD MILLION)
TABLE 15 Europe IT & Telecom in Telecom expense management market, By offering, 2019-2028 (USD MILLION)
TABLE 16 Europe BFSI in Telecom expense management market, By Region, 2019-2028 (USD MILLION)
TABLE 17 Europe BFSI in Telecom expense management market, By offering, 2019-2028 (USD MILLION)
TABLE 18 Europe Manufacturing in Telecom expense management market, By Region, 2019-2028 (USD MILLION)
TABLE 19 Europe Manufacturing in Telecom expense management market, By offering, 2019-2028 (USD MILLION)
TABLE 20 Europe Healthcare in Telecom expense management market, By Region, 2019-2028 (USD MILLION)
TABLE 21 Europe Healthcare in Telecom expense management market, By offering, 2019-2028 (USD MILLION)
TABLE 22 Europe Transportation & Logistics in Telecom expense management market, By Region, 2019-2028 (USD MILLION)
TABLE 23 Europe Transportation & Logistics in Telecom expense management market, By offering, 2019-2028 (USD MILLION)
TABLE 24 Europe Consumer Goods & Retail in Telecom expense management market, By Region, 2019-2028 (USD MILLION)
TABLE 25 Europe Consumer Goods & Retail in Telecom expense management market, By offering, 2019-2028 (USD MILLION)
TABLE 26 Europe Energy & Power in Telecom expense management market, By Region, 2019-2028 (USD MILLION)
TABLE 27 Europe Energy & Power in Telecom expense management market, By offering, 2019-2028 (USD MILLION)
TABLE 28 Europe Media & Entertainment in Telecom expense management market, By Region, 2019-2028 (USD MILLION)
TABLE 29 Europe Media & Entertainment in Telecom expense management market, By offering, 2019-2028 (USD MILLION)
TABLE 30 Europe Others in Telecom expense management market, By Region, 2019-2028 (USD MILLION)
TABLE 31 Europe Others in Telecom expense management market, By offering, 2019-2028 (USD MILLION)
TABLE 32 Europe Telecom expense management Market, By Country, 2019-2028 (USD Million)
TABLE 33 Europe Telecom Expense Management Market, By Offering, 2019-2028 (USD Million)
TABLE 34 Europe Solution in Telecom Expense Management Market, By Type, 2019-2028 (USD Million)
TABLE 35 Europe Services in Telecom Expense Management Market, By Type, 2019-2028 (USD Million)
TABLE 36 Europe Telecom Expense Management Market, By Service Delivery Mode, 2019-2028 (USD Million)
TABLE 37 Europe Telecom Expense Management Market, By Enterprise Size, 2019-2028 (USD Million)
TABLE 38 Europe Telecom Expense Management Market, By End Use, 2019-2028 (USD Million)
TABLE 39 Europe IT & Telecom in Telecom Expense Management Market, By Offering, 2019-2028 (USD Million)
TABLE 40 Europe BFSI in Telecom Expense Management Market, By Offering, 2019-2028 (USD Million)
TABLE 41 Europe Manufacturing in Telecom Expense Management Market, By Offering, 2019-2028 (USD Million)
TABLE 42 Europe Healthcare in Telecom Expense Management Market, By Offering, 2019-2028 (USD Million)
TABLE 43 Europe Transportation & Logistics in Telecom Expense Management Market, By Offering, 2019-2028 (USD Million)
TABLE 44 Europe Consumer Goods & Retail in Telecom Expense Management Market, By Offering, 2019-2028 (USD Million)
TABLE 45 Europe Energy & Power in Telecom Expense Management Market, By Offering, 2019-2028 (USD Million)
TABLE 46 Europe Media & Entertainment in Telecom Expense Management Market, By Offering, 2019-2028 (USD Million)
TABLE 47 Europe Others in Telecom Expense Management Market, By Offering, 2019-2028 (USD Million)
TABLE 48 U.K. Telecom Expense Management Market, By Offering, 2019-2028 (USD Million)
TABLE 49 U.K. Solution in Telecom Expense Management Market, By Type, 2019-2028 (USD Million)
TABLE 50 U.K. Services in Telecom Expense Management Market, By Type, 2019-2028 (USD Million)
TABLE 51 U.K. Telecom Expense Management Market, By Service Delivery Mode, 2019-2028 (USD Million)
TABLE 52 U.K. Telecom Expense Management Market, By Enterprise Size, 2019-2028 (USD Million)
TABLE 53 U.K. Telecom Expense Management Market, By End Use, 2019-2028 (USD Million)
TABLE 54 U.K. IT & Telecom in Telecom Expense Management Market, By Offering, 2019-2028 (USD Million)
TABLE 55 U.K. BFSI in Telecom Expense Management Market, By Offering, 2019-2028 (USD Million)
TABLE 56 U.K. Manufacturing in Telecom Expense Management Market, By Offering, 2019-2028 (USD Million)
TABLE 57 U.K. Healthcare in Telecom Expense Management Market, By Offering, 2019-2028 (USD Million)
TABLE 58 U.K. Transportation & Logistics in Telecom Expense Management Market, By Offering, 2019-2028 (USD Million)
TABLE 59 U.K. Consumer Goods & Retail in Telecom Expense Management Market, By Offering, 2019-2028 (USD Million)
TABLE 60 U.K. Energy & Power in Telecom Expense Management Market, By Offering, 2019-2028 (USD Million)
TABLE 61 U.K. Media & Entertainment in Telecom Expense Management Market, By Offering, 2019-2028 (USD Million)
TABLE 62 U.K. Others in Telecom Expense Management Market, By Offering, 2019-2028 (USD Million)
TABLE 63 Germany Telecom Expense Management Market, By Offering, 2019-2028 (USD Million)
TABLE 64 Germany Solution in Telecom Expense Management Market, By Type, 2019-2028 (USD Million)
TABLE 65 Germany Services in Telecom Expense Management Market, By Type, 2019-2028 (USD Million)
TABLE 66 Germany Telecom Expense Management Market, By Service Delivery Mode, 2019-2028 (USD Million)
TABLE 67 Germany Telecom Expense Management Market, By Enterprise Size, 2019-2028 (USD Million)
TABLE 68 Germany Telecom Expense Management Market, By End Use, 2019-2028 (USD Million)
TABLE 69 Germany IT & Telecom in Telecom Expense Management Market, By Offering, 2019-2028 (USD Million)
TABLE 70 Germany BFSI in Telecom Expense Management Market, By Offering, 2019-2028 (USD Million)
TABLE 71 Germany Manufacturing in Telecom Expense Management Market, By Offering, 2019-2028 (USD Million)
TABLE 72 Germany Healthcare in Telecom Expense Management Market, By Offering, 2019-2028 (USD Million)
TABLE 73 Germany Transportation & Logistics in Telecom Expense Management Market, By Offering, 2019-2028 (USD Million)
TABLE 74 Germany Consumer Goods & Retail in Telecom Expense Management Market, By Offering, 2019-2028 (USD Million)
TABLE 75 Germany Energy & Power in Telecom Expense Management Market, By Offering, 2019-2028 (USD Million)
TABLE 76 Germany Media & Entertainment in Telecom Expense Management Market, By Offering, 2019-2028 (USD Million)
TABLE 77 Germany Others in Telecom Expense Management Market, By Offering, 2019-2028 (USD Million)
TABLE 78 FRANCE Telecom Expense Management Market, By Offering, 2019-2028 (USD Million)
TABLE 79 FRANCE Solution in Telecom Expense Management Market, By Type, 2019-2028 (USD Million)
TABLE 80 FRANCE Services in Telecom Expense Management Market, By Type, 2019-2028 (USD Million)
TABLE 81 FRANCE Telecom Expense Management Market, By Service Delivery Mode, 2019-2028 (USD Million)
TABLE 82 FRANCE Telecom Expense Management Market, By Enterprise Size, 2019-2028 (USD Million)
TABLE 83 FRANCE Telecom Expense Management Market, By End Use, 2019-2028 (USD Million)
TABLE 84 FRANCE IT & Telecom in Telecom Expense Management Market, By Offering, 2019-2028 (USD Million)
TABLE 85 FRANCE BFSI in Telecom Expense Management Market, By Offering, 2019-2028 (USD Million)
TABLE 86 FRANCE Manufacturing in Telecom Expense Management Market, By Offering, 2019-2028 (USD Million)
TABLE 87 FRANCE Healthcare in Telecom Expense Management Market, By Offering, 2019-2028 (USD Million)
TABLE 88 FRANCE Transportation & Logistics in Telecom Expense Management Market, By Offering, 2019-2028 (USD Million)
TABLE 89 FRANCE Consumer Goods & Retail in Telecom Expense Management Market, By Offering, 2019-2028 (USD Million)
TABLE 90 FRANCE Energy & Power in Telecom Expense Management Market, By Offering, 2019-2028 (USD Million)
TABLE 91 FRANCE Media & Entertainment in Telecom Expense Management Market, By Offering, 2019-2028 (USD Million)
TABLE 92 FRANCE Others in Telecom Expense Management Market, By Offering, 2019-2028 (USD Million)
TABLE 93 Italy Telecom Expense Management Market, By Offering, 2019-2028 (USD Million)
TABLE 94 Italy Solution in Telecom Expense Management Market, By Type, 2019-2028 (USD Million)
TABLE 95 Italy Services in Telecom Expense Management Market, By Type, 2019-2028 (USD Million)
TABLE 96 Italy Telecom Expense Management Market, By Service Delivery Mode, 2019-2028 (USD Million)
TABLE 97 Italy Telecom Expense Management Market, By Enterprise Size, 2019-2028 (USD Million)
TABLE 98 Italy Telecom Expense Management Market, By End Use, 2019-2028 (USD Million)
TABLE 99 Italy IT & Telecom in Telecom Expense Management Market, By Offering, 2019-2028 (USD Million)
TABLE 100 Italy BFSI in Telecom Expense Management Market, By Offering, 2019-2028 (USD Million)
TABLE 101 Italy Manufacturing in Telecom Expense Management Market, By Offering, 2019-2028 (USD Million)
TABLE 102 Italy Healthcare in Telecom Expense Management Market, By Offering, 2019-2028 (USD Million)
TABLE 103 Italy Transportation & Logistics in Telecom Expense Management Market, By Offering, 2019-2028 (USD Million)
TABLE 104 Italy Consumer Goods & Retail in Telecom Expense Management Market, By Offering, 2019-2028 (USD Million)
TABLE 105 Italy Energy & Power in Telecom Expense Management Market, By Offering, 2019-2028 (USD Million)
TABLE 106 Italy Media & Entertainment in Telecom Expense Management Market, By Offering, 2019-2028 (USD Million)
TABLE 107 Italy Others in Telecom Expense Management Market, By Offering, 2019-2028 (USD Million)
TABLE 108 Spain Telecom Expense Management Market, By Offering, 2019-2028 (USD Million)
TABLE 109 Spain Solution in Telecom Expense Management Market, By Type, 2019-2028 (USD Million)
TABLE 110 Spain Services in Telecom Expense Management Market, By Type, 2019-2028 (USD Million)
TABLE 111 Spain Telecom Expense Management Market, By Service Delivery Mode, 2019-2028 (USD Million)
TABLE 112 Spain Telecom Expense Management Market, By Enterprise Size, 2019-2028 (USD Million)
TABLE 113 Spain Telecom Expense Management Market, By End Use, 2019-2028 (USD Million)
TABLE 114 Spain IT & Telecom in Telecom Expense Management Market, By Offering, 2019-2028 (USD Million)
TABLE 115 Spain BFSI in Telecom Expense Management Market, By Offering, 2019-2028 (USD Million)
TABLE 116 Spain Manufacturing in Telecom Expense Management Market, By Offering, 2019-2028 (USD Million)
TABLE 117 Spain Healthcare in Telecom Expense Management Market, By Offering, 2019-2028 (USD Million)
TABLE 118 Spain Transportation & Logistics in Telecom Expense Management Market, By Offering, 2019-2028 (USD Million)
TABLE 119 Spain Consumer Goods & Retail in Telecom Expense Management Market, By Offering, 2019-2028 (USD Million)
TABLE 120 Spain Energy & Power in Telecom Expense Management Market, By Offering, 2019-2028 (USD Million)
TABLE 121 Spain Media & Entertainment in Telecom Expense Management Market, By Offering, 2019-2028 (USD Million)
TABLE 122 Spain Others in Telecom Expense Management Market, By Offering, 2019-2028 (USD Million)
TABLE 123 Russia Telecom Expense Management Market, By Offering, 2019-2028 (USD Million)
TABLE 124 Russia Solution in Telecom Expense Management Market, By Type, 2019-2028 (USD Million)
TABLE 125 Russia Services in Telecom Expense Management Market, By Type, 2019-2028 (USD Million)
TABLE 126 Russia Telecom Expense Management Market, By Service Delivery Mode, 2019-2028 (USD Million)
TABLE 127 Russia Telecom Expense Management Market, By Enterprise Size, 2019-2028 (USD Million)
TABLE 128 Russia Telecom Expense Management Market, By End Use, 2019-2028 (USD Million)
TABLE 129 Russia IT & Telecom in Telecom Expense Management Market, By Offering, 2019-2028 (USD Million)
TABLE 130 Russia BFSI in Telecom Expense Management Market, By Offering, 2019-2028 (USD Million)
TABLE 131 Russia Manufacturing in Telecom Expense Management Market, By Offering, 2019-2028 (USD Million)
TABLE 132 Russia Healthcare in Telecom Expense Management Market, By Offering, 2019-2028 (USD Million)
TABLE 133 Russia Transportation & Logistics in Telecom Expense Management Market, By Offering, 2019-2028 (USD Million)
TABLE 134 Russia Consumer Goods & Retail in Telecom Expense Management Market, By Offering, 2019-2028 (USD Million)
TABLE 135 Russia Energy & Power in Telecom Expense Management Market, By Offering, 2019-2028 (USD Million)
TABLE 136 Russia Media & Entertainment in Telecom Expense Management Market, By Offering, 2019-2028 (USD Million)
TABLE 137 Russia Others in Telecom Expense Management Market, By Offering, 2019-2028 (USD Million)
TABLE 138 Belgium Telecom Expense Management Market, By Offering, 2019-2028 (USD Million)
TABLE 139 Belgium Solution in Telecom Expense Management Market, By Type, 2019-2028 (USD Million)
TABLE 140 Belgium Services in Telecom Expense Management Market, By Type, 2019-2028 (USD Million)
TABLE 141 Belgium Telecom Expense Management Market, By Service Delivery Mode, 2019-2028 (USD Million)
TABLE 142 Belgium Telecom Expense Management Market, By Enterprise Size, 2019-2028 (USD Million)
TABLE 143 Belgium Telecom Expense Management Market, By End Use, 2019-2028 (USD Million)
TABLE 144 Belgium IT & Telecom in Telecom Expense Management Market, By Offering, 2019-2028 (USD Million)
TABLE 145 Belgium BFSI in Telecom Expense Management Market, By Offering, 2019-2028 (USD Million)
TABLE 146 Belgium Manufacturing in Telecom Expense Management Market, By Offering, 2019-2028 (USD Million)
TABLE 147 Belgium Healthcare in Telecom Expense Management Market, By Offering, 2019-2028 (USD Million)
TABLE 148 Belgium Transportation & Logistics in Telecom Expense Management Market, By Offering, 2019-2028 (USD Million)
TABLE 149 Belgium Consumer Goods & Retail in Telecom Expense Management Market, By Offering, 2019-2028 (USD Million)
TABLE 150 Belgium Energy & Power in Telecom Expense Management Market, By Offering, 2019-2028 (USD Million)
TABLE 151 Belgium Media & Entertainment in Telecom Expense Management Market, By Offering, 2019-2028 (USD Million)
TABLE 152 Belgium Others in Telecom Expense Management Market, By Offering, 2019-2028 (USD Million)
TABLE 153 Netherlands Telecom Expense Management Market, By Offering, 2019-2028 (USD Million)
TABLE 154 Netherlands Solution in Telecom Expense Management Market, By Type, 2019-2028 (USD Million)
TABLE 155 Netherlands Services in Telecom Expense Management Market, By Type, 2019-2028 (USD Million)
TABLE 156 Netherlands Telecom Expense Management Market, By Service Delivery Mode, 2019-2028 (USD Million)
TABLE 157 Netherlands Telecom Expense Management Market, By Enterprise Size, 2019-2028 (USD Million)
TABLE 158 Netherlands Telecom Expense Management Market, By End Use, 2019-2028 (USD Million)
TABLE 159 Netherlands IT & Telecom in Telecom Expense Management Market, By Offering, 2019-2028 (USD Million)
TABLE 160 Netherlands BFSI in Telecom Expense Management Market, By Offering, 2019-2028 (USD Million)
TABLE 161 Netherlands Manufacturing in Telecom Expense Management Market, By Offering, 2019-2028 (USD Million)
TABLE 162 Netherlands Healthcare in Telecom Expense Management Market, By Offering, 2019-2028 (USD Million)
TABLE 163 Netherlands Transportation & Logistics in Telecom Expense Management Market, By Offering, 2019-2028 (USD Million)
TABLE 164 Netherlands Consumer Goods & Retail in Telecom Expense Management Market, By Offering, 2019-2028 (USD Million)
TABLE 165 Netherlands Energy & Power in Telecom Expense Management Market, By Offering, 2019-2028 (USD Million)
TABLE 166 Netherlands Media & Entertainment in Telecom Expense Management Market, By Offering, 2019-2028 (USD Million)
TABLE 167 Netherlands Others in Telecom Expense Management Market, By Offering, 2019-2028 (USD Million)
TABLE 168 Switzerland Telecom Expense Management Market, By Offering, 2019-2028 (USD Million)
TABLE 169 Switzerland Solution in Telecom Expense Management Market, By Type, 2019-2028 (USD Million)
TABLE 170 Switzerland Services in Telecom Expense Management Market, By Type, 2019-2028 (USD Million)
TABLE 171 Switzerland Telecom Expense Management Market, By Service Delivery Mode, 2019-2028 (USD Million)
TABLE 172 Switzerland Telecom Expense Management Market, By Enterprise Size, 2019-2028 (USD Million)
TABLE 173 Switzerland Telecom Expense Management Market, By End Use, 2019-2028 (USD Million)
TABLE 174 Switzerland IT & Telecom in Telecom Expense Management Market, By Offering, 2019-2028 (USD Million)
TABLE 175 Switzerland BFSI in Telecom Expense Management Market, By Offering, 2019-2028 (USD Million)
TABLE 176 Switzerland Manufacturing in Telecom Expense Management Market, By Offering, 2019-2028 (USD Million)
TABLE 177 Switzerland Healthcare in Telecom Expense Management Market, By Offering, 2019-2028 (USD Million)
TABLE 178 Switzerland Transportation & Logistics in Telecom Expense Management Market, By Offering, 2019-2028 (USD Million)
TABLE 179 Switzerland Consumer Goods & Retail in Telecom Expense Management Market, By Offering, 2019-2028 (USD Million)
TABLE 180 Switzerland Energy & Power in Telecom Expense Management Market, By Offering, 2019-2028 (USD Million)
TABLE 181 Switzerland Media & Entertainment in Telecom Expense Management Market, By Offering, 2019-2028 (USD Million)
TABLE 182 Switzerland Others in Telecom Expense Management Market, By Offering, 2019-2028 (USD Million)
TABLE 183 Turkey Telecom Expense Management Market, By Offering, 2019-2028 (USD Million)
TABLE 184 Turkey Solution in Telecom Expense Management Market, By Type, 2019-2028 (USD Million)
TABLE 185 Turkey Services in Telecom Expense Management Market, By Type, 2019-2028 (USD Million)
TABLE 186 Turkey Telecom Expense Management Market, By Service Delivery Mode, 2019-2028 (USD Million)
TABLE 187 Turkey Telecom Expense Management Market, By Enterprise Size, 2019-2028 (USD Million)
TABLE 188 Turkey Telecom Expense Management Market, By End Use, 2019-2028 (USD Million)
TABLE 189 Turkey IT & Telecom in Telecom Expense Management Market, By Offering, 2019-2028 (USD Million)
TABLE 190 Turkey BFSI in Telecom Expense Management Market, By Offering, 2019-2028 (USD Million)
TABLE 191 Turkey Manufacturing in Telecom Expense Management Market, By Offering, 2019-2028 (USD Million)
TABLE 192 Turkey Healthcare in Telecom Expense Management Market, By Offering, 2019-2028 (USD Million)
TABLE 193 Turkey Transportation & Logistics in Telecom Expense Management Market, By Offering, 2019-2028 (USD Million)
TABLE 194 Turkey Consumer Goods & Retail in Telecom Expense Management Market, By Offering, 2019-2028 (USD Million)
TABLE 195 Turkey Energy & Power in Telecom Expense Management Market, By Offering, 2019-2028 (USD Million)
TABLE 196 Turkey Media & Entertainment in Telecom Expense Management Market, By Offering, 2019-2028 (USD Million)
TABLE 197 Turkey Others in Telecom Expense Management Market, By Offering, 2019-2028 (USD Million)
TABLE 198 Rest of Europe Telecom Expense Management Market, By Offering, 2019-2028 (USD Million)
Lista de figuras
FIGURE 1 Europe Telecom expense management Market: segmentation
FIGURE 2 Europe Telecom expense management Market: data triangulation
FIGURE 3 Europe Telecom expense management market: DROC ANALYSIS
FIGURE 4 Europe Telecom expense management Market: EUROPE VS REGIONAL MARKET ANALYSIS
FIGURE 5 Europe Telecom expense management Market: COMPANY RESEARCH ANALYSIS
FIGURE 6 Europe Telecom expense management Market: INTERVIEW DEMOGRAPHICS
FIGURE 7 Europe Telecom expense management Market: DBMR MARKET POSITION GRID
FIGURE 8 Europe Telecom expense management Market: vendor share analysis
FIGURE 9 Europe Telecom expense management Market: MARKET APPLICATION COVERAGE GRID
FIGURE 10 Europe Telecom expense management market: SEGMENTATION
FIGURE 11 Significant Cost reduction is EXPECTED TO DRIVE THE EUROPE TELECOM EXPENSE MANAGEMENT MARKET IN THE FORECAST PERIOD OF 2021 TO 2028
FIGURE 12 SERVICES segment is expected to account for the largest share of Europe Telecom expense management market in 2021 & 2028
FIGURE 13 DRIVERS, RESTRAINT, OPPORTUNITIES, AND CHALLENGES OF EUROPE telecom expense management MARKET
FIGURE 14 Europe telecom expense management market, By offering, 2020
FIGURE 15 Europe telecom expense management market, By service delivery mode, 2020
FIGURE 16 Europe telecom expense management market, By enterprise size, 2020
FIGURE 17 Europe telecom expense management market, By end user, 2020
FIGURE 18 EUROPE Telecom expense management MARKET: SNAPSHOT (2020)
FIGURE 19 EUROPE TELECOM EXPENSE MANAGEMENT MARKET: by Country (2020)
FIGURE 20 EUROPE Telecom expense management MARKET: by Country (2021 & 2028)
FIGURE 21 EUROPE Telecom expense management MARKET: by Country (2020 & 2028)
FIGURE 22 EUROPE Telecom expense management MARKET: by offering (2021-2028)
FIGURE 23 Europe Telecom expense management Market: company share 2020 (%)
Metodología de investigación
La recopilación de datos y el análisis del año base se realizan utilizando módulos de recopilación de datos con muestras de gran tamaño. La etapa incluye la obtención de información de mercado o datos relacionados a través de varias fuentes y estrategias. Incluye el examen y la planificación de todos los datos adquiridos del pasado con antelación. Asimismo, abarca el examen de las inconsistencias de información observadas en diferentes fuentes de información. Los datos de mercado se analizan y estiman utilizando modelos estadísticos y coherentes de mercado. Además, el análisis de la participación de mercado y el análisis de tendencias clave son los principales factores de éxito en el informe de mercado. Para obtener más información, solicite una llamada de un analista o envíe su consulta.
La metodología de investigación clave utilizada por el equipo de investigación de DBMR es la triangulación de datos, que implica la extracción de datos, el análisis del impacto de las variables de datos en el mercado y la validación primaria (experto en la industria). Los modelos de datos incluyen cuadrícula de posicionamiento de proveedores, análisis de línea de tiempo de mercado, descripción general y guía del mercado, cuadrícula de posicionamiento de la empresa, análisis de patentes, análisis de precios, análisis de participación de mercado de la empresa, estándares de medición, análisis global versus regional y de participación de proveedores. Para obtener más información sobre la metodología de investigación, envíe una consulta para hablar con nuestros expertos de la industria.
Personalización disponible
Data Bridge Market Research es líder en investigación formativa avanzada. Nos enorgullecemos de brindar servicios a nuestros clientes existentes y nuevos con datos y análisis que coinciden y se adaptan a sus objetivos. El informe se puede personalizar para incluir análisis de tendencias de precios de marcas objetivo, comprensión del mercado de países adicionales (solicite la lista de países), datos de resultados de ensayos clínicos, revisión de literatura, análisis de mercado renovado y base de productos. El análisis de mercado de competidores objetivo se puede analizar desde análisis basados en tecnología hasta estrategias de cartera de mercado. Podemos agregar tantos competidores sobre los que necesite datos en el formato y estilo de datos que esté buscando. Nuestro equipo de analistas también puede proporcionarle datos en archivos de Excel sin procesar, tablas dinámicas (libro de datos) o puede ayudarlo a crear presentaciones a partir de los conjuntos de datos disponibles en el informe.

