

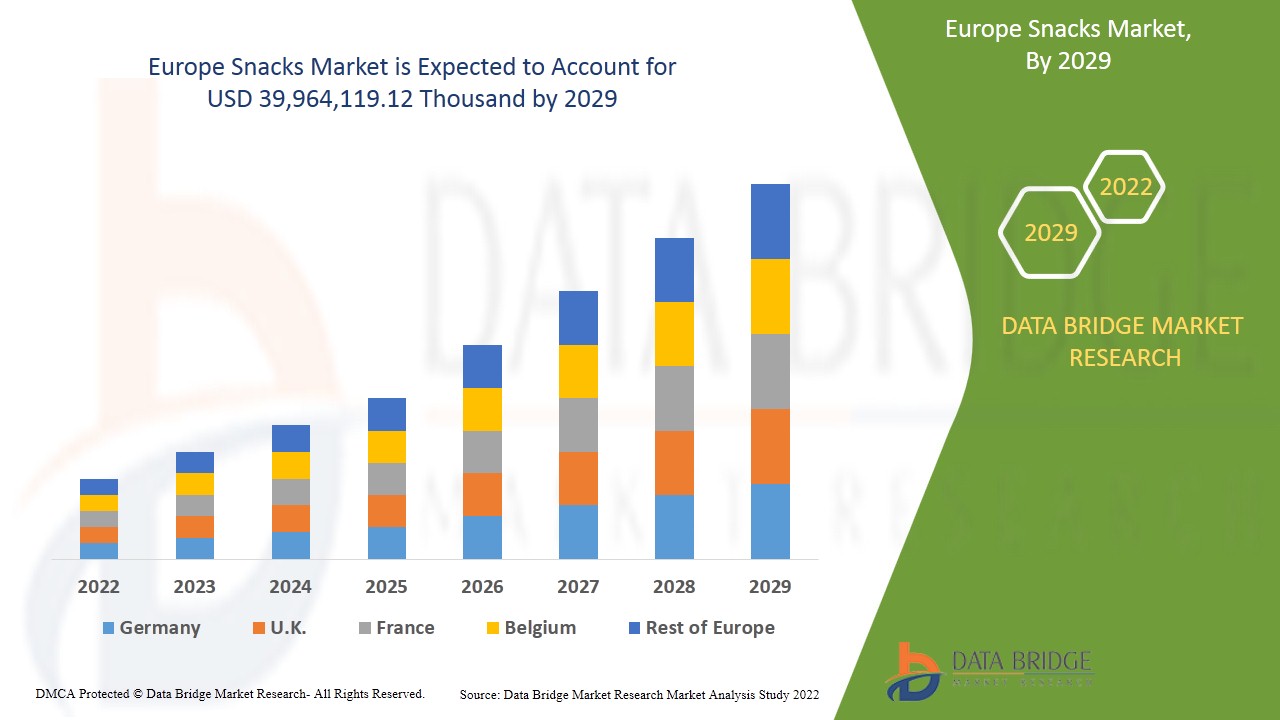
Europe Snacks Market
Tamaño del mercado en miles de millones de dólares
Tasa de crecimiento anual compuesta (CAGR) :
% 
 USD
28.22 Billion
USD
46.38 Billion
2024
2032
USD
28.22 Billion
USD
46.38 Billion
2024
2032
| 2025 –2032 | |
| USD 28.22 Billion | |
| USD 46.38 Billion | |
| % | |
Segmentación del mercado de snacks en Europa por tipo de producto (patatas fritas, nachos, pretzels, tortillas, galletas, palomitas de maíz listas para comer, otros (hojuelas, papas fritas, rizos y crujientes)), categoría de producto (snacks normales, snacks a base de queso), sabor (normal/estándar, de un solo sabor, de sabores combinados), naturaleza (orgánico, convencional), tamaño del envase (30 oz), precio (normal, premium) Marca (de marca, de marca blanca) Envase (bolsas, latas, cajas de cartón, otros) Usuario final (venta minorista/doméstico, sector de servicios de alimentación) Canal de distribución (minoristas con sede en tiendas, minoristas sin tiendas): tendencias de la industria y pronóstico hasta 2032
Análisis del mercado de snacks en Europa
Los snacks son alimentos listos para comer que suelen tener un alto contenido de aceite y saborizantes salados. Desde el punto de vista del procesamiento, se fabrican mediante una amplia gama de procesos. La categoría más simple, también denominada snacks de primera generación, comprende palomitas de maíz, cacahuetes, frutos secos, frutas deshidratadas y productos relacionados. La mayoría de los snacks pertenecen a la categoría de snacks de segunda generación, que incluye productos formados simples obtenidos después de la extrusión directa (chips de maíz, productos de maíz inflado o expandido, bolas y rizos) o mediante corte/laminado/formado, como las patatas fritas de fabricación regular, los chips de tortilla y los pretzels. Los snacks de tercera generación se producen a partir de pellets extruidos que normalmente se fríen y se aromatizan.
Se espera que el aumento del consumo de productos a base de queso y la creciente demanda de snacks saludables y prácticos para llevar impulsen el crecimiento del mercado europeo de snacks. Sin embargo, el aumento del coste de las materias primas puede limitar el crecimiento del mercado.
Factores como el cambio en los estilos de vida y los patrones de consumo de los consumidores están creando oportunidades para el mercado de snacks de Europa. Sin embargo, es probable que las estrictas normas y regulaciones para la comercialización de productos supongan un reto para el crecimiento del mercado durante el período de pronóstico.
Tamaño del mercado de snacks en Europa
El tamaño del mercado de snacks de Europa se valoró en USD 28,22 mil millones en 2024 y se proyecta que alcance los USD 46,38 mil millones para 2032, con una CAGR del 7,1% durante el período de pronóstico de 2025 a 2032.
Alcance del informe y segmentación del mercado
|
Atributos |
Snacks: Perspectivas clave del mercado |
|
Segmentación |
|
|
Países cubiertos |
Reino Unido, Francia, Rusia, Turquía, Italia, España, Alemania, Dinamarca, Suecia, Polonia, Países Bajos, Bélgica, Suiza y resto de Europa. |
|
Actores clave del mercado |
PepsiCo, Parle Products Private Limited, Kellogg's Company y General Mills. |
Definición del mercado de snacks en Europa
Los snacks son alimentos listos para comer que suelen tener un alto contenido de aceite y saborizantes salados. Desde el punto de vista del procesamiento, se fabrican mediante una amplia gama de procesos. La categoría más simple, también denominada snacks de primera generación, comprende palomitas de maíz, cacahuetes, frutos secos, frutas deshidratadas y productos relacionados. La mayoría de los snacks pertenecen a la categoría de snacks de segunda generación, que incluye productos formados simples obtenidos después de la extrusión directa (chips de maíz, productos de maíz inflado o expandido, bolas y rizos) o mediante corte/laminado/formado, como las patatas fritas de fabricación regular, los chips de tortilla y los pretzels. Los snacks de tercera generación se producen a partir de pellets extruidos que normalmente se fríen y se aromatizan.
Dinámica del mercado de snacks en Europa
Se espera que el aumento del consumo de productos a base de queso y la creciente demanda de snacks saludables y prácticos para llevar impulsen el crecimiento del mercado europeo de snacks. Sin embargo, el aumento del coste de las materias primas puede limitar el crecimiento del mercado.
Factores como el cambio en los estilos de vida y los patrones de consumo de los consumidores están creando oportunidades para el mercado de snacks de Europa. Sin embargo, es probable que las estrictas normas y regulaciones para la comercialización de productos supongan un reto para el crecimiento del mercado durante el período de pronóstico.
Alcance del mercado de snacks
El mercado europeo de snacks está segmentado en diez segmentos notables que se basan en el tipo de producto, la categoría del producto, el sabor, la naturaleza, el tamaño del envase, el precio, la marca, el envase, el usuario final y el canal de distribución. El crecimiento entre segmentos le ayuda a analizar nichos de crecimiento y estrategias para abordar el mercado y determinar sus áreas de aplicación principales y la diferencia en sus mercados objetivo.
Tipo de producto
- Patatas fritas
- Papas fritas
- Nachos
- Pretzels
- tortillas
- Galletas
- Galletas
- Palomitas de maíz rtas
- Otros (puffs, papas fritas, rizos y crujientes)
Categoría de producto
- Snacks regulares
- Snacks a base de queso
Sabor
- Regular
- Estándar
- De un solo sabor
- Sabor mezclado
Naturaleza
- Orgánico
- Convencional
Tamaño del embalaje
- <10 onzas
- 10 - 20 onzas
- 21 - 30 onzas
- > 30 onzas.
Precio
- Regular
- De primera calidad
Marca
- De marca
- Marca privada
Embalaje
- Bolsas
- Bolsas
- Latas
- Cajas de cartón
- Otros
Usuario final
- Minorista
- Familiar
- Sector de servicios de alimentación
Canal de distribución
- Minoristas basados en tiendas
- Minoristas sin tiendas físicas
Análisis regional del mercado de snacks
El mercado europeo de snacks está segmentado en diez segmentos notables que se basan en el tipo de producto, categoría de producto, sabor, naturaleza, tamaño del empaque, precio, marca, empaque, usuario final y canal de distribución.
Los países cubiertos en el informe de mercado son Reino Unido, Francia, Rusia, Turquía, Italia, España, Alemania, Dinamarca, Suecia, Polonia, Países Bajos, Bélgica, Suiza y el resto de Europa.
El Reino Unido está dominando el mercado europeo debido al aumento de la demanda de snacks funcionales en la región. Italia está dominando el mercado debido a la alta demanda de snacks entre la población. Sin embargo, Francia está dominando debido al aumento del consumo de productos a base de queso en el país.
La sección de países del informe también proporciona factores de impacto individuales en el mercado y cambios en la regulación en el mercado a nivel nacional que afectan las tendencias actuales y futuras del mercado. Los puntos de datos como nuevas ventas, ventas de reemplazo, demografía del país, leyes regulatorias y aranceles de importación y exportación son algunos de los principales indicadores utilizados para pronosticar el escenario del mercado para países individuales. Además, se considera la presencia y disponibilidad de marcas europeas y los desafíos que enfrentan debido a la competencia grande o escasa de las marcas locales y nacionales, el impacto de los canales de venta al proporcionar un análisis de pronóstico de los datos del país.
Cuota de mercado de snacks
El panorama competitivo del mercado de snacks en Europa ofrece detalles por competidor. Los detalles incluidos son una descripción general de la empresa, las finanzas de la empresa, los ingresos generados, el potencial de mercado, la inversión en investigación y desarrollo, las nuevas iniciativas de mercado, la presencia global, los sitios e instalaciones de producción, las fortalezas y debilidades de la empresa, el lanzamiento de productos, los procesos de ensayos clínicos, el análisis de la marca, las aprobaciones de productos, las patentes, la amplitud y la extensión del producto, el dominio de la aplicación y la curva de la línea de vida de la tecnología. Los puntos de datos anteriores proporcionados solo están relacionados con el enfoque de la empresa relacionado con el mercado de snacks en Europa.
Los líderes del mercado de snacks que operan en el mercado son:
- PepsiCo
- Productos Parle Private Limited
- Compañía Kellogg
- Molinos generales
Últimos avances en el mercado de snacks
- En noviembre de 2020, Mars, Incorporated lanzó una serie de productos de snacks bajo la categoría Mars Wrigley. Los productos de snacks incluyen Combos Cheddar Cheese Bacon. El nuevo producto ayudará a la empresa a expandir su segmento de snacks a base de queso y aumentar su base de consumidores en este segmento.
SKU-
Obtenga acceso en línea al informe sobre la primera nube de inteligencia de mercado del mundo

- Panel de análisis de datos interactivo
- Panel de análisis de empresas para oportunidades con alto potencial de crecimiento
- Acceso de analista de investigación para personalización y consultas
- Análisis de la competencia con panel interactivo
- Últimas noticias, actualizaciones y análisis de tendencias
- Aproveche el poder del análisis de referencia para un seguimiento integral de la competencia
Metodología de investigación
La recopilación de datos y el análisis del año base se realizan utilizando módulos de recopilación de datos con muestras de gran tamaño. La etapa incluye la obtención de información de mercado o datos relacionados a través de varias fuentes y estrategias. Incluye el examen y la planificación de todos los datos adquiridos del pasado con antelación. Asimismo, abarca el examen de las inconsistencias de información observadas en diferentes fuentes de información. Los datos de mercado se analizan y estiman utilizando modelos estadísticos y coherentes de mercado. Además, el análisis de la participación de mercado y el análisis de tendencias clave son los principales factores de éxito en el informe de mercado. Para obtener más información, solicite una llamada de un analista o envíe su consulta.
La metodología de investigación clave utilizada por el equipo de investigación de DBMR es la triangulación de datos, que implica la extracción de datos, el análisis del impacto de las variables de datos en el mercado y la validación primaria (experto en la industria). Los modelos de datos incluyen cuadrícula de posicionamiento de proveedores, análisis de línea de tiempo de mercado, descripción general y guía del mercado, cuadrícula de posicionamiento de la empresa, análisis de patentes, análisis de precios, análisis de participación de mercado de la empresa, estándares de medición, análisis global versus regional y de participación de proveedores. Para obtener más información sobre la metodología de investigación, envíe una consulta para hablar con nuestros expertos de la industria.
Personalización disponible
Data Bridge Market Research es líder en investigación formativa avanzada. Nos enorgullecemos de brindar servicios a nuestros clientes existentes y nuevos con datos y análisis que coinciden y se adaptan a sus objetivos. El informe se puede personalizar para incluir análisis de tendencias de precios de marcas objetivo, comprensión del mercado de países adicionales (solicite la lista de países), datos de resultados de ensayos clínicos, revisión de literatura, análisis de mercado renovado y base de productos. El análisis de mercado de competidores objetivo se puede analizar desde análisis basados en tecnología hasta estrategias de cartera de mercado. Podemos agregar tantos competidores sobre los que necesite datos en el formato y estilo de datos que esté buscando. Nuestro equipo de analistas también puede proporcionarle datos en archivos de Excel sin procesar, tablas dinámicas (libro de datos) o puede ayudarlo a crear presentaciones a partir de los conjuntos de datos disponibles en el informe.

