

Europe Snack Pellets Market, By Type (Crackers, Chips, Puffs, and Others), Form (Laminated, Die Faced, Gelatinized, Punched, Die Distance, Tridimensional and Two Dimensional), Shape (Round, Oval, Ring, Triangular, Square, Star, and Others), Ingredients (Potato, Corn, Rice, Tapioca, Multigrain, and Others), Processing Method (Greasy Snack Pellet and Non-Greasy Snack Pellet), Nature (Organic and Conventional), Technique (Single-Screw Extruder and Twin-Screw Extruder), Brand (Branded and Private Label), Flavor (Plain and Flavor), Application (Household and Commercial), Distribution Channel (Direct and Indirect) – Industry Trends and Forecast to 2029
Market Analysis and Insights
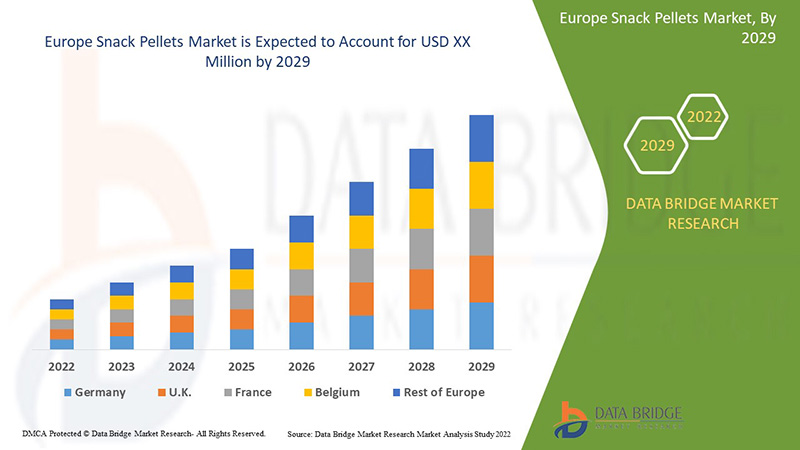
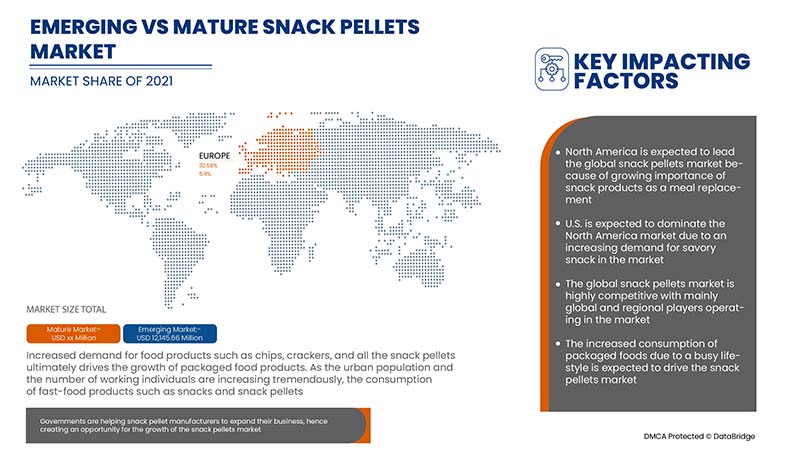
Europe snack pellets market is gaining significant growth due to the growing food & beverage industry and the rise in demand for a variety of flavors as well as different shaped packaged food products. Growing consumption of snack pellets or packaged food products due to hectic life schedules is also boosting the growth of the Europe snack pellets market. However, fluctuating prices of raw materials are expected to restrain the market growth of the snack pellets market during the forecast period.
Data Bridge Market Research analyses that the Europe snack pellets market will grow at a CAGR of 5.5% during the forecast period of 2022 to 2029.
|
Report Metric |
Details |
|
Forecast Period |
2022 to 2029 |
|
Base Year |
2021 |
|
Historic Year |
2020 (Customizable to 2019- 2015) |
|
Quantitative Units |
Revenue in USD Million |
|
Segments Covered |
By Type (Crackers, Chips, Puffs, and Others), Form (Laminated, Die Faced, Gelatinized, Punched, Die Distance, Tridimensional, and Two Dimensional), Shape (Round, Oval, Ring, Triangular, Square, Star, and Others), Ingredients (Potato, Corn, Rice, Tapioca, Multigrain, and Others), Processing Method (Greasy Snack Pellet and Non-Greasy Snack Pellet), Nature (Organic and Conventional), Technique (Single-Screw Extruder and Twin-Screw Extruder), Brand (Branded and Private Label), Flavor (Plain and Flavor), Application (Household and Commercial), Distribution Channel (Direct and Indirect) |
|
Countries Covered |
Germany, U.K., Italy, France, Spain, Russia, Turkey, Switzerland, Belgium, Netherlands, Denmark, Sweden, Poland, Rest of Europe |
|
Market Players Covered |
BACH SNACKS SAL, Calbee, Almounajed Food Industries, Chhajed Foods Pvt. Ltd, Fiorentini Alimentari SpA, Gustinos, Jednosc Sp. z o. o, Snack Creations Ltd., Kabir Foods, Le Caselle SPA, mafin, Universal Robina Corporation, JLM Global Foods, Limagrain – Ingrédients, Pol-Foods Sp. Z OO, Quality Pellets, Pellsnack Products GmbH, BFY BRANDS, matarile, Nutradia, The Lorenz Bahlsen Snack-World GmbH & Co KG Germany, TTK, Intersnack Group GmbH & Co. KG, Leng-d'Or, YUPI SAS, Bag Snacks, GUANGDONG YUSHENG FOOD INDUSTRIES CO.,LTD., VMF (Van Marcke Foods), Continental Snacks, Roger&Roger, entre otros. |
Definición de mercado
Los snack pellets son un ingrediente semiacabado, lo que significa que una vez producidos por los fabricantes, están listos para que los clientes los transformen en sus innovadores productos terminados. Los snack pellets son una forma versátil e innovadora de revolucionar la categoría de snacks. Existen muchos beneficios para que las marcas de snacks consideren los pellets dentro de su cartera. Se pueden utilizar bases nuevas y de tendencia hechas con aire caliente o sin aceite. Los snack pellets también pueden funcionar sin condimentos. Los snack pellets mantienen bien el sabor. Estos incluyen varios tipos, sabores y formas.
Dinámica del mercado de pellets para snacks en Europa
Conductores
- Aumentar la sustitución de comidas por snacks saludables
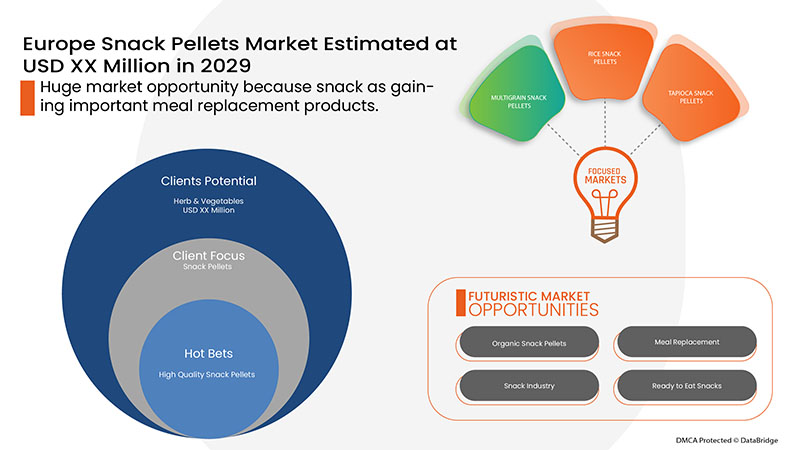
Un snack se define generalmente como cualquier alimento que se consume entre las comidas principales. Muchas personas comen al menos una vez durante el transcurso del día, y existen varias razones por las que los consumidores prefieren tomar snacks, ya que experimentan una caída en los niveles de energía que un pequeño bocado puede remediar. Además, esperan con ansias experimentar el sabor de ciertos snacks. Otra razón importante es el estilo de vida ajetreado de los consumidores, que les permite cambiar a los snacks como reemplazo de al menos una comida. Las personas prefieren los snacks saludables en forma de bolitas, ya que están llenos de nutrientes y ayudan a calmar el hambre de los consumidores.
Por lo tanto, se prevé que la demanda de pellets de snack en el mercado crezca debido al aumento de la población activa, el creciente ingreso disponible per cápita, el aumento del gasto per cápita en alimentos preparados, los cambios en las preferencias de gusto de las personas y el cambio en el estilo de vida entre los consumidores adinerados.
- Disponibilidad de varios sabores en patatas fritas y galletas.
La creciente demanda de sabrosas patatas fritas y galletas saladas entre los consumidores, junto con la creciente demanda de productos alimenticios convenientes, es una de las principales razones de la alta demanda de bocadillos salados como patatas fritas y galletas saladas, entre otros. Por lo tanto, los fabricantes satisfacen estas demandas de los consumidores lanzando constantemente nuevos sabores de patatas fritas y galletas saladas a base de cereales. Además, los fabricantes lo utilizan como estrategia de marketing y lanzan nuevos productos al mercado. El factor mencionado anteriormente impulsará la demanda del mercado.
Oportunidades
- La aparición de los snacks saludables en forma de pellet
Los snacks saludables ya no son una tendencia pasajera, sino que se han convertido en algo esencial para los consumidores debido a la creciente concienciación sobre la salud. Para satisfacer las fuertes expectativas y demandas de los consumidores, los fabricantes están desarrollando snacks saludables en forma de pellets con un perfil nutricional mejorado. Además, los consumidores están preocupados por el amplio espectro de problemas de salud relacionados con la inmunidad y diversas enfermedades. Por ello, los consumidores están optando por alimentos orgánicos y a base de cereales para mantener su salud. Por ello, los fabricantes de snacks en forma de pellets están lanzando snacks orgánicos y saludables en forma de pellets para atraer a los consumidores.
Restricciones/Desafíos
- Precios fluctuantes de las materias primas
A medida que aumenta el precio de las materias primas, afecta a toda la cadena de suministro, desde los fabricantes hasta el canal de distribución y la empresa de comercialización, y principalmente a los consumidores con bajos ingresos. Si aumentan los precios de las materias primas, también aumentarán los precios del producto terminado. Este es el principal factor restrictivo para el mercado de los snacks en pellets. Las materias primas necesarias para los snacks en pellets son las patatas, el maíz, el arroz, la tapioca, los cereales integrales y otros. Se espera que el aumento de los precios de estas materias primas obstaculice el crecimiento del mercado de snacks en pellets, ya que a los fabricantes de snacks les resulta difícil comprar materias primas como patatas, arroz, tapioca y otros en medio de la fluctuación de los precios.
Impacto posterior al COVID-19 en el mercado europeo de snacks en pellets
Después de la COVID-19, la demanda de snacks en pellets ha aumentado en la región de Europa debido a los cambios en los patrones de compra de los consumidores y a un cambio gradual hacia los productos alimenticios envasados. Debido a la interrupción de muchos mandatos y restricciones estrictas, los fabricantes y productores pueden satisfacer la demanda de snacks en pellets en la región. Además, los horarios de trabajo cada vez más ocupados permiten a los consumidores optar por snacks que puedan saciar su hambre e impulsarán el crecimiento del mercado.
La mayor demanda de pellets de snacks con diferentes sabores permite a los fabricantes lanzar pellets de snacks innovadores y con sabores, lo que en última instancia aumenta la demanda de pellets de snacks, lo que ha ayudado a que el mercado crezca.
Acontecimientos recientes
- En diciembre de 2019, PepsiCo, una empresa líder en la industria de alimentos y bebidas, anunció la adquisición de BFY BRANDS, una empresa privada que fabrica snacks en toda la región de Europa. Esta nueva adquisición ha aumentado la cartera de productos de la empresa y se espera que la ayude a obtener más ingresos en el futuro.
- En marzo de 2020, según noticias del sector alimentario, se esperaba que las ventas minoristas de las empresas que fabrican alimentos envasados, como snacks y pellets de snacks, en EE. UU. crecieran entre un 15% y un 30% en promedio entre marzo y mayo de 2020.
Panorama del mercado de pellets para snacks en Europa
El mercado europeo de pellets para snacks está segmentado en once segmentos notables según el tipo, la forma, la figura, los ingredientes, el método de procesamiento, la naturaleza, la técnica, la marca, el sabor, la aplicación y el canal de distribución. El crecimiento entre estos segmentos le ayudará a analizar los principales segmentos de crecimiento en las industrias y brindará a los usuarios una valiosa descripción general del mercado y conocimientos del mercado para tomar decisiones estratégicas para identificar las principales aplicaciones del mercado.
Tipo
- Galletas
- Papas fritas
- Bocanadas
- Otros
Según el tipo, el mercado europeo de snacks en pellets se segmenta en galletas, patatas fritas, bocaditos y otros.
Forma
- Laminado
- Morir cara a cara
- Gelatinizado
- Perforado
- La distancia
- Tridimensional
- Bidimensional
Sobre la base de la forma, el mercado europeo de pellets para snacks se segmenta en laminados, troquelados, gelatinizados, perforados, troquelados, tridimensionales y bidimensionales.
Forma
- Redondo
- Oval
- Anillo
- Triangular
- Cuadrado
- Estrella
- Otros
Sobre la base de la forma, el mercado europeo de pellets para snacks se segmenta en redondos, ovalados, anulares, triangulares, cuadrados, de estrella y otros.
Ingredientes
- Papa
- Maíz
- Arroz
- Tapioca
- Multigrano
- Otros
Sobre la base de los ingredientes, el mercado europeo de pellets de snack está segmentado en papa, maíz, arroz, tapioca, multicereales y otros.
Método de procesamiento
- Bolitas de bocadillos grasosos
- Snack en bolitas sin grasa
Sobre la base del método de procesamiento, el mercado europeo de pellets de snack se segmenta en pellets de snack grasosos y pellets de snack no grasosos.
Naturaleza
- Orgánico
- Convencional
En función de la naturaleza, el mercado europeo de pellets para snacks está segmentado en orgánico y convencional.
Técnica
- Extrusora de un solo tornillo
- Extrusora de doble husillo
Sobre la base de la técnica, el mercado europeo de pellets de snack está segmentado en extrusoras de un solo tornillo y extrusoras de doble tornillo.
Marca
- De marca
- Marca privada
Sobre la base de la marca, el mercado europeo de snacks en pellets se segmenta en marcas blancas y de marca.
Sabor
- Plano
- Sabor
En función del sabor, el mercado europeo de snacks en pellets se segmenta en simples y con sabor.
Solicitud
- Familiar
- Comercial
Sobre la base de la aplicación, el mercado europeo de pellets para snacks se segmenta en doméstico y comercial.
Canal de distribución
- Directo
- Indirecto
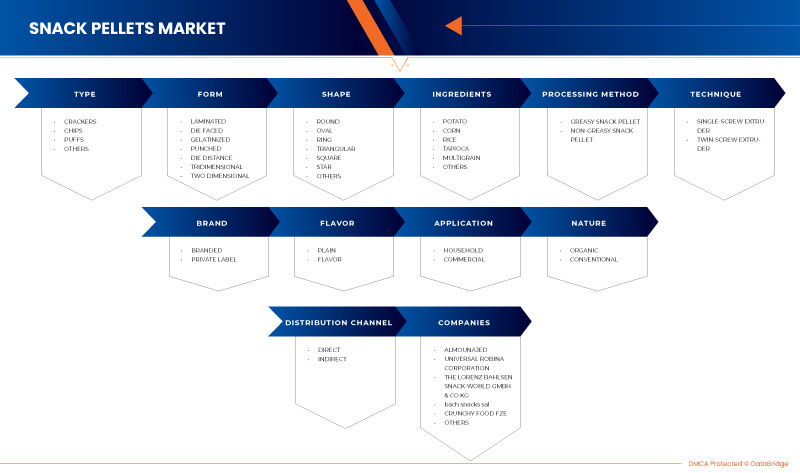
Sobre la base del canal de distribución, el mercado europeo de pellets de snack se segmenta en directo e indirecto.
Análisis y perspectivas regionales del mercado de pellets para snacks en Europa
Se analiza el mercado de pellets para snacks en Europa y se proporcionan información y tendencias sobre el tamaño del mercado según lo mencionado anteriormente.
Los países cubiertos en el informe de los mercados de pellets de snack de Europa son Alemania, Reino Unido, Italia, Francia, España, Rusia, Turquía, Suiza, Bélgica, Países Bajos, Dinamarca, Suecia, Polonia y el resto de Europa.
Se espera que el Reino Unido domine el mercado europeo de snacks en pellets debido a la creciente demanda de snacks en pellets para satisfacer la demanda de los consumidores.
La sección de países del informe también proporciona factores de impacto de mercado individuales y cambios en las regulaciones del mercado que afectan las tendencias actuales y futuras del mercado. Los puntos de datos, como las ventas de productos nuevos y de reemplazo, la demografía del país, la epidemiología de las enfermedades y los aranceles de importación y exportación, son algunos de los principales indicadores utilizados para pronosticar el escenario del mercado para países individuales. Además, se consideran la presencia y disponibilidad de fabricantes y los desafíos que enfrentan debido a la alta competencia de las marcas locales y nacionales y el impacto de los canales de venta al proporcionar un análisis de pronóstico de los datos del país.
Análisis del panorama competitivo y de la cuota de mercado de los snacks en pellets en Europa
El panorama competitivo del mercado de pellets para snacks en Europa ofrece información detallada de los competidores. Los detalles incluidos son una descripción general de la empresa, las finanzas de la empresa, los ingresos generados, el potencial de mercado, la inversión en investigación y desarrollo, las nuevas iniciativas de mercado, la presencia en Europa, los sitios e instalaciones de producción, las capacidades de producción, las fortalezas y debilidades de la empresa, el lanzamiento de productos, la amplitud y variedad de productos y el dominio de las aplicaciones. Los puntos de datos anteriores proporcionados solo están relacionados con el enfoque de las empresas en el mercado de pellets para snacks en Europa.
Algunos de los actores clave en el mercado europeo de snacks en pellets son BACH SNACKS SAL, Calbee, Almounajed Food Industries, Chhajed Foods Pvt. Ltd, Fiorentini Alimentari SpA, Gustinos, Jednosc Sp. z o. o, Snack Creations Ltd., Kabir Foods, Le Caselle SPA, mafin, Universal Robina Corporation, JLM Global Foods, Limagrain – Ingrédients, Pol-Foods Sp. Z OO, Quality Pellets, Pellsnack Products GmbH, BFY BRANDS, matarile, Nutradia, The Lorenz Bahlsen Snack-World GmbH & Co KG Germany, TTK, Intersnack Group GmbH & Co. KG, Leng-d'Or, YUPI SAS, Bag Snacks, GUANGDONG YUSHENG FOOD INDUSTRIES CO.,LTD., VMF (Van Marcke Foods) Continental Snacks, Roger&Roger, entre otros.
Metodología de la investigación
La recopilación de datos y el análisis del año base se realizan utilizando módulos de recopilación de datos con tamaños de muestra grandes. Los datos del mercado se analizan y estiman utilizando modelos estadísticos y coherentes del mercado. Además, el análisis de la participación de mercado y el análisis de tendencias clave son los principales factores de éxito en el informe de mercado. La metodología de investigación clave utilizada por el equipo de investigación de DBMR es la triangulación de datos que implica la extracción de datos, el análisis del impacto de las variables de datos en el mercado y la validación primaria (experto en la industria). Aparte de esto, los modelos de datos incluyen la cuadrícula de posicionamiento de proveedores, el análisis de la línea de tiempo del mercado, la descripción general y la guía del mercado, la cuadrícula de posicionamiento de la empresa, el análisis de la participación de mercado de la empresa, los estándares de medición, Europa frente a la región y el análisis de la participación de los proveedores. Solicite una llamada de un analista en caso de tener más consultas.
SKU-
Obtenga acceso en línea al informe sobre la primera nube de inteligencia de mercado del mundo

- Panel de análisis de datos interactivo
- Panel de análisis de empresas para oportunidades con alto potencial de crecimiento
- Acceso de analista de investigación para personalización y consultas
- Análisis de la competencia con panel interactivo
- Últimas noticias, actualizaciones y análisis de tendencias
- Aproveche el poder del análisis de referencia para un seguimiento integral de la competencia
Tabla de contenido
1 INTRODUCTION
1.1 OBJECTIVES OF THE STUDY
1.2 MARKET DEFINITION
1.3 OVERVIEW OF THE EUROPE SNACK PELLETS MARKET
1.4 LIMITATIONS
1.5 MARKETS COVERED
2 MARKET SEGMENTATION
2.1 MARKETS COVERED
2.2 GEOGRAPHICAL SCOPE
2.3 YEARS CONSIDERED FOR THE STUDY
2.4 CURRENCY AND PRICING
2.5 DBMR TRIPOD DATA VALIDATION MODEL
2.6 MULTIVARIATE MODELLING
2.7 TYPE LIFELINE CURVE
2.8 PRIMARY INTERVIEWS WITH KEY OPINION LEADERS
2.9 DBMR MARKET POSITION GRID
2.1 MARKET APPLICATION COVERAGE GRID
2.11 VENDOR SHARE ANALYSIS
2.12 SECONDARY SOURCES
2.13 ASSUMPTIONS
3 EXECUTIVE SUMMARY
4 PREMIUM INSIGHTS
4.1 BRAND COMPETITIVE ANALYSIS
4.2 LABELING & CLAIMS:
4.3 NEW PRODUCT LAUNCH STRATEGY
4.3.1 OVERVIEW
4.3.2 NUMBER OF PRODUCT LAUNCHES
4.3.2.1 LINE EXTENSION
4.3.2.2 NEW PACKAGING
4.3.2.3 RE-LAUNCHED
4.3.2.4 NEW FORMULATION
4.3.3 DIFFERENTIAL PRODUCT OFFERING
4.3.4 MEETING CONSUMER REQUIREMENT
4.3.5 PACKAGE DESIGNING
4.3.6 PRICING ANALYSIS
4.3.7 PRODUCT POSITIONING
4.3.8 CONCLUSION
4.4 FACTORS INFLUENCING THE PURCHASE
4.5 INDUSTRY TRENDS AND FUTURE PERSPECTIVE:
4.6 PROMOTIONAL ACTIVITIES
4.7 SHOPPING BEHAVIOUR AND DYNAMICS: EUROPE SNACKS PELLETS MARKET
4.7.1 RECOMMENDATIONS FROM FAMILY & FRIENDS-
4.7.2 RESEARCH
4.7.3 IMPULSIVE
4.7.4 ADVERTISEMENT:
4.7.4.1 TELEVISION ADVERTISEMENT
4.7.4.2 ONLINE ADVERTISEMENT
4.7.4.3 IN-STORE ADVERTISEMENT
4.7.4.4 OUTDOOR ADVERTISEMENT
4.8 SUPPLY CHAIN ANALYSIS
4.8.1 RAW MATERIAL PROCUREMENT
4.8.2 MANUFACTURING AND DISTRIBUTION
4.8.3 END USERS
4.9 VALUE CHAIN ANALYSIS
4.1 REGULATORY FRAMEWORK
5 MARKET OVERVIEW
5.1 DRIVERS
5.1.1 INCREASED CONSUMPTION OF PACKAGED FOODS DUE TO A BUSY LIFESTYLE
5.1.2 INCREASE IN DEMAND FOR SAVORY SNACKS
5.1.3 INCREASING REPLACEMENT OF MEALS WITH HEALTHY SNACKS
5.1.4 AVAILABILITY OF VARIOUS FLAVOURS IN CHIPS AND CRACKERS
5.2 RESTRAINTS
5.2.1 HEALTH PROBLEMS ASSOCIATED WITH THE HIGHER CONSUMPTION OF PROCESSED POTATO SNACKS
5.2.2 FLUCTUATING PRICES OF RAW MATERIALS
5.3 OPPORTUNITIES
5.3.1 EMERGENCE OF HEALTHY SNACK PELLETS
5.3.2 GOVERNMENT INITIATIVES AND INVESTMENT IN THE PROCESSED INDUSTRY OR SNACK PELLET INDUSTRY
5.3.3 AVAILABILITY OF A WIDE VARIETY OF FORMS, FLAVOURS, AND TASTES IN MULTIGRAIN SNACK PELLETS
5.4 CHALLENGES
5.4.1 HIGH COST ASSOCIATED WITH POTATO CHIPS MACHINES
5.4.2 SUPPLY CHAIN DISRUPTION DUE TO COVID-19
6 EUROPE SNACK PELLETS MARKET, BY TYPE
6.1 OVERVIEW
6.2 CHIPS
6.3 PUFFS
6.4 CRACKERS
6.5 OTHERS
7 EUROPE SNACK PELLETS MARKET, BY FORM
7.1 OVERVIEW
7.2 TRIDIMENSIONAL
7.3 TWO DIMENSIONAL
7.4 LAMINATED
7.5 DIE DISTANCE
7.6 GELATINIZED
7.7 DIE FACED
7.8 PUNCHED
8 EUROPE SNACK PELLETS MARKET, BY BRAND
8.1 OVERVIEW
8.2 BRANDED
8.3 PRIVATE LABEL
9 EUROPE SNACK PELLETS MARKET, BY APPLICATION
9.1 OVERVIEW
9.2 COMMERCIAL
9.3 HOUSEHOLD
10 EUROPE SNACK PELLETS MARKET, BY PROCESSING METHOD
10.1 OVERVIEW
10.2 REASY SNACK PELLET
10.3 NON-GREASY SNACK PELLET
10.3.1 HOT AIR BAKING
10.3.2 REGULAR BAKED OR ROASTED
11 EUROPE SNACK PELLETS MARKET, BY NATURE
11.1 OVERVIEW
11.2 CONVENTIONAL
11.3 ORGANIC
12 EUROPE SNACK PELLETS MARKET, BY FLAVOR
12.1 OVERVIEW
12.2 FLAVOR
12.2.1 TOMATO
12.2.2 BBQ
12.2.3 CHEESE
12.2.4 CHOCOLATE
12.2.5 CARAMELIZED
12.2.6 HONEY
12.2.7 HERB
12.2.8 BLACK PEPPER
12.2.9 SALSA
12.2.10 CHILE
12.2.11 LEMON
12.2.12 MINT
12.2.13 JALAPENOS
12.2.14 GARLIC
12.2.15 CHIPOTLE
12.2.16 OTHERS
12.3 PLAIN
13 EUROPE SNACK PELLETS MARKET, BY DISTRIBUTION CHANNEL
13.1 OVERVIEW
13.2 INDIRECT
13.2.1 STORE-BASED RETAILING
13.2.1.1 CONVENIENCE STORES
13.2.1.2 SUPERMARKETS/HYPERMARKETS
13.2.1.3 SPECIALTY STORES
13.2.1.4 WHOLESALERS
13.2.1.5 GROCERY STORES
13.2.1.6 OTHERS
13.2.2 NON-STORE RETAILING
13.2.2.1 ONLINE RETAILERS
13.2.2.2 VENDING MACHINE
13.3 DIRECT
14 EUROPE SNACK PELLETS MARKET, BY TECHNIQUE
14.1 OVERVIEW
14.2 SINGLE-SCREW EXTRUDER
14.3 TWIN-SCREW EXTRUDER
15 EUROPE SNACK PELLETS MARKET, BY SHAPE
15.1 OVERVIEW
15.2 OVAL
15.3 ROUND
15.4 SQUARE
15.5 RING
15.6 TRIANGULAR
15.7 STAR
15.8 OTHERS
16 EUROPE SNACK PELLETS MARKET, BY INGREDIENTS
16.1 OVERVIEW
16.2 MULTIGRAIN
16.3 POTATO
16.4 CORN
16.5 RICE
16.6 TAPIOCO
16.7 OTHERS
17 EUROPE SNACKS PELLETS MARKET, BY REGION
17.1 EUROPE
17.1.1 U.K.
17.1.2 GERMANY
17.1.3 FRANCE
17.1.4 ITALY
17.1.5 SPAIN
17.1.6 NETHERLANDS
17.1.7 BELGIUM
17.1.8 SWEDEN
17.1.9 DENMARK
17.1.10 POLAND
17.1.11 RUSSIA
17.1.12 SWITZERLAND
17.1.13 TURKEY
17.1.14 REST OF EUROPE
18 EUROPE SNACK PELLETS MARKET: COMPANY LANDSCAPE
18.1 COMPANY SHARE ANALYSIS: EUROPE
19 SWOT ANALYSIS
20 COMPANY PROFILE
20.1 INTERSNACK GROUP GMBH & CO. KG
20.1.1 COMPANY SNAPSHOT
20.1.2 COMPANY SHARE ANALYSIS
20.1.3 PRODUCT PORTFOLIO
20.1.4 RECENT DEVELOPMENT
20.2 THE LORENZ BAHLSEN SNACK-WORLD GMBH & CO KG GERMANY
20.2.1 COMPANY SNAPSHOT
20.2.2 COMPANY SHARE ANALYSIS
20.2.3 PRODUCT PORTFOLIO
20.2.4 RECENT DEVELOPMENT
20.3 BFY BRANDS
20.3.1 COMPANY SNAPSHOT
20.3.2 COMPANY SHARE ANALYSIS
20.3.3 PRODUCT PORTFOLIO
20.3.4 RECENT DEVELOPMENTS
20.4 MAFIN
20.4.1 COMPANY SANPSHOT
20.4.2 COMPANY SHARE ANALYSIS
20.4.3 PRODUCT PORTFOLIO
20.4.4 RECENT DEVELOPMENTS
20.5 PRODUCTOS ALIMENTICIOS LA MODERNA S.A. DE C.V.
20.5.1 COMPANY SANPSHOT
20.5.2 COMPANY SHARE ANALYSIS
20.5.3 PRODUCT PORTFOLIO
20.5.4 RECENT DEVELOPMENTS
20.6 AKKEL GROUP.
20.6.1 COMPANY SANPSHOT
20.6.2 PRODUCT PORTFOLIO
20.6.3 RECENT DEVELOPMENTS
20.7 ALMOUNAJED FOOD INDUSTRIES
1.7.1 COMPANY SNAPSHOT 241
20.7.1 PRODUCT PORTFOLIO
20.7.2 RECENT DEVELOPMENT
20.8 AL-QASRAWI
20.8.1 COMPANY SNAPSHOT
20.8.2 PRODUCT PORTFOLIO
20.8.3 RECENT DEVELOPMENT
20.9 ATTAYBAT
20.9.1 COMPANY SNAPSHOT
20.9.2 PRODUCT PORTFOLIO
20.9.3 RECENT DEVELOPMENT
20.1 BACH SNACKS SAL
20.10.1 COMPANY SNAPSHOT
20.10.2 PRODUCT PORTFOLIO
20.10.3 RECENT DEVELOPMENT
20.11 BAG SNACKS
20.11.1 COMPANY SNAPSHOT
20.11.2 PRODUCT PORTFOLIO
20.11.3 RECENT DEVELOPMENT
20.12 CALBEE
20.12.1 COMPANY SNAPSHOT
20.12.2 REVENUE ANALYSIS
20.12.3 PRODUCT PORTFOLIO
20.12.4 RECENT DEVELOPMENTS
20.13 CHHAJED FOODS PVT. LTD
20.13.1 COMPANY SANPSHOT
20.13.2 PRODUCT PORTFOLIO
20.13.3 RECENT DEVELOPMENTS
20.14 CRUNCHY FOOD FZE
20.14.1 COMPANY SNAPSHOT
20.14.2 PRODUCT PORTFOLIO
20.14.3 RECENT DEVELOPMENT
20.15 DALMAZA FOOD INDUSTRIES CO. (DAFICO)
20.15.1 COMPANY SNAPSHOT
20.15.2 PRODUCT PORTFOLIO
20.15.3 RECENT DEVELOPMENT
20.16 FIORENTINI ALIMENTARI S.P.A.
20.16.1 COMPANY SANPSHOT
20.16.2 PRODUCT PORTFOLIO
20.16.3 RECENT DEVELOPMENTS
20.17 GUSTINOS
20.17.1 COMPANY SANPSHOT
20.17.2 PRODUCT PORTFOLIO
20.17.3 RECENT DEVELOPMENTS
20.18 J.R. SHORT SNACK PRODUCTS
20.18.1 COMPANY SNAPSHOT
20.18.2 PRODUCT PORTFOLIO
20.18.3 RECENT DEVELOPMENT
20.19 JEDNOŚĆ SP. Z O. O
20.19.1 COMPANY SANPSHOT
20.19.2 PRODUCT PORTFOLIO
20.19.3 RECENT DEVELOPMENTS
20.2 JLM EUROPE FOODS
20.20.1 COMPANY SNAPSHOT
20.20.2 PRODUCT PORTFOLIO
20.20.3 RECENT DEVELOPMENT
20.21 JOPELLETS
20.21.1 COMPANY SNAPSHOT
20.21.2 PRODUCT PORTFOLIO
20.21.3 RECENT UPDATE
20.22 KABIR FOODS
20.22.1 COMPANY SNAPSHOT
20.22.2 PRODUCT PORTFOLIO
20.22.3 RECENT DEVELOPMENT
20.23 LC AMERICA, INC.
20.23.1 COMPANY SNAPSHOT
20.23.2 PRODUCT PORTFOLIO
20.23.3 RECENT DEVELOPMENT
20.24 LE CASELLE SPA
20.24.1 COMPANY SANPSHOT
20.24.2 PRODUCT PORTFOLIO
20.24.3 RECENT DEVELOPMENTS
20.25 LENG-D'OR
20.25.1 COMPANY SNAPSHOT
20.25.2 PRODUCT PORTFOLIO
20.25.3 RECENT DEVELOPMENT
20.26 LIMAGRAIN - INGRÉDIENTS
20.26.1 COMPANY SNAPSHOT
20.26.2 PRODUCT PORTFOLIO
20.26.3 RECENT DEVELOPMENT
20.27 MATARILE
20.27.1 COMPANY SNAPSHOT
20.27.2 PRODUCT PORTFOLIO
20.27.3 RECENT DEVELOPMENT
20.28 MCFILLS ENTERPRISES PVT. LTD.
20.28.1 COMPANY SNAPSHOT
20.28.2 PRODUCT PORTFOLIO
20.28.3 RECENT DEVELOPMENT
20.29 GRUPO MICHEL
20.29.1 COMPANY SNAPSHOT
20.29.2 PRODUCT PORTFOLIO
20.29.3 RECENT DEVELOPMENT
20.3 NOBLE AGRO FOOD PRODUCTS PRIVATE LIMITED
20.30.1 COMPANY SANPSHOT
20.30.2 PRODUCT PORTFOLIO
20.30.3 RECENT DEVELOPMENT
20.31 NUTRADIA
20.31.1 COMPANY SNAPSHOT
20.31.2 PRODUCT PORTFOLIO
20.31.3 RECENT DEVELOPMENT
20.32 ORIENTAL FOOD INDUSTRIES SDN. BHD.
20.32.1 COMPANY SANPSHOT
20.32.2 REVENUE ANALYSIS
20.32.3 PRODUCT PORTFOLIO
20.32.4 RECENT DEVELOPMENTS
20.33 PALMEX
20.33.1 COMPANY SANPSHOT
20.33.2 PRODUCT PORTFOLIO
20.33.3 RECENT DEVELOPMENTS
20.34 PELLSNACK PRODUCTS GMBH
20.34.1 COMPANY SNAPSHOT
20.34.2 PRODUCT PORTFOLIO
20.34.3 RECENT DEVELOPMENT
20.35 POL-FOODS SP. Z O.O.
20.35.1 COMPANY SNAPSHOT
20.35.2 PRODUCT PORTFOLIO
20.35.3 RECENT DEVELOPMENT
20.36 POPCHIPS
20.36.1 COMPANY SNAPSHOT
20.36.2 PRODUCT PORTFOLIO
20.36.3 RECENT UPDATE
20.37 QUALITY PELLETS
20.37.1 COMPANY SNAPSHOT
20.37.2 PRODUCT PORTFOLIO
20.37.3 RECENT DEVELOPMENT
20.38 ROGER&ROGER
20.38.1 COMPANY SANPSHOT
20.38.2 PRODUCT PORTFOLIO
20.38.3 RECENT DEVELOPMENTS
20.39 GUANGDONG YUSHENG FOOD INDUSTRIES CO., LTD.
20.39.1 COMPANY SNAPSHOT
20.39.2 PRODUCT PORTFOLIO
20.39.3 RECENT DEVELOPMENT
20.4 SIBELL
20.40.1 COMPANY SNAPSHOT
20.40.2 PRODUCT PORTFOLIO
20.40.3 RECENT DEVELOPMENTS
20.41 SNACK CREATIONS LTD.
20.41.1 COMPANY SANPSHOT
20.41.2 PRODUCT PORTFOLIO
20.41.3 RECENT DEVELOPMENTS
20.42 SNACKLETS
20.43 SOLINO GROUP
20.43.1 COMPANY SNAPSHOT
20.43.2 PRODUCT PORTFOLIO
20.43.3 RECENT DEVELOPMENT
20.44 TTK
20.44.1 COMPANY SNAPSHOT
20.44.2 REVENUE ANALYSIS
20.44.3 PRODUCT PORTFOLIO
20.44.4 RECENT DEVELOPMENT
20.45 UNIVERSAL ROBINA CORPORATION
20.45.1 COMPANY SNAPSHOT
20.45.2 REVENUE ANALYSIS
20.45.3 PRODUCT PORTFOLIO
20.45.4 RECENT DEVELOPMENTS
20.46 V.AL.IN. SRL
20.46.1 COMPANY SNAPSHOT
20.46.2 PRODUCT PORTFOLIO
20.46.3 RECENT DEVELOPMENT
20.47 VIJAY INDUSTRIES
20.47.1 COMPANY SNAPSHOT
20.47.2 PRODUCT PORTFOLIO
20.47.3 RECENT DEVELOPMENT
20.48 VMF (VAN MARCKE FOODS) CONTINENTAL SNACKS
20.48.1 COMPANY SNAPSHOT
20.48.2 PRODUCT PORTFOLIO
20.48.3 RECENT DEVELOPMENT
20.49 YUPI SAS
20.49.1 COMPANY SNAPSHOT
20.49.2 PRODUCT PORTFOLIO
20.49.3 RECENT DEVELOPMENT
21 QUESTIONNAIRE
22 RELATED REPORTS
Lista de Tablas
TABLE 1 NUTRITIONAL BENEFITS OF HEALTHY SNACK PELLETS:
TABLE 2 FLAVORS AND INGREDIENTS OF MULTIGRAIN PELLETS
TABLE 3 EUROPE SNACK PELLETS MARKET, BY TYPE, 2020-2029 (USD MILLION)
TABLE 4 EUROPE CHIPS IN SNACK PELLETS MARKET, BY REGION, 2020-2029 (USD MILLION)
TABLE 5 EUROPE PUFFS IN SNACK PELLETS MARKET, BY REGION, 2020-2029 (USD MILLION)
TABLE 6 EUROPE CRACKERS IN SNACK PELLETS MARKET, BY REGION, 2020-2029 (USD MILLION)
TABLE 7 EUROPE OTHERS IN SNACK PELLETS MARKET, BY REGION, 2020-2029 (USD MILLION)
TABLE 8 EUROPE SNACK PELLETS MARKET, BY FORM, 2020-2029 (USD MILLION)
TABLE 9 EUROPE TRIDIMENSIONAL IN SNACK PELLETS MARKET, BY REGION, 2020-2029 (USD MILLION)
TABLE 10 EUROPE TWO DIMENSIONAL IN SNACK PELLETS MARKET, BY REGION, 2020-2029 (USD MILLION)
TABLE 11 EUROPE LAMINATED IN SNACK PELLETS MARKET, BY REGION, 2020-2029 (USD MILLION)
TABLE 12 EUROPE DIE DISTANCE IN EUROPE SNACK PELLETS MARKET, BY REGION, 2020-2029 (USD MILLION)
TABLE 13 EUROPE GELATINIZED IN SNACK PELLETS MARKET, BY REGION, 2020-2029 (USD MILLION)
TABLE 14 EUROPE DIE FACED IN SNACK PELLETS MARKET, BY REGION, 2020-2029 (USD MILLION)
TABLE 15 EUROPE PUNCHED IN SNACK PELLETS MARKET, BY REGION, 2020-2029 (USD MILLION)
NOTE: PERCENTAGE IN THE FIGURE REPRESENT CAGR OF THE SEGMENT 91
TABLE 16 EUROPE SNACK PELLETS MARKET, BY BRAND, 2020-2029 (USD MILLION)
TABLE 17 EUROPE BRANDED IN SNACK PELLETS MARKET, BY REGION, 2020-2029 (USD MILLION)
TABLE 18 EUROPE PRIVATE-LABEL IN SNACK PELLETS MARKET, BY REGION, 2020-2029 (USD MILLION)
NOTE: PERCENTAGE IN THE FIGURE REPRESENT CAGR OF THE SEGMENT 95
TABLE 19 EUROPE SNACK PELLETS MARKET, BY APPLICATION, 2020-2029 (USD MILLION)
TABLE 20 EUROPE COMMERCIAL IN EUROPE SNACK PELLETS MARKET, BY REGION, 2020-2029 (USD MILLION)
TABLE 21 EUROPE HOUSEHOLD IN EUROPE SNACK PELLETS MARKET, BY REGION, 2020-2029 (USD MILLION)
TABLE 22 EUROPE SNACK PELLETS MARKET, BY PROCESSING METHOD, 2020-2029 (USD MILLION)
TABLE 23 EUROPE GREASY SNACK PELLET IN SNACK PELLETS MARKET, BY REGION, 2020-2029 (USD MILLION)
TABLE 24 EUROPE NON-GREASY SNACK PELLET IN SNACK PELLETS MARKET, BY REGION, 2020-2029 (USD MILLION)
TABLE 25 EUROPE NON-GREASY SNACK PELLET IN SNACK PELLETS MARKET, BY PROCESSING METHOD, 2020-2029 (USD MILLION)
TABLE 26 EUROPE SNACK PELLETS MARKET, BY NATURE, 2020-2029 (USD MILLION)
TABLE 27 EUROPE CONVENTIONAL IN SNACK PELLETS MARKET, BY REGION, 2020-2029 (USD MILLION)
TABLE 28 EUROPE ORGANIC IN SNACK PELLETS MARKET, BY REGION, 2020-2029 (USD MILLION)
TABLE 29 EUROPE SNACK PELLETS MARKET, BY FLAVOR, 2020-2029 (USD MILLION)
TABLE 30 EUROPE FLAVOR IN SNACK PELLETS MARKET, BY REGION, 2020-2029 (USD MILLION)
TABLE 31 EUROPE FLAVOR IN SNACK PELLETS MARKET, BY FLAVOR, 2020-2029 (USD MILLION)
TABLE 32 EUROPE PLAIN IN SNACK PELLETS MARKET, BY REGION, 2020-2029 (USD MILLION)
TABLE 33 EUROPE SNACK PELLETS MARKET, BY DISTRIBUTION CHANNEL, 2020-2029 (USD MILLION)
TABLE 34 EUROPE INDIRECT IN SNACK PELLETS MARKET, BY REGION, 2020-2029 (USD MILLION)
TABLE 35 EUROPE INDIRECT IN SNACK PELLETS MARKET, BY DISTRIBUTION CHANNEL, 2020-2029 (USD MILLION)
TABLE 36 EUROPE STORE-BASED RETAILING IN SNACK PELLETS MARKET, BY DISTRIBUTION CHANNEL, 2020-2029 (USD MILLION)
TABLE 37 EUROPE NON-STORE-BASED RETAILING IN SNACK PELLETS MARKET, BY DISTRIBUTION CHANNEL, 2020-2029 (USD MILLION)
TABLE 38 EUROPE DIRECT IN SNACK PELLETS MARKET, BY REGION, 2020-2029 (USD MILLION)
TABLE 39 EUROPE SNACK PELLETS MARKET, BY TECHNIQUE, 2020-2029 (USD MILLION)
TABLE 40 EUROPE SINGLE-SCREW EXTRUDER IN SNACK PELLETS MARKET, BY REGION, 2020-2029 (USD MILLION)
TABLE 41 EUROPE TWIN-SCREW EXTRUDER IN SNACK PELLETS MARKET, BY REGION, 2020-2029 (USD MILLION)
TABLE 42 EUROPE SNACK PELLETS MARKET, BY SHAPE, 2020-2029 (USD MILLION)
TABLE 43 EUROPE OVAL IN SNACK PELLETS MARKET, BY REGION, 2020-2029 (USD MILLION)
TABLE 44 EUROPE ROUND IN SNACK PELLETS MARKET, BY REGION, 2020-2029 (USD MILLION)
TABLE 45 EUROPE SQUARE IN SNACK PELLETS MARKET, BY REGION, 2020-2029 (USD MILLION)
TABLE 46 EUROPE RING IN SNACK PELLETS MARKET, BY REGION, 2020-2029 (USD MILLION)
TABLE 47 EUROPE TRIANGULAR IN SNACK PELLETS MARKET, BY REGION, 2020-2029 (USD MILLION)
TABLE 48 EUROPE STAR IN SNACK PELLETS MARKET, BY REGION, 2020-2029 (USD MILLION)
TABLE 49 EUROPE OTHERS IN SNACK PELLETS MARKET, BY REGION, 2020-2029 (USD MILLION)
TABLE 50 EUROPE SNACK PELLETS MARKET, BY INGREDIENTS, 2020-2029 (USD MILLION)
TABLE 51 EUROPE MULTIGRAIN IN SNACK PELLETS MARKET, BY REGION, 2020-2029 (USD MILLION)
TABLE 52 EUROPE POTATO IN SNACK PELLETS MARKET, BY REGION, 2020-2029 (USD MILLION)
TABLE 53 EUROPE CORN IN SNACK PELLETS MARKET, BY REGION, 2020-2029 (USD MILLION)
TABLE 54 EUROPE RICE IN SNACK PELLETS MARKET, BY REGION, 2020-2029 (USD MILLION)
TABLE 55 EUROPE TAPIOCO IN SNACK PELLETS MARKET, BY REGION, 2020-2029 (USD MILLION)
TABLE 56 EUROPE OTHERS IN SNACK PELLETS MARKET, BY REGION, 2020-2029 (USD MILLION)
TABLE 57 EUROPE SNACK PELLETS MARKET, BY COUNTRY, 2020-2029 (USD MILLION)
TABLE 58 EUROPE SNACK PELLETS MARKET, BY TYPE, 2020-2029 (USD MILLION)
TABLE 59 EUROPE SNACK PELLETS MARKET, BY FORM, 2020-2029 (USD MILLION)
TABLE 60 EUROPE SNACK PELLETS MARKET, BY SHAPE, 2020-2029 (USD MILLION)
TABLE 61 EUROPE SNACK PELLETS MARKET, BY INGREDIENTS, 2020-2029 (USD MILLION)
TABLE 62 EUROPE SNACK PELLETS MARKET, BY PROCESSING METHOD, 2020-2029 (USD MILLION)
TABLE 63 EUROPE NON-GREASY SNACK PELLET IN SNACK PELLETS MARKET, BY PROCESSING METHOD, 2020-2029 (USD MILLION)
TABLE 64 EUROPE SNACK PELLETS MARKET, BY NATURE, 2020-2029 (USD MILLION)
TABLE 65 EUROPE SNACK PELLETS MARKET, BY TECHNIQUE, 2020-2029 (USD MILLION)
TABLE 66 EUROPE SNACK PELLETS MARKET, BY BRAND, 2020-2029 (USD MILLION)
TABLE 67 EUROPE SNACK PELLETS MARKET, BY FLAVOR, 2020-2029 (USD MILLION)
TABLE 68 EUROPE FLAVOR IN SNACK PELLETS MARKET, BY FLAVOR, 2020-2029 (USD MILLION)
TABLE 69 EUROPE SNACK PELLETS MARKET, BY APPLICATION, 2020-2029 (USD MILLION)
TABLE 70 EUROPE SNACK PELLETS MARKET, BY DISTRIBUTION CHANNEL, 2020-2029 (USD MILLION)
TABLE 71 EUROPE INDIRECT IN SNACK PELLETS MARKET, BY DISTRIBUTION CHANNEL, 2020-2029 (USD MILLION)
TABLE 72 EUROPE STORE-BASED RETAILING IN SNACK PELLETS MARKET, BY DISTRIBUTION CHANNEL, 2020-2029 (USD MILLION)
TABLE 73 EUROPE NON-STORE RETAILING IN SNACK PELLETS MARKET, BY DISTRIBUTION CHANNEL, 2020-2029 (USD MILLION)
TABLE 74 U.K. SNACK PELLETS MARKET, BY TYPE, 2020-2029 (USD MILLION)
TABLE 75 U.K. SNACK PELLETS MARKET, BY FORM, 2020-2029 (USD MILLION)
TABLE 76 U.K. SNACK PELLETS MARKET, BY SHAPE, 2020-2029 (USD MILLION)
TABLE 77 U.K. SNACK PELLETS MARKET, BY INGREDIENTS, 2020-2029 (USD MILLION)
TABLE 78 U.K. SNACK PELLETS MARKET, BY PROCESSING METHOD, 2020-2029 (USD MILLION)
TABLE 79 U.K. NON-GREASY SNACK PELLET IN SNACK PELLETS MARKET, BY PROCESSING METHOD, 2020-2029 (USD MILLION)
TABLE 80 U.K. SNACK PELLETS MARKET, BY NATURE, 2020-2029 (USD MILLION)
TABLE 81 U.K. SNACK PELLETS MARKET, BY TECHNIQUE, 2020-2029 (USD MILLION)
TABLE 82 U.K. SNACK PELLETS MARKET, BY BRAND, 2020-2029 (USD MILLION)
TABLE 83 U.K. SNACK PELLETS MARKET, BY FLAVOR, 2020-2029 (USD MILLION)
TABLE 84 U.K. FLAVOR IN SNACK PELLETS MARKET, BY FLAVOR, 2020-2029 (USD MILLION)
TABLE 85 U.K. SNACK PELLETS MARKET, BY APPLICATION, 2020-2029 (USD MILLION)
TABLE 86 U.K. SNACK PELLETS MARKET, BY DISTRIBUTION CHANNEL, 2020-2029 (USD MILLION)
TABLE 87 U.K. INDIRECT IN SNACK PELLETS MARKET, BY DISTRIBUTION CHANNEL, 2020-2029 (USD MILLION)
TABLE 88 U.K. NON-STORE-BASED RETAILING IN SNACK PELLETS MARKET, BY DISTRIBUTION CHANNEL, 2020-2029 (USD MILLION)
TABLE 89 U.K. NON-STORE-BASED RETAILING IN SNACK PELLETS MARKET, BY DISTRIBUTION CHANNEL, 2020-2029 (USD MILLION)
TABLE 90 GERMANY SNACK PELLETS MARKET, BY TYPE, 2020-2029 (USD MILLION)
TABLE 91 GERMANY SNACK PELLETS MARKET, BY FORM, 2020-2029 (USD MILLION)
TABLE 92 GERMANY SNACK PELLETS MARKET, BY SHAPE, 2020-2029 (USD MILLION)
TABLE 93 GERMANY SNACK PELLETS MARKET, BY INGREDIENTS, 2020-2029 (USD MILLION)
TABLE 94 GERMANY SNACK PELLETS MARKET, BY PROCESSING METHOD, 2020-2029 (USD MILLION)
TABLE 95 GERMANY NON-GREASY SNACK PELLET IN SNACK PELLETS MARKET, BY PROCESSING METHOD, 2020-2029 (USD MILLION)
TABLE 96 GERMANY SNACK PELLETS MARKET, BY NATURE, 2020-2029 (USD MILLION)
TABLE 97 GERMANY SNACK PELLETS MARKET, BY TECHNIQUE, 2020-2029 (USD MILLION)
TABLE 98 GERMANY SNACK PELLETS MARKET, BY BRAND, 2020-2029 (USD MILLION)
TABLE 99 GERMANY SNACK PELLETS MARKET, BY FLAVOR, 2020-2029 (USD MILLION)
TABLE 100 GERMANY FLAVOR IN SNACK PELLETS MARKET, BY FLAVOR, 2020-2029 (USD MILLION)
TABLE 101 GERMANY SNACK PELLETS MARKET, BY APPLICATION, 2020-2029 (USD MILLION)
TABLE 102 GERMANY SNACK PELLETS MARKET, BY DISTRIBUTION CHANNEL, 2020-2029 (USD MILLION)
TABLE 103 GERMANY INDIRECT IN SNACK PELLETS MARKET, BY DISTRIBUTION CHANNEL, 2020-2029 (USD MILLION)
TABLE 104 GERMANY STORE-BASED RETAILING IN SNACK PELLETS MARKET, BY DISTRIBUTION CHANNEL, 2020-2029 (USD MILLION)
TABLE 105 GERMANY NON-STORE-BASED RETAILING IN SNACK PELLETS MARKET, BY DISTRIBUTION CHANNEL, 2020-2029 (USD MILLION)
TABLE 106 FRANCE SNACK PELLETS MARKET, BY TYPE, 2020-2029 (USD MILLION)
TABLE 107 FRANCE SNACK PELLETS MARKET, BY FORM, 2020-2029 (USD MILLION)
TABLE 108 FRANCE SNACK PELLETS MARKET, BY SHAPE, 2020-2029 (USD MILLION)
TABLE 109 FRANCE SNACK PELLETS MARKET, BY INGREDIENTS, 2020-2029 (USD MILLION)
TABLE 110 FRANCE SNACK PELLETS MARKET, BY PROCESSING METHOD, 2020-2029 (USD MILLION)
TABLE 111 FRANCE NON-GREASY SNACK PELLET IN SNACK PELLETS MARKET, BY PROCESSING METHOD, 2020-2029 (USD MILLION)
TABLE 112 FRANCE SNACK PELLETS MARKET, BY NATURE, 2020-2029 (USD MILLION)
TABLE 113 FRANCE SNACK PELLETS MARKET, BY TECHNIQUE, 2020-2029 (USD MILLION)
TABLE 114 FRANCE SNACK PELLETS MARKET, BY BRAND, 2020-2029 (USD MILLION)
TABLE 115 FRANCE SNACK PELLETS MARKET, BY FLAVOR, 2020-2029 (USD MILLION)
TABLE 116 FRANCE FLAVOR IN SNACK PELLETS MARKET, BY FLAVOR, 2020-2029 (USD MILLION)
TABLE 117 FRANCE SNACK PELLETS MARKET, BY APPLICATION, 2020-2029 (USD MILLION)
TABLE 118 FRANCE SNACK PELLETS MARKET, BY DISTRIBUTION CHANNEL, 2020-2029 (USD MILLION)
TABLE 119 FRANCE INDIRECT IN SNACK PELLETS MARKET, BY DISTRIBUTION CHANNEL, 2020-2029 (USD MILLION)
TABLE 120 FRANCE STORE-BASED RETAILING IN SNACK PELLETS MARKET, BY DISTRIBUTION CHANNEL, 2020-2029 (USD MILLION)
TABLE 121 FRANCE NON-STORE-BASED RETAILING IN SNACK PELLETS MARKET, BY DISTRIBUTION CHANNEL, 2020-2029 (USD MILLION)
TABLE 122 ITALY SNACK PELLETS MARKET, BY TYPE, 2020-2029 (USD MILLION)
TABLE 123 ITALY SNACK PELLETS MARKET, BY FORM, 2020-2029 (USD MILLION)
TABLE 124 ITALY SNACK PELLETS MARKET, BY SHAPE, 2020-2029 (USD MILLION)
TABLE 125 ITALY SNACK PELLETS MARKET, BY INGREDIENTS, 2020-2029 (USD MILLION)
TABLE 126 ITALY SNACK PELLETS MARKET, BY PROCESSING METHOD, 2020-2029 (USD MILLION)
TABLE 127 ITALY NON-GREASY SNACK PELLET IN SNACK PELLETS MARKET, BY PROCESSING METHOD, 2020-2029 (USD MILLION)
TABLE 128 ITALY SNACK PELLETS MARKET, BY NATURE, 2020-2029 (USD MILLION)
TABLE 129 ITALY SNACK PELLETS MARKET, BY TECHNIQUE, 2020-2029 (USD MILLION)
TABLE 130 ITALY SNACK PELLETS MARKET, BY BRAND, 2020-2029 (USD MILLION)
TABLE 131 ITALY SNACK PELLETS MARKET, BY FLAVOR, 2020-2029 (USD MILLION)
TABLE 132 ITALY FLAVOR IN SNACK PELLETS MARKET, BY FLAVOR, 2020-2029 (USD MILLION)
TABLE 133 ITALY SNACK PELLETS MARKET, BY APPLICATION, 2020-2029 (USD MILLION)
TABLE 134 ITALY SNACK PELLETS MARKET, BY DISTRIBUTION CHANNEL, 2020-2029 (USD MILLION)
TABLE 135 ITALY INDIRECT IN SNACK PELLETS MARKET, BY DISTRIBUTION CHANNEL, 2020-2029 (USD MILLION)
TABLE 136 ITALY STORE-BASED RETAILING IN SNACK PELLETS MARKET, BY DISTRIBUTION CHANNEL, 2020-2029 (USD MILLION)
TABLE 137 ITALY NON-STORE-BASED RETAILING IN SNACK PELLETS MARKET, BY DISTRIBUTION CHANNEL, 2020-2029 (USD MILLION)
TABLE 138 SPAIN SNACK PELLETS MARKET, BY TYPE, 2020-2029 (USD MILLION)
TABLE 139 SPAIN SNACK PELLETS MARKET, BY FORM, 2020-2029 (USD MILLION)
TABLE 140 SPAIN SNACK PELLETS MARKET, BY SHAPE, 2020-2029 (USD MILLION)
TABLE 141 SPAIN SNACK PELLETS MARKET, BY INGREDIENTS, 2020-2029 (USD MILLION)
TABLE 142 SPAIN SNACK PELLETS MARKET, BY PROCESSING METHOD, 2020-2029 (USD MILLION)
TABLE 143 SPAIN NON-GREASY SNACK PELLET IN SNACK PELLETS MARKET, BY PROCESSING METHOD, 2020-2029 (USD MILLION)
TABLE 144 SPAIN SNACK PELLETS MARKET, BY NATURE, 2020-2029 (USD MILLION)
TABLE 145 SPAIN SNACK PELLETS MARKET, BY TECHNIQUE, 2020-2029 (USD MILLION)
TABLE 146 SPAIN SNACK PELLETS MARKET, BY BRAND, 2020-2029 (USD MILLION)
TABLE 147 SPAIN SNACK PELLETS MARKET, BY FLAVOR, 2020-2029 (USD MILLION)
TABLE 148 SPAIN FLAVOR IN SNACK PELLETS MARKET, BY FLAVOR, 2020-2029 (USD MILLION)
TABLE 149 SPAIN SNACK PELLETS MARKET, BY APPLICATION, 2020-2029 (USD MILLION)
TABLE 150 SPAIN SNACK PELLETS MARKET, BY DISTRIBUTION CHANNEL, 2020-2029 (USD MILLION)
TABLE 151 SPAIN INDIRECT IN SNACK PELLETS MARKET, BY DISTRIBUTION CHANNEL, 2020-2029 (USD MILLION)
TABLE 152 SPAIN STORE-BASED RETAILING IN SNACK PELLETS MARKET, BY DISTRIBUTION CHANNEL, 2020-2029 (USD MILLION)
TABLE 153 SPAIN NON-STORE-BASED RETAILING IN SNACK PELLETS MARKET, BY DISTRIBUTION CHANNEL, 2020-2029 (USD MILLION)
TABLE 154 NETHERLANDS SNACK PELLETS MARKET, BY TYPE, 2020-2029 (USD MILLION)
TABLE 155 NETHERLANDS SNACK PELLETS MARKET, BY FORM, 2020-2029 (USD MILLION)
TABLE 156 NETHERLANDS SNACK PELLETS MARKET, BY SHAPE, 2020-2029 (USD MILLION)
TABLE 157 NETHERLANDS SNACK PELLETS MARKET, BY INGREDIENTS, 2020-2029 (USD MILLION)
TABLE 158 NETHERLANDS SNACK PELLETS MARKET, BY PROCESSING METHOD, 2020-2029 (USD MILLION)
TABLE 159 NETHERLANDS NON-GREASY SNACK PELLET IN SNACK PELLETS MARKET, BY PROCESSING METHOD, 2020-2029 (USD MILLION)
TABLE 160 NETHERLANDS SNACK PELLETS MARKET, BY NATURE, 2020-2029 (USD MILLION)
TABLE 161 NETHERLANDS SNACK PELLETS MARKET, BY TECHNIQUE, 2020-2029 (USD MILLION)
TABLE 162 NETHERLANDS SNACK PELLETS MARKET, BY BRAND, 2020-2029 (USD MILLION)
TABLE 163 NETHERLANDS SNACK PELLETS MARKET, BY FLAVOR, 2020-2029 (USD MILLION)
TABLE 164 NETHERLANDS FLAVOR IN SNACK PELLETS MARKET, BY FLAVOR, 2020-2029 (USD MILLION)
TABLE 165 NETHERLANDS SNACK PELLETS MARKET, BY APPLICATION, 2020-2029 (USD MILLION)
TABLE 166 NETHERLANDS SNACK PELLETS MARKET, BY DISTRIBUTION CHANNEL, 2020-2029 (USD MILLION)
TABLE 167 NETHERLANDS INDIRECT IN SNACK PELLETS MARKET, BY DISTRIBUTION CHANNEL, 2020-2029 (USD MILLION)
TABLE 168 NETHERLANDS STORE-BASED RETAILING IN SNACK PELLETS MARKET, BY DISTRIBUTION CHANNEL, 2020-2029 (USD MILLION)
TABLE 169 NETHERLANDS NON-STORE-BASED RETAILING IN SNACK PELLETS MARKET, BY DISTRIBUTION CHANNEL, 2020-2029 (USD MILLION)
TABLE 170 BELGIUM SNACK PELLETS MARKET, BY TYPE, 2020-2029 (USD MILLION)
TABLE 171 BELGIUM SNACK PELLETS MARKET, BY FORM, 2020-2029 (USD MILLION)
TABLE 172 BELGIUM SNACK PELLETS MARKET, BY SHAPE, 2020-2029 (USD MILLION)
TABLE 173 BELGIUM SNACK PELLETS MARKET, BY INGREDIENTS, 2020-2029 (USD MILLION)
TABLE 174 BELGIUM SNACK PELLETS MARKET, BY PROCESSING METHOD, 2020-2029 (USD MILLION)
TABLE 175 BELGIUM NON-GREASY SNACK PELLET IN SNACK PELLETS MARKET, BY PROCESSING METHOD, 2020-2029 (USD MILLION)
TABLE 176 BELGIUM SNACK PELLETS MARKET, BY NATURE, 2020-2029 (USD MILLION)
TABLE 177 BELGIUM SNACK PELLETS MARKET, BY TECHNIQUE, 2020-2029 (USD MILLION)
TABLE 178 BELGIUM SNACK PELLETS MARKET, BY BRAND, 2020-2029 (USD MILLION)
TABLE 179 BELGIUM SNACK PELLETS MARKET, BY FLAVOR, 2020-2029 (USD MILLION)
TABLE 180 BELGIUM FLAVOR IN SNACK PELLETS MARKET, BY FLAVOR, 2020-2029 (USD MILLION)
TABLE 181 BELGIUM SNACK PELLETS MARKET, BY APPLICATION, 2020-2029 (USD MILLION)
TABLE 182 BELGIUM SNACK PELLETS MARKET, BY DISTRIBUTION CHANNEL, 2020-2029 (USD MILLION)
TABLE 183 BELGIUM INDIRECT IN SNACK PELLETS MARKET, BY DISTRIBUTION CHANNEL, 2020-2029 (USD MILLION)
TABLE 184 BELGIUM STORE-BASED RETAILING IN SNACK PELLETS MARKET, BY DISTRIBUTION CHANNEL, 2020-2029 (USD MILLION)
TABLE 185 BELGIUM NON-STORE-BASED RETAILING IN SNACK PELLETS MARKET, BY DISTRIBUTION CHANNEL, 2020-2029 (USD MILLION)
TABLE 186 SWEDEN SNACK PELLETS MARKET, BY TYPE, 2020-2029 (USD MILLION)
TABLE 187 SWEDEN SNACK PELLETS MARKET, BY FORM, 2020-2029 (USD MILLION)
TABLE 188 SWEDEN SNACK PELLETS MARKET, BY SHAPE, 2020-2029 (USD MILLION)
TABLE 189 SWEDEN SNACK PELLETS MARKET, BY INGREDIENTS, 2020-2029 (USD MILLION)
TABLE 190 SWEDEN SNACK PELLETS MARKET, BY PROCESSING METHOD, 2020-2029 (USD MILLION)
TABLE 191 SWEDEN NON-GREASY SNACK PELLET IN SNACK PELLETS MARKET, BY PROCESSING METHOD, 2020-2029 (USD MILLION)
TABLE 192 SWEDEN SNACK PELLETS MARKET, BY NATURE, 2020-2029 (USD MILLION)
TABLE 193 SWEDEN SNACK PELLETS MARKET, BY TECHNIQUE, 2020-2029 (USD MILLION)
TABLE 194 SWEDEN SNACK PELLETS MARKET, BY BRAND, 2020-2029 (USD MILLION)
TABLE 195 SWEDEN SNACK PELLETS MARKET, BY FLAVOR, 2020-2029 (USD MILLION)
TABLE 196 SWEDEN FLAVOR IN SNACK PELLETS MARKET, BY FLAVOR, 2020-2029 (USD MILLION)
TABLE 197 SWEDEN SNACK PELLETS MARKET, BY APPLICATION, 2020-2029 (USD MILLION)
TABLE 198 SWEDEN SNACK PELLETS MARKET, BY DISTRIBUTION CHANNEL, 2020-2029 (USD MILLION)
TABLE 199 SWEDEN INDIRECT IN SNACK PELLETS MARKET, BY DISTRIBUTION CHANNEL, 2020-2029 (USD MILLION)
TABLE 200 SWEDEN STORE-BASED RETAILING IN SNACK PELLETS MARKET, BY DISTRIBUTION CHANNEL, 2020-2029 (USD MILLION)
TABLE 201 SWEDEN NON-STORE-BASED RETAILING IN SNACK PELLETS MARKET, BY DISTRIBUTION CHANNEL, 2020-2029 (USD MILLION)
TABLE 202 DENMARK SNACK PELLETS MARKET, BY TYPE, 2020-2029 (USD MILLION)
TABLE 203 DENMARK SNACK PELLETS MARKET, BY FORM, 2020-2029 (USD MILLION)
TABLE 204 DENMARK SNACK PELLETS MARKET, BY SHAPE, 2020-2029 (USD MILLION)
TABLE 205 DENMARK SNACK PELLETS MARKET, BY INGREDIENTS, 2020-2029 (USD MILLION)
TABLE 206 DENMARK SNACK PELLETS MARKET, BY PROCESSING METHOD, 2020-2029 (USD MILLION)
TABLE 207 DENMARK NON-GREASY SNACK PELLET IN SNACK PELLETS MARKET, BY PROCESSING METHOD, 2020-2029 (USD MILLION)
TABLE 208 DENMARK SNACK PELLETS MARKET, BY NATURE, 2020-2029 (USD MILLION)
TABLE 209 DENMARK SNACK PELLETS MARKET, BY TECHNIQUE, 2020-2029 (USD MILLION)
TABLE 210 DENMARK SNACK PELLETS MARKET, BY BRAND, 2020-2029 (USD MILLION)
TABLE 211 DENMARK SNACK PELLETS MARKET, BY FLAVOR, 2020-2029 (USD MILLION)
TABLE 212 DENMARK FLAVOR IN SNACK PELLETS MARKET, BY FLAVOR, 2020-2029 (USD MILLION)
TABLE 213 DENMARK SNACK PELLETS MARKET, BY APPLICATION, 2020-2029 (USD MILLION)
TABLE 214 DENMARK SNACK PELLETS MARKET, BY DISTRIBUTION CHANNEL, 2020-2029 (USD MILLION)
TABLE 215 DENMARK INDIRECT IN SNACK PELLETS MARKET, BY DISTRIBUTION CHANNEL, 2020-2029 (USD MILLION)
TABLE 216 DENMARK STORE-BASED RETAILING IN SNACK PELLETS MARKET, BY DISTRIBUTION CHANNEL, 2020-2029 (USD MILLION)
TABLE 217 DENMARK NON-STORE-BASED RETAILING IN SNACK PELLETS MARKET, BY DISTRIBUTION CHANNEL, 2020-2029 (USD MILLION)
TABLE 218 POLAND SNACK PELLETS MARKET, BY TYPE, 2020-2029 (USD MILLION)
TABLE 219 POLAND SNACK PELLETS MARKET, BY FORM, 2020-2029 (USD MILLION)
TABLE 220 POLAND SNACK PELLETS MARKET, BY SHAPE, 2020-2029 (USD MILLION)
TABLE 221 POLAND SNACK PELLETS MARKET, BY INGREDIENTS, 2020-2029 (USD MILLION)
TABLE 222 POLAND SNACK PELLETS MARKET, BY PROCESSING METHOD, 2020-2029 (USD MILLION)
TABLE 223 POLAND NON-GREASY SNACK PELLET IN SNACK PELLETS MARKET, BY PROCESSING METHOD, 2020-2029 (USD MILLION)
TABLE 224 POLAND SNACK PELLETS MARKET, BY NATURE, 2020-2029 (USD MILLION)
TABLE 225 POLAND SNACK PELLETS MARKET, BY TECHNIQUE, 2020-2029 (USD MILLION)
TABLE 226 POLAND SNACK PELLETS MARKET, BY BRAND, 2020-2029 (USD MILLION)
TABLE 227 POLAND SNACK PELLETS MARKET, BY FLAVOR, 2020-2029 (USD MILLION)
TABLE 228 POLAND FLAVOR IN SNACK PELLETS MARKET, BY FLAVOR, 2020-2029 (USD MILLION)
TABLE 229 POLAND SNACK PELLETS MARKET, BY APPLICATION, 2020-2029 (USD MILLION)
TABLE 230 POLAND SNACK PELLETS MARKET, BY DISTRIBUTION CHANNEL, 2020-2029 (USD MILLION)
TABLE 231 POLAND INDIRECT IN SNACK PELLETS MARKET, BY DISTRIBUTION CHANNEL, 2020-2029 (USD MILLION)
TABLE 232 POLAND STORE-BASED RETAILING IN SNACK PELLETS MARKET, BY DISTRIBUTION CHANNEL, 2020-2029 (USD MILLION)
TABLE 233 POLAND NON-STORE-BASED RETAILING IN SNACK PELLETS MARKET, BY DISTRIBUTION CHANNEL, 2020-2029 (USD MILLION)
TABLE 234 RUSSIA SNACK PELLETS MARKET, BY TYPE, 2020-2029 (USD MILLION)
TABLE 235 RUSSIA SNACK PELLETS MARKET, BY FORM, 2020-2029 (USD MILLION)
TABLE 236 RUSSIA SNACK PELLETS MARKET, BY SHAPE, 2020-2029 (USD MILLION)
TABLE 237 RUSSIA SNACK PELLETS MARKET, BY INGREDIENTS, 2020-2029 (USD MILLION)
TABLE 238 RUSSIA SNACK PELLETS MARKET, BY PROCESSING METHOD, 2020-2029 (USD MILLION)
TABLE 239 RUSSIA NON-GREASY SNACK PELLET IN SNACK PELLETS MARKET, BY PROCESSING METHOD, 2020-2029 (USD MILLION)
TABLE 240 RUSSIA SNACK PELLETS MARKET, BY NATURE, 2020-2029 (USD MILLION)
TABLE 241 RUSSIA SNACK PELLETS MARKET, BY TECHNIQUE, 2020-2029 (USD MILLION)
TABLE 242 RUSSIA SNACK PELLETS MARKET, BY BRAND, 2020-2029 (USD MILLION)
TABLE 243 RUSSIA SNACK PELLETS MARKET, BY FLAVOR, 2020-2029 (USD MILLION)
TABLE 244 RUSSIA FLAVOR IN SNACK PELLETS MARKET, BY FLAVOR, 2020-2029 (USD MILLION)
TABLE 245 RUSSIA SNACK PELLETS MARKET, BY APPLICATION, 2020-2029 (USD MILLION)
TABLE 246 RUSSIA SNACK PELLETS MARKET, BY DISTRIBUTION CHANNEL, 2020-2029 (USD MILLION)
TABLE 247 RUSSIA INDIRECT IN SNACK PELLETS MARKET, BY DISTRIBUTION CHANNEL, 2020-2029 (USD MILLION)
TABLE 248 RUSSIA STORE-BASED RETAILING IN SNACK PELLETS MARKET, BY DISTRIBUTION CHANNEL, 2020-2029 (USD MILLION)
TABLE 249 RUSSIA NON-STORE-BASED RETAILING IN SNACK PELLETS MARKET, BY DISTRIBUTION CHANNEL, 2020-2029 (USD MILLION)
TABLE 250 SWITZERLAND SNACK PELLETS MARKET, BY TYPE, 2020-2029 (USD MILLION)
TABLE 251 SWITZERLAND SNACK PELLETS MARKET, BY FORM, 2020-2029 (USD MILLION)
TABLE 252 SWITZERLAND SNACK PELLETS MARKET, BY SHAPE, 2020-2029 (USD MILLION)
TABLE 253 SWITZERLAND SNACK PELLETS MARKET, BY INGREDIENTS, 2020-2029 (USD MILLION)
TABLE 254 SWITZERLAND SNACK PELLETS MARKET, BY PROCESSING METHOD, 2020-2029 (USD MILLION)
TABLE 255 SWITZERLAND NON-GREASY SNACK PELLET IN SNACK PELLETS MARKET, BY PROCESSING METHOD, 2020-2029 (USD MILLION)
TABLE 256 SWITZERLAND SNACK PELLETS MARKET, BY NATURE, 2020-2029 (USD MILLION)
TABLE 257 SWITZERLAND SNACK PELLETS MARKET, BY TECHNIQUE, 2020-2029 (USD MILLION)
TABLE 258 SWITZERLAND SNACK PELLETS MARKET, BY BRAND, 2020-2029 (USD MILLION)
TABLE 259 SWITZERLAND SNACK PELLETS MARKET, BY FLAVOR, 2020-2029 (USD MILLION)
TABLE 260 SWITZERLAND FLAVOR IN SNACK PELLETS MARKET, BY FLAVOR, 2020-2029 (USD MILLION)
TABLE 261 SWITZERLAND SNACK PELLETS MARKET, BY APPLICATION, 2020-2029 (USD MILLION)
TABLE 262 SWITZERLAND SNACK PELLETS MARKET, BY DISTRIBUTION CHANNEL, 2020-2029 (USD MILLION)
TABLE 263 SWITZERLAND INDIRECT IN SNACK PELLETS MARKET, BY DISTRIBUTION CHANNEL, 2020-2029 (USD MILLION)
TABLE 264 SWITZERLAND STORE-BASED RETAILING IN SNACK PELLETS MARKET, BY DISTRIBUTION CHANNEL, 2020-2029 (USD MILLION)
TABLE 265 SWITZERLAND NON-STORE-BASED RETAILING IN SNACK PELLETS MARKET, BY DISTRIBUTION CHANNEL, 2020-2029 (USD MILLION)
TABLE 266 TURKEY SNACK PELLETS MARKET, BY TYPE, 2020-2029 (USD MILLION)
TABLE 267 TURKEY SNACK PELLETS MARKET, BY FORM, 2020-2029 (USD MILLION)
TABLE 268 TURKEY SNACK PELLETS MARKET, BY SHAPE, 2020-2029 (USD MILLION)
TABLE 269 TURKEY SNACK PELLETS MARKET, BY INGREDIENTS, 2020-2029 (USD MILLION)
TABLE 270 TURKEY SNACK PELLETS MARKET, BY PROCESSING METHOD, 2020-2029 (USD MILLION)
TABLE 271 TURKEY NON-GREASY SNACK PELLET IN SNACK PELLETS MARKET, BY PROCESSING METHOD, 2020-2029 (USD MILLION)
TABLE 272 TURKEY SNACK PELLETS MARKET, BY NATURE, 2020-2029 (USD MILLION)
TABLE 273 TURKEY SNACK PELLETS MARKET, BY TECHNIQUE, 2020-2029 (USD MILLION)
TABLE 274 TURKEY SNACK PELLETS MARKET, BY BRAND, 2020-2029 (USD MILLION)
TABLE 275 TURKEY SNACK PELLETS MARKET, BY FLAVOR, 2020-2029 (USD MILLION)
TABLE 276 TURKEY FLAVOR IN SNACK PELLETS MARKET, BY FLAVOR, 2020-2029 (USD MILLION)
TABLE 277 TURKEY SNACK PELLETS MARKET, BY APPLICATION, 2020-2029 (USD MILLION)
TABLE 278 TURKEY SNACK PELLETS MARKET, BY DISTRIBUTION CHANNEL, 2020-2029 (USD MILLION)
TABLE 279 TURKEY INDIRECT IN SNACK PELLETS MARKET, BY DISTRIBUTION CHANNEL, 2020-2029 (USD MILLION)
TABLE 280 TURKEY STORE-BASED RETAILING IN SNACK PELLETS MARKET, BY DISTRIBUTION CHANNEL, 2020-2029 (USD MILLION)
TABLE 281 TURKEY NON-STORE-BASED RETAILING IN SNACK PELLETS MARKET, BY DISTRIBUTION CHANNEL, 2020-2029 (USD MILLION)
TABLE 282 REST OF EUROPE SNACK PELLETS MARKET, BY TYPE, 2020-2029 (USD MILLION)
Lista de figuras
FIGURE 1 EUROPE SNACK PELLETS MARKET: SEGMENTATION
FIGURE 2 EUROPE SNACK PELLETS MARKET: DATA TRIANGULATION
FIGURE 3 EUROPE SNACK PELLETS MARKET: DROC ANALYSIS
FIGURE 4 EUROPE SNACK PELLETS MARKET: REGIONAL VS COUNTRY MARKET ANALYSIS
FIGURE 5 EUROPE SNACK PELLETS MARKET: COMPANY RESEARCH ANALYSIS
FIGURE 6 EUROPE SNACK PELLETS MARKET: INTERVIEW DEMOGRAPHICS
FIGURE 7 EUROPE SNACK PELLETS MARKET: DBMR MARKET POSITION GRID
FIGURE 8 EUROPE SNACK PELLETS MARKET: MARKET END-USER COVERAGE GRID
FIGURE 9 EUROPE SNACK PELLETS MARKET: VENDOR SHARE ANALYSIS
FIGURE 10 EUROPE SNACK PELLETS MARKET: SEGMENTATION
FIGURE 11 NORTH AMERICA IS EXPECTED TO DOMINATE THE FIGURE EUROPE SNACK PELLETS MARKET AND IS GROWING WITH THE HIGHEST CAGR IN THE FORECAST PERIOD OF 2022 TO 2029
FIGURE 12 INCREASE IN DEMAND FOR SAVORY SNACKS IS DRIVING THE EUROPE SNACK PELLETS MARKET IN THE FORECAST PERIOD.
FIGURE 13 TYPE SEGMENT IS EXPECTED TO ACCOUNT FOR THE LARGEST SHARE OF THE EUROPE SNACK PELLETS MARKET IN 2022 & 2029
FIGURE 14 EUROPE SNACK PELLETS MARKET: FACTORS AFFECTING NEW PRODUCT LAUNCHES STRATEGY
FIGURE 15 SUPPLY CHAIN ANALYSIS OF EUROPE SNACK PELLETS MARKET
FIGURE 16 VALUE CHAIN ANALYSIS OF EUROPE SNACK PELLETS MARKET
FIGURE 17 DRIVERS, RESTRAINTS, OPPORTUNITIES, AND CHALLENGES OF SNACK PELLETS MARKET
FIGURE 18 EUROPE SNACK PELLETS MARKET: BY TYPE, 2021
FIGURE 19 EUROPE SNACK PELLETS MARKET, BY FORM, 2021
FIGURE 20 EUROPE SNACK PELLETS MARKET, BY BRAND, 2021
FIGURE 21 EUROPE SNACK PELLETS MARKET, BY APPLICATION, 2021
FIGURE 22 EUROPE SNACK PELLETS MARKET: BY PROCESSING METHOD, 2021
FIGURE 23 EUROPE SNACK PELLETS MARKET: BY NATURE, 2021
FIGURE 24 EUROPE SNACK PELLETS MARKET: BY FLAVOR, 2021
FIGURE 25 EUROPE SNACK PELLETS MARKET: BY DISTRIBUTION CHANNEL, 2021
FIGURE 26 EUROPE SNACK PELLETS MARKET: BY TECHNIQUE, 2021
FIGURE 27 EUROPE SNACK PELLETS MARKET: BY SHAPE, 2021
FIGURE 28 EUROPE SNACK PELLETS MARKET: BY INGREDIENTS, 2021
FIGURE 29 EUROPE SNACK PELLETS MARKET: SNAPSHOT (2021)
FIGURE 30 EUROPE SNACK PELLETS MARKET: BY COUNTRY (2021)
FIGURE 31 EUROPE SNACK PELLETS MARKET: BY COUNTRY (2022 & 2029)
FIGURE 32 EUROPE SNACK PELLETS MARKET: BY COUNTRY (2021 & 2029)
FIGURE 33 EUROPE SNACK PELLETS MARKET: BY TYPE (2022 & 2029)
FIGURE 34 EUROPE SNACK PELLETS MARKET: COMPANY SHARE 2021 (%)
Metodología de investigación
La recopilación de datos y el análisis del año base se realizan utilizando módulos de recopilación de datos con muestras de gran tamaño. La etapa incluye la obtención de información de mercado o datos relacionados a través de varias fuentes y estrategias. Incluye el examen y la planificación de todos los datos adquiridos del pasado con antelación. Asimismo, abarca el examen de las inconsistencias de información observadas en diferentes fuentes de información. Los datos de mercado se analizan y estiman utilizando modelos estadísticos y coherentes de mercado. Además, el análisis de la participación de mercado y el análisis de tendencias clave son los principales factores de éxito en el informe de mercado. Para obtener más información, solicite una llamada de un analista o envíe su consulta.
La metodología de investigación clave utilizada por el equipo de investigación de DBMR es la triangulación de datos, que implica la extracción de datos, el análisis del impacto de las variables de datos en el mercado y la validación primaria (experto en la industria). Los modelos de datos incluyen cuadrícula de posicionamiento de proveedores, análisis de línea de tiempo de mercado, descripción general y guía del mercado, cuadrícula de posicionamiento de la empresa, análisis de patentes, análisis de precios, análisis de participación de mercado de la empresa, estándares de medición, análisis global versus regional y de participación de proveedores. Para obtener más información sobre la metodología de investigación, envíe una consulta para hablar con nuestros expertos de la industria.
Personalización disponible
Data Bridge Market Research es líder en investigación formativa avanzada. Nos enorgullecemos de brindar servicios a nuestros clientes existentes y nuevos con datos y análisis que coinciden y se adaptan a sus objetivos. El informe se puede personalizar para incluir análisis de tendencias de precios de marcas objetivo, comprensión del mercado de países adicionales (solicite la lista de países), datos de resultados de ensayos clínicos, revisión de literatura, análisis de mercado renovado y base de productos. El análisis de mercado de competidores objetivo se puede analizar desde análisis basados en tecnología hasta estrategias de cartera de mercado. Podemos agregar tantos competidores sobre los que necesite datos en el formato y estilo de datos que esté buscando. Nuestro equipo de analistas también puede proporcionarle datos en archivos de Excel sin procesar, tablas dinámicas (libro de datos) o puede ayudarlo a crear presentaciones a partir de los conjuntos de datos disponibles en el informe.

