Europe Sjs Ten Treatment Market
Tamaño del mercado en miles de millones de dólares
Tasa de crecimiento anual compuesta (CAGR) :
% 
 USD
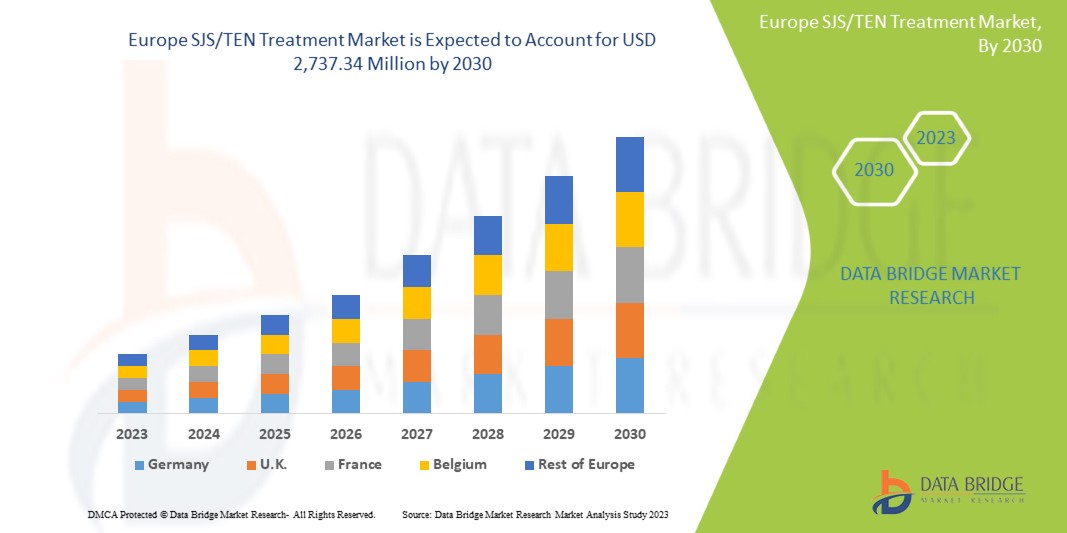
1,686.96 Million
USD
2,737.34 Million
2022
2030
USD
1,686.96 Million
USD
2,737.34 Million
2022
2030
| 2023 –2030 | |
| USD 1,686.96 Million | |
| USD 2,737.34 Million | |
| % | |
|
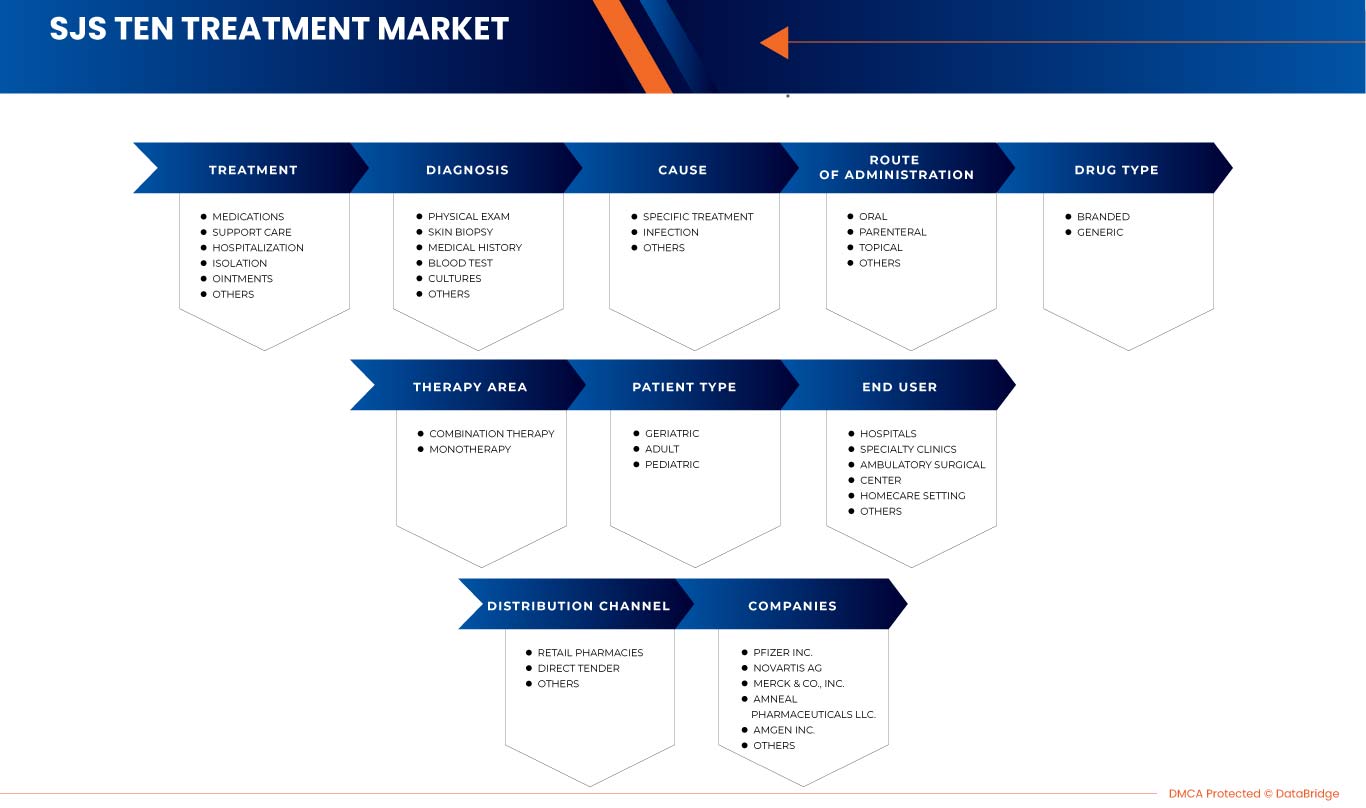
Mercado europeo de tratamiento de SJS/TEN, por tratamiento (medicamentos, cuidados de apoyo, hospitalización, aislamiento, ungüentos y otros), diagnóstico (examen físico, biopsia de piel , historial médico, análisis de sangre, cultivos y otros), causa (tratamiento específico, infección y otros), vía de administración (oral, parenteral, tópica y otras), tipo de fármaco (de marca y genérico), área de terapia (terapia combinada y monoterapia), tipo de paciente (geriátrico, adulto y pediátrico), usuario final (hospitales, clínicas especializadas, centro quirúrgico ambulatorio, entorno de atención domiciliaria y otros), canal de distribución (farmacias minoristas, licitación directa y otros) - Tendencias de la industria y pronóstico hasta 2030.
Análisis y perspectivas del mercado de tratamiento de SJS/TEN en Europa
El mercado de tratamiento para el síndrome de Stevens-Johnson (SSJ) y la necrólisis epidérmica tóxica (NET) es relativamente pequeño debido a la rareza de estas enfermedades.
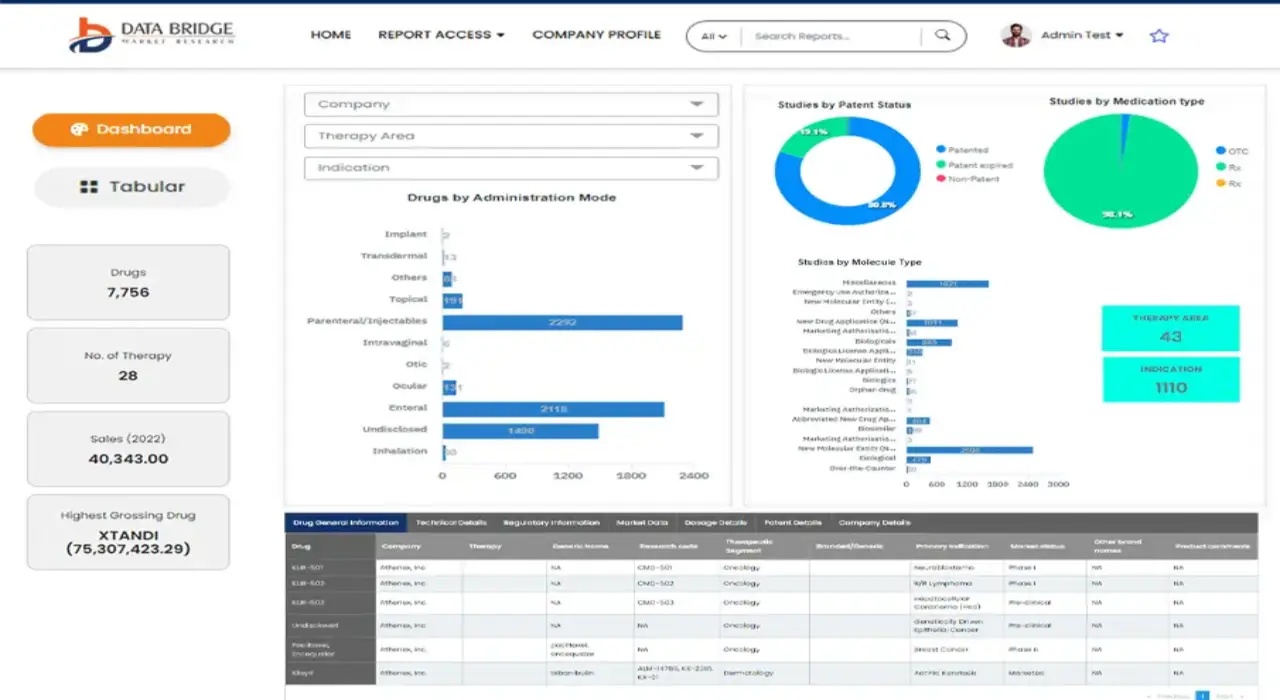
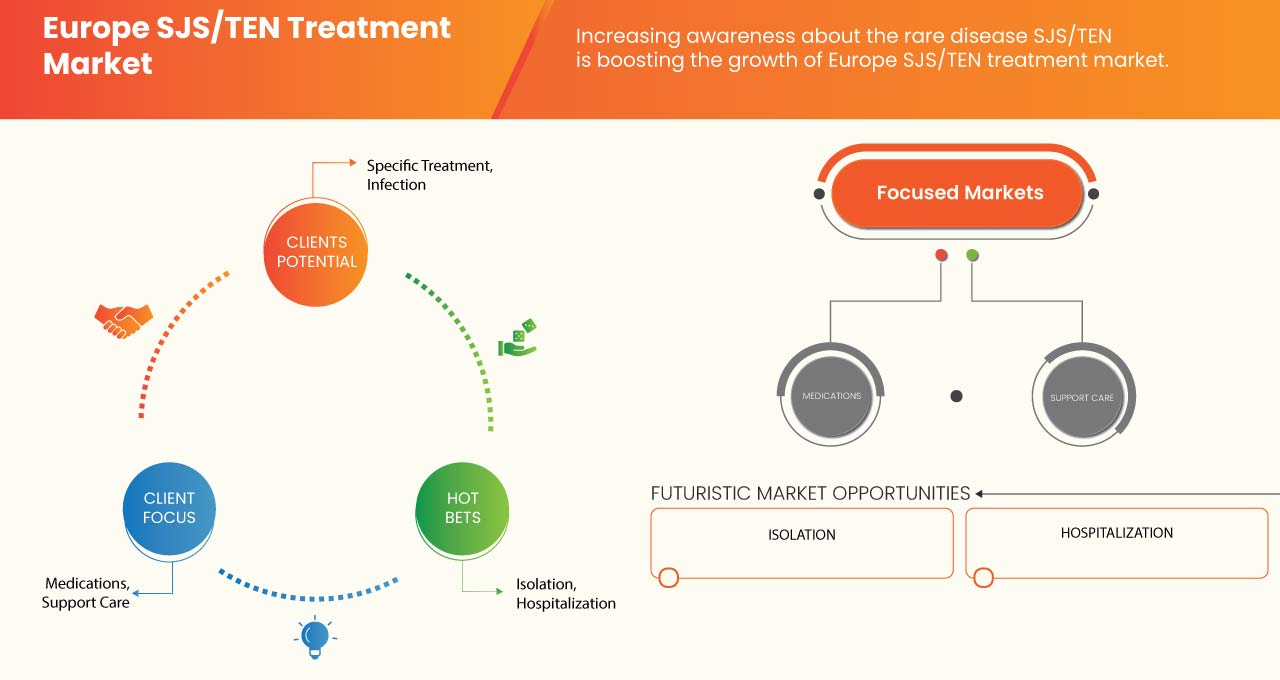
El mercado europeo de tratamiento del SJS/NET está dominado por los medicamentos, ya que estos son la principal forma de tratamiento para estas afecciones. Los corticosteroides, la inmunoglobulina intravenosa (IVIG) y los antibióticos son los medicamentos más utilizados en el tratamiento del SJS/NET.
Se espera que el mercado europeo de tratamiento de SJS/TEN gane crecimiento de mercado en el período de pronóstico de 2023 a 2030. Data Bridge Market Research analiza que el mercado está creciendo con una CAGR del 6,4% en el período de pronóstico de 2023 a 2030 y se espera que alcance los USD 2737,34 millones para 2030 desde USD 1686,96 millones en 2022.
El informe de mercado de tratamiento de SJS/TEN en Europa proporciona detalles de la participación de mercado, nuevos desarrollos y análisis de la cartera de productos, el impacto de los actores del mercado nacional y localizado, analiza las oportunidades en términos de bolsillos de ingresos emergentes, cambios en las regulaciones del mercado, aprobaciones de productos, decisiones estratégicas, lanzamientos de productos, expansiones geográficas e innovaciones tecnológicas en el mercado. Para comprender el análisis y el escenario del mercado, contáctenos para obtener un informe de analista. Nuestro equipo lo ayudará a crear una solución de impacto en los ingresos para lograr su objetivo deseado. La escalabilidad y la expansión comercial de las unidades minoristas en los países en desarrollo de varias regiones y la asociación con proveedores para la distribución segura de productos de maquinaria y medicamentos son los principales impulsores que impulsaron la demanda del mercado en el período de pronóstico.
|
Métrica del informe |
Detalles |
|
Período de pronóstico |
2023 a 2030 |
|
Año base |
2022 |
|
Años históricos |
2021 (Personalizable para 2015 - 2020) |
|
Unidades cuantitativas |
Ingresos en millones de USD |
|
Segmentos cubiertos |
Tratamiento (medicamentos, cuidados de apoyo, hospitalización, aislamiento, ungüentos y otros), diagnóstico (examen físico, biopsia de piel, historial médico, análisis de sangre, cultivos y otros), causa (tratamiento específico, infección y otros), vía de administración (oral, parenteral, tópica y otras), tipo de fármaco (de marca y genérico), área de terapia (terapia combinada y monoterapia), tipo de paciente (geriátrico, adulto y pediátrico), usuario final (hospitales, clínicas especializadas, centro quirúrgico ambulatorio, entorno de atención domiciliaria y otros), canal de distribución (farmacias minoristas, licitación directa y otros) |
|
Países cubiertos |
Reino Unido, Francia, Alemania, Italia, Rusia, España, Países Bajos, Dinamarca, Suiza, Suecia, Polonia, Noruega, Finlandia, Bélgica, Turquía, Resto de Europa |
|
Actores del mercado cubiertos |
3M (EE. UU.), Cardinal Health (EE. UU.), BD (EE. UU.), Smith + Nephew (Reino Unido), Novartis AG (Suiza), Amneal Pharmaceuticals LLC. (EE. UU.), Amgen Inc. (EE. UU.), Pfizer Inc. (EE. UU.), Colgate-Palmolive Company (EE. UU.), Merck & Co., Inc. (EE. UU.), Mölnlycke Health Care AB. (Suecia), Xttrium Laboratories (EE. UU.), Schülke & Mayr GmbH (Alemania), ICPA Health Products Ltd (India), Purdue Pharma LP (EE. UU.), eugia (filial de Aurobindo Pharma) y AdvaCare Pharma (EE. UU.), entre otras. |
Definición de mercado
El síndrome de Stevens-Johnson (SSJ) y la necrólisis epidérmica tóxica (NET) son afecciones cutáneas poco frecuentes pero potencialmente mortales que suelen ser consecuencia de reacciones graves a medicamentos. Estas afecciones hacen que la capa superior de la piel se separe de las capas inferiores, lo que produce ampollas y llagas dolorosas que pueden cubrir gran parte del cuerpo. El SSJ afecta a una parte más pequeña de la piel, mientras que la NET afecta a una parte más grande.
La definición del tratamiento del SJS/TEN se refiere a los productos y servicios diseñados para controlar y tratar estas afecciones. Existen medicamentos, terapias y otros tratamientos en el mercado que pueden ayudar a aliviar los síntomas del SJS/TEN y mejorar la calidad de vida de los pacientes. El mercado de medicamentos para el tratamiento del SJS/TEN incluye una serie de medicamentos que se utilizan para aliviar los síntomas y tratar la causa subyacente.
Dinámica del mercado de tratamiento de SJS/TEN en Europa
En esta sección se aborda la comprensión de los factores impulsores, las ventajas, las limitaciones y los desafíos del mercado. Todo esto se analiza en detalle a continuación:
Conductores
-
Aumento de la prevalencia e incidencia de SJS/TEN
El síndrome de Stevens-Johnson (SSJ) y la necrólisis epidérmica tóxica (NET) son enfermedades graves y potencialmente mortales que afectan la piel y las membranas mucosas. El SSJ y la NET se consideran los dos extremos del espectro de la enfermedad, siendo el SSJ la forma más leve y la NET la forma más grave. Un rasgo característico de estas enfermedades es la separación de la epidermis (la capa externa de la piel) de la dermis (la capa debajo de la piel) debido a una fuerte reacción inmunitaria.
El síndrome de Stevens-Johnson (SSJ) y la necrólisis epidérmica tóxica (NET) son enfermedades cutáneas poco frecuentes pero graves que se caracterizan por la separación de la epidermis de la dermis. Se ha informado de una incidencia de SSJ/NET de alrededor de 1 por millón de personas al año. Sin embargo, en los últimos años ha aumentado la preocupación por la incidencia y la prevalencia de SSJ/NET.
-
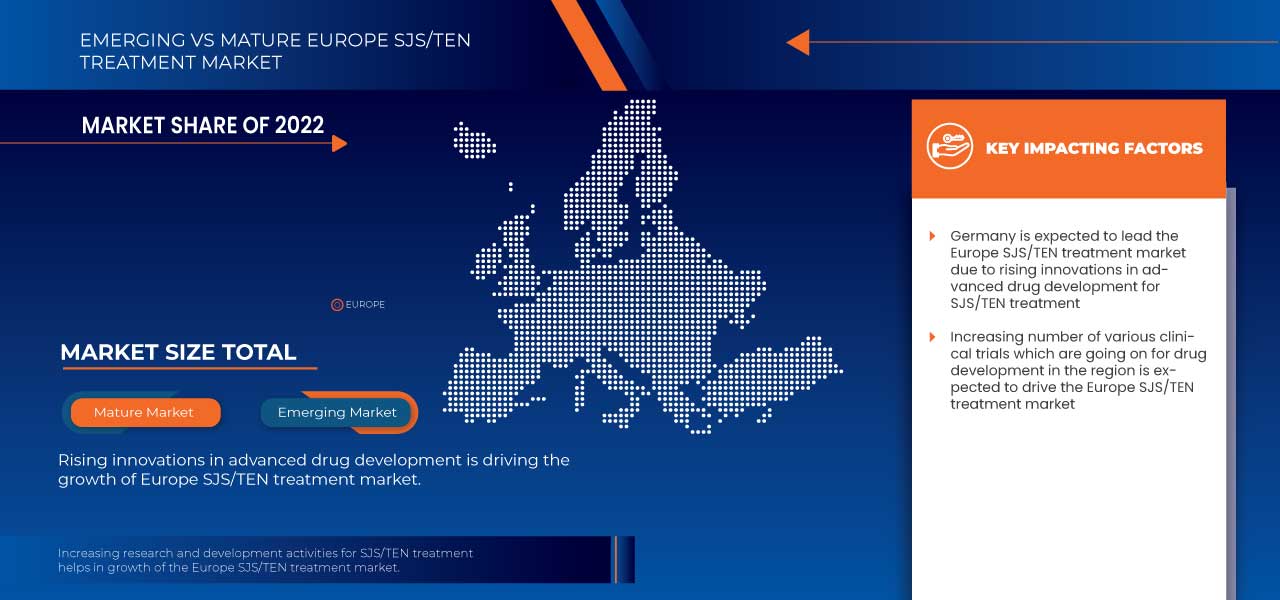
Avances en el desarrollo de fármacos para el tratamiento del síndrome de Stevens-Johnson y la enfermedad por reflujo gastroesofágico
El síndrome de Stevens-Johnson (SSJ) y la necrólisis epidérmica tóxica (NET) son afecciones graves y potencialmente mortales que requieren un tratamiento rápido y agresivo. Aunque actualmente no existe ningún medicamento o tratamiento específico que pueda curar el SSJ/NET, los avances en el desarrollo de medicamentos han llevado a mejores estrategias de tratamiento y resultados terapéuticos para los pacientes afectados. Sin embargo, se están llevando a cabo varios ensayos clínicos para el desarrollo de medicamentos para el tratamiento del SSJ/NET.
Restricción
-
Altos costos asociados con el tratamiento de SJS/TEN
Una de las principales razones por las que el tratamiento del SJS/TEN es costoso es la necesidad de un tratamiento intensivo y a largo plazo. Los pacientes con SJS/TEN a menudo requieren hospitalización en unidades especializadas para quemados, donde reciben atención las 24 horas por parte de un equipo de profesionales de la salud que incluye dermatólogos, oftalmólogos y especialistas en cuidados intensivos. La hospitalización puede durar varias semanas y, en casos graves, incluso meses. Esto puede generar facturas hospitalarias elevadas y otros costos relacionados, como transporte, alojamiento y comidas.
Oportunidad
-
Desarrollo de un tratamiento eficaz y seguro para el síndrome de Stevens-Johnson y la NET
El trasplante de células madre es un nuevo enfoque que tiene como objetivo reemplazar la piel y las mucosas dañadas con tejido sano. El trasplante autólogo de células madre, en el que las células madre se extraen de la piel del paciente y se cultivan antes de volver a trasplantarlas en la zona dañada, ha mostrado resultados prometedores en estudios pequeños.
Desafío
- Normas gubernamentales estrictas para la aprobación de un tratamiento para el síndrome de Stevens-Johnson y la neuropatía diabética relacionada con la neumonía
Las estrictas regulaciones gubernamentales para la aprobación de tratamientos para SJS/TEN están relacionadas con el proceso complejo y riguroso por el que deben pasar las compañías farmacéuticas y sus medicamentos para obtener la aprobación para un tratamiento para SJS/TEN de agencias reguladoras como la Administración de Alimentos y Medicamentos de los Estados Unidos (FDA) o la Agencia Europea de Medicamentos (EMA).
El proceso de aprobación de un nuevo medicamento generalmente implica varias etapas de ensayos clínicos en humanos para evaluar la seguridad y eficacia del medicamento.
Acontecimientos recientes
- En junio de 2020, BD, una empresa líder en tecnología médica de Europa, anunció que había completado la adquisición de Straub Medical AG, una empresa privada. Con esta adquisición, la empresa ha incorporado la valiosa experiencia y conocimientos de Straub Medical AG y ha ampliado su cartera de productos. Esto ayudará a la empresa a expandirse y crecer en el mercado.
- En enero de 2019, Mölnlycke Health Care AB. adquiere MandJ Airlaid Products A/S para fortalecer aún más sus capacidades de cuidado de heridas. En relación con la adquisición, MandJ y sus empleados serán una parte integral de Mölnlycke. La adquisición mejorará la seguridad de suministro de Mölnlycke para el material de aplicación por aire necesario para producir apósitos avanzados para heridas y ayudará a hacer crecer el negocio del cuidado de heridas al acelerar la innovación y el desarrollo de productos en productos existentes y futuros. Esto ayudará a la empresa a expandirse y crecer en el mercado.
Alcance del mercado europeo de tratamiento de SJS/TEN
El mercado europeo de tratamiento de SJS/TEN se clasifica en nueve segmentos notables según el tratamiento, el diagnóstico, la causa, la vía de administración, el tipo de fármaco, el tipo de terapia, el tipo de paciente, el usuario final y el canal de distribución. El crecimiento entre segmentos le ayuda a analizar nichos de crecimiento y estrategias para abordar el mercado y determinar sus áreas de aplicación principales y la diferencia en sus mercados objetivo.
El mercado europeo de tratamiento de SJS/TEN se clasifica en nueve segmentos notables según el tratamiento, el diagnóstico, la causa, la vía de administración, el tipo de fármaco, el tipo de terapia, el tipo de paciente, el usuario final y el canal de distribución.
Tratamiento
- Medicamentos
- Atención de apoyo
- Ungüentos
- Hospitalización
- Aislamiento
- Otros
En función del tratamiento, el mercado europeo de tratamiento de SJS/TEN está segmentado en medicamentos, cuidados de apoyo, hospitalización, aislamiento, ungüentos y otros.
Diagnóstico
- Examen físico
- Historial médico
- Biopsia de piel
- Análisis de sangre
- Culturas
- Otros
Sobre la base del diagnóstico, el mercado europeo de tratamiento de SJS/TEN se segmenta en examen físico, biopsia de piel, historial médico, análisis de sangre, cultivos y otros.
Causa
- Tratamiento específico
- Infección
- Otros
Sobre la base de la causa, el mercado europeo de tratamiento de SJS/TEN está segmentado en tratamiento específico, infección y otros.
Vía de administración
- Oral
- Parenteral
- Actual
- Otros
Sobre la base de la vía de administración, el mercado europeo de tratamiento de SJS/TEN está segmentado en oral, parenteral, tópico y otros.
Tipo de droga
- De marca
- Genérico
Según el tipo de fármaco, el mercado europeo de tratamiento de SJS/TEN está segmentado en de marca y genéricos.
Tipo de terapia
- Monoterapia
- Terapia combinada
Según el tipo de terapia, el mercado europeo de tratamiento de SJS/TEN está segmentado en terapia combinada y monoterapia.
Tipo de paciente
- Pediátrico
- Adulto
- Geriátrico
Según el tipo de paciente, el mercado europeo de tratamiento de SJS/TEN está segmentado en geriátrico, adulto y pediátrico.
Usuario final
- Hospitales
- Clínicas de especialidades
- Centro de Cirugía Ambulatoria
- Entorno de atención domiciliaria
- Otros
Sobre la base del usuario final, el mercado europeo de tratamiento de SJS/TEN está segmentado en hospitales, clínicas especializadas, centros quirúrgicos ambulatorios, entornos de atención domiciliaria y otros.
Canal de distribución
- Licitaciones directas
- Farmacias minoristas
- Otros
Sobre la base del canal de distribución, el mercado europeo de tratamiento de SJS/TEN está segmentado en farmacias minoristas, licitaciones directas y otros.
Análisis y perspectivas regionales del mercado de tratamiento de SJS/TEN en Europa
El mercado europeo de tratamiento de SJS/TEN se clasifica en nueve segmentos notables según el tratamiento, el diagnóstico, la causa, la vía de administración, el tipo de fármaco, el tipo de terapia, el tipo de paciente, el usuario final y el canal de distribución.
The countries covered in this market report are U.K., France, Germany, Italy, Russia, Spain, Netherlands, Denmark, Switzerland, Sweden, Poland, Norway, Finland, Belgium, Turkey, and Rest of Europe.
Germany is expected to dominate due to a rise in production of SJS/TEN treatment and increasing demand from emerging markets, and expansion of healthcare industries.
The country section of the report also provides individual market impacting factors and changes in regulation in the market domestically that impact the current and future trends of the market. Data points such as new sales, replacement sales, country demographics, regulatory acts, and import-export tariffs are some of the major pointers used to forecast the market scenario for individual countries. Also, the presence and availability of Europe brands and their challenges faced due to large or scarce competition from local and domestic brands, and impact of sales channels are considered while providing forecast analysis of the country data.
Competitive Landscape and Europe SJS/TEN Treatment Market Share Analysis
Europe SJS/TEN treatment market competitive landscape provides details by competitor. Details included are company overview, company financials, revenue generated, market potential, investment in R&D, new market initiatives, production sites and facilities, company strengths and weaknesses, product launch, product approvals, product width and breath, application dominance, and technology lifeline curve. The above data points provided are only related to the company’s focus on the Europe SJS/TEN treatment market.
Some of the major players operating in the Europe SJS/TEN treatment market are 3M (U.S.), Cardinal Health (U.S.), BD (U.S.), Smith + Nephew (U.K.), Novartis AG (Switzerland), Amneal Pharmaceuticals LLC. (U.S.), Amgen Inc. (U.S.), Pfizer Inc. (U.S.), Colgate-Palmolive Company (U.S.), Merck & Co., Inc. (U.S.), Mölnlycke Health Care AB. (Sweden), Xttrium Laboratories (U.S.), Schülke & Mayr GmbH (Germany), ICPA Health Products Ltd (India), Purdue Pharma L.P. (U.S.), eugia (Subsidiary of Aurobindo Pharma), and AdvaCare Pharma (U.S.) among others.
SKU-
Obtenga acceso en línea al informe sobre la primera nube de inteligencia de mercado del mundo
- Panel de análisis de datos interactivo
- Panel de análisis de empresas para oportunidades con alto potencial de crecimiento
- Acceso de analista de investigación para personalización y consultas
- Análisis de la competencia con panel interactivo
- Últimas noticias, actualizaciones y análisis de tendencias
- Aproveche el poder del análisis de referencia para un seguimiento integral de la competencia
Tabla de contenido
1 INTRODUCTION
1.1 OBJECTIVES OF THE STUDY
1.2 MARKET DEFINITION
1.3 OVERVIEW OF THE EUROPE SJS/TEN TREATMENT MARKET
1.4 LIMITATIONS
1.5 MARKETS COVERED
2 MARKET SEGMENTATION
2.1 MARKETS COVERED
2.2 GEOGRAPHICAL SCOPE
2.3 YEARS CONSIDERED FOR THE STUDY
2.4 CURRENCY AND PRICING
2.5 DBMR TRIPOD DATA VALIDATION MODEL
2.6 MULTIVARIATE MODELLING
2.7 TREATMENT LIFELINE CURVE
2.8 PRIMARY INTERVIEWS WITH KEY OPINION LEADERS
2.9 DBMR MARKET POSITION GRID
2.1 MARKET APPLICATION COVERAGE GRID
2.11 VENDOR SHARE ANALYSIS
2.12 SECONDARY SOURCES
2.13 ASSUMPTIONS
3 EXECUTIVE SUMMARY
4 PREMIUM INSIGHTS
4.1 KEY TRENDS
4.2 COST OF TREATMENT
4.3 KEY PLAYERS STRATEGIES
4.4 LONG TERM GROWTH APPROACH
5 EPIDEMIOLOGY
6 INDUSTRY INSIGHTS
6.1 PATENT ANALYSIS
6.2 DEMOGRAPHIC TRENDS
6.3 PATIENT FLOW DIAGRAM
6.4 KEY PRICING STRATEGIES
6.5 KEY PATIENT ENROLLMENT STRATEGIES
7 MARKET OVERVIEW
7.1 DRIVERS
7.1.1 INCREASING PREVALENCE AND INCIDENCE OF SJS/TEN
7.1.2 ADVANCES IN DRUG DEVELOPMENT FOR SJS/TEN TREATMENT
7.1.3 INCREASING AWARENESS ABOUT THE RARE DISEASE SJS/TEN
7.1.4 GOVERNMENT INITIATIVES FOR SJS/TEN TREATMENT
7.2 RESTRAINTS
7.2.1 HIGH COST ASSOCIATED WITH THE TREATMENT OF SJS/TEN
7.2.2 LIMITED AVAILABILITY OF SPECIALIZED CARE FOR SJS/TEN TREATMENT
7.3 OPPORTUNITIES
7.3.1 DEVELOPING EFFECTIVE AND SAFE TREATMENT FOR SJS/TEN
7.3.2 INCREASING RESEARCH AND DEVELOPMENT ACTIVITIES FOR SJS/TEN TREATMENT
7.4 CHALLENGES
7.4.1 STRINGENT GOVERNMENT REGULATIONS FOR APPROVAL OF TREATMENT FOR SJS/TEN
7.4.2 LONG TERM COMPLICATIONS AND ADVERSE EFFECTS OF MEDICATIONS USED IN THE SJS/TEN TREATMENT
8 EUROPE SJS/TEN TREATMENT MARKET, BY TREATMENT
8.1 OVERVIEW
8.2 MEDICATIONS
8.2.1 ANTIHISTAMINES
8.2.1.1 HYDROXYZINE
8.2.1.2 FEXOFENADINE
8.2.2 CORTICOSTEROID
8.2.2.1 DEXAMETHASONE
8.2.2.2 PREDNISOLONE
8.2.2.3 METHYLPREDNISOLONE
8.2.2.4 HYDROCORTISONE
8.2.2.5 OTHERS
8.2.3 ANTIBIOTICS
8.2.3.1 NAFCILLIN
8.2.3.2 GENTAMICIN
8.2.3.3 OTHERS
8.2.4 ANALGESICS
8.2.4.1 MORPHINE
8.2.4.2 FENTANYL CITRATE
8.2.4.3 OTHERS
8.2.5 ANTICOAGULANTS
8.2.6 ANTISEPTICS
8.2.6.1 CHLORHEXIDINE GLUCONATE
8.2.6.1.1 PERIOGARD
8.2.6.1.2 PERIDEX
8.2.6.1.3 AVAGARD
8.2.6.1.4 HIBICLENS
8.2.6.1.5 OTHERS
8.2.6.2 OCTENISEPT
8.2.6.3 POLYHEXANIDE SOLUTIONS
8.2.6.4 OTHERS
8.2.7 INTRAVENOUS IMMUNOGLOBULIN
8.2.8 CYCLOSPORINE
8.2.8.1 NEORAL
8.2.8.2 SANDIMMUNE
8.2.8.3 OTHERS
8.2.9 TUMOR NECROSIS FACTOR-ALPHA (TNF-Α)‒BLOCKING AGENT (ETANERCEPT)
8.2.10 OTHER TREATMENT
8.2.10.1 CYCLOPHOSPHAMIDE
8.2.10.2 N-ACETYLCYSTEINE
8.2.10.3 MONOCLONAL ANTIBODIES
8.2.10.4 THALIDOMIDE
8.3 SUPPORT CARE
8.3.1 INTRAVENOUS (IV) FLUID AND ELECTROLYTES
8.3.2 PAIN MANAGEMENT
8.3.2.1 LIDOCAINE
8.3.2.2 OTHERS
8.3.3 NUTRITION SUPPORT
8.3.4 ORAL CARE
8.3.5 PLASMAPHERESIS
8.3.6 BANDAGES
8.3.6.1 BIOLOGICAL DRESSING
8.3.6.1.1 ALLOGRAFT
8.3.6.1.2 XENOGRAFT
8.3.6.1.3 HOMOGRAFT
8.3.6.1.4 OTHERS
8.3.6.2 BIOSYNTHETIC DRESSING
8.3.6.3 SILVER IMPREGNATED DRESSING
8.4 HOSPITALIZATION
8.5 ISOLATION
8.6 OINTMENTS
8.6.1 BENZOCAINE
8.6.2 AMERICAINE
8.6.3 ANBESOL
8.6.4 CHIGGEREX PLUS
8.6.5 OTHERS
8.7 OTHERS
9 EUROPE SJS/TEN TREATMENT MARKET, BY DIAGNOSIS
9.1 OVERVIEW
9.2 PHYSICAL EXAM
9.3 SKIN BIOPSY
9.4 MEDICAL HISTORY
9.5 BLOOD TEST
9.5.1 COMPLETE BLOOD COUNT
9.5.2 ERYTHROCYTE SEDIMENTATION RATE
9.5.3 COAGULATION STUDIES
9.5.4 UREA AND ELECTROLYTES
9.5.5 LIVER FUNCTION TEST
9.6 CULTURES
9.7 OTHERS
10 EUROPE SJS/TEN TREATMENT MARKET, BY CAUSE
10.1 OVERVIEW
10.2 SPECIFIC TREATMENT
10.3 INFECTION
10.4 OTHERS
11 EUROPE SJS/TEN TREATMENT MARKET, BY ROUTE OF ADMINISTRATION
11.1 OVERVIEW
11.2 ORAL
11.3 PARENTERAL
11.3.1 INTRAVENOUS
11.3.2 SUBCUTANEOUS
11.3.3 OTHERS
11.4 TOPICAL
11.4.1 OINTMENTS
11.4.2 SOLUTION
11.4.3 CREAMS
11.4.4 OTHERS
11.5 OTHERS
12 EUROPE SJS/TEN TREATMENT MARKET, BY DRUG TYPE
12.1 OVERVIEW
12.2 BRANDED
12.2.1 NEORAL
12.2.2 SANDIMMUNE
12.2.3 VISTARIL
12.2.4 DURAMORPH
12.2.5 FENTORA
12.2.6 ENBREL
12.2.7 OTHERS
12.3 GENERIC
13 EUROPE SJS/TEN TREATMENT MARKET, BY THERAPY TYPE
13.1 OVERVIEW
13.2 COMBINATION THERAPY
13.3 MONOTHERAPY
14 EUROPE SJS/TEN TREATMENT MARKET, BY PATIENT TYPE
14.1 OVERVIEW
14.2 GERIATRIC
14.2.1 FEMALE
14.2.2 MALE
14.3 ADULT
14.3.1 FEMALE
14.3.2 MALE
14.4 PEDIATRIC
15 EUROPE SJS/TEN TREATMENT MARKET, BY END USER
15.1 OVERVIEW
15.2 HOSPITALS
15.3 SPECIALTY CLINICS
15.4 AMBULATORY SURGICAL CENTER
15.5 HOMECARE SETTING
15.6 OTHERS
16 EUROPE SJS/TEN TREATMENT MARKET, BY DISTRIBUTION CHANNEL
16.1 OVERVIEW
16.2 RETAIL PHARMACIES
16.2.1 HOSPITAL ASSOCIATED PHARMACIES
16.2.2 DRUG STORE
16.2.3 ONLINE PHARMACIES
16.3 DIRECT TENDERS
16.4 OTHERS
17 EUROPE SJS/TEN TREATMENT MARKET, BY REGION
17.1 EUROPE
17.1.1 GERMANY
17.1.2 FRANCE
17.1.3 U.K.
17.1.4 ITALY
17.1.5 SPAIN
17.1.6 RUSSIA
17.1.7 TURKEY
17.1.8 BELGIUM
17.1.9 DENMARK
17.1.10 NETHERLANDS
17.1.11 SWITZERLAND
17.1.12 SWEDEN
17.1.13 POLAND
17.1.14 NORWAY
17.1.15 FINLAND
17.1.16 REST OF EUROPE
18 EUROPE SJS/TEN TREATMENT MARKET, COMPANY LANDSCAPE
18.1 COMPANY SHARE ANALYSIS: EUROPE
19 SWOT ANALYSIS
20 COMPANY PROFILE
20.1 PFIZER INC.
20.1.1 COMPANY SNAPSHOT
20.1.2 REVENUE ANALYSIS
20.1.3 COMPANY SHARE ANALYSIS
20.1.4 PRODUCT PORTFOLIO
20.1.5 RECENT DEVELOPMENT
20.2 NOVARTIS AG
20.2.1 COMPANY SNAPSHOT
20.2.2 REVENUE ANALYSIS
20.2.3 COMPANY SHARE ANALYSIS
20.2.4 PRODUCT PORTFOLIO
20.2.5 RECENT DEVELOPMENT
20.3 MERCK & CO., INC.
20.3.1 COMPANY SNAPSHOT
20.3.2 REVENUE ANALYSIS
20.3.3 COMPANY SHARE ANALYSIS
20.3.4 PRODUCT PORTFOLIO
20.3.5 RECENT DEVELOPMENT
20.4 AMNEAL PHARMACEUTICAL LLC.
20.4.1 COMPANY SNAPSHOT
20.4.2 REVENUE ANALYSIS
20.4.3 COMPANY SHARE ANALYSIS
20.4.4 PRODUCT PORTFOLIO
20.4.5 RECENT DEVELOPMENT
20.5 AMGEN INC.
20.5.1 COMPANY SNAPSHOT
20.5.2 REVENUE ANALYSIS
20.5.3 PRODUCT PORTFOLIO
20.5.4 RECENT DEVELOPMENT
20.6 ADVACARE PHARMA
20.6.1 COMPANY SNAPSHOT
20.6.2 PRODUCT PORTFOLIO
20.6.3 RECENT DEVELOPMENT
20.7 BD
20.7.1 COMPANY SNAPSHOT
20.7.2 REVENUE ANALYSIS
20.7.3 PRODUCT PORTFOLIO
20.7.4 RECENT DEVELOPMENT
20.8 CARDINAL HEALTH
20.8.1 COMPANY SNAPSHOT
20.8.2 REVENUE ANALYSIS
20.8.3 PRODUCT PORTFOLIO
20.8.4 RECENT DEVELOPMENT
20.9 COLGATE-PALMOLIVE COMPANY
20.9.1 COMPANY SNAPSHOT
20.9.2 REVENUE ANALYSIS
20.9.3 PRODUCT PORTFOLIO
20.9.4 RECENT DEVELOPMENT
20.1 EUGIA (SUBSIDIARY OF AUROBINDO PHARMA)
20.10.1 COMPANY SNAPSHOT
20.10.2 REVENUE ANALYSIS
20.10.3 PRODUCT PORTFOLIO
20.10.4 RECENT DEVELOPMENT
20.11 ICPA HEALTH PRODUCTS LTD
20.11.1 COMPANY SNAPSHOT
20.11.2 PRODUCT PORTFOLIO
20.11.3 RECENT DEVELOPMENT
20.12 3M
20.12.1 COMPANY SNAPSHOT
20.12.2 REVENUE ANALYSIS
20.12.3 PRODUCT PORTFOLIO
20.12.4 RECENT DEVELOPMENT
20.13 MOLNLYCKE HEALTH CARE AB.
20.13.1 COMPANY SNAPSHOT
20.13.2 PRODUCT PORTFOLIO
20.13.3 RECENT DEVELOPMENT
20.14 PURDUE PHARMA L.P.
20.14.1 COMPANY SNAPSHOT
20.14.2 PRODUCT PORTFOLIO
20.14.3 RECENT DEVELOPMENT
20.15 SCHULKE & MAYR GMBH
20.15.1 COMPANY SNAPSHOT
20.15.2 PRODUCT PORTFOLIO
20.15.3 RECENT DEVELOPMENT
20.16 SMITH + NEPHEW
20.16.1 COMPANY SNAPSHOT
20.16.2 REVENUE ANALYSIS
20.16.3 PRODUCT PORTFOLIO
20.16.4 RECENT DEVELOPMENT
20.17 XTTRIUM LABORATORIES
20.17.1 COMPANY SNAPSHOT
20.17.2 PRODUCT PORTFOLIO
20.17.3 RECENT DEVELOPMENT
21 QUESTIONNAIRE
22 RELATED REPORTS
Lista de Tablas
TABLE 1 EUROPE SJS/TEN TREATMENT MARKET, PATENT ANALYSIS
TABLE 2 EUROPE SJS/TEN TREATMENT MARKET, BY TREATMENT, 2021-2030 (USD MILLION)
TABLE 3 EUROPE MEDICATIONS IN SJS/TEN TREATMENT MARKET, BY REGION, 2021-2030 (USD MILLION)
TABLE 4 EUROPE MEDICATIONS IN SJS/TEN TREATMENT MARKET, BY TREATMENT, 2021-2030 (USD MILLION)
TABLE 5 EUROPE ANTIHISTAMINES IN SJS/TEN TREATMENT MARKET, BY TREATMENT, 2021-2030 (USD MILLION)
TABLE 6 EUROPE CORTICOSTEROID IN SJS/TEN TREATMENT MARKET, BY TREATMENT, 2021-2030 (USD MILLION)
TABLE 7 EUROPE ANTIBIOTICS IN SJS/TEN TREATMENT MARKET, BY TREATMENT, 2021-2030 (USD MILLION)
TABLE 8 EUROPE ANALGESICS IN SJS/TEN TREATMENT MARKET, BY TREATMENT, 2021-2030 (USD MILLION)
TABLE 9 EUROPE ANTISEPTICS IN SJS/TEN TREATMENT MARKET, BY TREATMENT, 2021-2030 (USD MILLION)
TABLE 10 EUROPE CHLORHEXIDINE GLUCONATE IN SJS/TEN TREATMENT MARKET, BY TREATMENT, 2021-2030 (USD MILLION)
TABLE 11 EUROPE CYCLOSPORINE IN SJS/TEN TREATMENT MARKET, BY TREATMENT, 2021-2030 (USD MILLION)
TABLE 12 EUROPE OTHER TREATMENT IN SJS/TEN TREATMENT MARKET, BY TREATMENT, 2021-2030 (USD MILLION)
TABLE 13 EUROPE SUPPORT CARE IN SJS/TEN TREATMENT MARKET, BY REGION, 2021-2030 (USD MILLION)
TABLE 14 EUROPE SUPPORT CARE IN SJS/TEN TREATMENT MARKET, BY TREATMENT, 2021-2030 (USD MILLION)
TABLE 15 EUROPE PAIN MANAGEMENT IN SJS/TEN TREATMENT MARKET, BY TREATMENT, 2021-2030 (USD MILLION)
TABLE 16 EUROPE BANDAGES IN SJS/TEN TREATMENT MARKET, BY TREATMENT, 2021-2030 (USD MILLION)
TABLE 17 EUROPE BIOLOGICAL DRESSING IN SJS/TEN TREATMENT MARKET, BY TREATMENT, 2021-2030 (USD MILLION)
TABLE 18 EUROPE HOSPITALIZATION IN SJS/TEN TREATMENT MARKET, BY REGION, 2021-2030 (USD MILLION)
TABLE 19 EUROPE ISOLATION IN SJS/TEN TREATMENT MARKET, BY REGION, 2021-2030 (USD MILLION)
TABLE 20 EUROPE OINTMENTS IN JS/TEN TREATMENT MARKET, BY REGION, 2021-2030 (USD MILLION)
TABLE 21 EUROPE OINTMENTS IN SJS/TEN TREATMENT MARKET, BY TREATMENT, 2021-2030 (USD MILLION)
TABLE 22 EUROPE OTHERS IN SJS/TEN TREATMENT MARKET, BY REGION, 2021-2030 (USD MILLION)
TABLE 23 EUROPE SJS/TEN TREATMENT MARKET, BY DIAGNOSIS, 2021-2030 (USD MILLION)
TABLE 24 EUROPE PHYSICAL EXAM IN SJS/TEN TREATMENT MARKET, BY REGION, 2021-2030 (USD MILLION)
TABLE 25 EUROPE SKIN BIOPSY IN SJS/TEN TREATMENT MARKET, BY REGION, 2021-2030 (USD MILLION)
TABLE 26 EUROPE MEDICAL HISTORY IN SJS/TEN TREATMENT MARKET, BY REGION, 2021-2030 (USD MILLION)
TABLE 27 EUROPE BLOOD TEST IN SJS/TEN TREATMENT MARKET, BY REGION, 2021-2030 (USD MILLION)
TABLE 28 EUROPE BLOOD TEST IN SJS/TEN TREATMENT MARKET, BY TREATMENT, 2021-2030 (USD MILLION)
TABLE 29 EUROPE CULTURES IN SJS/TEN TREATMENT MARKET, BY REGION, 2021-2030 (USD MILLION)
TABLE 30 EUROPE OTHERS IN SJS/TEN TREATMENT MARKET, BY REGION, 2021-2030 (USD MILLION)
TABLE 31 EUROPE SJS/TEN TREATMENT MARKET, BY CAUSE, 2021-2030 (USD MILLION)
TABLE 32 EUROPE SPECIFIC TREATMENT IN SJS/TEN TREATMENT MARKET, BY REGION, 2021-2030 (USD MILLION)
TABLE 33 EUROPE INFECTION IN SJS/TEN TREATMENT MARKET, BY REGION, 2021-2030 (USD MILLION)
TABLE 34 EUROPE OTHERS IN SJS/TEN TREATMENT MARKET, BY REGION, 2021-2030 (USD MILLION)
TABLE 35 EUROPE SJS/TEN TREATMENT MARKET, BY CAUSE, 2021-2030 (USD MILLION)
TABLE 36 EUROPE ORAL IN SJS/TEN TREATMENT MARKET, BY REGION, 2021-2030 (USD MILLION)
TABLE 37 EUROPE PARENTERAL IN SJS/TEN TREATMENT MARKET, BY REGION, 2021-2030 (USD MILLION)
TABLE 38 EUROPE PARENTERAL IN SJS/TEN TREATMENT MARKET, BY TREATMENT, 2021-2030 (USD MILLION)
TABLE 39 EUROPE TOPICAL IN SJS/TEN TREATMENT MARKET, BY REGION, 2021-2030 (USD MILLION)
TABLE 40 EUROPE TOPICAL IN SJS/TEN TREATMENT MARKET, BY TREATMENT, 2021-2030 (USD MILLION)
TABLE 41 EUROPE OTHERS IN SJS/TEN TREATMENT MARKET, BY REGION, 2021-2030 (USD MILLION)
TABLE 42 EUROPE SJS/TEN TREATMENT MARKET, BY DRUG TYPE, 2021-2030 (USD MILLION)
TABLE 43 EUROPE BRANDED IN SJS/TEN TREATMENT MARKET, BY REGION, 2021-2030 (USD MILLION)
TABLE 44 EUROPE BRANDED IN SJS/TEN TREATMENT MARKET, BY TREATMENT, 2021-2030 (USD MILLION)
TABLE 45 EUROPE GENERIC IN SJS/TEN TREATMENT MARKET, BY REGION, 2021-2030 (USD MILLION)
TABLE 46 EUROPE SJS/TEN TREATMENT MARKET, BY CAUSE, 2021-2030 (USD MILLION)
TABLE 47 EUROPE COMBINATION THERAPY IN SJS/TEN TREATMENT MARKET, BY REGION, 2021-2030 (USD MILLION)
TABLE 48 EUROPE MONOTHERAPY IN SJS/TEN TREATMENT MARKET, BY REGION, 2021-2030 (USD MILLION)
TABLE 49 EUROPE SJS/TEN TREATMENT MARKET, BY CAUSE, 2021-2030 (USD MILLION)
TABLE 50 EUROPE GERAITRIC IN SJS/TEN TREATMENT MARKET, BY REGION, 2021-2030 (USD MILLION)
TABLE 51 EUROPE GERIATRIC IN SJS/TEN TREATMENT MARKET, BY TREATMENT, 2021-2030 (USD MILLION)
TABLE 52 EUROPE ADULT IN SJS/TEN TREATMENT MARKET, BY REGION, 2021-2030 (USD MILLION)
TABLE 53 EUROPE ADULT IN SJS/TEN TREATMENT MARKET, BY TREATMENT, 2021-2030 (USD MILLION)
TABLE 54 EUROPE PEDIATRIC IN SJS/TEN TREATMENT MARKET, BY REGION, 2021-2030 (USD MILLION)
TABLE 55 EUROPE SJS/TEN TREATMENT MARKET, BY END USER, 2021-2030 (USD MILLION)
TABLE 56 EUROPE HOSPITALS IN SJS/TEN TREATMENT MARKET, BY REGION, 2021-2030 (USD MILLION)
TABLE 57 EUROPE SPECIALTY CLINICS IN SJS/TEN TREATMENT MARKET, BY REGION, 2021-2030 (USD MILLION)
TABLE 58 EUROPE AMBULATORY SURGICAL CENTER IN SJS/TEN TREATMENT MARKET, BY REGION, 2021-2030 (USD MILLION)
TABLE 59 EUROPE HOMECARE SETTING IN SJS/TEN TREATMENT MARKET, BY REGION, 2021-2030 (USD MILLION)
TABLE 60 EUROPE OTHERS IN SJS/TEN TREATMENT MARKET, BY REGION, 2021-2030 (USD MILLION)
TABLE 61 EUROPE SJS/TEN TREATMENT MARKET, BY DISTRIBUTION CHANNEL, 2021-2030 (USD MILLION)
TABLE 62 EUROPE RETAIL PHARMACIES IN SJS/TEN TREATMENT MARKET, BY REGION, 2021-2030 (USD MILLION)
TABLE 63 EUROPE RETAIL PHARMACIES IN SJS/TEN TREATMENT MARKET, BY TREATMENT, 2021-2030 (USD MILLION)
TABLE 64 EUROPE DIRECT TENDERS IN SJS/TEN TREATMENT MARKET, BY REGION, 2021-2030 (USD MILLION)
TABLE 65 EUROPE OTHERS IN SJS/TEN TREATMENT MARKET, BY REGION, 2021-2030 (USD MILLION)
TABLE 66 EUROPE SJS/TEN TREATMENT MARKET, BY COUNTRY, 2021-2030 (USD MILLION)
TABLE 67 EUROPE SJS/TEN TREATMENT MARKET, BY TREATMENT, 2021-2030 (USD MILLION)
TABLE 68 EUROPE MEDICATIONS IN SJS/TEN TREATMENT MARKET, BY TREATMENT, 2021-2030 (USD MILLION)
TABLE 69 EUROPE ANTIHISTAMINES IN SJS/TEN TREATMENT MARKET, BY TREATMENT, 2021-2030 (USD MILLION)
TABLE 70 EUROPE CORTICOSTEROID IN SJS/TEN TREATMENT MARKET, BY TREATMENT, 2021-2030 (USD MILLION)
TABLE 71 EUROPE ANTIBIOTICS IN SJS/TEN TREATMENT MARKET, BY TREATMENT, 2021-2030 (USD MILLION)
TABLE 72 EUROPE ANALGESICS IN SJS/TEN TREATMENT MARKET, BY TREATMENT, 2021-2030 (USD MILLION)
TABLE 73 EUROPE ANTISEPTICS IN SJS/TEN TREATMENT MARKET, BY TREATMENT, 2021-2030 (USD MILLION)
TABLE 74 EUROPE CHLORHEXIDINE GLUCONATE IN SJS/TEN TREATMENT MARKET, BY TREATMENT, 2021-2030 (USD MILLION)
TABLE 75 EUROPE CYCLOSPORINE IN SJS/TEN TREATMENT MARKET, BY TREATMENT, 2021-2030 (USD MILLION)
TABLE 76 EUROPE OTHER TREATMENT IN SJS/TEN TREATMENT MARKET, BY TREATMENT, 2021-2030 (USD MILLION)
TABLE 77 EUROPE SUPPORT CARE IN SJS/TEN TREATMENT MARKET, BY TREATMENT, 2021-2030 (USD MILLION)
TABLE 78 EUROPE PAIN MANAGEMENT IN SJS/TEN TREATMENT MARKET, BY TREATMENT, 2021-2030 (USD MILLION)
TABLE 79 EUROPE BANDAGES IN SJS/TEN TREATMENT MARKET, BY TREATMENT, 2021-2030 (USD MILLION)
TABLE 80 EUROPE BIOLOGICAL DRESSING IN SJS/TEN TREATMENT MARKET, BY TREATMENT, 2021-2030 (USD MILLION)
TABLE 81 EUROPE OINTMENTS IN SJS/TEN TREATMENT MARKET, BY TREATMENT, 2021-2030 (USD MILLION)
TABLE 82 EUROPE SJS/TEN TREATMENT MARKET, BY DIAGNOSIS, 2021-2030 (USD MILLION)
TABLE 83 EUROPE BLOOD TEST IN SJS/TEN TREATMENT MARKET, BY DIAGNOSIS, 2021-2030 (USD MILLION)
TABLE 84 EUROPE SJS/TEN TREATMENT MARKET, BY CAUSE, 2021-2030 (USD MILLION)
TABLE 85 EUROPE SJS/TEN TREATMENT MARKET, BY ROUTE OF ADMINISTRATION, 2021-2030 (USD MILLION)
TABLE 86 EUROPE PARENTERAL IN SJS/TEN TREATMENT MARKET, BY ROUTE OF ADMINISTRATION, 2021-2030 (USD MILLION)
TABLE 87 EUROPE TOPICAL IN SJS/TEN TREATMENT MARKET, BY ROUTE OF ADMINISTRATION, 2021-2030 (USD MILLION)
TABLE 88 EUROPE SJS/TEN TREATMENT MARKET, BY DRUG TYPE, 2021-2030 (USD MILLION)
TABLE 89 EUROPE BRANDED IN SJS/TEN TREATMENT MARKET, BY DRUG TYPE, 2021-2030 (USD MILLION)
TABLE 90 EUROPE SJS/TEN TREATMENT MARKET, BY THERAPY AREA, 2021-2030 (USD MILLION)
TABLE 91 EUROPE SJS/TEN TREATMENT MARKET, BY PATIENT TYPE, 2021-2030 (USD MILLION)
TABLE 92 EUROPE GERIATRIC IN SJS/TEN TREATMENT MARKET, BY GENDER, 2021-2030 (USD MILLION)
TABLE 93 EUROPE ADULT IN SJS/TEN TREATMENT MARKET, BY GENDER, 2021-2030 (USD MILLION)
TABLE 94 EUROPE SJS/TEN TREATMENT MARKET, BY END USER, 2021-2030 (USD MILLION)
TABLE 95 EUROPE SJS/TEN TREATMENT MARKET, BY DISTRIBUTION CHANNEL, 2021-2030 (USD MILLION)
TABLE 96 EUROPE RETAIL PHARMACIES IN SJS/TEN TREATMENT MARKET, BY DISTRIBUTION CHANNEL, 2021-2030 (USD MILLION)
TABLE 97 GERMANY SJS/TEN TREATMENT MARKET, BY TREATMENT, 2021-2030 (USD MILLION)
TABLE 98 GERMANY MEDICATIONS IN SJS/TEN TREATMENT MARKET, BY TREATMENT, 2021-2030 (USD MILLION)
TABLE 99 GERMANY ANTIHISTAMINES IN SJS/TEN TREATMENT MARKET, BY TREATMENT, 2021-2030 (USD MILLION)
TABLE 100 GERMANY CORTICOSTEROID IN SJS/TEN TREATMENT MARKET, BY TREATMENT, 2021-2030 (USD MILLION)
TABLE 101 GERMANY ANTIBIOTICS IN SJS/TEN TREATMENT MARKET, BY TREATMENT, 2021-2030 (USD MILLION)
TABLE 102 GERMANY ANALGESICS IN SJS/TEN TREATMENT MARKET, BY TREATMENT, 2021-2030 (USD MILLION)
TABLE 103 GERMANY ANTISEPTICS IN SJS/TEN TREATMENT MARKET, BY TREATMENT, 2021-2030 (USD MILLION)
TABLE 104 GERMANY CHLORHEXIDINE GLUCONATE IN SJS/TEN TREATMENT MARKET, BY TREATMENT, 2021-2030 (USD MILLION)
TABLE 105 GERMANY CYCLOSPORINE IN SJS/TEN TREATMENT MARKET, BY TREATMENT, 2021-2030 (USD MILLION)
TABLE 106 GERMANY OTHER TREATMENT IN SJS/TEN TREATMENT MARKET, BY TREATMENT, 2021-2030 (USD MILLION)
TABLE 107 GERMANY SUPPORT CARE IN SJS/TEN TREATMENT MARKET, BY TREATMENT, 2021-2030 (USD MILLION)
TABLE 108 GERMANY PAIN MANAGEMENT IN SJS/TEN TREATMENT MARKET, BY TREATMENT, 2021-2030 (USD MILLION)
TABLE 109 GERMANY BANDAGES IN SJS/TEN TREATMENT MARKET, BY TREATMENT, 2021-2030 (USD MILLION)
TABLE 110 GERMANY BIOLOGICAL DRESSING IN SJS/TEN TREATMENT MARKET, BY TREATMENT, 2021-2030 (USD MILLION)
TABLE 111 GERMANY OINTMENTS IN SJS/TEN TREATMENT MARKET, BY TREATMENT, 2021-2030 (USD MILLION)
TABLE 112 GERMANY SJS/TEN TREATMENT MARKET, BY DIAGNOSIS, 2021-2030 (USD MILLION)
TABLE 113 GERMANY BLOOD TEST IN SJS/TEN TREATMENT MARKET, BY DIAGNOSIS, 2021-2030 (USD MILLION)
TABLE 114 GERMANY SJS/TEN TREATMENT MARKET, BY CAUSE, 2021-2030 (USD MILLION)
TABLE 115 GERMANY SJS/TEN TREATMENT MARKET, BY ROUTE OF ADMINISTRATION, 2021-2030 (USD MILLION)
TABLE 116 GERMANY PARENTERAL IN SJS/TEN TREATMENT MARKET, BY ROUTE OF ADMINISTRATION, 2021-2030 (USD MILLION)
TABLE 117 GERMANY TOPICAL IN SJS/TEN TREATMENT MARKET, BY ROUTE OF ADMINISTRATION, 2021-2030 (USD MILLION)
TABLE 118 GERMANY SJS/TEN TREATMENT MARKET, BY DRUG TYPE, 2021-2030 (USD MILLION)
TABLE 119 GERMANY BRANDED IN SJS/TEN TREATMENT MARKET, BY DRUG TYPE, 2021-2030 (USD MILLION)
TABLE 120 GERMANY SJS/TEN TREATMENT MARKET, BY THERAPY AREA, 2021-2030 (USD MILLION)
TABLE 121 GERMANY SJS/TEN TREATMENT MARKET, BY PATIENT TYPE, 2021-2030 (USD MILLION)
TABLE 122 GERMANY GERIATRIC IN SJS/TEN TREATMENT MARKET, BY GENDER, 2021-2030 (USD MILLION)
TABLE 123 GERMANY ADULT IN SJS/TEN TREATMENT MARKET, BY GENDER, 2021-2030 (USD MILLION)
TABLE 124 GERMANY SJS/TEN TREATMENT MARKET, BY END USER, 2021-2030 (USD MILLION)
TABLE 125 GERMANY SJS/TEN TREATMENT MARKET, BY DISTRIBUTION CHANNEL, 2021-2030 (USD MILLION)
TABLE 126 GERMANY RETAIL PHARMACIES IN SJS/TEN TREATMENT MARKET, BY DISTRIBUTION CHANNEL, 2021-2030 (USD MILLION)
TABLE 127 FRANCE SJS/TEN TREATMENT MARKET, BY TREATMENT, 2021-2030 (USD MILLION)
TABLE 128 FRANCE MEDICATIONS IN SJS/TEN TREATMENT MARKET, BY TREATMENT, 2021-2030 (USD MILLION)
TABLE 129 FRANCE ANTIHISTAMINES IN SJS/TEN TREATMENT MARKET, BY TREATMENT, 2021-2030 (USD MILLION)
TABLE 130 FRANCE CORTICOSTEROID IN SJS/TEN TREATMENT MARKET, BY TREATMENT, 2021-2030 (USD MILLION)
TABLE 131 FRANCE ANTIBIOTICS IN SJS/TEN TREATMENT MARKET, BY TREATMENT, 2021-2030 (USD MILLION)
TABLE 132 FRANCE ANALGESICS IN SJS/TEN TREATMENT MARKET, BY TREATMENT, 2021-2030 (USD MILLION)
TABLE 133 FRANCE ANTISEPTICS IN SJS/TEN TREATMENT MARKET, BY TREATMENT, 2021-2030 (USD MILLION)
TABLE 134 FRANCE CHLORHEXIDINE GLUCONATE IN SJS/TEN TREATMENT MARKET, BY TREATMENT, 2021-2030 (USD MILLION)
TABLE 135 FRANCE CYCLOSPORINE IN SJS/TEN TREATMENT MARKET, BY TREATMENT, 2021-2030 (USD MILLION)
TABLE 136 FRANCE OTHER TREATMENT IN SJS/TEN TREATMENT MARKET, BY TREATMENT, 2021-2030 (USD MILLION)
TABLE 137 FRANCE SUPPORT CARE IN SJS/TEN TREATMENT MARKET, BY TREATMENT, 2021-2030 (USD MILLION)
TABLE 138 FRANCE PAIN MANAGEMENT IN SJS/TEN TREATMENT MARKET, BY TREATMENT, 2021-2030 (USD MILLION)
TABLE 139 FRANCE BANDAGES IN SJS/TEN TREATMENT MARKET, BY TREATMENT, 2021-2030 (USD MILLION)
TABLE 140 FRANCE BIOLOGICAL DRESSING IN SJS/TEN TREATMENT MARKET, BY TREATMENT, 2021-2030 (USD MILLION)
TABLE 141 FRANCE OINTMENTS IN SJS/TEN TREATMENT MARKET, BY TREATMENT, 2021-2030 (USD MILLION)
TABLE 142 FRANCE SJS/TEN TREATMENT MARKET, BY DIAGNOSIS, 2021-2030 (USD MILLION)
TABLE 143 FRANCE BLOOD TEST IN SJS/TEN TREATMENT MARKET, BY DIAGNOSIS, 2021-2030 (USD MILLION)
TABLE 144 FRANCE SJS/TEN TREATMENT MARKET, BY CAUSE, 2021-2030 (USD MILLION)
TABLE 145 FRANCE SJS/TEN TREATMENT MARKET, BY ROUTE OF ADMINISTRATION, 2021-2030 (USD MILLION)
TABLE 146 FRANCE PARENTERAL IN SJS/TEN TREATMENT MARKET, BY ROUTE OF ADMINISTRATION, 2021-2030 (USD MILLION)
TABLE 147 FRANCE TOPICAL IN SJS/TEN TREATMENT MARKET, BY ROUTE OF ADMINISTRATION, 2021-2030 (USD MILLION)
TABLE 148 FRANCE SJS/TEN TREATMENT MARKET, BY DRUG TYPE, 2021-2030 (USD MILLION)
TABLE 149 FRANCE BRANDED IN SJS/TEN TREATMENT MARKET, BY DRUG TYPE, 2021-2030 (USD MILLION)
TABLE 150 FRANCE SJS/TEN TREATMENT MARKET, BY THERAPY AREA, 2021-2030 (USD MILLION)
TABLE 151 FRANCE SJS/TEN TREATMENT MARKET, BY PATIENT TYPE, 2021-2030 (USD MILLION)
TABLE 152 FRANCE GERIATRIC IN SJS/TEN TREATMENT MARKET, BY GENDER, 2021-2030 (USD MILLION)
TABLE 153 FRANCE ADULT IN SJS/TEN TREATMENT MARKET, BY GENDER, 2021-2030 (USD MILLION)
TABLE 154 FRANCE SJS/TEN TREATMENT MARKET, BY END USER, 2021-2030 (USD MILLION)
TABLE 155 FRANCE SJS/TEN TREATMENT MARKET, BY DISTRIBUTION CHANNEL, 2021-2030 (USD MILLION)
TABLE 156 FRANCE RETAIL PHARMACIES IN SJS/TEN TREATMENT MARKET, BY DISTRIBUTION CHANNEL, 2021-2030 (USD MILLION)
TABLE 157 U.K. SJS/TEN TREATMENT MARKET, BY TREATMENT, 2021-2030 (USD MILLION)
TABLE 158 U.K. MEDICATIONS IN SJS/TEN TREATMENT MARKET, BY TREATMENT, 2021-2030 (USD MILLION)
TABLE 159 U.K. ANTIHISTAMINES IN SJS/TEN TREATMENT MARKET, BY TREATMENT, 2021-2030 (USD MILLION)
TABLE 160 U.K. CORTICOSTEROID IN SJS/TEN TREATMENT MARKET, BY TREATMENT, 2021-2030 (USD MILLION)
TABLE 161 U.K. ANTIBIOTICS IN SJS/TEN TREATMENT MARKET, BY TREATMENT, 2021-2030 (USD MILLION)
TABLE 162 U.K. ANALGESICS IN SJS/TEN TREATMENT MARKET, BY TREATMENT, 2021-2030 (USD MILLION)
TABLE 163 U.K. ANTISEPTICS IN SJS/TEN TREATMENT MARKET, BY TREATMENT, 2021-2030 (USD MILLION)
TABLE 164 U.K. CHLORHEXIDINE GLUCONATE IN SJS/TEN TREATMENT MARKET, BY TREATMENT, 2021-2030 (USD MILLION)
TABLE 165 U.K. CYCLOSPORINE IN SJS/TEN TREATMENT MARKET, BY TREATMENT, 2021-2030 (USD MILLION)
TABLE 166 U.K. OTHER TREATMENT IN SJS/TEN TREATMENT MARKET, BY TREATMENT, 2021-2030 (USD MILLION)
TABLE 167 U.K. SUPPORT CARE IN SJS/TEN TREATMENT MARKET, BY TREATMENT, 2021-2030 (USD MILLION)
TABLE 168 U.K. PAIN MANAGEMENT IN SJS/TEN TREATMENT MARKET, BY TREATMENT, 2021-2030 (USD MILLION)
TABLE 169 U.K. BANDAGES IN SJS/TEN TREATMENT MARKET, BY TREATMENT, 2021-2030 (USD MILLION)
TABLE 170 U.K. BIOLOGICAL DRESSING IN SJS/TEN TREATMENT MARKET, BY TREATMENT, 2021-2030 (USD MILLION)
TABLE 171 U.K. OINTMENTS IN SJS/TEN TREATMENT MARKET, BY TREATMENT, 2021-2030 (USD MILLION)
TABLE 172 U.K. SJS/TEN TREATMENT MARKET, BY DIAGNOSIS, 2021-2030 (USD MILLION)
TABLE 173 U.K. BLOOD TEST IN SJS/TEN TREATMENT MARKET, BY DIAGNOSIS, 2021-2030 (USD MILLION)
TABLE 174 U.K. SJS/TEN TREATMENT MARKET, BY CAUSE, 2021-2030 (USD MILLION)
TABLE 175 U.K. SJS/TEN TREATMENT MARKET, BY ROUTE OF ADMINISTRATION, 2021-2030 (USD MILLION)
TABLE 176 U.K. PARENTERAL IN SJS/TEN TREATMENT MARKET, BY ROUTE OF ADMINISTRATION, 2021-2030 (USD MILLION)
TABLE 177 U.K. TOPICAL IN SJS/TEN TREATMENT MARKET, BY ROUTE OF ADMINISTRATION, 2021-2030 (USD MILLION)
TABLE 178 U.K. SJS/TEN TREATMENT MARKET, BY DRUG TYPE, 2021-2030 (USD MILLION)
TABLE 179 U.K. BRANDED IN SJS/TEN TREATMENT MARKET, BY DRUG TYPE, 2021-2030 (USD MILLION)
TABLE 180 U.K. SJS/TEN TREATMENT MARKET, BY THERAPY AREA, 2021-2030 (USD MILLION)
TABLE 181 U.K. SJS/TEN TREATMENT MARKET, BY PATIENT TYPE, 2021-2030 (USD MILLION)
TABLE 182 U.K. GERIATRIC IN SJS/TEN TREATMENT MARKET, BY GENDER, 2021-2030 (USD MILLION)
TABLE 183 U.K. ADULT IN SJS/TEN TREATMENT MARKET, BY GENDER, 2021-2030 (USD MILLION)
TABLE 184 U.K. SJS/TEN TREATMENT MARKET, BY END USER, 2021-2030 (USD MILLION)
TABLE 185 U.K. SJS/TEN TREATMENT MARKET, BY DISTRIBUTION CHANNEL, 2021-2030 (USD MILLION)
TABLE 186 U.K. RETAIL PHARMACIES IN SJS/TEN TREATMENT MARKET, BY DISTRIBUTION CHANNEL, 2021-2030 (USD MILLION)
TABLE 187 ITALY SJS/TEN TREATMENT MARKET, BY TREATMENT, 2021-2030 (USD MILLION)
TABLE 188 ITALY MEDICATIONS IN SJS/TEN TREATMENT MARKET, BY TREATMENT, 2021-2030 (USD MILLION)
TABLE 189 ITALY ANTIHISTAMINES IN SJS/TEN TREATMENT MARKET, BY TREATMENT, 2021-2030 (USD MILLION)
TABLE 190 ITALY CORTICOSTEROID IN SJS/TEN TREATMENT MARKET, BY TREATMENT, 2021-2030 (USD MILLION)
TABLE 191 ITALY ANTIBIOTICS IN SJS/TEN TREATMENT MARKET, BY TREATMENT, 2021-2030 (USD MILLION)
TABLE 192 ITALY ANALGESICS IN SJS/TEN TREATMENT MARKET, BY TREATMENT, 2021-2030 (USD MILLION)
TABLE 193 ITALY ANTISEPTICS IN SJS/TEN TREATMENT MARKET, BY TREATMENT, 2021-2030 (USD MILLION)
TABLE 194 ITALY CHLORHEXIDINE GLUCONATE IN SJS/TEN TREATMENT MARKET, BY TREATMENT, 2021-2030 (USD MILLION)
TABLE 195 ITALY CYCLOSPORINE IN SJS/TEN TREATMENT MARKET, BY TREATMENT, 2021-2030 (USD MILLION)
TABLE 196 ITALY OTHER TREATMENT IN SJS/TEN TREATMENT MARKET, BY TREATMENT, 2021-2030 (USD MILLION)
TABLE 197 ITALY SUPPORT CARE IN SJS/TEN TREATMENT MARKET, BY TREATMENT, 2021-2030 (USD MILLION)
TABLE 198 ITALY PAIN MANAGEMENT IN SJS/TEN TREATMENT MARKET, BY TREATMENT, 2021-2030 (USD MILLION)
TABLE 199 ITALY BANDAGES IN SJS/TEN TREATMENT MARKET, BY TREATMENT, 2021-2030 (USD MILLION)
TABLE 200 ITALY BIOLOGICAL DRESSING IN SJS/TEN TREATMENT MARKET, BY TREATMENT, 2021-2030 (USD MILLION)
TABLE 201 ITALY OINTMENTS IN SJS/TEN TREATMENT MARKET, BY TREATMENT, 2021-2030 (USD MILLION)
TABLE 202 ITALY SJS/TEN TREATMENT MARKET, BY DIAGNOSIS, 2021-2030 (USD MILLION)
TABLE 203 ITALY BLOOD TEST IN SJS/TEN TREATMENT MARKET, BY DIAGNOSIS, 2021-2030 (USD MILLION)
TABLE 204 ITALY SJS/TEN TREATMENT MARKET, BY CAUSE, 2021-2030 (USD MILLION)
TABLE 205 ITALY SJS/TEN TREATMENT MARKET, BY ROUTE OF ADMINISTRATION, 2021-2030 (USD MILLION)
TABLE 206 ITALY PARENTERAL IN SJS/TEN TREATMENT MARKET, BY ROUTE OF ADMINISTRATION, 2021-2030 (USD MILLION)
TABLE 207 ITALY TOPICAL IN SJS/TEN TREATMENT MARKET, BY ROUTE OF ADMINISTRATION, 2021-2030 (USD MILLION)
TABLE 208 ITALY SJS/TEN TREATMENT MARKET, BY DRUG TYPE, 2021-2030 (USD MILLION)
TABLE 209 ITALY BRANDED IN SJS/TEN TREATMENT MARKET, BY DRUG TYPE, 2021-2030 (USD MILLION)
TABLE 210 ITALY SJS/TEN TREATMENT MARKET, BY THERAPY AREA, 2021-2030 (USD MILLION)
TABLE 211 ITALY SJS/TEN TREATMENT MARKET, BY PATIENT TYPE, 2021-2030 (USD MILLION)
TABLE 212 ITALY GERIATRIC IN SJS/TEN TREATMENT MARKET, BY GENDER, 2021-2030 (USD MILLION)
TABLE 213 ITALY ADULT IN SJS/TEN TREATMENT MARKET, BY GENDER, 2021-2030 (USD MILLION)
TABLE 214 ITALY SJS/TEN TREATMENT MARKET, BY END USER, 2021-2030 (USD MILLION)
TABLE 215 ITALY SJS/TEN TREATMENT MARKET, BY DISTRIBUTION CHANNEL, 2021-2030 (USD MILLION)
TABLE 216 ITALY RETAIL PHARMACIES IN SJS/TEN TREATMENT MARKET, BY DISTRIBUTION CHANNEL, 2021-2030 (USD MILLION)
TABLE 217 SPAIN SJS/TEN TREATMENT MARKET, BY TREATMENT, 2021-2030 (USD MILLION)
TABLE 218 SPAIN MEDICATIONS IN SJS/TEN TREATMENT MARKET, BY TREATMENT, 2021-2030 (USD MILLION)
TABLE 219 SPAIN ANTIHISTAMINES IN SJS/TEN TREATMENT MARKET, BY TREATMENT, 2021-2030 (USD MILLION)
TABLE 220 SPAIN CORTICOSTEROID IN SJS/TEN TREATMENT MARKET, BY TREATMENT, 2021-2030 (USD MILLION)
TABLE 221 SPAIN ANTIBIOTICS IN SJS/TEN TREATMENT MARKET, BY TREATMENT, 2021-2030 (USD MILLION)
TABLE 222 SPAIN ANALGESICS IN SJS/TEN TREATMENT MARKET, BY TREATMENT, 2021-2030 (USD MILLION)
TABLE 223 SPAIN ANTISEPTICS IN SJS/TEN TREATMENT MARKET, BY TREATMENT, 2021-2030 (USD MILLION)
TABLE 224 SPAIN CHLORHEXIDINE GLUCONATE IN SJS/TEN TREATMENT MARKET, BY TREATMENT, 2021-2030 (USD MILLION)
TABLE 225 SPAIN CYCLOSPORINE IN SJS/TEN TREATMENT MARKET, BY TREATMENT, 2021-2030 (USD MILLION)
TABLE 226 SPAIN OTHER TREATMENT IN SJS/TEN TREATMENT MARKET, BY TREATMENT, 2021-2030 (USD MILLION)
TABLE 227 SPAIN SUPPORT CARE IN SJS/TEN TREATMENT MARKET, BY TREATMENT, 2021-2030 (USD MILLION)
TABLE 228 SPAIN PAIN MANAGEMENT IN SJS/TEN TREATMENT MARKET, BY TREATMENT, 2021-2030 (USD MILLION)
TABLE 229 SPAIN BANDAGES IN SJS/TEN TREATMENT MARKET, BY TREATMENT, 2021-2030 (USD MILLION)
TABLE 230 SPAIN BIOLOGICAL DRESSING IN SJS/TEN TREATMENT MARKET, BY TREATMENT, 2021-2030 (USD MILLION)
TABLE 231 SPAIN OINTMENTS IN SJS/TEN TREATMENT MARKET, BY TREATMENT, 2021-2030 (USD MILLION)
TABLE 232 SPAIN SJS/TEN TREATMENT MARKET, BY DIAGNOSIS, 2021-2030 (USD MILLION)
TABLE 233 SPAIN BLOOD TEST IN SJS/TEN TREATMENT MARKET, BY DIAGNOSIS, 2021-2030 (USD MILLION)
TABLE 234 SPAIN SJS/TEN TREATMENT MARKET, BY CAUSE, 2021-2030 (USD MILLION)
TABLE 235 SPAIN SJS/TEN TREATMENT MARKET, BY ROUTE OF ADMINISTRATION, 2021-2030 (USD MILLION)
TABLE 236 SPAIN PARENTERAL IN SJS/TEN TREATMENT MARKET, BY ROUTE OF ADMINISTRATION, 2021-2030 (USD MILLION)
TABLE 237 SPAIN TOPICAL IN SJS/TEN TREATMENT MARKET, BY ROUTE OF ADMINISTRATION, 2021-2030 (USD MILLION)
TABLE 238 SPAIN SJS/TEN TREATMENT MARKET, BY DRUG TYPE, 2021-2030 (USD MILLION)
TABLE 239 SPAIN BRANDED IN SJS/TEN TREATMENT MARKET, BY DRUG TYPE, 2021-2030 (USD MILLION)
TABLE 240 SPAIN SJS/TEN TREATMENT MARKET, BY PATIENT TYPE, 2021-2030 (USD MILLION)
TABLE 241 SPAIN GERIATRIC IN SJS/TEN TREATMENT MARKET, BY GENDER, 2021-2030 (USD MILLION)
TABLE 242 SPAIN ADULT IN SJS/TEN TREATMENT MARKET, BY GENDER, 2021-2030 (USD MILLION)
TABLE 243 SPAIN SJS/TEN TREATMENT MARKET, BY END USER, 2021-2030 (USD MILLION)
TABLE 244 SPAIN SJS/TEN TREATMENT MARKET, BY END USER, 2021-2030 (USD MILLION)
TABLE 245 SPAIN RETAIL PHARMACIES IN SJS/TEN TREATMENT MARKET, BY END USER, 2021-2030 (USD MILLION)
TABLE 246 RUSSIA SJS/TEN TREATMENT MARKET, BY TREATMENT, 2021-2030 (USD MILLION)
TABLE 247 RUSSIA MEDICATIONS IN SJS/TEN TREATMENT MARKET, BY TREATMENT, 2021-2030 (USD MILLION)
TABLE 248 RUSSIA ANTIHISTAMINES IN SJS/TEN TREATMENT MARKET, BY TREATMENT, 2021-2030 (USD MILLION)
TABLE 249 RUSSIA CORTICOSTEROID IN SJS/TEN TREATMENT MARKET, BY TREATMENT, 2021-2030 (USD MILLION)
TABLE 250 RUSSIA ANTIBIOTICS IN SJS/TEN TREATMENT MARKET, BY TREATMENT, 2021-2030 (USD MILLION)
TABLE 251 RUSSIA ANALGESICS IN SJS/TEN TREATMENT MARKET, BY TREATMENT, 2021-2030 (USD MILLION)
TABLE 252 RUSSIA ANTISEPTICS IN SJS/TEN TREATMENT MARKET, BY TREATMENT, 2021-2030 (USD MILLION)
TABLE 253 RUSSIA CHLORHEXIDINE GLUCONATE IN SJS/TEN TREATMENT MARKET, BY TREATMENT, 2021-2030 (USD MILLION)
TABLE 254 RUSSIA CYCLOSPORINE IN SJS/TEN TREATMENT MARKET, BY TREATMENT, 2021-2030 (USD MILLION)
TABLE 255 RUSSIA OTHER TREATMENT IN SJS/TEN TREATMENT MARKET, BY TREATMENT, 2021-2030 (USD MILLION)
TABLE 256 RUSSIA SUPPORT CARE IN SJS/TEN TREATMENT MARKET, BY TREATMENT, 2021-2030 (USD MILLION)
TABLE 257 RUSSIA PAIN MANAGEMENT IN SJS/TEN TREATMENT MARKET, BY TREATMENT, 2021-2030 (USD MILLION)
TABLE 258 RUSSIA BANDAGES IN SJS/TEN TREATMENT MARKET, BY TREATMENT, 2021-2030 (USD MILLION)
TABLE 259 RUSSIA BIOLOGICAL DRESSING IN SJS/TEN TREATMENT MARKET, BY TREATMENT, 2021-2030 (USD MILLION)
TABLE 260 RUSSIA OINTMENTS IN SJS/TEN TREATMENT MARKET, BY TREATMENT, 2021-2030 (USD MILLION)
TABLE 261 RUSSIA SJS/TEN TREATMENT MARKET, BY DIAGNOSIS, 2021-2030 (USD MILLION)
TABLE 262 RUSSIA BLOOD TEST IN SJS/TEN TREATMENT MARKET, BY DIAGNOSIS, 2021-2030 (USD MILLION)
TABLE 263 RUSSIA SJS/TEN TREATMENT MARKET, BY CAUSE, 2021-2030 (USD MILLION)
TABLE 264 RUSSIA SJS/TEN TREATMENT MARKET, BY ROUTE OF ADMINISTRATION, 2021-2030 (USD MILLION)
TABLE 265 RUSSIA PARENTERAL IN SJS/TEN TREATMENT MARKET, BY ROUTE OF ADMINISTRATION, 2021-2030 (USD MILLION)
TABLE 266 RUSSIA TOPICAL IN SJS/TEN TREATMENT MARKET, BY ROUTE OF ADMINISTRATION, 2021-2030 (USD MILLION)
TABLE 267 RUSSIA SJS/TEN TREATMENT MARKET, BY DRUG TYPE, 2021-2030 (USD MILLION)
TABLE 268 RUSSIA BRANDED IN SJS/TEN TREATMENT MARKET, BY DRUG TYPE, 2021-2030 (USD MILLION)
TABLE 269 RUSSIA SJS/TEN TREATMENT MARKET, BY THERAPY AREA, 2021-2030 (USD MILLION)
TABLE 270 RUSSIA SJS/TEN TREATMENT MARKET, BY PATIENT TYPE, 2021-2030 (USD MILLION)
TABLE 271 RUSSIA GERIATRIC IN SJS/TEN TREATMENT MARKET, BY GENDER, 2021-2030 (USD MILLION)
TABLE 272 RUSSIA ADULT IN SJS/TEN TREATMENT MARKET, BY GENDER, 2021-2030 (USD MILLION)
TABLE 273 RUSSIA SJS/TEN TREATMENT MARKET, BY END USER, 2021-2030 (USD MILLION)
TABLE 274 RUSSIA SJS/TEN TREATMENT MARKET, BY DISTRIBUTION CHANNEL, 2021-2030 (USD MILLION)
TABLE 275 RUSSIA RETAIL PHARMACIES IN SJS/TEN TREATMENT MARKET, BY DISTRIBUTION CHANNEL, 2021-2030 (USD MILLION)
TABLE 276 TURKEY SJS/TEN TREATMENT MARKET, BY TREATMENT, 2021-2030 (USD MILLION)
TABLE 277 TURKEY MEDICATIONS IN SJS/TEN TREATMENT MARKET, BY TREATMENT, 2021-2030 (USD MILLION)
TABLE 278 TURKEY ANTIHISTAMINES IN SJS/TEN TREATMENT MARKET, BY TREATMENT, 2021-2030 (USD MILLION)
TABLE 279 TURKEY CORTICOSTEROID IN SJS/TEN TREATMENT MARKET, BY TREATMENT, 2021-2030 (USD MILLION)
TABLE 280 TURKEY ANTIBIOTICS IN SJS/TEN TREATMENT MARKET, BY TREATMENT, 2021-2030 (USD MILLION)
TABLE 281 TURKEY ANALGESICS IN SJS/TEN TREATMENT MARKET, BY TREATMENT, 2021-2030 (USD MILLION)
TABLE 282 TURKEY ANTISEPTICS IN SJS/TEN TREATMENT MARKET, BY TREATMENT, 2021-2030 (USD MILLION)
TABLE 283 TURKEY CHLORHEXIDINE GLUCONATE IN SJS/TEN TREATMENT MARKET, BY TREATMENT, 2021-2030 (USD MILLION)
TABLE 284 TURKEY CYCLOSPORINE IN SJS/TEN TREATMENT MARKET, BY TREATMENT, 2021-2030 (USD MILLION)
TABLE 285 TURKEY OTHER TREATMENT IN SJS/TEN TREATMENT MARKET, BY TREATMENT, 2021-2030 (USD MILLION)
TABLE 286 TURKEY SUPPORT CARE IN SJS/TEN TREATMENT MARKET, BY TREATMENT, 2021-2030 (USD MILLION)
TABLE 287 TURKEY PAIN MANAGEMENT IN SJS/TEN TREATMENT MARKET, BY TREATMENT, 2021-2030 (USD MILLION)
TABLE 288 TURKEY BANDAGES IN SJS/TEN TREATMENT MARKET, BY TREATMENT, 2021-2030 (USD MILLION)
TABLE 289 TURKEY BIOLOGICAL DRESSING IN SJS/TEN TREATMENT MARKET, BY TREATMENT, 2021-2030 (USD MILLION)
TABLE 290 TURKEY OINTMENTS IN SJS/TEN TREATMENT MARKET, BY TREATMENT, 2021-2030 (USD MILLION)
TABLE 291 TURKEY SJS/TEN TREATMENT MARKET, BY DIAGNOSIS, 2021-2030 (USD MILLION)
TABLE 292 TURKEY BLOOD TEST IN SJS/TEN TREATMENT MARKET, BY DIAGNOSIS, 2021-2030 (USD MILLION)
TABLE 293 TURKEY SJS/TEN TREATMENT MARKET, BY CAUSE, 2021-2030 (USD MILLION)
TABLE 294 TURKEY SJS/TEN TREATMENT MARKET, BY ROUTE OF ADMINISTRATION, 2021-2030 (USD MILLION)
TABLE 295 TURKEY PARENTERAL IN SJS/TEN TREATMENT MARKET, BY ROUTE OF ADMINISTRATION, 2021-2030 (USD MILLION)
TABLE 296 TURKEY TOPICAL IN SJS/TEN TREATMENT MARKET, BY ROUTE OF ADMINISTRATION, 2021-2030 (USD MILLION)
TABLE 297 TURKEY SJS/TEN TREATMENT MARKET, BY DRUG TYPE, 2021-2030 (USD MILLION)
TABLE 298 TURKEY BRANDED IN SJS/TEN TREATMENT MARKET, BY DRUG TYPE, 2021-2030 (USD MILLION)
TABLE 299 TURKEY SJS/TEN TREATMENT MARKET, BY THERAPY AREA, 2021-2030 (USD MILLION)
TABLE 300 TURKEY SJS/TEN TREATMENT MARKET, BY PATIENT TYPE, 2021-2030 (USD MILLION)
TABLE 301 TURKEY GERIATRIC IN SJS/TEN TREATMENT MARKET, BY GENDER, 2021-2030 (USD MILLION)
TABLE 302 TURKEY ADULT IN SJS/TEN TREATMENT MARKET, BY GENDER, 2021-2030 (USD MILLION)
TABLE 303 TURKEY SJS/TEN TREATMENT MARKET, BY END USER, 2021-2030 (USD MILLION)
TABLE 304 TURKEY SJS/TEN TREATMENT MARKET, BY DISTRIBUTION CHANNEL, 2021-2030 (USD MILLION)
TABLE 305 TURKEY RETAIL PHARMACIES IN SJS/TEN TREATMENT MARKET, BY DISTRIBUTION CHANNEL, 2021-2030 (USD MILLION)
TABLE 306 BELGIUM SJS/TEN TREATMENT MARKET, BY TREATMENT, 2021-2030 (USD MILLION)
TABLE 307 BELGIUM MEDICATIONS IN SJS/TEN TREATMENT MARKET, BY TREATMENT, 2021-2030 (USD MILLION)
TABLE 308 BELGIUM ANTIHISTAMINES IN SJS/TEN TREATMENT MARKET, BY TREATMENT, 2021-2030 (USD MILLION)
TABLE 309 BELGIUM CORTICOSTEROID IN SJS/TEN TREATMENT MARKET, BY TREATMENT, 2021-2030 (USD MILLION)
TABLE 310 BELGIUM ANTIBIOTICS IN SJS/TEN TREATMENT MARKET, BY TREATMENT, 2021-2030 (USD MILLION)
TABLE 311 BELGIUM ANALGESICS IN SJS/TEN TREATMENT MARKET, BY TREATMENT, 2021-2030 (USD MILLION)
TABLE 312 BELGIUM ANTISEPTICS IN SJS/TEN TREATMENT MARKET, BY TREATMENT, 2021-2030 (USD MILLION)
TABLE 313 BELGIUM CHLORHEXIDINE GLUCONATE IN SJS/TEN TREATMENT MARKET, BY TREATMENT, 2021-2030 (USD MILLION)
TABLE 314 BELGIUM CYCLOSPORINE IN SJS/TEN TREATMENT MARKET, BY TREATMENT, 2021-2030 (USD MILLION)
TABLE 315 BELGIUM OTHER TREATMENT IN SJS/TEN TREATMENT MARKET, BY TREATMENT, 2021-2030 (USD MILLION)
TABLE 316 BELGIUM SUPPORT CARE IN SJS/TEN TREATMENT MARKET, BY TREATMENT, 2021-2030 (USD MILLION)
TABLE 317 BELGIUM PAIN MANAGEMENT IN SJS/TEN TREATMENT MARKET, BY TREATMENT, 2021-2030 (USD MILLION)
TABLE 318 BELGIUM BANDAGES IN SJS/TEN TREATMENT MARKET, BY TREATMENT, 2021-2030 (USD MILLION)
TABLE 319 BELGIUM BIOLOGICAL DRESSING IN SJS/TEN TREATMENT MARKET, BY TREATMENT, 2021-2030 (USD MILLION)
TABLE 320 BELGIUM OINTMENTS IN SJS/TEN TREATMENT MARKET, BY TREATMENT, 2021-2030 (USD MILLION)
TABLE 321 BELGIUM SJS/TEN TREATMENT MARKET, BY DIAGNOSIS, 2021-2030 (USD MILLION)
TABLE 322 BELGIUM BLOOD TEST IN SJS/TEN TREATMENT MARKET, BY DIAGNOSIS, 2021-2030 (USD MILLION)
TABLE 323 BELGIUM SJS/TEN TREATMENT MARKET, BY CAUSE, 2021-2030 (USD MILLION)
TABLE 324 BELGIUM SJS/TEN TREATMENT MARKET, BY ROUTE OF ADMINISTRATION, 2021-2030 (USD MILLION)
TABLE 325 BELGIUM PARENTERAL IN SJS/TEN TREATMENT MARKET, BY ROUTE OF ADMINISTRATION, 2021-2030 (USD MILLION)
TABLE 326 BELGIUM TOPICAL IN SJS/TEN TREATMENT MARKET, BY ROUTE OF ADMINISTRATION, 2021-2030 (USD MILLION)
TABLE 327 BELGIUM SJS/TEN TREATMENT MARKET, BY DRUG TYPE, 2021-2030 (USD MILLION)
TABLE 328 BELGIUM BRANDED IN SJS/TEN TREATMENT MARKET, BY DRUG TYPE, 2021-2030 (USD MILLION)
TABLE 329 BELGIUM SJS/TEN TREATMENT MARKET, BY THERAPY AREA, 2021-2030 (USD MILLION)
TABLE 330 BELGIUM SJS/TEN TREATMENT MARKET, BY PATIENT TYPE, 2021-2030 (USD MILLION)
TABLE 331 BELGIUM GERIATRIC IN SJS/TEN TREATMENT MARKET, BY GENDER, 2021-2030 (USD MILLION)
TABLE 332 BELGIUM ADULT IN SJS/TEN TREATMENT MARKET, BY GENDER, 2021-2030 (USD MILLION)
TABLE 333 BELGIUM SJS/TEN TREATMENT MARKET, BY END USER, 2021-2030 (USD MILLION)
TABLE 334 BELGIUM SJS/TEN TREATMENT MARKET, BY DISTRIBUTION CHANNEL, 2021-2030 (USD MILLION)
TABLE 335 BELGIUM RETAIL PHARMACIES IN SJS/TEN TREATMENT MARKET, BY DISTRIBUTION CHANNEL, 2021-2030 (USD MILLION)
TABLE 336 DENMARK SJS/TEN TREATMENT MARKET, BY TREATMENT, 2021-2030 (USD MILLION)
TABLE 337 DENMARK MEDICATIONS IN SJS/TEN TREATMENT MARKET, BY TREATMENT, 2021-2030 (USD MILLION)
TABLE 338 DENMARK ANTIHISTAMINES IN SJS/TEN TREATMENT MARKET, BY TREATMENT, 2021-2030 (USD MILLION)
TABLE 339 DENMARK CORTICOSTEROID IN SJS/TEN TREATMENT MARKET, BY TREATMENT, 2021-2030 (USD MILLION)
TABLE 340 DENMARK ANTIBIOTICS IN SJS/TEN TREATMENT MARKET, BY TREATMENT, 2021-2030 (USD MILLION)
TABLE 341 DENMARK ANALGESICS IN SJS/TEN TREATMENT MARKET, BY TREATMENT, 2021-2030 (USD MILLION)
TABLE 342 DENMARK ANTISEPTICS IN SJS/TEN TREATMENT MARKET, BY TREATMENT, 2021-2030 (USD MILLION)
TABLE 343 DENMARK CHLORHEXIDINE GLUCONATE IN SJS/TEN TREATMENT MARKET, BY TREATMENT, 2021-2030 (USD MILLION)
TABLE 344 DENMARK CYCLOSPORINE IN SJS/TEN TREATMENT MARKET, BY TREATMENT, 2021-2030 (USD MILLION)
TABLE 345 DENMARK OTHER TREATMENT IN SJS/TEN TREATMENT MARKET, BY TREATMENT, 2021-2030 (USD MILLION)
TABLE 346 DENMARK SUPPORT CARE IN SJS/TEN TREATMENT MARKET, BY TREATMENT, 2021-2030 (USD MILLION)
TABLE 347 DENMARK PAIN MANAGEMENT IN SJS/TEN TREATMENT MARKET, BY TREATMENT, 2021-2030 (USD MILLION)
TABLE 348 DENMARK BANDAGES IN SJS/TEN TREATMENT MARKET, BY TREATMENT, 2021-2030 (USD MILLION)
TABLE 349 DENMARK BIOLOGICAL DRESSING IN SJS/TEN TREATMENT MARKET, BY TREATMENT, 2021-2030 (USD MILLION)
TABLE 350 DENMARK OINTMENTS IN SJS/TEN TREATMENT MARKET, BY TREATMENT, 2021-2030 (USD MILLION)
TABLE 351 DENMARK SJS/TEN TREATMENT MARKET, BY DIAGNOSIS, 2021-2030 (USD MILLION)
TABLE 352 DENMARK BLOOD TEST IN SJS/TEN TREATMENT MARKET, BY DIAGNOSIS, 2021-2030 (USD MILLION)
TABLE 353 DENMARK SJS/TEN TREATMENT MARKET, BY CAUSE, 2021-2030 (USD MILLION)
TABLE 354 DENMARK SJS/TEN TREATMENT MARKET, BY ROUTE OF ADMINISTRATION, 2021-2030 (USD MILLION)
TABLE 355 DENMARK PARENTERAL IN SJS/TEN TREATMENT MARKET, BY ROUTE OF ADMINISTRATION, 2021-2030 (USD MILLION)
TABLE 356 DENMARK TOPICAL IN SJS/TEN TREATMENT MARKET, BY ROUTE OF ADMINISTRATION, 2021-2030 (USD MILLION)
TABLE 357 DENMARK SJS/TEN TREATMENT MARKET, BY DRUG TYPE, 2021-2030 (USD MILLION)
TABLE 358 DENMARK BRANDED IN SJS/TEN TREATMENT MARKET, BY DRUG TYPE, 2021-2030 (USD MILLION)
TABLE 359 DENMARK SJS/TEN TREATMENT MARKET, BY THERAPY AREA, 2021-2030 (USD MILLION)
TABLE 360 DENMARK SJS/TEN TREATMENT MARKET, BY PATIENT TYPE, 2021-2030 (USD MILLION)
TABLE 361 DENMARK GERIATRIC IN SJS/TEN TREATMENT MARKET, BY GENDER, 2021-2030 (USD MILLION)
TABLE 362 DENMARK ADULT IN SJS/TEN TREATMENT MARKET, BY GENDER, 2021-2030 (USD MILLION)
TABLE 363 DENMARK SJS/TEN TREATMENT MARKET, BY END USER, 2021-2030 (USD MILLION)
TABLE 364 DENMARK SJS/TEN TREATMENT MARKET, BY DISTRIBUTION CHANNEL, 2021-2030 (USD MILLION)
TABLE 365 DENMARK RETAIL PHARMACIES IN SJS/TEN TREATMENT MARKET, BY DISTRIBUTION CHANNEL, 2021-2030 (USD MILLION)
TABLE 366 NETHERLANDS SJS/TEN TREATMENT MARKET, BY TREATMENT, 2021-2030 (USD MILLION)
TABLE 367 NETHERLANDS MEDICATIONS IN SJS/TEN TREATMENT MARKET, BY TREATMENT, 2021-2030 (USD MILLION)
TABLE 368 NETHERLANDS ANTIHISTAMINES IN SJS/TEN TREATMENT MARKET, BY TREATMENT, 2021-2030 (USD MILLION)
TABLE 369 NETHERLANDS CORTICOSTEROID IN SJS/TEN TREATMENT MARKET, BY TREATMENT, 2021-2030 (USD MILLION)
TABLE 370 NETHERLANDS ANTIBIOTICS IN SJS/TEN TREATMENT MARKET, BY TREATMENT, 2021-2030 (USD MILLION)
TABLE 371 NETHERLANDS ANALGESICS IN SJS/TEN TREATMENT MARKET, BY TREATMENT, 2021-2030 (USD MILLION)
TABLE 372 NETHERLANDS ANTISEPTICS IN SJS/TEN TREATMENT MARKET, BY TREATMENT, 2021-2030 (USD MILLION)
TABLE 373 NETHERLANDS CHLORHEXIDINE GLUCONATE IN SJS/TEN TREATMENT MARKET, BY TREATMENT, 2021-2030 (USD MILLION)
TABLE 374 NETHERLANDS CYCLOSPORINE IN SJS/TEN TREATMENT MARKET, BY TREATMENT, 2021-2030 (USD MILLION)
TABLE 375 NETHERLANDS OTHER TREATMENT IN SJS/TEN TREATMENT MARKET, BY TREATMENT, 2021-2030 (USD MILLION)
TABLE 376 NETHERLANDS SUPPORT CARE IN SJS/TEN TREATMENT MARKET, BY TREATMENT, 2021-2030 (USD MILLION)
TABLE 377 NETHERLANDS PAIN MANAGEMENT IN SJS/TEN TREATMENT MARKET, BY TREATMENT, 2021-2030 (USD MILLION)
TABLE 378 NETHERLANDS BANDAGES IN SJS/TEN TREATMENT MARKET, BY TREATMENT, 2021-2030 (USD MILLION)
TABLE 379 NETHERLANDS BIOLOGICAL DRESSING IN SJS/TEN TREATMENT MARKET, BY TREATMENT, 2021-2030 (USD MILLION)
TABLE 380 NETHERLANDS OINTMENTS IN SJS/TEN TREATMENT MARKET, BY TREATMENT, 2021-2030 (USD MILLION)
TABLE 381 NETHERLANDS SJS/TEN TREATMENT MARKET, BY DIAGNOSIS, 2021-2030 (USD MILLION)
TABLE 382 NETHERLANDS BLOOD TEST IN SJS/TEN TREATMENT MARKET, BY DIAGNOSIS, 2021-2030 (USD MILLION)
TABLE 383 NETHERLANDS SJS/TEN TREATMENT MARKET, BY CAUSE, 2021-2030 (USD MILLION)
TABLE 384 NETHERLANDS SJS/TEN TREATMENT MARKET, BY ROUTE OF ADMINISTRATION, 2021-2030 (USD MILLION)
TABLE 385 NETHERLANDS PARENTERAL IN SJS/TEN TREATMENT MARKET, BY ROUTE OF ADMINISTRATION, 2021-2030 (USD MILLION)
TABLE 386 NETHERLANDS TOPICAL IN SJS/TEN TREATMENT MARKET, BY ROUTE OF ADMINISTRATION, 2021-2030 (USD MILLION)
TABLE 387 NETHERLANDS SJS/TEN TREATMENT MARKET, BY DRUG TYPE, 2021-2030 (USD MILLION)
TABLE 388 NETHERLANDS BRANDED IN SJS/TEN TREATMENT MARKET, BY DRUG TYPE, 2021-2030 (USD MILLION)
TABLE 389 NETHERLANDS SJS/TEN TREATMENT MARKET, BY THERAPY AREA, 2021-2030 (USD MILLION)
TABLE 390 NETHERLANDS SJS/TEN TREATMENT MARKET, BY PATIENT TYPE, 2021-2030 (USD MILLION)
TABLE 391 NETHERLANDS GERIATRIC IN SJS/TEN TREATMENT MARKET, BY GENDER, 2021-2030 (USD MILLION)
TABLE 392 NETHERLANDS ADULT IN SJS/TEN TREATMENT MARKET, BY GENDER, 2021-2030 (USD MILLION)
TABLE 393 NETHERLANDS SJS/TEN TREATMENT MARKET, BY END USER, 2021-2030 (USD MILLION)
TABLE 394 NETHERLANDS SJS/TEN TREATMENT MARKET, BY DISTRIBUTION CHANNEL, 2021-2030 (USD MILLION)
TABLE 395 NETHERLANDS RETAIL PHARMACIES IN SJS/TEN TREATMENT MARKET, BY DISTRIBUTION CHANNEL, 2021-2030 (USD MILLION)
TABLE 396 SWITZERLAND SJS/TEN TREATMENT MARKET, BY TREATMENT, 2021-2030 (USD MILLION)
TABLE 397 SWITZERLAND MEDICATIONS IN SJS/TEN TREATMENT MARKET, BY TREATMENT, 2021-2030 (USD MILLION)
TABLE 398 SWITZERLAND ANTIHISTAMINES IN SJS/TEN TREATMENT MARKET, BY TREATMENT, 2021-2030 (USD MILLION)
TABLE 399 SWITZERLAND CORTICOSTEROID IN SJS/TEN TREATMENT MARKET, BY TREATMENT, 2021-2030 (USD MILLION)
TABLE 400 SWITZERLAND ANTIBIOTICS IN SJS/TEN TREATMENT MARKET, BY TREATMENT, 2021-2030 (USD MILLION)
TABLE 401 SWITZERLAND ANALGESICS IN SJS/TEN TREATMENT MARKET, BY TREATMENT, 2021-2030 (USD MILLION)
TABLE 402 SWITZERLAND ANTISEPTICS IN SJS/TEN TREATMENT MARKET, BY TREATMENT, 2021-2030 (USD MILLION)
TABLE 403 SWITZERLAND CHLORHEXIDINE GLUCONATE IN SJS/TEN TREATMENT MARKET, BY TREATMENT, 2021-2030 (USD MILLION)
TABLE 404 SWITZERLAND CYCLOSPORINE IN SJS/TEN TREATMENT MARKET, BY TREATMENT, 2021-2030 (USD MILLION)
TABLE 405 SWITZERLAND OTHER TREATMENT IN SJS/TEN TREATMENT MARKET, BY TREATMENT, 2021-2030 (USD MILLION)
TABLE 406 SWITZERLAND SUPPORT CARE IN SJS/TEN TREATMENT MARKET, BY TREATMENT, 2021-2030 (USD MILLION)
TABLE 407 SWITZERLAND PAIN MANAGEMENT IN SJS/TEN TREATMENT MARKET, BY TREATMENT, 2021-2030 (USD MILLION)
TABLE 408 SWITZERLAND BANDAGES IN SJS/TEN TREATMENT MARKET, BY TREATMENT, 2021-2030 (USD MILLION)
TABLE 409 SWITZERLAND BIOLOGICAL DRESSING IN SJS/TEN TREATMENT MARKET, BY TREATMENT, 2021-2030 (USD MILLION)
TABLE 410 SWITZERLAND OINTMENTS IN SJS/TEN TREATMENT MARKET, BY TREATMENT, 2021-2030 (USD MILLION)
TABLE 411 SWITZERLAND SJS/TEN TREATMENT MARKET, BY DIAGNOSIS, 2021-2030 (USD MILLION)
TABLE 412 SWITZERLAND BLOOD TEST IN SJS/TEN TREATMENT MARKET, BY DIAGNOSIS, 2021-2030 (USD MILLION)
TABLE 413 SWITZERLAND SJS/TEN TREATMENT MARKET, BY CAUSE, 2021-2030 (USD MILLION)
TABLE 414 SWITZERLAND SJS/TEN TREATMENT MARKET, BY ROUTE OF ADMINISTRATION, 2021-2030 (USD MILLION)
TABLE 415 SWITZERLAND PARENTERAL IN SJS/TEN TREATMENT MARKET, BY ROUTE OF ADMINISTRATION, 2021-2030 (USD MILLION)
TABLE 416 SWITZERLAND TOPICAL IN SJS/TEN TREATMENT MARKET, BY ROUTE OF ADMINISTRATION, 2021-2030 (USD MILLION)
TABLE 417 SWITZERLAND SJS/TEN TREATMENT MARKET, BY DRUG TYPE, 2021-2030 (USD MILLION)
TABLE 418 SWITZERLAND BRANDED IN SJS/TEN TREATMENT MARKET, BY DRUG TYPE, 2021-2030 (USD MILLION)
TABLE 419 SWITZERLAND SJS/TEN TREATMENT MARKET, BY THERAPY AREA, 2021-2030 (USD MILLION)
TABLE 420 SWITZERLAND SJS/TEN TREATMENT MARKET, BY PATIENT TYPE, 2021-2030 (USD MILLION)
TABLE 421 SWITZERLAND GERIATRIC IN SJS/TEN TREATMENT MARKET, BY GENDER, 2021-2030 (USD MILLION)
TABLE 422 SWITZERLAND ADULT IN SJS/TEN TREATMENT MARKET, BY GENDER, 2021-2030 (USD MILLION)
TABLE 423 SWITZERLAND SJS/TEN TREATMENT MARKET, BY END USER, 2021-2030 (USD MILLION)
TABLE 424 SWITZERLAND SJS/TEN TREATMENT MARKET, BY DISTRIBUTION CHANNEL, 2021-2030 (USD MILLION)
TABLE 425 SWITZERLAND RETAIL PHARMACIES IN SJS/TEN TREATMENT MARKET, BY DISTRIBUTION CHANNEL, 2021-2030 (USD MILLION)
TABLE 426 SWEDEN SJS/TEN TREATMENT MARKET, BY TREATMENT, 2021-2030 (USD MILLION)
TABLE 427 SWEDEN MEDICATIONS IN SJS/TEN TREATMENT MARKET, BY TREATMENT, 2021-2030 (USD MILLION)
TABLE 428 SWEDEN ANTIHISTAMINES IN SJS/TEN TREATMENT MARKET, BY TREATMENT, 2021-2030 (USD MILLION)
TABLE 429 SWEDEN CORTICOSTEROID IN SJS/TEN TREATMENT MARKET, BY TREATMENT, 2021-2030 (USD MILLION)
TABLE 430 SWEDEN ANTIBIOTICS IN SJS/TEN TREATMENT MARKET, BY TREATMENT, 2021-2030 (USD MILLION)
TABLE 431 SWEDEN ANALGESICS IN SJS/TEN TREATMENT MARKET, BY TREATMENT, 2021-2030 (USD MILLION)
TABLE 432 SWEDEN ANTISEPTICS IN SJS/TEN TREATMENT MARKET, BY TREATMENT, 2021-2030 (USD MILLION)
TABLE 433 SWEDEN CHLORHEXIDINE GLUCONATE IN SJS/TEN TREATMENT MARKET, BY TREATMENT, 2021-2030 (USD MILLION)
TABLE 434 SWEDEN CYCLOSPORINE IN SJS/TEN TREATMENT MARKET, BY TREATMENT, 2021-2030 (USD MILLION)
TABLE 435 SWEDEN OTHER TREATMENT IN SJS/TEN TREATMENT MARKET, BY TREATMENT, 2021-2030 (USD MILLION)
TABLE 436 SWEDEN SUPPORT CARE IN SJS/TEN TREATMENT MARKET, BY TREATMENT, 2021-2030 (USD MILLION)
TABLE 437 SWEDEN PAIN MANAGEMENT IN SJS/TEN TREATMENT MARKET, BY TREATMENT, 2021-2030 (USD MILLION)
TABLE 438 SWEDEN BANDAGES IN SJS/TEN TREATMENT MARKET, BY TREATMENT, 2021-2030 (USD MILLION)
TABLE 439 SWEDEN BIOLOGICAL DRESSING IN SJS/TEN TREATMENT MARKET, BY TREATMENT, 2021-2030 (USD MILLION)
TABLE 440 SWEDEN OINTMENTS IN SJS/TEN TREATMENT MARKET, BY TREATMENT, 2021-2030 (USD MILLION)
TABLE 441 SWEDEN SJS/TEN TREATMENT MARKET, BY DIAGNOSIS, 2021-2030 (USD MILLION)
TABLE 442 SWEDEN BLOOD TEST IN SJS/TEN TREATMENT MARKET, BY DIAGNOSIS, 2021-2030 (USD MILLION)
TABLE 443 SWEDEN SJS/TEN TREATMENT MARKET, BY CAUSE, 2021-2030 (USD MILLION)
TABLE 444 SWEDEN SJS/TEN TREATMENT MARKET, BY ROUTE OF ADMINISTRATION, 2021-2030 (USD MILLION)
TABLE 445 SWEDEN PARENTERAL IN SJS/TEN TREATMENT MARKET, BY ROUTE OF ADMINISTRATION, 2021-2030 (USD MILLION)
TABLE 446 SWEDEN TOPICAL IN SJS/TEN TREATMENT MARKET, BY ROUTE OF ADMINISTRATION, 2021-2030 (USD MILLION)
TABLE 447 SWEDEN SJS/TEN TREATMENT MARKET, BY DRUG TYPE, 2021-2030 (USD MILLION)
TABLE 448 SWEDEN BRANDED IN SJS/TEN TREATMENT MARKET, BY DRUG TYPE, 2021-2030 (USD MILLION)
TABLE 449 SWEDEN SJS/TEN TREATMENT MARKET, BY THERAPY AREA, 2021-2030 (USD MILLION)
TABLE 450 SWEDEN SJS/TEN TREATMENT MARKET, BY PATIENT TYPE, 2021-2030 (USD MILLION)
TABLE 451 SWEDEN GERIATRIC IN SJS/TEN TREATMENT MARKET, BY GENDER, 2021-2030 (USD MILLION)
TABLE 452 SWEDEN ADULT IN SJS/TEN TREATMENT MARKET, BY GENDER, 2021-2030 (USD MILLION)
TABLE 453 SWEDEN SJS/TEN TREATMENT MARKET, BY END USER, 2021-2030 (USD MILLION)
TABLE 454 SWEDEN SJS/TEN TREATMENT MARKET, BY DISTRIBUTION CHANNEL, 2021-2030 (USD MILLION)
TABLE 455 SWEDEN RETAIL PHARMACIES IN SJS/TEN TREATMENT MARKET, BY DISTRIBUTION CHANNEL, 2021-2030 (USD MILLION)
TABLE 456 POLAND SJS/TEN TREATMENT MARKET, BY TREATMENT, 2021-2030 (USD MILLION)
TABLE 457 POLAND MEDICATIONS IN SJS/TEN TREATMENT MARKET, BY TREATMENT, 2021-2030 (USD MILLION)
TABLE 458 POLAND ANTIHISTAMINES IN SJS/TEN TREATMENT MARKET, BY TREATMENT, 2021-2030 (USD MILLION)
TABLE 459 POLAND CORTICOSTEROID IN SJS/TEN TREATMENT MARKET, BY TREATMENT, 2021-2030 (USD MILLION)
TABLE 460 POLAND ANTIBIOTICS IN SJS/TEN TREATMENT MARKET, BY TREATMENT, 2021-2030 (USD MILLION)
TABLE 461 POLAND ANALGESICS IN SJS/TEN TREATMENT MARKET, BY TREATMENT, 2021-2030 (USD MILLION)
TABLE 462 POLAND ANTISEPTICS IN SJS/TEN TREATMENT MARKET, BY TREATMENT, 2021-2030 (USD MILLION)
TABLE 463 POLAND CHLORHEXIDINE GLUCONATE IN SJS/TEN TREATMENT MARKET, BY TREATMENT, 2021-2030 (USD MILLION)
TABLE 464 POLAND CYCLOSPORINE IN SJS/TEN TREATMENT MARKET, BY TREATMENT, 2021-2030 (USD MILLION)
TABLE 465 POLAND OTHER TREATMENT IN SJS/TEN TREATMENT MARKET, BY TREATMENT, 2021-2030 (USD MILLION)
TABLE 466 POLAND SUPPORT CARE IN SJS/TEN TREATMENT MARKET, BY TREATMENT, 2021-2030 (USD MILLION)
TABLE 467 POLAND PAIN MANAGEMENT IN SJS/TEN TREATMENT MARKET, BY TREATMENT, 2021-2030 (USD MILLION)
TABLE 468 POLAND BANDAGES IN SJS/TEN TREATMENT MARKET, BY TREATMENT, 2021-2030 (USD MILLION)
TABLE 469 POLAND BIOLOGICAL DRESSING IN SJS/TEN TREATMENT MARKET, BY TREATMENT, 2021-2030 (USD MILLION)
TABLE 470 POLAND OINTMENTS IN SJS/TEN TREATMENT MARKET, BY TREATMENT, 2021-2030 (USD MILLION)
TABLE 471 POLAND SJS/TEN TREATMENT MARKET, BY DIAGNOSIS, 2021-2030 (USD MILLION)
TABLE 472 POLAND BLOOD TEST IN SJS/TEN TREATMENT MARKET, BY DIAGNOSIS, 2021-2030 (USD MILLION)
TABLE 473 POLAND SJS/TEN TREATMENT MARKET, BY CAUSE, 2021-2030 (USD MILLION)
TABLE 474 POLAND SJS/TEN TREATMENT MARKET, BY ROUTE OF ADMINISTRATION, 2021-2030 (USD MILLION)
TABLE 475 POLAND PARENTERAL IN SJS/TEN TREATMENT MARKET, BY ROUTE OF ADMINISTRATION, 2021-2030 (USD MILLION)
TABLE 476 POLAND TOPICAL IN SJS/TEN TREATMENT MARKET, BY ROUTE OF ADMINISTRATION, 2021-2030 (USD MILLION)
TABLE 477 POLAND SJS/TEN TREATMENT MARKET, BY DRUG TYPE, 2021-2030 (USD MILLION)
TABLE 478 POLAND BRANDED IN SJS/TEN TREATMENT MARKET, BY DRUG TYPE, 2021-2030 (USD MILLION)
TABLE 479 POLAND SJS/TEN TREATMENT MARKET, BY THERAPY AREA, 2021-2030 (USD MILLION)
TABLE 480 POLAND SJS/TEN TREATMENT MARKET, BY PATIENT TYPE, 2021-2030 (USD MILLION)
TABLE 481 POLAND GERIATRIC IN SJS/TEN TREATMENT MARKET, BY GENDER, 2021-2030 (USD MILLION)
TABLE 482 POLAND ADULT IN SJS/TEN TREATMENT MARKET, BY GENDER, 2021-2030 (USD MILLION)
TABLE 483 POLAND SJS/TEN TREATMENT MARKET, BY END USER, 2021-2030 (USD MILLION)
TABLE 484 POLAND SJS/TEN TREATMENT MARKET, BY DISTRIBUTION CHANNEL, 2021-2030 (USD MILLION)
TABLE 485 POLAND RETAIL PHARMACIES IN SJS/TEN TREATMENT MARKET, BY DISTRIBUTION CHANNEL, 2021-2030 (USD MILLION)
TABLE 486 NORWAY SJS/TEN TREATMENT MARKET, BY TREATMENT, 2021-2030 (USD MILLION)
TABLE 487 NORWAY MEDICATIONS IN SJS/TEN TREATMENT MARKET, BY TREATMENT, 2021-2030 (USD MILLION)
TABLE 488 NORWAY ANTIHISTAMINES IN SJS/TEN TREATMENT MARKET, BY TREATMENT, 2021-2030 (USD MILLION)
TABLE 489 NORWAY CORTICOSTEROID IN SJS/TEN TREATMENT MARKET, BY TREATMENT, 2021-2030 (USD MILLION)
TABLE 490 NORWAY ANTIBIOTICS IN SJS/TEN TREATMENT MARKET, BY TREATMENT, 2021-2030 (USD MILLION)
TABLE 491 NORWAY ANALGESICS IN SJS/TEN TREATMENT MARKET, BY TREATMENT, 2021-2030 (USD MILLION)
TABLE 492 NORWAY ANTISEPTICS IN SJS/TEN TREATMENT MARKET, BY TREATMENT, 2021-2030 (USD MILLION)
TABLE 493 NORWAY CHLORHEXIDINE GLUCONATE IN SJS/TEN TREATMENT MARKET, BY TREATMENT, 2021-2030 (USD MILLION)
TABLE 494 NORWAY CYCLOSPORINE IN SJS/TEN TREATMENT MARKET, BY TREATMENT, 2021-2030 (USD MILLION)
TABLE 495 NORWAY OTHER TREATMENT IN SJS/TEN TREATMENT MARKET, BY TREATMENT, 2021-2030 (USD MILLION)
TABLE 496 NORWAY SUPPORT CARE IN SJS/TEN TREATMENT MARKET, BY TREATMENT, 2021-2030 (USD MILLION)
TABLE 497 NORWAY PAIN MANAGEMENT IN SJS/TEN TREATMENT MARKET, BY TREATMENT, 2021-2030 (USD MILLION)
TABLE 498 NORWAY BANDAGES IN SJS/TEN TREATMENT MARKET, BY TREATMENT, 2021-2030 (USD MILLION)
TABLE 499 NORWAY BIOLOGICAL DRESSING IN SJS/TEN TREATMENT MARKET, BY TREATMENT, 2021-2030 (USD MILLION)
TABLE 500 NORWAY OINTMENTS IN SJS/TEN TREATMENT MARKET, BY TREATMENT, 2021-2030 (USD MILLION)
TABLE 501 NORWAY SJS/TEN TREATMENT MARKET, BY DIAGNOSIS, 2021-2030 (USD MILLION)
TABLE 502 NORWAY BLOOD TEST IN SJS/TEN TREATMENT MARKET, BY DIAGNOSIS, 2021-2030 (USD MILLION)
TABLE 503 NORWAY SJS/TEN TREATMENT MARKET, BY CAUSE, 2021-2030 (USD MILLION)
TABLE 504 NORWAY SJS/TEN TREATMENT MARKET, BY ROUTE OF ADMINISTRATION, 2021-2030 (USD MILLION)
TABLE 505 NORWAY PARENTERAL IN SJS/TEN TREATMENT MARKET, BY ROUTE OF ADMINISTRATION, 2021-2030 (USD MILLION)
TABLE 506 NORWAY TOPICAL IN SJS/TEN TREATMENT MARKET, BY ROUTE OF ADMINISTRATION, 2021-2030 (USD MILLION)
TABLE 507 NORWAY SJS/TEN TREATMENT MARKET, BY DRUG TYPE, 2021-2030 (USD MILLION)
TABLE 508 NORWAY BRANDED IN SJS/TEN TREATMENT MARKET, BY DRUG TYPE, 2021-2030 (USD MILLION)
TABLE 509 NORWAY SJS/TEN TREATMENT MARKET, BY THERAPY AREA, 2021-2030 (USD MILLION)
TABLE 510 NORWAY SJS/TEN TREATMENT MARKET, BY PATIENT TYPE, 2021-2030 (USD MILLION)
TABLE 511 NORWAY GERIATRIC IN SJS/TEN TREATMENT MARKET, BY GENDER, 2021-2030 (USD MILLION)
TABLE 512 NORWAY ADULT IN SJS/TEN TREATMENT MARKET, BY GENDER, 2021-2030 (USD MILLION)
TABLE 513 NORWAY SJS/TEN TREATMENT MARKET, BY END USER, 2021-2030 (USD MILLION)
TABLE 514 NORWAY SJS/TEN TREATMENT MARKET, BY DISTRIBUTION CHANNEL, 2021-2030 (USD MILLION)
TABLE 515 NORWAY RETAIL PHARMACIES IN SJS/TEN TREATMENT MARKET, BY DISTRIBUTION CHANNEL, 2021-2030 (USD MILLION)
TABLE 516 FINLAND SJS/TEN TREATMENT MARKET, BY TREATMENT, 2021-2030 (USD MILLION)
TABLE 517 FINLAND MEDICATIONS IN SJS/TEN TREATMENT MARKET, BY TREATMENT, 2021-2030 (USD MILLION)
TABLE 518 FINLAND ANTIHISTAMINES IN SJS/TEN TREATMENT MARKET, BY TREATMENT, 2021-2030 (USD MILLION)
TABLE 519 FINLAND CORTICOSTEROID IN SJS/TEN TREATMENT MARKET, BY TREATMENT, 2021-2030 (USD MILLION)
TABLE 520 FINLAND ANTIBIOTICS IN SJS/TEN TREATMENT MARKET, BY TREATMENT, 2021-2030 (USD MILLION)
TABLE 521 FINLAND ANALGESICS IN SJS/TEN TREATMENT MARKET, BY TREATMENT, 2021-2030 (USD MILLION)
TABLE 522 FINLAND ANTISEPTICS IN SJS/TEN TREATMENT MARKET, BY TREATMENT, 2021-2030 (USD MILLION)
TABLE 523 FINLAND CHLORHEXIDINE GLUCONATE IN SJS/TEN TREATMENT MARKET, BY TREATMENT, 2021-2030 (USD MILLION)
TABLE 524 FINLAND CYCLOSPORINE IN SJS/TEN TREATMENT MARKET, BY TREATMENT, 2021-2030 (USD MILLION)
TABLE 525 FINLAND OTHER TREATMENT IN SJS/TEN TREATMENT MARKET, BY TREATMENT, 2021-2030 (USD MILLION)
TABLE 526 FINLAND SUPPORT CARE IN SJS/TEN TREATMENT MARKET, BY TREATMENT, 2021-2030 (USD MILLION)
TABLE 527 FINLAND PAIN MANAGEMENT IN SJS/TEN TREATMENT MARKET, BY TREATMENT, 2021-2030 (USD MILLION)
TABLE 528 FINLAND BANDAGES IN SJS/TEN TREATMENT MARKET, BY TREATMENT, 2021-2030 (USD MILLION)
TABLE 529 FINLAND BIOLOGICAL DRESSING IN SJS/TEN TREATMENT MARKET, BY TREATMENT, 2021-2030 (USD MILLION)
TABLE 530 FINLAND OINTMENTS IN SJS/TEN TREATMENT MARKET, BY TREATMENT, 2021-2030 (USD MILLION)
TABLE 531 FINLAND SJS/TEN TREATMENT MARKET, BY DIAGNOSIS, 2021-2030 (USD MILLION)
TABLE 532 FINLAND BLOOD TEST IN SJS/TEN TREATMENT MARKET, BY DIAGNOSIS, 2021-2030 (USD MILLION)
TABLE 533 FINLAND SJS/TEN TREATMENT MARKET, BY CAUSE, 2021-2030 (USD MILLION)
TABLE 534 FINLAND SJS/TEN TREATMENT MARKET, BY ROUTE OF ADMINISTRATION, 2021-2030 (USD MILLION)
TABLE 535 FINLAND PARENTERAL IN SJS/TEN TREATMENT MARKET, BY ROUTE OF ADMINISTRATION, 2021-2030 (USD MILLION)
TABLE 536 FINLAND TOPICAL IN SJS/TEN TREATMENT MARKET, BY ROUTE OF ADMINISTRATION, 2021-2030 (USD MILLION)
TABLE 537 FINLAND SJS/TEN TREATMENT MARKET, BY DRUG TYPE, 2021-2030 (USD MILLION)
TABLE 538 FINLAND BRANDED IN SJS/TEN TREATMENT MARKET, BY DRUG TYPE, 2021-2030 (USD MILLION)
TABLE 539 FINLAND SJS/TEN TREATMENT MARKET, BY THERAPY AREA, 2021-2030 (USD MILLION)
TABLE 540 FINLAND SJS/TEN TREATMENT MARKET, BY PATIENT TYPE, 2021-2030 (USD MILLION)
TABLE 541 FINLAND GERIATRIC IN SJS/TEN TREATMENT MARKET, BY GENDER, 2021-2030 (USD MILLION)
TABLE 542 FINLAND ADULT IN SJS/TEN TREATMENT MARKET, BY GENDER, 2021-2030 (USD MILLION)
TABLE 543 FINLAND SJS/TEN TREATMENT MARKET, BY END USER, 2021-2030 (USD MILLION)
TABLE 544 FINLAND SJS/TEN TREATMENT MARKET, BY DISTRIBUTION CHANNEL, 2021-2030 (USD MILLION)
TABLE 545 FINLAND RETAIL PHARMACIES IN SJS/TEN TREATMENT MARKET, BY DISTRIBUTION CHANNEL, 2021-2030 (USD MILLION)
TABLE 546 REST OF EUROPE SJS/TEN TREATMENT MARKET, BY TREATMENT, 2021-2030 (USD MILLION)
Lista de figuras
FIGURE 1 EUROPE SJS/TEN TREATMENT MARKET: SEGMENTATION
FIGURE 2 EUROPE SJS/TEN TREATMENT MARKET: DATA TRIANGULATION
FIGURE 3 EUROPE SJS/TEN TREATMENT MARKET: DROC ANALYSIS
FIGURE 4 EUROPE SJS/TEN TREATMENT MARKET: EUROPE VS REGIONAL MARKET ANALYSIS
FIGURE 5 EUROPE SJS/TEN TREATMENT MARKET: COMPANY RESEARCH ANALYSIS
FIGURE 6 EUROPE SJS/TEN TREATMENT MARKET: INTERVIEW DEMOGRAPHICS
FIGURE 7 EUROPE SJS/TEN TREATMENT MARKET: DBMR MARKET POSITION GRID
FIGURE 8 EUROPE SJS/TEN TREATMENT MARKET: MARKET APPLICATION COVERAGE GRID
FIGURE 9 EUROPE SJS/TEN TREATMENT MARKET: VENDOR SHARE ANALYSIS
FIGURE 10 EUROPE SJS/TEN TREATMENT MARKET: SEGMENTATION
FIGURE 11 INCREASING PREVALENCE AND INCIDENCE OF SJS/TEN ARE EXPECTED TO DRIVE THE EUROPE SJS/TEN TREATMENT MARKET IN THE FORECAST PERIOD FROM 2023 TO 2030
FIGURE 12 THE MEDICATION SEGMENT IS EXPECTED TO ACCOUNT FOR THE LARGEST SHARE OF THE EUROPE SJS/TEN TREATMENT MARKET IN THE FORECAST PERIOD OF 2023 & 2030
FIGURE 13 DRIVERS, RESTRAINTS, OPPORTUNITIES, AND CHALLENGES OF THE EUROPE SJS/TEN TREATMENT MARKET
FIGURE 14 EUROPE SJS/TEN TREATMENT MARKET: BY TREATMENT, 2022
FIGURE 15 EUROPE SJS/TEN TREATMENT MARKET: BY TREATMENT, 2023-2030 (USD MILLION)
FIGURE 16 EUROPE SJS/TEN TREATMENT MARKET: BY TREATMENT, CAGR (2023-2030)
FIGURE 17 EUROPE SJS/TEN TREATMENT MARKET: BY TREATMENT, LIFELINE CURVE
FIGURE 18 EUROPE SJS/TEN TREATMENT MARKET: BY DIAGNOSIS, 2022
FIGURE 19 EUROPE SJS/TEN TREATMENT MARKET: BY DIAGNOSIS, 2023-2030 (USD MILLION)
FIGURE 20 EUROPE SJS/TEN TREATMENT MARKET: BY DIAGNOSIS, CAGR (2023-2030)
FIGURE 21 EUROPE SJS/TEN TREATMENT MARKET: BY DIAGNOSIS, LIFELINE CURVE
FIGURE 22 EUROPE SJS/TEN TREATMENT MARKET: BY CAUSE, 2022
FIGURE 23 EUROPE SJS/TEN TREATMENT MARKET: BY CAUSE, 2023-2030 (USD MILLION)
FIGURE 24 EUROPE SJS/TEN TREATMENT MARKET: BY CAUSE, CAGR (2023-2030)
FIGURE 25 EUROPE SJS/TEN TREATMENT MARKET: BY CAUSE, LIFELINE CURVE
FIGURE 26 EUROPE SJS/TEN TREATMENT MARKET: BY ROUTE OF ADMINISTRATION, 2022
FIGURE 27 EUROPE SJS/TEN TREATMENT MARKET: BY ROUTE OF ADMINISTRATION, 2023-2030 (USD MILLION)
FIGURE 28 EUROPE SJS/TEN TREATMENT MARKET: BY ROUTE OF ADMINISTRATION, CAGR (2023-2030)
FIGURE 29 EUROPE SJS/TEN TREATMENT MARKET: BY ROUTE OF ADMINISTRATION, LIFELINE CURVE
FIGURE 30 EUROPE SJS/TEN TREATMENT MARKET: BY DRUG TYPE, 2022
FIGURE 31 EUROPE SJS/TEN TREATMENT MARKET: BY DRUG TYPE, 2023-2030 (USD MILLION)
FIGURE 32 EUROPE SJS/TEN TREATMENT MARKET: BY DRUG TYPE, CAGR (2023-2030)
FIGURE 33 EUROPE SJS/TEN TREATMENT MARKET: BY DRUG TYPE, LIFELINE CURVE
FIGURE 34 EUROPE SJS/TEN TREATMENT MARKET: BY THERAPY AREA, 2022
FIGURE 35 EUROPE SJS/TEN TREATMENT MARKET: BY THERAPY AREA, 2023-2030 (USD MILLION)
FIGURE 36 EUROPE SJS/TEN TREATMENT MARKET: BY THERAPY AREA, CAGR (2023-2030)
FIGURE 37 EUROPE SJS/TEN TREATMENT MARKET: BY THERAPY AREA, LIFELINE CURVE
FIGURE 38 EUROPE SJS/TEN TREATMENT MARKET: BY PATIENT TYPE, 2022
FIGURE 39 EUROPE SJS/TEN TREATMENT MARKET: BY PATIENT TYPE, 2023-2030 (USD MILLION)
FIGURE 40 EUROPE SJS/TEN TREATMENT MARKET: BY PATIENT TYPE, CAGR (2023-2030)
FIGURE 41 EUROPE SJS/TEN TREATMENT MARKET: BY PATIENT TYPE, LIFELINE CURVE
FIGURE 42 EUROPE SJS/TEN TREATMENT MARKET: BY END USER, 2022
FIGURE 43 EUROPE SJS/TEN TREATMENT MARKET: BY END USER, 2023-2030 (USD MILLION)
FIGURE 44 EUROPE SJS/TEN TREATMENT MARKET: BY END USER, CAGR (2023-2030)
FIGURE 45 EUROPE SJS/TEN TREATMENT MARKET: BY END USER, LIFELINE CURVE
FIGURE 46 EUROPE SJS/TEN TREATMENT MARKET: BY DISTRIBUTION CHANNEL, 2022
FIGURE 47 EUROPE SJS/TEN TREATMENT MARKET: BY DISTRIBUTION CHANNEL, 2023-2030 (USD MILLION)
FIGURE 48 EUROPE SJS/TEN TREATMENT MARKET: BY DISTRIBUTION CHANNEL, CAGR (2023-2030)
FIGURE 49 EUROPE SJS/TEN TREATMENT MARKET: BY DISTRIBUTION CHANNEL, LIFELINE CURVE
FIGURE 50 EUROPE SJS/TEN TREATMENT MARKET: SNAPSHOT (2022)
FIGURE 51 EUROPE SJS/TEN TREATMENT MARKET: BY COUNTRY (2022)
FIGURE 52 EUROPE SJS/TEN TREATMENT MARKET: BY COUNTRY (2023 & 2030)
FIGURE 53 EUROPE SJS/TEN TREATMENT MARKET: BY COUNTRY (2022 & 2030)
FIGURE 54 EUROPE SJS/TEN TREATMENT MARKET: BY TREATMENT (2023-2030)
FIGURE 55 EUROPE SJS/TEN TREATMENT MARKET: COMPANY SHARE 2022 (%)
Metodología de investigación
La recopilación de datos y el análisis del año base se realizan utilizando módulos de recopilación de datos con muestras de gran tamaño. La etapa incluye la obtención de información de mercado o datos relacionados a través de varias fuentes y estrategias. Incluye el examen y la planificación de todos los datos adquiridos del pasado con antelación. Asimismo, abarca el examen de las inconsistencias de información observadas en diferentes fuentes de información. Los datos de mercado se analizan y estiman utilizando modelos estadísticos y coherentes de mercado. Además, el análisis de la participación de mercado y el análisis de tendencias clave son los principales factores de éxito en el informe de mercado. Para obtener más información, solicite una llamada de un analista o envíe su consulta.
La metodología de investigación clave utilizada por el equipo de investigación de DBMR es la triangulación de datos, que implica la extracción de datos, el análisis del impacto de las variables de datos en el mercado y la validación primaria (experto en la industria). Los modelos de datos incluyen cuadrícula de posicionamiento de proveedores, análisis de línea de tiempo de mercado, descripción general y guía del mercado, cuadrícula de posicionamiento de la empresa, análisis de patentes, análisis de precios, análisis de participación de mercado de la empresa, estándares de medición, análisis global versus regional y de participación de proveedores. Para obtener más información sobre la metodología de investigación, envíe una consulta para hablar con nuestros expertos de la industria.
Personalización disponible
Data Bridge Market Research es líder en investigación formativa avanzada. Nos enorgullecemos de brindar servicios a nuestros clientes existentes y nuevos con datos y análisis que coinciden y se adaptan a sus objetivos. El informe se puede personalizar para incluir análisis de tendencias de precios de marcas objetivo, comprensión del mercado de países adicionales (solicite la lista de países), datos de resultados de ensayos clínicos, revisión de literatura, análisis de mercado renovado y base de productos. El análisis de mercado de competidores objetivo se puede analizar desde análisis basados en tecnología hasta estrategias de cartera de mercado. Podemos agregar tantos competidores sobre los que necesite datos en el formato y estilo de datos que esté buscando. Nuestro equipo de analistas también puede proporcionarle datos en archivos de Excel sin procesar, tablas dinámicas (libro de datos) o puede ayudarlo a crear presentaciones a partir de los conjuntos de datos disponibles en el informe.