

Europe Road Safety Market
Tamaño del mercado en miles de millones de dólares
Tasa de crecimiento anual compuesta (CAGR) :
% 
 USD
854.30 Billion
USD
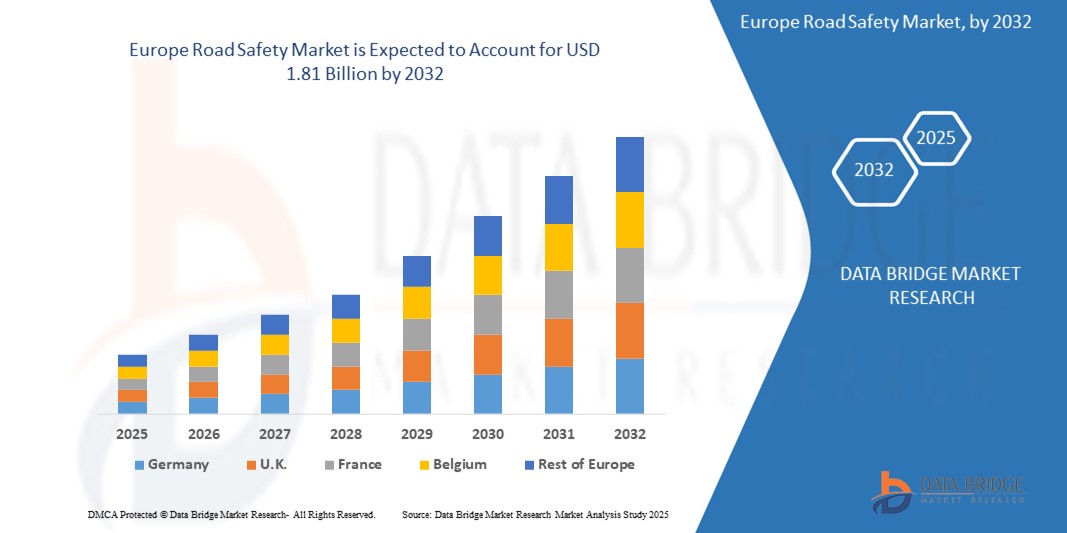
1.81 Billion
2024
2032
USD
854.30 Billion
USD
1.81 Billion
2024
2032
| 2025 –2032 | |
| USD 854.30 Billion | |
| USD 1.81 Billion | |
| % | |
|
Por componente (soluciones, servicios), tecnología (vigilancia, sensores, radar, análisis), tipo de vía (ciudades, autopistas, caminos rurales, otros) y región: tendencias y pronóstico de la industria hasta 2032
Tamaño del mercado de seguridad vial en Europa
- El tamaño del mercado de seguridad vial en Europa se valoró en USD 854,3 millones en 2024 y se espera que alcance los USD 1.810 millones para 2032, con una CAGR del 9,90 % durante el período de pronóstico.
- Este crecimiento está impulsado por la creciente preocupación por las muertes en el tráfico, lo que está generando leyes más estrictas y una demanda de tecnología de seguridad.
Análisis del mercado de seguridad vial en Europa
- La expansión de la infraestructura de las ciudades inteligentes está impulsando la demanda de sistemas de tráfico inteligentes. Cubic Corporation implementó sistemas avanzados de gestión del tráfico en importantes ciudades estadounidenses como San Diego.
- La vigilancia basada en IA y la monitorización en tiempo real están mejorando las capacidades de seguridad. Axis Communications y Verra Mobility han introducido sistemas de cámaras inteligentes con reconocimiento de matrículas desde 2022.
- Alemania tiene una cuota de mercado importante debido a los avances tecnológicos.
- Se espera que Alemania registre el crecimiento más rápido, impulsado por el aumento de las inversiones en infraestructura.
- Se proyecta que el segmento de Soluciones represente una participación de mercado significativa de aproximadamente el 68,1% en 2025, impulsado por el crecimiento en el desarrollo de ciudades inteligentes.
Alcance del informe y segmentación del mercado de seguridad vial en Europa
|
Atributos |
Perspectivas clave del mercado de seguridad vial en Europa |
|
Segmentos cubiertos |
|
|
Países cubiertos |
Europa
|
|
Actores clave del mercado |
|
|
Oportunidades de mercado |
|
|
Conjuntos de información de datos de valor añadido |
In addition to the insights on market scenarios such as market value, growth rate, segmentation, geographical coverage, and major players, the market reports curated by the Data Bridge Market Research also include import export analysis, production capacity overview, production consumption analysis, price trend analysis, climate change scenario, supply chain analysis, value chain analysis, raw material/consumables overview, vendor selection criteria, PESTLE Analysis, Porter Analysis, and regulatory framework. |
Europe Road Safety Market Trends
“Cloud-Based Solutions”
- The shift towards cloud deployment offers enhanced scalability and flexibility. Cloud-based road safety solutions allow for rapid adjustments in response to changing traffic conditions, ensuring optimal performance and reliability.
- The incorporation of Artificial Intelligence (AI) and the Internet of Things (IoT) into road safety systems is revolutionizing traffic management. AI algorithms analyze data from IoT devices to provide real-time insights, enabling predictive maintenance and proactive incident response.
- In April 2024, FLIR introduced the Trafibot AI camera to enhance interurban traffic flow and road safety.
- The European Union mandated the inclusion of Intelligent Speed Assistance systems in all new vehicles to enhance road safety by limiting speeding, a significant cause of accidents.
Europe Road Safety Market Dynamics
Driver
“Technological Advancements”
- The adoption of advanced technologies such as AI, IoT, and cloud computing is driving the implementation of intelligent traffic systems, enhancing road safety measures across Europe.
- Governments are enforcing strict safety standards and investing in smart infrastructure projects, compelling industries to implement comprehensive road safety measures to ensure compliance and public safety.
- For instance, In January 2025, Goodyear announced smart tires capable of detecting rain and ice, enhancing the effectiveness of automatic emergency braking systems.
- The Infrastructure Investment and Jobs Act (2021) allocated $11 billion for road safety, benefitting companies like Redflex Traffic Systems and Kapsch TrafficCom involved in traffic enforcement.
Opportunity
“Expansion in Emerging Markets”
- Rapid urbanization and increasing vehicle ownership in emerging markets present significant opportunities for road safety solution providers to expand their footprint and address the growing demand for traffic management systems.
- The incorporation of analytics capabilities such as predictive analytics and data mining into road safety platforms enables organizations to derive actionable insights from vast datasets, supporting data-driven decision-making.
- For instance, As of May 2025, Automakers like Volkswagen, Subaru, and Hyundai are reintroducing physical buttons in vehicles, moving away from touchscreens to reduce driver distraction and improve safety.
- La vigilancia basada en IA y la monitorización en tiempo real están mejorando las capacidades de seguridad. Axis Communications y Verra Mobility han introducido sistemas de cámaras inteligentes con reconocimiento de matrículas desde 2022.
Restricción/Desafío
Integración con infraestructura heredada
- Muchas ciudades tienen sistemas de tráfico obsoletos que son incompatibles con soluciones de software modernas, lo que genera desafíos en la integración de nuevas tecnologías, como sistemas de detección de incidentes y software de cumplimiento automatizado.
- La inversión inicial requerida para sistemas avanzados de seguridad vial, incluidos software, hardware y servicios profesionales, puede ser sustancial, lo que supone una barrera para los municipios pequeños y medianos.
- Por ejemplo, en julio de 2024, Renault introdujo un sistema que evalúa el desempeño de los conductores en función de comportamientos como el exceso de velocidad y el mantenimiento del carril, con el objetivo de fomentar hábitos de conducción más seguros.
- La integración de varios sistemas de distintos proveedores, como Sensys Gatso y FLIR Systems, sigue siendo un cuello de botella técnico.
Alcance del mercado de seguridad vial en Europa
El mercado está segmentado según componente, tecnología y tipo de carretera.
|
Segmentación |
Subsegmentación |
|
Por componente |
|
|
Por tecnología |
|
|
Por tipo de carretera |
|
Se proyecta que en 2025, el segmento de vigilancia domine el segmento de tecnología.
Se espera que el segmento de vigilancia tenga una participación de mercado de aproximadamente el 39,3 % en 2025, impulsado por los avances tecnológicos.
Se espera que el segmento Ciudades represente la mayor participación durante el período de pronóstico en el mercado de tipos de carreteras.
En 2025, se proyecta que el segmento Ciudades represente una participación de mercado del 29,8%, impulsado por el crecimiento en el desarrollo de ciudades inteligentes.
Alemania posee la mayor participación en el mercado europeo de seguridad vial.
- Alemania domina el mercado debido a la rápida urbanización y el aumento de la propiedad de vehículos en los mercados emergentes, lo que presenta oportunidades significativas para que los proveedores de soluciones de seguridad vial expandan su presencia y aborden la creciente demanda de sistemas de gestión del tráfico.
- Alemania tiene una participación significativa, impulsada por iniciativas de Smart City e IoT.
- En abril de 2024, FLIR presentó la cámara Trafibot AI para mejorar el flujo de tráfico interurbano y la seguridad vial a través de un rendimiento de detección avanzado.
Se proyecta que Alemania registre la tasa de crecimiento anual compuesta (TCAC) más alta del mercado europeo de seguridad vial.
- El crecimiento de Alemania está impulsado por el crecimiento de la IoT y los dispositivos inteligentes.
- Se proyecta que Alemania exhiba la CAGR más alta debido al crecimiento de la industria de semiconductores.
- La vigilancia basada en IA y la monitorización en tiempo real están mejorando las capacidades de seguridad. Axis Communications y Verra Mobility han introducido sistemas de cámaras inteligentes con reconocimiento de matrículas desde 2022.
Cuota de mercado de la seguridad vial en Europa
El panorama competitivo del mercado ofrece detalles por competidor. Se incluye información general de la empresa, sus estados financieros, ingresos generados, potencial de mercado, inversión en investigación y desarrollo, nuevas iniciativas de mercado, presencia en Europa, plantas de producción, capacidad de producción, fortalezas y debilidades de la empresa, lanzamiento de productos, alcance y variedad de productos, y dominio de las aplicaciones. Los datos anteriores se refieren únicamente al enfoque de mercado de las empresas.
Los principales líderes del mercado que operan en el mercado son:
- JENOPTIK AG,
- Grupo Sensys Gatso AB,
- GRUPO DE INGENIERÍA DE LA INFORMACIÓN INC.,
- Kapsch TrafficCom AG,
- Redflex Holdings,
- FLIR Systems, Inc.,
- Corporación Cúbica,
- VITRONIC Dr.-Ing.
- Stein Bildverarbeitungssysteme GmbH,
- Optotraffic, LLC,
- Tecnología láser, Inc.,
- Motorola Solutions, Inc.,
- Verra Mobility, Siemens,
- Dahua Technology Co., Ltd.,
- Conduent, Inc.,
- Tattile Srl,
- Logix de tráfico
Últimos avances en el mercado europeo de seguridad vial
- En abril de 2024, FLIR presentó la cámara Trafibot AI para mejorar el flujo de tráfico interurbano y la seguridad vial.
- En diciembre de 2023, Kapsch integró cámaras, sensores y sistemas de radar con el software de gestión del tráfico urbano en la circunvalación de Kekava de Letonia para garantizar la seguridad de los conductores.
- En enero de 2025, Goodyear anunció neumáticos inteligentes capaces de detectar la lluvia y el hielo, mejorando la eficacia de los sistemas de frenado automático de emergencia.
- A partir de mayo de 2025, fabricantes de automóviles como Volkswagen, Subaru y Hyundai reintroducirán botones físicos en los vehículos para reducir la distracción del conductor causada por las pantallas táctiles.
SKU-
Obtenga acceso en línea al informe sobre la primera nube de inteligencia de mercado del mundo

- Panel de análisis de datos interactivo
- Panel de análisis de empresas para oportunidades con alto potencial de crecimiento
- Acceso de analista de investigación para personalización y consultas
- Análisis de la competencia con panel interactivo
- Últimas noticias, actualizaciones y análisis de tendencias
- Aproveche el poder del análisis de referencia para un seguimiento integral de la competencia
Metodología de investigación
La recopilación de datos y el análisis del año base se realizan utilizando módulos de recopilación de datos con muestras de gran tamaño. La etapa incluye la obtención de información de mercado o datos relacionados a través de varias fuentes y estrategias. Incluye el examen y la planificación de todos los datos adquiridos del pasado con antelación. Asimismo, abarca el examen de las inconsistencias de información observadas en diferentes fuentes de información. Los datos de mercado se analizan y estiman utilizando modelos estadísticos y coherentes de mercado. Además, el análisis de la participación de mercado y el análisis de tendencias clave son los principales factores de éxito en el informe de mercado. Para obtener más información, solicite una llamada de un analista o envíe su consulta.
La metodología de investigación clave utilizada por el equipo de investigación de DBMR es la triangulación de datos, que implica la extracción de datos, el análisis del impacto de las variables de datos en el mercado y la validación primaria (experto en la industria). Los modelos de datos incluyen cuadrícula de posicionamiento de proveedores, análisis de línea de tiempo de mercado, descripción general y guía del mercado, cuadrícula de posicionamiento de la empresa, análisis de patentes, análisis de precios, análisis de participación de mercado de la empresa, estándares de medición, análisis global versus regional y de participación de proveedores. Para obtener más información sobre la metodología de investigación, envíe una consulta para hablar con nuestros expertos de la industria.
Personalización disponible
Data Bridge Market Research es líder en investigación formativa avanzada. Nos enorgullecemos de brindar servicios a nuestros clientes existentes y nuevos con datos y análisis que coinciden y se adaptan a sus objetivos. El informe se puede personalizar para incluir análisis de tendencias de precios de marcas objetivo, comprensión del mercado de países adicionales (solicite la lista de países), datos de resultados de ensayos clínicos, revisión de literatura, análisis de mercado renovado y base de productos. El análisis de mercado de competidores objetivo se puede analizar desde análisis basados en tecnología hasta estrategias de cartera de mercado. Podemos agregar tantos competidores sobre los que necesite datos en el formato y estilo de datos que esté buscando. Nuestro equipo de analistas también puede proporcionarle datos en archivos de Excel sin procesar, tablas dinámicas (libro de datos) o puede ayudarlo a crear presentaciones a partir de los conjuntos de datos disponibles en el informe.

