
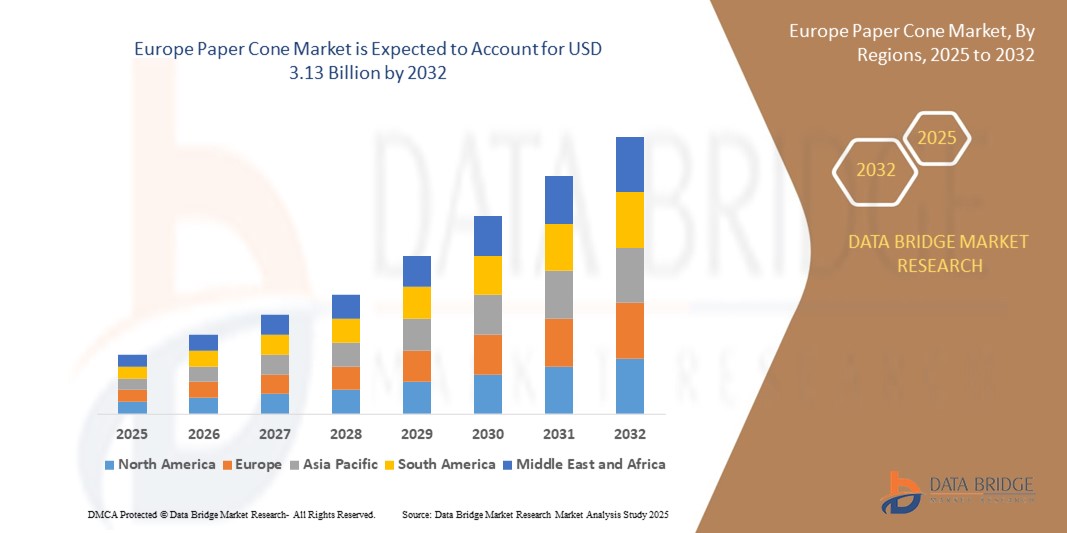
Europe Paper Cone Market
Tamaño del mercado en miles de millones de dólares
Tasa de crecimiento anual compuesta (CAGR) :
% 
 USD
2.05 Billion
USD
3.13 Billion
2024
2032
USD
2.05 Billion
USD
3.13 Billion
2024
2032
| 2025 –2032 | |
| USD 2.05 Billion | |
| USD 3.13 Billion | |
| % | |
|
Segmentación del mercado europeo de conos de papel: tipo (cono de papel Bong apretado, cono de papel jumbo, cono de papel de hilo, cono de papel impreso, bobinas, cono de papel textil, cono de papel encerado, cono de papel cónico, cono de construcción, cono de papel liso y otros), número de pilas (de una sola capa y de varias capas), conicidad del cono (hasta 30 conicidad, de 30 a 50 conicidad y más de 50 conicidad), tamaño (cono de 1 grado y 51 minutos, cono de 3 grados y 51 minutos, cono de 5 grados y 57 minutos, cono de 3 grados y 30 minutos, cono de 6 grados y 20 minutos, cono de 9 grados y 51 minutos, cono de 9 grados y 36 minutos, cono de 7 grados y 22 minutos y otros). Canal de distribución (venta directa/B2B, minoristas especializados, tiendas de conveniencia, supermercados/hipermercados, comercio electrónico y otros), usuario final (textil, construcción y otros): tendencias de la industria y pronóstico hasta 2032
Tamaño del mercado europeo de conos de papel
- El tamaño del mercado de conos de papel en Europa se valoró en USD 2.050 millones en 2024 y se espera que alcance los USD 3.130 millones en 2032 , con una CAGR del 5,40 % durante el período de pronóstico.
- El crecimiento del mercado está impulsado en gran medida por la expansión de la industria de fabricación de textiles y hilados, la creciente demanda de soluciones de embalaje ecológicas y biodegradables y las regulaciones gubernamentales que promueven materiales sostenibles en lugar de conos a base de plástico.
- La presencia de mano de obra y materia prima de bajo costo apoya el crecimiento de la producción de conos de papel, atrayendo inversiones nacionales e internacionales a la región.
Análisis del mercado europeo de conos de papel
- La creciente preferencia por materiales de embalaje sostenibles está cambiando significativamente el mercado de conos de papel en toda Europa, especialmente en países con uso intensivo de textiles como Reino Unido, Alemania y Países Bajos.
- La creciente demanda de exportación de hilos y telas ha impulsado la adopción de conos de papel, que son esenciales para el bobinado, almacenamiento y transporte de hilos.
- El mercado de conos de papel del Reino Unido tuvo la mayor participación en ingresos en Asia-Pacífico en 2024, respaldado por el creciente énfasis en los envases sostenibles y el crecimiento en las industrias textiles y de la confección.
- Se espera que Alemania sea testigo de la mayor tasa de crecimiento anual compuesta (CAGR) en el mercado de conos de papel de Europa debido a las crecientes inversiones en la fabricación de textiles inteligentes, la sólida demanda de materiales reciclables y la creciente conciencia ambiental.
- El segmento de conos de papel bong ajustados dominó el mercado con la mayor participación en ingresos en 2024, impulsado por su amplio uso en la industria textil para el bobinado de hilo y su rentabilidad. Este tipo de cono es apreciado por su durabilidad y capacidad para soportar operaciones de alta velocidad, lo que lo convierte en la opción preferida en las hilanderías de la región.
Alcance del informe y segmentación del mercado de conos de papel en Europa
|
Atributos |
Perspectivas clave del mercado de conos de papel en Europa |
|
Segmentos cubiertos |
|
|
Países cubiertos |
Europa
|
|
Actores clave del mercado |
• Conitex Sonoco (España) |
|
Oportunidades de mercado |
• Creciente base manufacturera textil en las economías emergentes • Adopción de soluciones de embalaje sostenibles y biodegradables |
|
Conjuntos de información de datos de valor añadido |
Además de los conocimientos sobre escenarios de mercado como valor de mercado, tasa de crecimiento, segmentación, cobertura geográfica y actores principales, los informes de mercado seleccionados por Data Bridge Market Research también incluyen análisis de importación y exportación, descripción general de la capacidad de producción, análisis del consumo de producción, análisis de tendencias de precios, escenario de cambio climático, análisis de la cadena de suministro, análisis de la cadena de valor, descripción general de materias primas/consumibles, criterios de selección de proveedores, análisis PESTLE, análisis de Porter y marco regulatorio. |
Tendencias del mercado de conos de papel en Europa
Aumento de la demanda de soluciones de embalaje sostenibles y biodegradables
- El creciente énfasis en la sostenibilidad en toda Europa está impulsando a los fabricantes a adoptar envases de cono de papel biodegradables.
- Las regulaciones de la UE que prohíben los plásticos de un solo uso están acelerando la transición hacia envases industriales ecológicos
- Los consumidores y las empresas europeas prefieren cada vez más materiales compostables y reciclables para reducir el impacto ambiental.
- Los fabricantes textiles están reemplazando los conos de plástico por conos de papel kraft para alinearse con las iniciativas de la cadena de suministro ecológica.
- El fuerte compromiso con los objetivos de reducción de carbono está impulsando la adopción de soluciones de embalaje ecológico en los sectores textil y de la confección.
- Por ejemplo, en Alemania, una importante empresa de procesamiento textil reemplazó los conos de plástico por conos de papel con certificación FSC para cumplir con las directivas medioambientales de la UE.
Dinámica del mercado europeo de conos de papel
Conductor
Creciente demanda de embalajes textiles sostenibles en toda Europa
- El sector textil europeo tiende cada vez más hacia materiales de embalaje reciclables y respetuosos con el medio ambiente.
- Las crecientes exportaciones de tejidos e hilos de alta calidad requieren soluciones de bobinado sostenibles y duraderas.
- Los conos de papel son los preferidos por su compatibilidad con los sistemas automatizados de hilado y bobinado en las fábricas textiles modernas.
- Las regulaciones industriales, como el Pacto Verde Europeo, apoyan la transición hacia materiales de embalaje de bajo impacto.
- Los conos de papel, rentables y livianos, ayudan a reducir los costos logísticos y de eliminación en toda la cadena de valor.
- Por ejemplo, en Italia, varios fabricantes textiles de la región de Lombardía integraron conos de papel reciclable en sus líneas de embalaje para cumplir con los puntos de referencia de sostenibilidad de la UE.
Restricción/Desafío
“Aumento de la presión de los costos debido a la volatilidad del suministro de materias primas”
- Las fluctuaciones en el costo del papel kraft y los adhesivos afectan la estabilidad de la producción de los fabricantes de conos de papel.
- El aumento de los costes energéticos y logísticos en Europa ejerce presión sobre las pequeñas y medianas empresas (PYME)
- La disponibilidad limitada de papel reciclado de alta calidad da lugar a una calidad inconsistente del producto.
- Los fabricantes luchan por ofrecer precios competitivos en medio del aumento de los precios de las materias primas
- La dependencia de insumos importados de pulpa y papel expone a las empresas a interrupciones en la cadena de suministro global
- Por ejemplo, en Polonia, varios fabricantes a pequeña escala informaron retrasos en las entregas y sobrecostos debido a un aumento en los precios del papel kraft causado por la escasez de energía y los retrasos en las importaciones.
Alcance del mercado europeo de conos de papel
El mercado está segmentado en función del tipo, número de pilas, conicidad del cono, tamaño, canal de distribución y usuario final.
• Por tipo
Según el tipo, el mercado europeo de conos de papel se segmenta en conos de papel bong ajustados, conos de papel jumbo, conos de papel para hilo, conos de papel impreso, bobinas, conos de papel textil, conos de papel encerado, conos de papel cónicos, conos de construcción, conos de papel liso, entre otros. El segmento de conos de papel bong ajustados dominó el mercado con la mayor participación en ingresos en 2024, gracias a su amplio uso en la industria textil para el bobinado de hilo y a su rentabilidad. Este tipo de cono es apreciado por su durabilidad y capacidad para soportar operaciones de alta velocidad, lo que lo convierte en la opción preferida en las hilanderías de la región.
Se prevé que el segmento de conos de papel para hilo registre su mayor crecimiento entre 2025 y 2032, impulsado por la creciente demanda de embalajes para hilo en centros de producción textil como India y Bangladés. El crecimiento de este segmento se ve reforzado por el aumento de las exportaciones de productos a base de hilo, que requieren soluciones de conos fiables y eficientes.
• Por número de pilas
En función del número de pilas, el mercado europeo de conos de papel se segmenta en monocapa y multicapa. El segmento multicapa obtuvo la mayor cuota de mercado en 2024 gracias a su mayor resistencia e integridad estructural, lo que lo hace adecuado para aplicaciones de alta resistencia.
Se espera que el segmento de una sola capa experimente la tasa de crecimiento más rápida entre 2025 y 2032, debido a su relación costo-eficiencia y al creciente uso en procesos textiles livianos.
• Por la conicidad del cono
Según la conicidad del cono, el mercado europeo de conos de papel se segmenta en conos de hasta 30, de 30 a 50 y superiores a 50. El segmento de conos de 30 a 50 representó la mayor participación en los ingresos en 2024, gracias a su óptimo equilibrio entre estabilidad y capacidad de retención del hilo, lo que lo convierte en un estándar en diversas unidades de procesamiento de hilo.
Se prevé que el segmento de conos superiores a 50 experimente el mayor crecimiento entre 2025 y 2032, impulsado por su creciente uso en aplicaciones de hilo especializadas que requieren mayores velocidades de bobinado y mayor precisión. Los fabricantes de toda la región europea están adoptando gradualmente estos conos para configuraciones de maquinaria textil avanzada, especialmente en la producción de tejidos de alta gama y en operaciones de hilado orientadas a la exportación.
• Por tamaño
En función del tamaño, el mercado europeo de conos de papel se segmenta en conos de 1 grado y 51 minutos, conos de 3 grados y 51 minutos, conos de 5 grados y 57 minutos, conos de 3 grados y 30 minutos, conos de 6 grados y 20 minutos, conos de 9 grados y 51 minutos, conos de 9 grados y 36 minutos, conos de 7 grados y 22 minutos, entre otros. El segmento de conos de 5 grados y 57 minutos dominó el mercado en 2024 gracias a su amplia adopción en las hilanderías y fábricas textiles regionales.
Se espera que el segmento de cono de 9 grados y 36 minutos experimente la tasa de crecimiento más rápida entre 2025 y 2032, ya que los fabricantes buscan dimensiones de cono más especializadas diseñadas para aplicaciones textiles avanzadas.
• Por canal de distribución
Según el canal de distribución, el mercado europeo de conos de papel se segmenta en venta directa/B2B, minoristas especializados, tiendas de conveniencia, supermercados/hipermercados, comercio electrónico, entre otros. El segmento de venta directa/B2B lideró el mercado en 2024, ya que los grandes fabricantes textiles prefieren la compra directa para garantizar un suministro constante y una buena relación calidad-precio.
Se espera que el segmento de comercio electrónico experimente la tasa de crecimiento más rápida entre 2025 y 2032, impulsado por la creciente digitalización y la preferencia por el abastecimiento en línea de suministros industriales.
• Por el usuario final
En cuanto al usuario final, el mercado europeo de conos de papel se segmenta en textiles, construcción y otros. El segmento textil dominó el mercado con la mayor participación en los ingresos en 2024 debido a la sólida presencia de la región en la fabricación y exportación de textiles.
Se espera que el segmento de la construcción sea testigo de la tasa de crecimiento más rápida entre 2025 y 2032, impulsado por el aumento del uso de conos de papel en proyectos civiles y de infraestructura para fines tales como marcado y aplicaciones de materiales livianos.
Análisis regional del mercado europeo de conos de papel
- El mercado de conos de papel del Reino Unido tuvo la mayor participación en los ingresos en Asia-Pacífico en 2024, respaldado por el creciente énfasis en los envases sostenibles y el crecimiento en las industrias textiles y de la confección.
- Las estrictas regulaciones ambientales del país y la prohibición de los plásticos de un solo uso están animando a los fabricantes a adoptar alternativas biodegradables como los conos de papel kraft.
- Además, la demanda de soluciones de bobinado de hilo de alta calidad en las fábricas textiles y unidades de producción de prendas de vestir está impulsando la penetración en el mercado.
- El uso creciente de maquinaria de hilado automatizada y el impulso a las exportaciones ecológicas también están contribuyendo a la expansión de las aplicaciones de conos de papel en todo el Reino Unido.
Análisis del mercado de conos de papel en Alemania
Se espera que el mercado alemán de conos de papel experimente un sólido crecimiento durante el período de pronóstico, impulsado por la sólida base de fabricación textil del país y su conciencia ambiental. El sector industrial alemán valora la precisión, la eficiencia y la sostenibilidad, lo que convierte a los conos de papel en una opción preferida en las operaciones textiles. El uso generalizado de maquinaria automatizada para el procesamiento de hilo requiere conos duraderos y dimensionalmente precisos, mientras que la adopción de los principios de la economía circular está impulsando la transición hacia alternativas basadas en plástico. Además, los fabricantes textiles orientados a la exportación recurren cada vez más a los conos de papel para cumplir con los estándares de embalaje ecológico exigidos por los compradores europeos e internacionales.
Cuota de mercado de conos de papel en Europa
La industria europea de conos de papel está liderada principalmente por empresas bien establecidas, entre las que se incluyen:
• Conitex Sonoco (España)
• FAVRETTO (Italia)
• Tubettificio Senese Srl (Italia)
• Grupo Yasar (Turquía)
• Grupo Corex (Bélgica)
• Grupo Smurfit Kappa (Irlanda)
• Paul & Co (Alemania)
• Sonoco Alcore (Reino Unido)
• Pirro Srl (Italia)
• Karton-Pak (Polonia)
SKU-
Obtenga acceso en línea al informe sobre la primera nube de inteligencia de mercado del mundo

- Panel de análisis de datos interactivo
- Panel de análisis de empresas para oportunidades con alto potencial de crecimiento
- Acceso de analista de investigación para personalización y consultas
- Análisis de la competencia con panel interactivo
- Últimas noticias, actualizaciones y análisis de tendencias
- Aproveche el poder del análisis de referencia para un seguimiento integral de la competencia
Metodología de investigación
La recopilación de datos y el análisis del año base se realizan utilizando módulos de recopilación de datos con muestras de gran tamaño. La etapa incluye la obtención de información de mercado o datos relacionados a través de varias fuentes y estrategias. Incluye el examen y la planificación de todos los datos adquiridos del pasado con antelación. Asimismo, abarca el examen de las inconsistencias de información observadas en diferentes fuentes de información. Los datos de mercado se analizan y estiman utilizando modelos estadísticos y coherentes de mercado. Además, el análisis de la participación de mercado y el análisis de tendencias clave son los principales factores de éxito en el informe de mercado. Para obtener más información, solicite una llamada de un analista o envíe su consulta.
La metodología de investigación clave utilizada por el equipo de investigación de DBMR es la triangulación de datos, que implica la extracción de datos, el análisis del impacto de las variables de datos en el mercado y la validación primaria (experto en la industria). Los modelos de datos incluyen cuadrícula de posicionamiento de proveedores, análisis de línea de tiempo de mercado, descripción general y guía del mercado, cuadrícula de posicionamiento de la empresa, análisis de patentes, análisis de precios, análisis de participación de mercado de la empresa, estándares de medición, análisis global versus regional y de participación de proveedores. Para obtener más información sobre la metodología de investigación, envíe una consulta para hablar con nuestros expertos de la industria.
Personalización disponible
Data Bridge Market Research es líder en investigación formativa avanzada. Nos enorgullecemos de brindar servicios a nuestros clientes existentes y nuevos con datos y análisis que coinciden y se adaptan a sus objetivos. El informe se puede personalizar para incluir análisis de tendencias de precios de marcas objetivo, comprensión del mercado de países adicionales (solicite la lista de países), datos de resultados de ensayos clínicos, revisión de literatura, análisis de mercado renovado y base de productos. El análisis de mercado de competidores objetivo se puede analizar desde análisis basados en tecnología hasta estrategias de cartera de mercado. Podemos agregar tantos competidores sobre los que necesite datos en el formato y estilo de datos que esté buscando. Nuestro equipo de analistas también puede proporcionarle datos en archivos de Excel sin procesar, tablas dinámicas (libro de datos) o puede ayudarlo a crear presentaciones a partir de los conjuntos de datos disponibles en el informe.

