

Europe Ocular Pain Market
Tamaño del mercado en miles de millones de dólares
Tasa de crecimiento anual compuesta (CAGR) :
% 
 USD
275.39 Million
USD
491.15 Million
2025
2033
USD
275.39 Million
USD
491.15 Million
2025
2033
| 2026 –2033 | |
| USD 275.39 Million | |
| USD 491.15 Million | |
| % | |
|
Segmentación del mercado europeo del dolor ocular por tipo de enfermedad (dolor ocular con enfermedades oculares y dolor ocular sin enfermedades oculares primarias), tipo (diagnóstico y tratamiento), aplicación (conjuntivitis, abrasión corneal, blefaritis, orzuelo, iritis, sinusitis, migrañas, glaucoma y otras), vía de administración (tópica, periocular, intraocular, oral), tipo de fármaco (con receta y sin receta), tipo de población (adultos y geriátricos), usuario final (hospitales, clínicas especializadas, centros de atención médica domiciliaria, centros oftalmológicos, centros de cirugía ambulatoria y otros), canal de distribución (licitación directa, farmacia hospitalaria, farmacia minorista, farmacia en línea y otras): tendencias del sector y pronóstico hasta 2033.
Tamaño del mercado europeo del dolor ocular
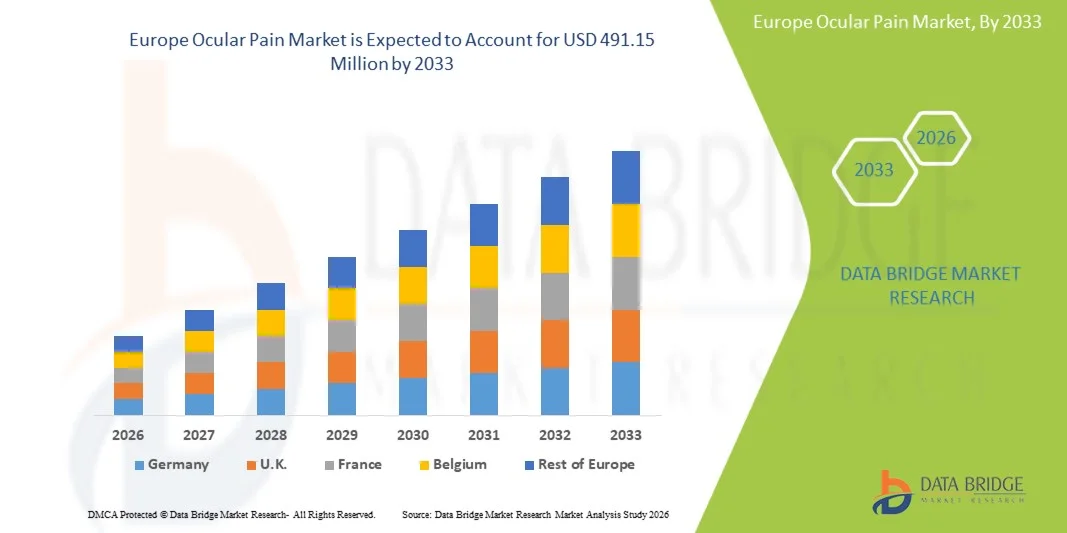
- El tamaño del mercado del dolor ocular en Europa se valoró en USD 275,39 millones en 2025 y se espera que alcance los USD 491,15 millones para 2033 , con una CAGR del 7,50 % durante el período de pronóstico.
- El crecimiento del mercado se ve impulsado en gran medida por la creciente prevalencia de trastornos relacionados con los ojos, el aumento del tiempo frente a las pantallas, la contaminación ambiental y el creciente envejecimiento de la población, todos los cuales contribuyen a una mayor incidencia de dolor ocular tanto en las regiones desarrolladas como en las regiones en desarrollo.
- Además, la creciente conciencia sobre la salud ocular, el mejor acceso a la atención oftálmica y los avances continuos en tecnologías diagnósticas y terapéuticas están impulsando la demanda de soluciones efectivas para el tratamiento del dolor ocular, lo que aumenta significativamente el crecimiento general de la industria.
Análisis del mercado europeo del dolor ocular
- El dolor ocular, que se refiere a la incomodidad, el dolor o la irritación dentro y alrededor del ojo causado por afecciones como el síndrome del ojo seco, infecciones, inflamación, dolor asociado a la migraña y trastornos neurológicos, se ha convertido en una preocupación creciente tanto en entornos clínicos como de atención domiciliaria debido a la mayor exposición a las pantallas digitales, los contaminantes ambientales y la fatiga visual relacionada con el estilo de vida.
- La creciente demanda de soluciones para el tratamiento del dolor ocular se ve impulsada principalmente por la creciente prevalencia de enfermedades oculares crónicas, el uso extendido de dispositivos digitales, el aumento de la población geriátrica y una mayor conciencia sobre el manejo de la salud ocular entre los consumidores de todo el mundo.
- El Reino Unido dominó el mercado europeo del dolor ocular con la mayor participación en los ingresos del 35,2 % en 2025, respaldado por un sistema de atención médica bien desarrollado, una gran conciencia de la salud ocular, un amplio acceso a servicios de oftalmología especializados y una fuerte presencia de empresas líderes de productos farmacéuticos y dispositivos médicos centradas en terapias oculares innovadoras.
- Se espera que Alemania sea la región de más rápido crecimiento en el mercado europeo del dolor ocular, registrando una CAGR del 8,4 % durante el período de pronóstico, impulsada por el aumento del gasto en atención médica, una población que envejece rápidamente, una prevalencia cada vez mayor de enfermedades oculares crónicas, fuertes actividades de investigación y desarrollo y la creciente adopción de opciones de tratamiento avanzadas.
- El segmento de Tratamiento dominó la mayor participación en los ingresos del mercado con un 68,9 % en 2025, ya que la mayoría de los pacientes que experimentan dolor ocular buscan alivio directamente a través de medicamentos o intervención terapéutica.
Alcance del informe y segmentación del mercado europeo del dolor ocular
|
Atributos |
Análisis clave del mercado del dolor ocular |
|
Segmentos cubiertos |
|
|
Países cubiertos |
Europa
|
|
Actores clave del mercado |
|
|
Oportunidades de mercado |
|
|
Conjuntos de información de datos de valor añadido |
Además de los conocimientos sobre escenarios de mercado, como el valor de mercado, la tasa de crecimiento, la segmentación, la cobertura geográfica y los principales actores, los informes de mercado seleccionados por Data Bridge Market Research también incluyen un análisis en profundidad de expertos, epidemiología de pacientes, análisis de la cartera de productos, análisis de precios y marco regulatorio. |
Tendencias del mercado del dolor ocular en Europa
Avances en terapias oftálmicas dirigidas y manejo personalizado del dolor
- Una tendencia significativa y en auge en el mercado europeo del dolor ocular es el creciente énfasis en terapias oftálmicas dirigidas y enfoques terapéuticos personalizados diseñados para controlar el dolor ocular crónico y agudo con mayor eficacia. La mayor comprensión de los mecanismos inflamatorios y neuropáticos subyacentes asociados al dolor ocular ha llevado al desarrollo de medicamentos y regímenes de tratamiento más especializados.
- Por ejemplo, las gotas oftálmicas con receta que contienen agentes antiinflamatorios, corticosteroides y ciclosporina se utilizan cada vez más para tratar el dolor asociado con la sequedad ocular, la irritación posquirúrgica y el daño corneal. De igual manera, la introducción de tratamientos biológicos para la inflamación ocular de origen autoinmunitario está proporcionando mejores resultados para los pacientes que sufren de dolor ocular persistente causado por afecciones como la uveítis y la escleritis.
- El uso de terapias combinadas, como gotas lubricantes para los ojos, AINE orales y fármacos inmunomoduladores, está ganando terreno, ya que abordan simultáneamente múltiples causas del dolor. Estas terapias se adaptan a la gravedad de los síntomas, la duración del malestar y la afección clínica subyacente, lo que permite a los profesionales sanitarios diseñar planes de tratamiento más personalizados para cada paciente.
- Además, la integración de tecnologías de diagnóstico avanzadas, como la imagen corneal y el análisis de la película lagrimal, permite a los oftalmólogos identificar con mayor precisión el origen específico del dolor. Esto ayuda a reducir la prescripción basada en el ensayo y error y mejora las tasas generales de éxito del tratamiento, especialmente en pacientes con trastornos crónicos de la superficie ocular.
- La creciente demanda de soluciones para aliviar el dolor no invasivas y de acción prolongada también ha provocado un aumento en el desarrollo de formulaciones oftálmicas de liberación sostenida y gotas para los ojos sin conservantes, que reducen la irritación y mejoran la comodidad del paciente.
- Esta tendencia hacia enfoques terapéuticos personalizados, basados en la ciencia y centrados en el paciente está transformando radicalmente el manejo del dolor ocular. Como resultado, las compañías farmacéuticas están invirtiendo fuertemente en investigación y desarrollo para introducir terapias innovadoras que brinden un alivio más rápido, una mayor duración de acción y menos efectos secundarios.
- Con el aumento del tiempo frente a las pantallas, la contaminación ambiental y la creciente prevalencia de trastornos oculares, se espera que la demanda de soluciones avanzadas para el manejo del dolor ocular crezca de manera constante en entornos clínicos y de atención domiciliaria en América del Norte.
Dinámica del mercado europeo del dolor ocular
Conductor
Aumento de la prevalencia de trastornos oculares y mayor concienciación sobre su tratamiento
- La creciente prevalencia de trastornos oculares como el síndrome del ojo seco, la conjuntivitis, el glaucoma, la retinopatía diabética y la inflamación posquirúrgica es un factor clave en la creciente demanda de tratamientos para el dolor ocular en Norteamérica. La exposición prolongada a pantallas digitales, los contaminantes ambientales y el envejecimiento de la población contribuyen significativamente a la irritación y el malestar ocular crónicos.
- Por ejemplo, en mayo de 2024, varias asociaciones de oftalmología de toda Europa intensificaron sus campañas de concienciación pública para destacar los riesgos de la exposición prolongada a pantallas digitales y su relación con el daño a la superficie ocular, fomentando el diagnóstico y el tratamiento tempranos de las molestias y el dolor ocular. Se espera que estas iniciativas aceleren el crecimiento del mercado durante el período de pronóstico.
- A medida que los pacientes son más conscientes de las consecuencias del dolor ocular no tratado, existe una mayor disposición a buscar atención médica e invertir en productos para el cuidado ocular con y sin receta. Esta mayor concienciación impulsa la demanda de gotas oftálmicas analgésicas, antiinflamatorios y lubricantes.
- Además, el creciente número de cirugías oftálmicas, incluyendo LASIK y procedimientos de cataratas, ha incrementado la necesidad de manejo del dolor postoperatorio, lo que contribuye a un mayor consumo de productos para el alivio del dolor ocular. Los hospitales y clínicas actualizan continuamente sus protocolos de tratamiento para incorporar terapias más efectivas para el control del dolor.
- La creciente disponibilidad de formulaciones farmacéuticas avanzadas, el mejor acceso a especialistas en atención oftalmológica y el aumento del gasto en atención médica en la región también respaldan el crecimiento del mercado europeo del dolor ocular en entornos residenciales, clínicos e institucionales.
Restricción/Desafío
Efectos secundarios , uso limitado a largo plazo y alto costo de las terapias avanzadas
- A pesar de la creciente demanda, el mercado europeo del dolor ocular se enfrenta a importantes desafíos debido a los posibles efectos secundarios asociados al uso prolongado de corticosteroides y AINE, como el aumento de la presión intraocular, la formación de cataratas y las complicaciones corneales. Estos riesgos suelen limitar el tratamiento prolongado, especialmente en casos crónicos.
- Además, algunos pacientes desarrollan tolerancia o una menor respuesta a los medicamentos comúnmente recetados, lo que dificulta cada vez más el manejo del dolor. Esto crea la necesidad de terapias combinadas más complejas y costosas, que pueden no ser asequibles para todos los grupos de pacientes.
- Por ejemplo, los pacientes que usan colirios con corticosteroides durante períodos prolongados suelen requerir un seguimiento continuo debido al riesgo de desarrollar glaucoma secundario, lo que aumenta tanto la carga clínica como los costes totales del tratamiento. Esto limita su uso generalizado a largo plazo.
- El alto costo de los productos biológicos avanzados y las nuevas formulaciones farmacológicas también restringe la accesibilidad, especialmente para pacientes sin seguro médico o con seguro insuficiente. Si bien estas terapias ofrecen mejores resultados, su elevado precio puede limitar significativamente su adopción en poblaciones sensibles a los costos.
- Además, la falta de concienciación en ciertas regiones rurales y desatendidas provoca un diagnóstico tardío y un tratamiento inadecuado, empeorando los síntomas y reduciendo la eficacia de las terapias disponibles.
- Para superar estos desafíos será necesario desarrollar alternativas más seguras a largo plazo, genéricos rentables y mejores programas de educación de los pacientes para garantizar un crecimiento sostenido del mercado de tratamiento del dolor ocular.
Alcance del mercado europeo del dolor ocular
El mercado está segmentado según el tipo de enfermedad, tipo, aplicación, vía de administración, tipo de fármaco, tipo de población, usuario final y canal de distribución.
• Por tipo de enfermedad
Según el tipo de enfermedad, el mercado europeo del dolor ocular se segmenta en dolor ocular con enfermedades oculares y dolor ocular sin enfermedades oculares primarias. El segmento de dolor ocular con enfermedades oculares dominó la mayor cuota de mercado con un 62,4 % en 2025, impulsado por la alta prevalencia de afecciones como conjuntivitis, abrasiones corneales, glaucoma, uveítis, síndrome del ojo seco e infecciones que causan molestias y dolor ocular. Estas afecciones suelen requerir atención médica inmediata e intervención terapéutica constante para reducir la inflamación, aliviar el dolor y prevenir la pérdida de visión. El creciente envejecimiento de la población, el mayor tiempo frente a pantallas, la creciente incidencia de infecciones oculares y trastornos crónicos como el glaucoma contribuyen significativamente al crecimiento de este segmento. Los pacientes con discapacidad visual o inflamación ocular son más propensos a buscar tratamiento profesional, lo que aumenta la demanda de procedimientos diagnósticos y fármacos terapéuticos. Las tecnologías de diagnóstico mejoradas en oftalmología están facilitando la identificación temprana de las causas del dolor ocular, lo que aumenta aún más la aceptación del tratamiento. El creciente número de ingresos hospitalarios relacionados con traumatismos oculares, daño corneal y dolor postoperatorio tras procedimientos oftalmológicos también está fortaleciendo este segmento. La mayor accesibilidad a los servicios de atención oftalmológica en zonas urbanas y las campañas de concienciación sobre la salud ocular impulsan este crecimiento. Además, la expansión de los departamentos de oftalmología en los hospitales contribuye a una mayor tasa de tratamiento. La combinación de estos factores consolida a este segmento como líder del mercado.
Se prevé que el segmento de Dolor Ocular sin Enfermedades Oculares Primarias registre la tasa de crecimiento anual compuesta (TCAC) más rápida, del 8,6 %, entre 2026 y 2033, impulsada por el aumento del diagnóstico de dolor referido causado por migrañas, sinusitis, trastornos neurológicos y enfermedades inflamatorias sistémicas. Este tipo de dolor no se origina directamente en una enfermedad ocular, sino que afecta significativamente la comodidad ocular, lo que impulsa a los pacientes a consultar con oftalmólogos y neurologistas. La creciente concienciación sobre el dolor ocular neuropático y referido está fomentando diagnósticos más específicos y enfoques terapéuticos especializados. A medida que las cefaleas, la prevalencia de la migraña y las complicaciones relacionadas con los senos paranasales siguen aumentando a nivel mundial, este segmento cobra un impulso significativo. Los avances tecnológicos en imagenología y diagnóstico del dolor permiten una mejor diferenciación entre el dolor ocular primario y el referido. La creciente colaboración entre neurólogos, otorrinolaringólogos y oftalmólogos está mejorando el manejo general del dolor. Un mejor acceso a la atención médica y un mejor reconocimiento de las causas no oculares del dolor ocular están acelerando el crecimiento. El aumento de las prescripciones de analgésicos no opioides y fármacos neurológicos está impulsando la expansión del mercado. Además, la creciente concienciación de los pacientes y la mejora en la notificación de los síntomas seguirán impulsando el crecimiento durante el período de pronóstico.
• Por tipo
Según el tipo, el mercado europeo del dolor ocular se segmenta en diagnóstico y tratamiento. El segmento de tratamiento dominó la mayor cuota de mercado con un 68,9 % en 2025, ya que la mayoría de los pacientes con dolor ocular buscan alivio directamente mediante medicamentos o intervenciones terapéuticas. Esto incluye el uso de antiinflamatorios, colirios lubricantes, antibióticos, antivirales, analgésicos y corticosteroides que tratan eficazmente las causas subyacentes. La creciente prevalencia de trastornos crónicos como la sequedad ocular, el glaucoma y la uveítis impulsa significativamente la demanda de tratamiento continuo. El aumento de casos de alergias oculares debido a la contaminación y los cambios ambientales también contribuye a la creciente dependencia de la gestión farmacéutica. El alivio del dolor oftálmico posquirúrgico es otro factor clave que impulsa la expansión de este segmento. Las compañías farmacéuticas continúan lanzando formulaciones mejoradas de medicamentos con mayor eficacia y menos efectos secundarios. La expansión de las farmacias minoristas y en línea ha facilitado el acceso a los tratamientos. La mayor dependencia de los médicos de las intervenciones farmacológicas en lugar de la simple observación es otro factor de apoyo. La creciente concienciación sobre el manejo temprano de los síntomas también está incrementando la demanda de tratamiento.
Se espera que el segmento de Diagnóstico experimente la tasa de crecimiento anual compuesta (TCAC) más rápida, del 9,3 %, entre 2026 y 2033, debido a los rápidos avances en tecnologías de diagnóstico oftálmico, como la tomografía de coherencia óptica, los exámenes con lámpara de hendidura y los sistemas avanzados de imágenes. El diagnóstico temprano y preciso es cada vez más crucial para prevenir complicaciones como la pérdida de visión. La creciente concienciación sobre la atención oftalmológica preventiva está animando a más personas a someterse a exámenes de detección y evaluaciones diagnósticas de rutina. Las iniciativas gubernamentales y de ONG que promueven los chequeos de salud ocular están acelerando su adopción. El establecimiento de clínicas de oftalmología especializada y centros de diagnóstico está ampliando el acceso a los servicios de pruebas. Las mejoras continuas en las herramientas de diagnóstico basadas en IA (solo para análisis de imágenes, no referenciadas en la integración) mejoran las tasas de detección. El aumento de la inversión en investigación oftalmológica está desarrollando dispositivos de diagnóstico más precisos. El crecimiento de la población geriátrica, que es más susceptible a las enfermedades oculares, acelera aún más la demanda de evaluaciones diagnósticas regulares.
• Por aplicación
Según la aplicación, el mercado europeo del dolor ocular se segmenta en conjuntivitis, abrasión corneal, blefaritis, orzuelo, iritis, sinusitis, migrañas, glaucoma y otros. El segmento de conjuntivitis dominó la mayor cuota de mercado con un 35,7% en 2025, debido a su altísima prevalencia en todos los grupos de edad y a su fuerte asociación con dolor, irritación, enrojecimiento y molestias oculares. Tanto la conjuntivitis bacteriana como la viral contribuyen significativamente a las consultas externas en hospitales y clínicas. Las alergias estacionales y los contaminantes ambientales intensifican aún más la tasa de incidencia, lo que genera una mayor demanda de antibióticos, antihistamínicos y antiinflamatorios. Los niños en edad escolar y los adultos que trabajan se ven especialmente afectados, lo que contribuye a un mayor volumen de tratamientos. La naturaleza contagiosa de la conjuntivitis fomenta la intervención médica temprana, lo que fortalece la demanda farmacéutica. La creciente concienciación sobre la higiene ocular y el control de infecciones está incrementando el número de casos diagnosticados. Los sistemas de salud en las regiones en desarrollo y desarrolladas informan de un aumento constante de las consultas relacionadas con la conjuntivitis. La accesibilidad a medicamentos de venta libre también impulsa el fuerte dominio de este segmento. Además, la mejora de las medidas de diagnóstico ayuda a identificar la conjuntivitis con mayor rapidez, lo que se traduce en un inicio más rápido del tratamiento y un liderazgo sostenido en el mercado.
Se espera que el segmento de migrañas experimente la tasa de crecimiento anual compuesta (TCAC) más rápida, del 9,8 %, entre 2026 y 2033, impulsada por la creciente carga mundial de trastornos neurológicos y afecciones relacionadas con el estrés. El dolor ocular es un síntoma frecuente asociado a las crisis de migraña, lo que lleva a muchos pacientes a buscar un tratamiento específico. Los cambios en el estilo de vida, la mayor exposición a pantallas, los patrones de sueño irregulares y el creciente estrés laboral contribuyen a la creciente prevalencia de las migrañas en todo el mundo. Un mejor reconocimiento de los síntomas de la migraña ocular por parte de los profesionales sanitarios está acelerando el diagnóstico. La integración de la atención multidisciplinaria, que incluye a neurólogos y oftalmólogos, está dando como resultado un mejor manejo del dolor migrañoso ocular. La mayor demanda de terapias preventivas para la migraña y medicamentos para el manejo del dolor respalda la expansión de este segmento. La creciente concienciación a través de campañas de salud también está animando a los pacientes a buscar el tratamiento adecuado. Las continuas innovaciones farmacéuticas dirigidas a las vías neurológicas contribuyen aún más al alto crecimiento proyectado.
• Por vía de administración
Según la vía de administración, el mercado europeo del dolor ocular se segmenta en tópico, periocular, intraocular y oral. El segmento tópico dominó la mayor cuota de mercado con un 48,5% en 2025, impulsado por el uso generalizado de colirios, geles y ungüentos para el tratamiento directo del dolor ocular local. Las formulaciones tópicas son muy populares debido a su rápida acción, facilidad de uso y mínimos efectos secundarios sistémicos. Se prescriben comúnmente para afecciones como conjuntivitis, ojo seco, abrasiones corneales y blefaritis. La mayor disponibilidad de formulaciones sin conservantes y de larga duración está impulsando una mayor adopción. Los pacientes prefieren los fármacos tópicos porque no son invasivos y pueden autoadministrarse en casa. Los avances tecnológicos en los sistemas de administración de fármacos han mejorado la absorción y la eficacia. La creciente concienciación sobre el tratamiento oftalmológico temprano está aumentando la dependencia de las terapias tópicas. Los profesionales sanitarios suelen elegir esta vía como primera línea de tratamiento, lo que la convierte en el segmento dominante. La creciente producción de medicamentos tópicos por parte de las compañías farmacéuticas fortalece aún más su posición en el mercado.
Se espera que el segmento Oral experimente la CAGR más rápida del 8,9% entre 2026 y 2033, debido principalmente al aumento de la incidencia del dolor ocular causado por afecciones sistémicas y neurológicas como la sinusitis y las migrañas. Los analgésicos orales, los agentes antiinflamatorios y los antibióticos desempeñan un papel crucial en el manejo del dolor referido o generalizado. Los pacientes con afecciones crónicas a menudo requieren medicación oral a largo plazo, lo que aumenta la demanda general. La creciente preferencia de los pacientes por métodos terapéuticos no invasivos y convenientes también está contribuyendo a este aumento. El aumento de las tasas de prescripción de medicamentos para el dolor neuropático está impulsando el crecimiento del segmento. Los medicamentos orales son fácilmente accesibles a través de los canales de prescripción y venta libre, lo que respalda un uso más amplio. Las mejoras en los perfiles de seguridad de los medicamentos están animando a los médicos a recomendar agentes orales con mayor frecuencia. La expansión de los servicios de telemedicina y prescripción electrónica está simplificando aún más el acceso a los tratamientos orales.
• Por tipo de fármaco
Según el tipo de fármaco, el mercado europeo del dolor ocular se segmenta en medicamentos con receta y de venta libre (OTC). El segmento de medicamentos con receta dominó la mayor cuota de mercado, con un 64,3%, en 2025, debido al papel crucial de los antibióticos, corticosteroides y antiinflamatorios especializados utilizados en afecciones oculares de moderadas a graves. Los trastornos oculares complejos, como el glaucoma, la iritis, las lesiones corneales y las infecciones, requieren un diagnóstico profesional y un tratamiento basado en la prescripción médica. Los pacientes sometidos a procedimientos quirúrgicos o que padecen afecciones oculares crónicas dependen en mayor medida del tratamiento guiado por un médico. El aumento de la tasa de cirugías oftálmicas y tratamientos avanzados impulsa la alta demanda de medicamentos con receta. La introducción de nuevos fármacos oftálmicos de marca con mayor eficacia fortalece aún más el segmento. Los medicamentos con receta también son esenciales para controlar las complicaciones y prevenir la pérdida de visión. Los hospitales y las clínicas especializadas utilizan habitualmente medicamentos con receta, lo que impulsa el volumen general del mercado. Un sólido control regulatorio garantiza la confianza y la credibilidad, impulsando mayores tasas de adopción. La expansión de la cobertura de los seguros médicos para los medicamentos con receta también contribuye a este dominio.
Se espera que el segmento de medicamentos de venta libre (OTC) experimente la tasa de crecimiento anual compuesta (TCAC) más rápida, del 10,1 %, entre 2026 y 2033, impulsada por la creciente preferencia por el autocuidado y el manejo temprano de los síntomas. El dolor ocular leve, la irritación y la sequedad se tratan cada vez más con lubricantes, antihistamínicos y gotas analgésicas de venta libre. La creciente concienciación de los consumidores sobre la salud ocular y la fácil disponibilidad de productos en farmacias minoristas y en línea impulsan el crecimiento. Los estilos de vida ajetreados y el acceso limitado a consultas inmediatas fomentan el uso de OTC. El aumento de la marca y el marketing de productos para el cuidado ocular también están fortaleciendo la confianza del consumidor. La mejora en la calidad de las formulaciones ha hecho que los productos de venta libre sean más efectivos y seguros para el uso frecuente. El crecimiento de la información digital sobre salud y las tendencias de autodiagnóstico impulsan aún más su adopción. Este segmento también se beneficia de la reducción de los costos de consulta y la conveniencia, lo que lo hace muy atractivo, especialmente en las regiones en desarrollo.
• Por tipo de población
Según el tipo de población, el mercado europeo del dolor ocular se segmenta en adultos y geriátrico. El segmento de adultos dominó la mayor cuota de mercado con un 57,8% en 2025, debido principalmente a la mayor exposición a pantallas digitales, la contaminación ambiental, la fatiga visual en el lugar de trabajo y las afecciones oculares relacionadas con el estilo de vida. La creciente prevalencia de ojo seco, alergias, lesiones corneales e infecciones es común en la población en edad laboral. El uso prolongado de pantallas y la fatiga digital contribuyen significativamente a las molestias oculares. Un mayor interés en la salud entre los adultos también aumenta las tasas de diagnóstico y tratamiento. El aumento del uso de lentes de contacto es otro factor clave que aumenta las complicaciones oculares. La población adulta es más propensa a invertir en tratamientos para una recuperación rápida debido a la preocupación por la productividad laboral. Un mejor acceso a los servicios de salud y una mayor concienciación sobre la salud ocular refuerzan aún más el liderazgo del segmento. Los adultos también son más propensos a las migrañas y al dolor ocular relacionado con la sinusitis. La combinación de estos elementos mantiene a este grupo como el principal consumidor de terapias para el dolor ocular.
Se espera que el segmento geriátrico experimente la CAGR más rápida del 9,4% entre 2026 y 2033, impulsada por el rápido envejecimiento de la población mundial y la creciente prevalencia de enfermedades oculares relacionadas con la edad. Afecciones como el glaucoma, las cataratas (dolor posoperatorio), la degeneración macular y el ojo seco crónico son muy comunes en las personas mayores. El deterioro de la función inmunitaria hace que los adultos mayores sean más susceptibles a infecciones e inflamación. La necesidad frecuente de cirugías oftalmológicas en geriatría aumenta los requisitos de manejo del dolor posoperatorio. Las crecientes inversiones en atención médica para el cuidado de personas mayores fortalecen aún más la demanda. Los gobiernos de todo el mundo están implementando programas de atención oftalmológica geriátrica, lo que respalda esta tendencia. El aumento de la esperanza de vida también amplía la base objetivo para el tratamiento continuo. Los familiares y cuidadores buscan cada vez más tratamiento especializado para pacientes mayores, lo que respalda el crecimiento constante del mercado.
• Por el usuario final
En función del usuario final, el mercado europeo del dolor ocular se segmenta en hospitales, clínicas especializadas, centros de atención domiciliaria, centros oftalmológicos, centros de cirugía ambulatoria y otros. El segmento de hospitales dominó la mayor cuota de mercado en ingresos, con un 41,6 % en 2025, gracias a la disponibilidad de instalaciones avanzadas de diagnóstico y tratamiento en un mismo lugar. Los casos de dolor ocular severo, traumatismos oculares y afecciones posquirúrgicas se atienden principalmente en entornos hospitalarios. La presencia de oftalmólogos, neurólogos y equipos quirúrgicos especializados impulsa un mayor volumen de pacientes. Los servicios de atención oftalmológica de emergencia son más accesibles en los hospitales, lo que aumenta la dependencia de los pacientes de estas instituciones. La infraestructura avanzada permite un diagnóstico preciso y un tratamiento oportuno. Los hospitales también atienden a la mayoría de los pacientes financiados y asegurados por el gobierno, lo que aumenta su participación financiera. La creciente urbanización y el desarrollo de infraestructura en el sector sanitario aumentan aún más la accesibilidad hospitalaria. El creciente número de procedimientos oftalmológicos también fortalece este segmento. La sólida confianza de los pacientes garantiza un dominio continuo.
Se espera que el segmento de Centros de Oftalmología experimente la tasa de crecimiento anual compuesta (TCAC) más rápida, del 10,3 %, entre 2026 y 2033, impulsada por la creciente demanda de servicios de atención oftalmológica especializados y específicos. Estos centros cuentan con profesionales dedicados y tecnología de vanguardia para diagnosticar y tratar el dolor ocular de forma más eficiente. La creciente preferencia por la atención especializada en lugar de los hospitales generales está acelerando el flujo de pacientes a estas instalaciones. La disponibilidad más rápida de citas y los períodos de espera más cortos también contribuyen a su creciente popularidad. La expansión de las cadenas privadas de oftalmología y los modelos de franquicia también impulsa el crecimiento. El aumento de las inversiones en equipos de diagnóstico modernos está mejorando los resultados de los pacientes. El turismo médico para la atención oftalmológica también beneficia a los centros especializados. Los planes de tratamiento personalizados en estos entornos los hacen muy atractivos para el manejo a largo plazo de las enfermedades oculares crónicas.
• Por canal de distribución
Según el canal de distribución, el mercado europeo del dolor ocular se segmenta en licitación directa, farmacia hospitalaria, farmacia minorista, farmacia en línea y otros. El segmento de farmacia hospitalaria dominó la mayor cuota de mercado en ingresos, con un 39,2 % en 2025, ya que la mayoría de los medicamentos recetados para el dolor ocular se dispensan directamente en los hospitales. Esto es especialmente común en pacientes quirúrgicos y aquellos que requieren atención de emergencia. La sólida integración entre el diagnóstico y el tratamiento permite el acceso inmediato a los medicamentos necesarios. Las farmacias hospitalarias cuentan con una amplia gama de medicamentos oculares especializados, incluyendo inyectables y formulaciones avanzadas. La distribución controlada y la supervisión profesional garantizan un uso correcto. El aumento del número de ingresos hospitalarios por problemas oculares fortalece este canal. La adquisición institucional mediante licitaciones también garantiza un suministro constante de productos. Los médicos suelen recomendar medicamentos disponibles directamente en las farmacias hospitalarias, lo que aumenta el volumen de ventas. Esta comodidad y fiabilidad mantienen a las farmacias hospitalarias como el canal dominante.
Se espera que el segmento de farmacias en línea experimente la tasa de crecimiento anual compuesta (TCAC) más rápida, del 11,5 %, entre 2026 y 2033, impulsada por la rápida digitalización y la creciente preferencia por la entrega de medicamentos a domicilio. El aumento del uso de teléfonos inteligentes y la penetración de internet facilitan a los pacientes la solicitud de medicamentos oftálmicos en línea. Los pacientes crónicos que requieren resurtidos de medicamentos prefieren las opciones de resurtido en línea. Los precios competitivos, los descuentos y la entrega a domicilio hacen que los canales en línea sean muy atractivos. El crecimiento de los sistemas de receta electrónica también está impulsando el uso de plataformas digitales. La mayor confianza en los servicios farmacéuticos en línea impulsa aún más la demanda. La expansión de farmacias en línea verificadas y reguladas está mejorando la seguridad y la aceptación. Se espera que esta transición hacia soluciones de atención médica digital impulse un sólido crecimiento a largo plazo en este segmento.
Análisis regional del mercado europeo del dolor ocular
- Se proyecta que el mercado europeo del dolor ocular se expandirá a una CAGR sustancial durante el período de pronóstico, impulsado principalmente por la creciente prevalencia de trastornos oculares, la creciente conciencia de la salud ocular y la disponibilidad de opciones avanzadas de diagnóstico y tratamiento en toda la región.
- La creciente urbanización, la exposición prolongada a las pantallas y el envejecimiento de la población contribuyen aún más a la creciente incidencia de afecciones asociadas con el dolor ocular.
- Además, las inversiones continuas en infraestructura sanitaria e investigación están apoyando la adopción de terapias innovadoras en hospitales, centros de oftalmología y clínicas especializadas en toda Europa.
Perspectivas del mercado del dolor ocular en el Reino Unido y Europa
El mercado europeo del dolor ocular en el Reino Unido dominó el mercado europeo con la mayor cuota de ingresos, un 35,2%, en 2025. Esto se debe a un sistema de salud bien desarrollado, una alta concienciación sobre la salud ocular, un amplio acceso a servicios oftalmológicos especializados y una sólida presencia de empresas líderes en productos farmacéuticos y dispositivos médicos, centradas en terapias oculares innovadoras. La creciente prevalencia de afecciones oculares como la sequedad ocular, el glaucoma y las infecciones, junto con el apoyo gubernamental a los servicios de atención oftalmológica, continúa consolidando el liderazgo del país en el mercado regional.
Análisis del mercado del dolor ocular en Alemania y Europa
Se prevé que el mercado europeo del dolor ocular en Alemania sea la región de mayor crecimiento, con una tasa de crecimiento anual compuesta (TCAC) del 8,4 % durante el período de pronóstico, impulsada por el aumento del gasto sanitario, el rápido envejecimiento de la población, la creciente prevalencia de enfermedades oculares crónicas, las sólidas actividades de investigación y desarrollo, y la creciente adopción de opciones de tratamiento avanzadas. El énfasis del país en la innovación, el diagnóstico precoz de enfermedades y el acceso a centros de salud de alta calidad está impulsando aún más la demanda de soluciones eficaces para el manejo del dolor ocular, tanto en entornos clínicos como domiciliarios.
Cuota de mercado del dolor ocular en Europa
La industria del dolor ocular está liderada principalmente por empresas bien establecidas, entre las que se incluyen:
- Alcon Inc. (Suiza)
- Santen Pharmaceutical Co., Ltd. (Japón)
- Industrias farmacéuticas Sun Ltd. (India)
- Teva Pharmaceutical Industries Ltd. (Israel)
- Bayer AG (Alemania)
- Otsuka Pharmaceutical Co., Ltd. (Japón)
- Merck & Co., Inc. (EE. UU.)
- AbbVie Inc. (EE. UU.)
- Aurobindo Pharma Ltd. (India)
- Cipla Ltd. (India)
- Perrigo Company plc (Irlanda)
- Regeneron Pharmaceuticals, Inc. (EE. UU.)
- Horizon Therapeutics (Irlanda)
- Laboratorios del Dr. Reddy (India)
- Hikma Pharmaceuticals PLC (Reino Unido)
Últimos avances en el mercado europeo del dolor ocular
- En octubre de 2021, la Administración de Alimentos y Medicamentos de los EE. UU. aprobó el aerosol nasal TYRVAYA™ (solución de vareniclina) para el tratamiento de los signos y síntomas de la enfermedad del ojo seco, lo que presenta la primera terapia administrada por vía nasal aprobada por la FDA para esta afección y ofrece una alternativa importante para los pacientes que tienen dificultades con la administración tradicional de gotas para los ojos, ampliando así las opciones de tratamiento para las molestias oculares.
- En octubre de 2021, la FDA aprobó una indicación complementaria para DEXTENZA® (inserto intracanalicular de dexametasona) para incluir el tratamiento de la picazón ocular asociada con la conjuntivitis alérgica, además de su uso existente en el dolor y la inflamación ocular posquirúrgicos, lo que fortalece el papel de los sistemas de administración de fármacos oculares de liberación sostenida en el manejo de las molestias relacionadas con los ojos.
- En noviembre de 2022 (con la transacción completada en enero de 2023), Viatris anunció y finalizó la adquisición de Oyster Point Pharma, el desarrollador de TYRVAYA, estableciendo un segmento comercial dedicado al cuidado de los ojos destinado a expandir su presencia en el mercado de oftalmología de América del Norte y mejorar el alcance comercial de terapias innovadoras que abordan el dolor y el malestar de la superficie ocular.
- En noviembre de 2024, Aldeyra Therapeutics anunció que la FDA aceptó su solicitud de nuevo fármaco para reproxalap, una novedosa terapia tópica que se está desarrollando para la enfermedad del ojo seco, y le asignó un cronograma de revisión regulatoria, lo que destaca uno de los desarrollos de etapa tardía más seguidos en tratamientos dirigidos al dolor ocular provocado por la inflamación.
- En abril de 2025, la FDA emitió una Carta de Respuesta Completa para reproxalap, indicando que se requería evidencia clínica adicional para demostrar una eficacia suficiente, lo que llevó a la compañía a delinear planes para ensayos adicionales y nueva presentación, lo que refleja los estrictos estándares regulatorios aplicados a nuevos tratamientos en el segmento del dolor ocular y ojo seco.
- En mayo de 2025, Alcon recibió la aprobación de la FDA para TRYPTYR (solución oftálmica de acoltremon) al 0,003 % para el tratamiento de los signos y síntomas de la enfermedad del ojo seco, lo que fortaleció su cartera oftálmica y destacó la innovación continua en terapias dirigidas a la irritación, el malestar y los componentes inflamatorios del dolor ocular.
SKU-
Obtenga acceso en línea al informe sobre la primera nube de inteligencia de mercado del mundo

- Panel de análisis de datos interactivo
- Panel de análisis de empresas para oportunidades con alto potencial de crecimiento
- Acceso de analista de investigación para personalización y consultas
- Análisis de la competencia con panel interactivo
- Últimas noticias, actualizaciones y análisis de tendencias
- Aproveche el poder del análisis de referencia para un seguimiento integral de la competencia
Metodología de investigación
La recopilación de datos y el análisis del año base se realizan utilizando módulos de recopilación de datos con muestras de gran tamaño. La etapa incluye la obtención de información de mercado o datos relacionados a través de varias fuentes y estrategias. Incluye el examen y la planificación de todos los datos adquiridos del pasado con antelación. Asimismo, abarca el examen de las inconsistencias de información observadas en diferentes fuentes de información. Los datos de mercado se analizan y estiman utilizando modelos estadísticos y coherentes de mercado. Además, el análisis de la participación de mercado y el análisis de tendencias clave son los principales factores de éxito en el informe de mercado. Para obtener más información, solicite una llamada de un analista o envíe su consulta.
La metodología de investigación clave utilizada por el equipo de investigación de DBMR es la triangulación de datos, que implica la extracción de datos, el análisis del impacto de las variables de datos en el mercado y la validación primaria (experto en la industria). Los modelos de datos incluyen cuadrícula de posicionamiento de proveedores, análisis de línea de tiempo de mercado, descripción general y guía del mercado, cuadrícula de posicionamiento de la empresa, análisis de patentes, análisis de precios, análisis de participación de mercado de la empresa, estándares de medición, análisis global versus regional y de participación de proveedores. Para obtener más información sobre la metodología de investigación, envíe una consulta para hablar con nuestros expertos de la industria.
Personalización disponible
Data Bridge Market Research es líder en investigación formativa avanzada. Nos enorgullecemos de brindar servicios a nuestros clientes existentes y nuevos con datos y análisis que coinciden y se adaptan a sus objetivos. El informe se puede personalizar para incluir análisis de tendencias de precios de marcas objetivo, comprensión del mercado de países adicionales (solicite la lista de países), datos de resultados de ensayos clínicos, revisión de literatura, análisis de mercado renovado y base de productos. El análisis de mercado de competidores objetivo se puede analizar desde análisis basados en tecnología hasta estrategias de cartera de mercado. Podemos agregar tantos competidores sobre los que necesite datos en el formato y estilo de datos que esté buscando. Nuestro equipo de analistas también puede proporcionarle datos en archivos de Excel sin procesar, tablas dinámicas (libro de datos) o puede ayudarlo a crear presentaciones a partir de los conjuntos de datos disponibles en el informe.

