
Mercado europeo de microrredes por conectividad (fuera de la red/isla/remoto, conectado a la red), oferta (hardware, software, servicios), patrón (urbano, semiurbano, isla remota), fuente (generadores diésel, cogeneración, energía solar fotovoltaica, gas natural, otros), almacenamiento (iones de litio, plomo ácido, baterías solares, volante de inercia, otros), tipo de red (microrred de CA, microrred de CC, microrred híbrida), capacidad (menos de 5000 MW, 5001 – 10 000 MW, 10 001 – 15 000 MW, más de 15 000 MW), control (control primario (local), secundario, control terciario (optimización)), aplicación (ubicación remota, servicios públicos, industrial, campus, militar, ciudad inteligente, centro de datos, hospital, escuela, otros): tendencias de la industria y pronóstico hasta 2029.
Definición de mercado
Una microrred es un sistema energético diferenciado que consta de cargas interconectadas y recursos energéticos distribuidos que pueden funcionar en paralelo o independientemente de la red eléctrica principal. Las microrredes, en general, son versiones más pequeñas de las redes eléctricas que transportan electricidad desde los generadores hasta los consumidores. Ayudan a reducir los costos generales y brindan respaldo a la red en caso de un corte de energía. Las microrredes son más eficientes que las redes eléctricas comunes y se pueden integrar con una variedad de fuentes de energía renovable, como la solar, la eólica, la hidroeléctrica a pequeña escala, la geotermia, la conversión de residuos en energía y los sistemas combinados de calor y electricidad (CHP). También se pueden usar baterías, generadores distribuidos y paneles solares para alimentarlas. Además, también son una fuente confiable de electricidad porque funcionan de manera continua durante los cortes de energía.
Análisis y tamaño del mercado
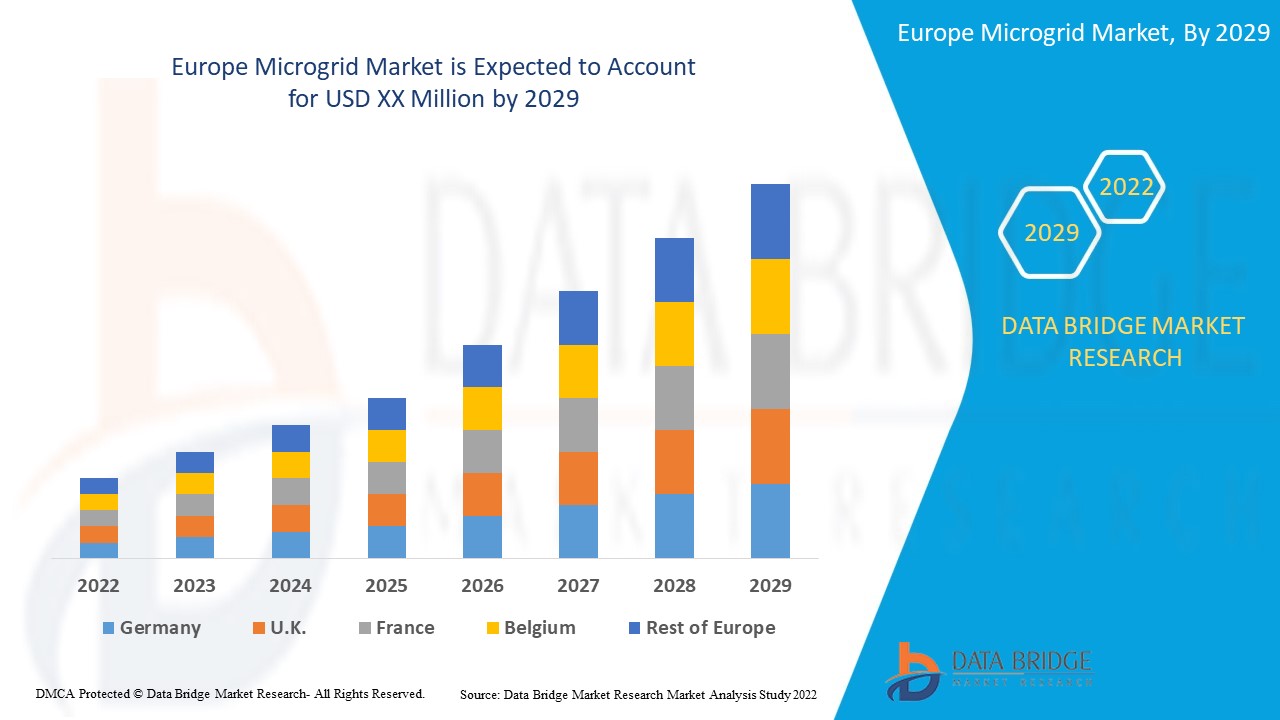
Data Bridge Market Research analiza que se espera que el mercado de microrredes de Europa alcance un valor de USD 7295,30 millones para 2029, con una CAGR del 15,6 % durante el período de pronóstico. El informe del mercado de microrredes también cubre en profundidad el análisis de precios, el análisis de patentes y los avances tecnológicos.
|
Métrica del informe |
Detalles |
|
Período de pronóstico |
2022 a 2029 |
|
Año base |
2021 |
|
Años históricos |
2020 (Personalizable para 2019-2014) |
|
Unidades cuantitativas |
Ingresos en millones de USD, precios en USD |
|
Segmentos cubiertos |
Por conectividad (fuera de la red/isla/remoto, conectado a la red), oferta (hardware, software, servicios), patrón (urbano, semiurbano, isla remota), fuente (generadores diésel, cogeneración, energía solar fotovoltaica, gas natural, otros), almacenamiento (iones de litio, ácido de plomo , baterías solares, volante de inercia, otros), tipo de red (microrred de CA, microrred de CC, microrred híbrida), capacidad (menos de 5000 MW, 5001 – 10 000 MW, 10 001 – 15 000 MW, más de 15 000 MW), control (control primario [local], control secundario, control terciario [optimización]), aplicación (ubicación remota, servicio público, industrial, campus, militar, ciudad inteligente , centro de datos, hospital, escuela, otros) |
|
Países cubiertos |
Alemania, Francia, Reino Unido, Países Bajos, Suiza, Bélgica, Rusia, Italia, España, Turquía y resto de Europa en Europa |
|
Actores del mercado cubiertos |
ABB, Rolls-Royce plc, Schneider Electric, Cummins Inc., Siemens, Caterpillar, General Electric, Tesla, Black & Veatch Holding Company, Honeywell International Inc., Eaton, Norvento Energía, InnoVentum y Hitachi Energy Ltd. |
Dinámica del mercado de microrredes
En esta sección se aborda la comprensión de los factores impulsores del mercado, las ventajas, las oportunidades, las limitaciones y los desafíos. Todo esto se analiza en detalle a continuación:
Conductores
- El cambio de tendencias hacia la generación de energía basada en gas impulsará la industria de microrredes basadas en gas natural
El sector energético está experimentando cambios sustanciales para promover la eficiencia, reducir las emisiones e implementar tecnologías de manera eficaz que equilibren los costos y los beneficios. Una solución emergente es aplicar la tecnología de conversión de energía en gas, que puede utilizarse para diferentes propósitos en los sistemas eléctricos. Además, las normas y políticas gubernamentales favorables para la integración de fuentes de generación de energía sostenibles y eficientes han impulsado la infraestructura de microrredes en toda la región.
- Aumento de la demanda de suministro eléctrico ininterrumpido y confiable para diversas aplicaciones
En los últimos años, la demanda mundial de energía ha aumentado, impulsada aún más por la demanda en las economías emergentes y el crecimiento de la economía mundial en general. Hoy en día, se construyen redes gigantescas en toda la región, que conectan las centrales eléctricas con los hogares y las empresas a través de cables. La electricidad generada por grandes centrales eléctricas remotas ahora está conectada a redes eléctricas centralizadas y utiliza combustibles fósiles para transmitir energía a través de diferentes regiones y países. Sin embargo, las deficiencias de estas centrales eléctricas en términos de transmisión de energía ineficiente se han vuelto cada vez más evidentes. Por lo tanto, la instalación de microrredes puede mejorar la gestión de la oferta y la demanda de energía local, lo que puede ayudar aún más a diferir las costosas inversiones de las empresas de servicios públicos en nueva generación de energía. Además, las microrredes pueden implementar más fuentes de electricidad de emisión cero, reduciendo así las emisiones de gases de efecto invernadero.
Oportunidad
- Aumento de la demanda de energía renovable en toda la región
La demanda de energía limpia y ecológica en las zonas urbanas y remotas aumenta cada día. En particular, los proyectos de microrredes en zonas remotas o insulares funcionan principalmente con fuentes de energía renovables, como la solar, la eólica, la hidroeléctrica y otras. La menor disponibilidad de combustibles fósiles convencionales en dichas zonas contribuye a la creciente necesidad de energía renovable. Los gobiernos también están trabajando para aumentar la producción de energía renovable a fin de reducir la huella de carbono. Por lo tanto, el crecimiento de la industria de la energía renovable creará nuevas oportunidades para el crecimiento del mercado de microrredes en Europa.
Restricciones/Desafíos
- Incertidumbre en las leyes y regulaciones relacionadas con la generación de energía distribuida
A pesar del creciente interés en la generación de energía distribuida, no existen leyes, políticas o instrumentos regulatorios claros asociados con las repercusiones de la integración de la generación distribuida (GD) en los sistemas de energía eléctrica. Se requieren políticas e instrumentos regulatorios claramente definidos asociados con la penetración de la GD en la red para que estos sistemas prosperen. La Unión Europea no tiene leyes ni regulaciones para las redes inteligentes o las microrredes. Solo han proporcionado directivas para la implementación de soluciones de microrredes. Las barreras de incertidumbre regulatoria y de políticas, que se relacionan con un mal diseño de políticas, la discontinuidad y la transparencia insuficiente de las políticas y la legislación, actúan como un factor restrictivo para el crecimiento del mercado de las microrredes en Europa.
- Falta de experiencia operativa con configuraciones de microrredes
Actualmente existen varias barreras potenciales para la implementación de microrredes, para las cuales aún se están desarrollando soluciones. El control de potencia y frecuencia en un sistema pequeño y aislado es difícil porque los cambios en la demanda local y la salida de generación distribuida tienen un impacto relativo mucho mayor en el sistema que en los sistemas convencionales de gran tamaño. Esto hace que mantener la estabilidad sea un desafío importante. La protección también es una preocupación importante porque, tradicionalmente, los sistemas de protección en redes de baja tensión se diseñaban para flujos de potencia unidireccionales. Además, cualquier generación distribuida conectada debe desconectarse al detectar una falla del sistema para evitar flujos de potencia inversos excesivos.
Impacto posterior al COVID-19 en el mercado de microrredes
La COVID-19 ha tenido un gran impacto en el mercado de microrredes, ya que casi todos los países han optado por cerrar todas las instalaciones de producción, excepto las que se dedican a producir bienes esenciales.
La pandemia de COVID-19 ha afectado al mercado de microrredes de manera negativa. Por lo tanto, el mercado ha tenido una tasa de crecimiento interanual estimada más baja en comparación con 2019 debido a la menor cantidad de actividades de los sectores asociados con el mercado de microrredes. Sin embargo, el crecimiento ha sido alto después de la apertura del mercado después de COVID-19, y se espera que haya un crecimiento considerable en el sector debido a una mayor demanda de energía distribuida. Y se espera que este factor impulse aún más el crecimiento general del mercado.
Los fabricantes y proveedores de soluciones están tomando diversas decisiones estratégicas para recuperarse tras la COVID-19. Los actores están llevando a cabo múltiples actividades de investigación y desarrollo para mejorar la tecnología involucrada en la microrred. Con esto, las empresas traerán tecnologías avanzadas al mercado. Además, las iniciativas gubernamentales para el uso de vehículos eléctricos han impulsado el crecimiento del mercado .
Acontecimientos recientes
- En marzo de 2022, Siemens implementó la primera microrred de Medio Oriente diseñada para uso industrial, lo que permitió a Qatar Solar Energy (QSE) reducir los costos de electricidad, frenar las emisiones de carbono y beneficiarse de un suministro de energía más estable.
- En enero de 2021, ABB impulsó el despliegue de microrredes a escala global para brindar soluciones inteligentes y sostenibles para un mundo que necesita un cambio importante hacia las energías renovables para lograr una reducción anual global de los gases de efecto invernadero.
Alcance del mercado de microrredes en Europa
El mercado de microrredes está segmentado en función de la conectividad, la oferta, el patrón, la fuente, el almacenamiento, el tipo de red, la capacidad, el control y la aplicación.
El crecimiento entre estos segmentos le ayudará a analizar segmentos de crecimiento magros en las industrias y brindará a los usuarios una valiosa descripción general del mercado y conocimientos del mercado para ayudarlos a tomar decisiones estratégicas para identificar aplicaciones de mercado centrales.
Conectividad
- Fuera de la red/Isla/Remoto
- Conectado a la red
Sobre la base de la conectividad, el mercado de microrredes de Europa está segmentado en fuera de la red/isla/remoto y conectado a la red.
Ofrenda
- Hardware
- Software
- Servicios
Sobre la base de la oferta, el mercado de microrredes de Europa se ha segmentado en hardware, software y servicios.
Patrón
- Urbano
- Semiurbano
- Isla remota
Sobre la base del patrón, el mercado de microrredes de Europa está segmentado en zonas urbanas, semiurbanas e insulares remotas.
Fuente
- Generadores diésel
- cogeneración
- Energía solar fotovoltaica
- Gas natural
- Otros
Sobre la base de la fuente, el mercado de microrredes de Europa se ha segmentado en generadores diésel, cogeneración, energía solar fotovoltaica, gas natural y otros.
Almacenamiento
- Iones de litio
- Plomo ácido
- Baterías solares
- Volante
- Baterías de flujo
- Otros
Sobre la base del almacenamiento, el mercado de microrredes de Europa se ha segmentado en iones de litio, plomo-ácido, baterías solares, volante de inercia, baterías de flujo y otras.
Tipo de cuadrícula
- Microrred de CA
- Microrred de CC
- Microrred híbrida
Sobre la base del tipo de red, el mercado de microrredes de Europa se ha segmentado en microrredes de CA, microrredes de CC y microrredes híbridas.
Capacidad
- Menos de 5.000 MW
- 5.001 – 10.000 MW
- 10.001 – 15.000 MW
- Más de 15.000 MW
Sobre la base de la capacidad, el mercado de microrredes de Europa se ha segmentado en menos de 5.000 MW, entre 5.001 y 10.000 MW, entre 10.001 y 15.000 MW y más de 15.000 MW.
Control
- Primario (Control local)
- Secundario
- Control terciario (optimización)
Sobre la base del control, el mercado europeo de microrredes se ha segmentado en control primario (control local), secundario y terciario (optimización).
Solicitud
- Ubicación remota
- Utilidad
- Industrial
- Campus
- Militar
- Ciudad inteligente
- Centro de datos
- Hospital
- Escuela
- Otros
Sobre la base del control, el mercado de microrredes de Europa se ha segmentado en ubicaciones remotas, servicios públicos, industriales, campus, militares, ciudades inteligentes, centros de datos, hospitales, escuelas y otros.
Análisis y perspectivas regionales del mercado de microrredes
Se analiza el mercado de microrredes y se proporcionan información y tendencias del tamaño del mercado por país, conectividad, oferta, patrón, fuente, almacenamiento, tipo de red, capacidad, control y aplicación como se mencionó anteriormente.
Los países incluidos en el informe sobre el mercado de microrredes son Alemania, Francia, Reino Unido, Países Bajos, Suiza, Bélgica, Rusia, Italia, España, Turquía y el resto de Europa. Alemania domina la región europea debido a que la creciente dependencia de la madera ha cobrado impulso.
La sección de países del informe también proporciona factores de impacto de mercado individuales y cambios en la regulación del mercado que afectan las tendencias actuales y futuras del mercado. Los puntos de datos como el análisis de la cadena de valor ascendente y descendente, las tendencias técnicas y el análisis de las cinco fuerzas de Porter, los estudios de casos son algunos de los indicadores utilizados para pronosticar el escenario del mercado para países individuales. Además, la presencia y disponibilidad de marcas europeas y sus desafíos enfrentados debido a la gran o escasa competencia de las marcas locales y nacionales, el impacto de los aranceles nacionales y las rutas comerciales se consideran al proporcionar un análisis de pronóstico de los datos del país.
Análisis del panorama competitivo y la cuota de mercado de las microrredes
El panorama competitivo del mercado de microrredes proporciona detalles por competidor. Los detalles incluidos son una descripción general de la empresa, las finanzas de la empresa, los ingresos generados, el potencial de mercado, la inversión en investigación y desarrollo, las nuevas iniciativas de mercado, la presencia en Europa, los sitios e instalaciones de producción, las capacidades de producción, las fortalezas y debilidades de la empresa, el lanzamiento de productos, la amplitud y variedad de productos, y el dominio de las aplicaciones. Los puntos de datos anteriores proporcionados solo están relacionados con el enfoque de las empresas en relación con el mercado de microrredes.
Algunos de los principales actores que operan en el mercado de microrredes son ABB, Rolls-Royce plc, Schneider Electric, Cummins Inc., Siemens, Caterpillar, General Electric, Tesla, Black & Veatch Holding Company, Honeywell International Inc., Eaton, Norvento Enerxía, InnoVentum, Hitachi Energy Ltd. entre otros.
SKU-
Obtenga acceso en línea al informe sobre la primera nube de inteligencia de mercado del mundo

- Panel de análisis de datos interactivo
- Panel de análisis de empresas para oportunidades con alto potencial de crecimiento
- Acceso de analista de investigación para personalización y consultas
- Análisis de la competencia con panel interactivo
- Últimas noticias, actualizaciones y análisis de tendencias
- Aproveche el poder del análisis de referencia para un seguimiento integral de la competencia
Tabla de contenido
1 INTRODUCTION
1.1 OBJECTIVES OF THE STUDY
1.2 MARKET DEFINITION
1.3 OVERVIEW OF EUROPE MICROGRID MARKET
1.4 CURRENCY AND PRICING
1.5 LIMITATIONS
1.6 MARKETS COVERED
2 MARKET SEGMENTATION
2.1 MARKETS COVERED
2.2 GEOGRAPHICAL SCOPE
2.3 YEARS CONSIDERED FOR THE STUDY
2.4 DBMR TRIPOD DATA VALIDATION MODEL
2.5 PRIMARY INTERVIEWS WITH KEY OPINION LEADERS
2.6 DBMR MARKET POSITION GRID
2.7 MULTIVARIATE MODELING
2.8 CONNECTIVITY TIMELINE CURVE
2.9 MARKET CHALLENGE MATRIX
2.1 SECONDARY SOURCES
2.11 ASSUMPTIONS
3 EXECUTIVE SUMMARY
4 PREMIUM INSIGHTS
4.1 REGULATORY LANDSCAPE:
4.2 PORTER'S FIVE FORCES MODEL
4.3 ADOPTION RATES AND HEADWINDS IN TECHNOLOGY
4.4 COST ANALYSIS BREAKDOWN OF MICROGRIDS
4.5 LIST OF MICROGRIDS PROJECTS
4.6 EUROPEAN GRANTS FOR MICROGRID PROJECTS
4.7 CASE STUDY
4.7.1 PROBLEM STATEMENT & SOLUTION:
4.7.2 PROBLEM STATEMENT & SOLUTION:
4.8 EXAMPLES OF TYPICAL MICROGRID PROJECTS IN EUROPE
4.8.1 PACE PROJECT
4.8.2 KYTHNOS MICROGRID PROJECT
4.8.3 ISLE OF EIGG MICROGRID PROJECT
5 MARKET OVERVIEW
5.1 DRIVERS
5.1.1 THE SHIFT IN TRENDS TOWARD GAS-BASED POWER GENERATION WILL FUEL THE NATURAL GAS-BASED MICROGRID INDUSTRY
5.1.2 INCREASE IN DEMAND FOR UNINTERRUPTED AND RELIABLE POWER SUPPLY FOR VARIOUS APPLICATIONS
5.1.3 RISE IN ENERGY- AS- A -SERVICE (EAAS) MODEL TO MINIMIZE COST IN THE ENERGY SECTOR
5.2 RESTRAINTS
5.2.1 UNCERTAINTY IN-LAWS AND REGULATIONS RELATED TO DISTRIBUTED ENERGY GENERATION
5.2.2 INCREASE IN ENERGY PRICES IN EUROPE
5.3 OPPORTUNITIES
5.3.1 RISE IN ACQUISITIONS & PARTNERSHIPS AMONG VARIOUS ORGANIZATIONS
5.3.2 INCREASE IN DEMAND FOR RENEWABLE ENERGY ACROSS THE REGION
5.3.3 GOVERNMENT FUNDING IN MICROGRID PROJECTS
5.4 CHALLENGES
5.4.1 LACK OF OPERATING EXPERIENCE WITH MICROGRID CONFIGURATIONS
5.4.2 RESTRICTIONS FROM UTILITY FRANCHISE RIGHTS AND LIMITED RETAIL MARKET ACCESS
5.4.3 INCREASE IN CYBER SECURITY CONCERNS AND REGULATORY BARRIERS
6 EUROPE MICROGRID MARKET, BY CONNECTIVITY
6.1 OVERVIEW
6.2 GRID CONNECTED
6.3 OFF-GRID/ISLAND/REMOTE
7 EUROPE MICROGRID MARKET, BY OFFERING
7.1 OVERVIEW
7.2 HARDWARE
7.2.1 POWER GENERATORS
7.2.1.1 PV MODULES
7.2.1.2 WIND GENERATORS
7.2.1.3 SMALL HYDRO
7.2.1.4 FUEL CELLS
7.2.1.5 BIOMASS PLANT
7.2.1.6 MICROTURBINES
7.2.1.7 OTHERS
7.2.2 ENERGY STORAGE & DISTRIBUTORS
7.2.2.1 BATTERIES
7.2.2.2 FLYWHEELS
7.2.2.3 ULTRACAPACITORS
7.2.3 CONTROLLERS
7.2.4 OTHERS
7.3 SOFTWARE
7.4 SERVICES
7.4.1 SUPPORT & MAINTENANCE
7.4.2 IMPLEMENTATION
7.4.3 TESTING
7.4.4 TRAINING
8 EUROPE MICROGRID MARKET, BY PATTERN
8.1 OVERVIEW
8.2 URBAN
8.3 REMOTE ISLAND
8.4 SEMI-URBAN
9 EUROPE MICROGRID MARKET, BY SOURCE
9.1 OVERVIEW
9.2 DIESEL GENERATORS
9.3 CHP
9.4 SOLAR PV
9.5 NATURAL GAS
9.6 OTHERS
10 EUROPE MICROGRID MARKET, BY STORAGE
10.1 OVERVIEW
10.2 LITHIUM-ION
10.3 LEAD ACID
10.4 FLYWHEEL
10.5 FLOW BATTERIES
10.6 OTHERS
11 EUROPE MICROGRID MARKET, BY GRID TYPE
11.1 OVERVIEW
11.2 AC MICROGRID
11.3 DC MICROGRID
11.4 HYBRID MICROGRID
12 EUROPE MICROGRID MARKET, BY CAPACITY
12.1 OVERVIEW
12.2 LESS THAN 5,000 MW
12.3 5,001 MW - 10,000 MW
12.4 10,001 MW - 15,000 MW
12.5 MORE THAN 15,000 MW
13 EUROPE MICROGRID MARKET, BY CONTROL
13.1 OVERVIEW
13.2 PRIMARY (LOCAL CONTROL)
13.3 SECONDARY
13.3.1 DECENTRALIZED
13.3.2 CENTRALIZED
13.4 TERTIARY (OPTIMIZATION) CONTROL
14 EUROPE MICROGRID MARKET, BY APPLICATION
14.1 OVERVIEW
14.2 REMOTE LOCATION
14.2.1 HARDWARE
14.2.2 SOFTWARE
14.2.3 SERVICES
14.3 UTILITY
14.3.1 HARDWARE
14.3.2 SOFTWARE
14.3.3 SERVICES
14.4 INDUSTRIAL
14.4.1 HARDWARE
14.4.2 SOFTWARE
14.4.3 SERVICES
14.5 CAMPUS
14.5.1 HARDWARE
14.5.2 SOFTWARE
14.5.3 SERVICES
14.6 MILITARY
14.6.1 HARDWARE
14.6.2 SOFTWARE
14.6.3 SERVICES
14.7 SMART CITY
14.7.1 HARDWARE
14.7.2 SOFTWARE
14.7.3 SERVICES
14.8 DATA CENTER
14.8.1 HARDWARE
14.8.2 SOFTWARE
14.8.3 SERVICES
14.9 HOSPITAL
14.9.1 HARDWARE
14.9.2 SOFTWARE
14.9.3 SERVICES
14.1 SCHOOL
14.10.1 HARDWARE
14.10.2 SOFTWARE
14.10.3 SERVICES
14.11 OTHERS
15 EUROPE
15.1 GERMANY
15.2 U.K.
15.3 FRANCE
15.4 SPAIN
15.5 ITALY
15.6 RUSSIA
15.7 NETHERLANDS
15.8 SWITZERLAND
15.9 BELGIUM
15.1 TURKEY
15.11 REST OF EUROPE
16 EUROPE MICROGRID MARKET, COMPANY LANDSCAPE
16.1 COMPANY SHARE ANALYSIS: EUROPE
17 SWOT ANALYSIS
18 COMPANY PROFILE
18.1 ABB
18.1.1 COMPANY SNAPSHOT
18.1.2 REVENUE ANALYSIS
18.1.3 SERVICE PORTFOLIO
18.1.4 RECENT DEVELOPMENT
18.2 ROLLS-ROYCE PLC
18.2.1 COMPANY SNAPSHOT
18.2.2 REVENUE ANALYSIS
18.2.3 PRODUCT PORTFOLIO
18.2.4 RECENT DEVELOPMENT
18.3 SCHINDER ELECTRIC
18.3.1 COMPANY SNAPSHOT
18.3.2 REVENUE ANALYSIS
18.3.3 PRODUCT PORTFOLIO
18.3.4 RECENT DEVELOPMENTS
18.4 CUMMINS INC.
18.4.1 COMPANY SNAPSHOT
18.4.2 REVENUE ANALYSIS
18.4.3 PRODUCT PORTFOLIO
18.4.4 RECENT DEVELOPMENT
18.5 SIEMENS
18.5.1 COMPANY SNPASHOT
18.5.2 REVENUE ANALYSIS
18.5.3 PRODUCT PORTFOLIO
18.5.4 RECENT DEVELOPMENTS
18.6 BLACK & VEATCH HOLDING COMPANY
18.6.1 COMPANY SNAPSHOT
18.6.2 SERVICE PORTFOLIO
18.6.3 RECENT DEVELOPMENT
18.7 CATERPILLAR
18.7.1 COMPANY SNAPSHOT
18.7.2 REVENUE ANALYSIS
18.7.3 SERVICE PORTFOLIO
18.7.4 RECENT DEVELOPMENT
18.8 EATON
18.8.1 COMPANY SNAPSHOT
18.8.2 REVENUE ANALYSIS
18.8.3 PRODUCT PORTFOLIO
18.8.4 RECENT DEVELOPMENTS
18.9 GENERAL ELECTRIC
18.9.1 COMPANY SNAPSHOT
18.9.2 REVENUE ANALYSIS
18.9.3 PRODUCT PORTFOLIO
18.9.4 RECENT DEVELOPMENTS
18.1 HITACHI ENERGY LTD
18.10.1 COMPANY SNAPSHOT
18.10.2 REVENUE ANALYSIS
18.10.3 SOLUTION PORTFOLIO
18.10.4 RECENT DEVELOPMENT
18.11 HONEYWELL INTERNATIONAL INC.
18.11.1 COMPANY SNAPSHOT
18.11.2 REVENUE ANALYSIS
18.11.3 PRODUCT PORTFOLIO
18.11.4 RECENT DEVELOPMENT
18.12 INNOVENTUM
18.12.1 COMPANY SNAPSHOT
18.12.2 PRODUCT PORTFOLIO
18.12.3 RECENT DEVELOPMENT
18.13 NORVENTO ENERXÍA
18.13.1 COMPANY SNAPSHOT
18.13.2 PRODUCT PORTFOLIO
18.13.3 RECENT DEVELOPMENT
18.14 TESLA
18.14.1 COMPANY SNAPSHOT
18.14.2 REVENUE ANALYSIS
18.14.3 PRODUCT PORTFOLIO
18.14.4 RECENT DEVELOPMENTS
19 QUESTIONNAIRE
20 RELATED REPORTS
Lista de Tablas
TABLE 1 EUROPE MICROGRID MARKET, BY CONNECTIVITY, 2020-2029 (USD MILLION)
TABLE 2 EUROPE MICROGRID MARKET, BY OFFERING, 2020-2029 (USD MILLION)
TABLE 3 EUROPE HARDWARE IN MICROGRID MARKET, BY TYPE, 2020-2029 (USD MILLION)
TABLE 4 EUROPE POWER GENERATORS IN MICROGRID MARKET, BY TYPE, 2020-2029 (USD MILLION)
TABLE 5 EUROPE ENERGY STORAGE & DISTRIBUTORS IN MICROGRID MARKET, BY TYPE, 2020-2029 (USD MILLION)
TABLE 6 EUROPE SERVICES IN MICROGRID MARKET, BY TYPE, 2020-2029 (USD MILLION)
TABLE 7 EUROPE MICROGRID MARKET, BY PATTERN, 2020-2029 (USD MILLION)
TABLE 8 EUROPE MICROGRID MARKET, BY SOURCE, 2020-2029 (USD MILLION)
TABLE 9 EUROPE MICROGRID MARKET, BY STORAGE, 2020-2029 (USD MILLION)
TABLE 10 EUROPE MICROGRID MARKET, BY GRID TYPE, 2020-2029 (USD MILLION)
TABLE 11 EUROPE MICROGRID MARKET, BY CAPACITY, 2020-2029 (USD MILLION)
TABLE 12 EUROPE MICROGRID MARKET, BY CONTROL, 2020-2029 (USD MILLION)
TABLE 13 EUROPE SECONDARY IN MICROGRID MARKET, BY TYPE, 2020-2029 (USD MILLION)
TABLE 14 EUROPE MICROGRID MARKET, BY APPLICATION, 2020-2029 (USD MILLION)
TABLE 15 EUROPE REMOTE LOCATION IN MICROGRID MARKET, BY OFFERING, 2020-2029 (USD MILLION)
TABLE 16 EUROPE UTILITY IN MICROGRID MARKET, BY OFFERING, 2020-2029 (USD MILLION)
TABLE 17 EUROPE INDUSTRIAL IN MICROGRID MARKET, BY OFFERING, 2020-2029 (USD MILLION)
TABLE 18 EUROPE CAMPUS IN MICROGRID MARKET, BY OFFERING, 2020-2029 (USD MILLION)
TABLE 19 EUROPE MILITARY IN MICROGRID MARKET, BY OFFERING, 2020-2029 (USD MILLION)
TABLE 20 EUROPE SMART CITY IN MICROGRID MARKET, BY OFFERING, 2020-2029 (USD MILLION)
TABLE 21 EUROPE DATA CENTER IN MICROGRID MARKET, BY OFFERING, 2020-2029 (USD MILLION)
TABLE 22 EUROPE HOSPITAL IN MICROGRID MARKET, BY OFFERING, 2020-2029 (USD MILLION)
TABLE 23 EUROPE SCHOOL IN MICROGRID MARKET, BY OFFERING, 2020-2029 (USD MILLION)
TABLE 24 EUROPE MICROGRID MARKET, BY COUNTRY, 2020-2029 (USD MILLION)
TABLE 25 GERMANY MICROGRID MARKET, BY CONNECTIVITY, 2020-2029 (USD MILLION)
TABLE 26 GERMANY MICROGRID MARKET, BY OFFERING, 2020-2029 (USD MILLION)
TABLE 27 GERMANY HARDWARE IN MICROGRID MARKET, BY TYPE, 2020-2029 (USD MILLION)
TABLE 28 GERMANY POWER GENERATORS IN MICROGRID MARKET, BY TYPE, 2020-2029 (USD MILLION)
TABLE 29 GERMANY ENERGY STORAGE & DISTRIBUTORS MICROGRID MARKET, BY TYPE, 2020-2029 (USD MILLION)
TABLE 30 GERMANY SERVICES IN MICROGRID MARKET, BY TYPE, 2020-2029 (USD MILLION)
TABLE 31 GERMANY MICROGRID MARKET, BY PATTERN, 2020-2029 (USD MILLION)
TABLE 32 GERMANY MICROGRID MARKET, BY SOURCE, 2020-2029 (USD MILLION)
TABLE 33 GERMANY MICROGRID MARKET, BY STORAGE, 2020-2029 (USD MILLION)
TABLE 34 GERMANY MICROGRID MARKET, BY GRID TYPE, 2020-2029 (USD MILLION)
TABLE 35 GERMANY MICROGRID MARKET, BY CAPACITY, 2020-2029 (USD MILLION)
TABLE 36 GERMANY MICROGRID MARKET, BY CONTROL, 2020-2029 (USD MILLION)
TABLE 37 GERMANY SECONDARY IN MICROGRID MARKET, BY TYPE, 2020-2029 (USD MILLION)
TABLE 38 GERMANY MICROGRID MARKET, BY APPLICATION, 2020-2029 (USD MILLION)
TABLE 39 GERMANY REMOTE LOCATION IN MICROGRID MARKET, BY OFFERING, 2020-2029 (USD MILLION)
TABLE 40 GERMANY UTILITY IN MICROGRID MARKET, BY OFFERING, 2020-2029 (USD MILLION)
TABLE 41 GERMANY INDUSTRIAL IN MICROGRID MARKET, BY OFFERING, 2020-2029 (USD MILLION)
TABLE 42 GERMANY CAMPUS IN MICROGRID MARKET, BY OFFERING, 2020-2029 (USD MILLION)
TABLE 43 GERMANY MILITARY IN MICROGRID MARKET, BY OFFERING, 2020-2029 (USD MILLION)
TABLE 44 GERMANY SMART CITY IN MICROGRID MARKET, BY OFFERING, 2020-2029 (USD MILLION)
TABLE 45 GERMANY DATA CENTER IN MICROGRID MARKET, BY OFFERING, 2020-2029 (USD MILLION)
TABLE 46 GERMANY HOSPITAL IN MICROGRID MARKET, BY OFFERING, 2020-2029 (USD MILLION)
TABLE 47 GERMANY SCHOOL IN MICROGRID MARKET, BY OFFERING, 2020-2029 (USD MILLION)
TABLE 48 U.K. MICROGRID MARKET, BY CONNECTIVITY, 2020-2029 (USD MILLION)
TABLE 49 U.K. MICROGRID MARKET, BY OFFERING, 2020-2029 (USD MILLION)
TABLE 50 U.K. HARDWARE IN MICROGRID MARKET, BY TYPE, 2020-2029 (USD MILLION)
TABLE 51 U.K. POWER GENERATORS IN MICROGRID MARKET, BY TYPE, 2020-2029 (USD MILLION)
TABLE 52 U.K. ENERGY STORAGE & DISTRIBUTORS MICROGRID MARKET, BY TYPE, 2020-2029 (USD MILLION)
TABLE 53 U.K. SERVICES IN MICROGRID MARKET, BY TYPE, 2020-2029 (USD MILLION)
TABLE 54 U.K. MICROGRID MARKET, BY PATTERN, 2020-2029 (USD MILLION)
TABLE 55 U.K. MICROGRID MARKET, BY SOURCE, 2020-2029 (USD MILLION)
TABLE 56 U.K. MICROGRID MARKET, BY STORAGE, 2020-2029 (USD MILLION)
TABLE 57 U.K. MICROGRID MARKET, BY GRID TYPE, 2020-2029 (USD MILLION)
TABLE 58 U.K. MICROGRID MARKET, BY CAPACITY, 2020-2029 (USD MILLION)
TABLE 59 U.K. MICROGRID MARKET, BY CONTROL, 2020-2029 (USD MILLION)
TABLE 60 U.K. SECONDARY IN MICROGRID MARKET, BY TYPE, 2020-2029 (USD MILLION)
TABLE 61 U.K. MICROGRID MARKET, BY APPLICATION, 2020-2029 (USD MILLION)
TABLE 62 U.K. REMOTE LOCATION IN MICROGRID MARKET, BY OFFERING, 2020-2029 (USD MILLION)
TABLE 63 U.K. UTILITY IN MICROGRID MARKET, BY OFFERING, 2020-2029 (USD MILLION)
TABLE 64 U.K. INDUSTRIAL IN MICROGRID MARKET, BY OFFERING, 2020-2029 (USD MILLION)
TABLE 65 U.K. CAMPUS IN MICROGRID MARKET, BY OFFERING, 2020-2029 (USD MILLION)
TABLE 66 U.K. MILITARY IN MICROGRID MARKET, BY OFFERING, 2020-2029 (USD MILLION)
TABLE 67 U.K. SMART CITY IN MICROGRID MARKET, BY OFFERING, 2020-2029 (USD MILLION)
TABLE 68 U.K. DATA CENTER IN MICROGRID MARKET, BY OFFERING, 2020-2029 (USD MILLION)
TABLE 69 U.K. HOSPITAL IN MICROGRID MARKET, BY OFFERING, 2020-2029 (USD MILLION)
TABLE 70 U.K. SCHOOL IN MICROGRID MARKET, BY OFFERING, 2020-2029 (USD MILLION)
TABLE 71 FRANCE MICROGRID MARKET, BY CONNECTIVITY, 2020-2029 (USD MILLION)
TABLE 72 FRANCE MICROGRID MARKET, BY OFFERING, 2020-2029 (USD MILLION)
TABLE 73 FRANCE HARDWARE IN MICROGRID MARKET, BY TYPE, 2020-2029 (USD MILLION)
TABLE 74 FRANCE POWER GENERATORS IN MICROGRID MARKET, BY TYPE, 2020-2029 (USD MILLION)
TABLE 75 FRANCE ENERGY STORAGE & DISTRIBUTORS MICROGRID MARKET, BY TYPE, 2020-2029 (USD MILLION)
TABLE 76 FRANCE SERVICES IN MICROGRID MARKET, BY TYPE, 2020-2029 (USD MILLION)
TABLE 77 FRANCE MICROGRID MARKET, BY PATTERN, 2020-2029 (USD MILLION)
TABLE 78 FRANCE MICROGRID MARKET, BY SOURCE, 2020-2029 (USD MILLION)
TABLE 79 FRANCE MICROGRID MARKET, BY STORAGE, 2020-2029 (USD MILLION)
TABLE 80 FRANCE MICROGRID MARKET, BY GRID TYPE, 2020-2029 (USD MILLION)
TABLE 81 FRANCE MICROGRID MARKET, BY CAPACITY, 2020-2029 (USD MILLION)
TABLE 82 FRANCE MICROGRID MARKET, BY CONTROL, 2020-2029 (USD MILLION)
TABLE 83 FRANCE SECONDARY IN MICROGRID MARKET, BY TYPE, 2020-2029 (USD MILLION)
TABLE 84 FRANCE MICROGRID MARKET, BY APPLICATION, 2020-2029 (USD MILLION)
TABLE 85 FRANCE REMOTE LOCATION IN MICROGRID MARKET, BY OFFERING, 2020-2029 (USD MILLION)
TABLE 86 FRANCE UTILITY IN MICROGRID MARKET, BY OFFERING, 2020-2029 (USD MILLION)
TABLE 87 FRANCE INDUSTRIAL IN MICROGRID MARKET, BY OFFERING, 2020-2029 (USD MILLION)
TABLE 88 FRANCE CAMPUS IN MICROGRID MARKET, BY OFFERING, 2020-2029 (USD MILLION)
TABLE 89 FRANCE MILITARY IN MICROGRID MARKET, BY OFFERING, 2020-2029 (USD MILLION)
TABLE 90 FRANCE SMART CITY IN MICROGRID MARKET, BY OFFERING, 2020-2029 (USD MILLION)
TABLE 91 FRANCE DATA CENTER IN MICROGRID MARKET, BY OFFERING, 2020-2029 (USD MILLION)
TABLE 92 FRANCE HOSPITAL IN MICROGRID MARKET, BY OFFERING, 2020-2029 (USD MILLION)
TABLE 93 FRANCE SCHOOL IN MICROGRID MARKET, BY OFFERING, 2020-2029 (USD MILLION)
TABLE 94 SPAIN MICROGRID MARKET, BY CONNECTIVITY, 2020-2029 (USD MILLION)
TABLE 95 SPAIN MICROGRID MARKET, BY OFFERING, 2020-2029 (USD MILLION)
TABLE 96 SPAIN HARDWARE IN MICROGRID MARKET, BY TYPE, 2020-2029 (USD MILLION)
TABLE 97 SPAIN POWER GENERATORS IN MICROGRID MARKET, BY TYPE, 2020-2029 (USD MILLION)
TABLE 98 SPAIN ENERGY STORAGE & DISTRIBUTORS MICROGRID MARKET, BY TYPE, 2020-2029 (USD MILLION)
TABLE 99 SPAIN SERVICES IN MICROGRID MARKET, BY TYPE, 2020-2029 (USD MILLION)
TABLE 100 SPAIN MICROGRID MARKET, BY PATTERN, 2020-2029 (USD MILLION)
TABLE 101 SPAIN MICROGRID MARKET, BY SOURCE, 2020-2029 (USD MILLION)
TABLE 102 SPAIN MICROGRID MARKET, BY STORAGE, 2020-2029 (USD MILLION)
TABLE 103 SPAIN MICROGRID MARKET, BY GRID TYPE, 2020-2029 (USD MILLION)
TABLE 104 SPAIN MICROGRID MARKET, BY CAPACITY, 2020-2029 (USD MILLION)
TABLE 105 SPAIN MICROGRID MARKET, BY CONTROL, 2020-2029 (USD MILLION)
TABLE 106 SPAIN SECONDARY IN MICROGRID MARKET, BY TYPE, 2020-2029 (USD MILLION)
TABLE 107 SPAIN MICROGRID MARKET, BY APPLICATION, 2020-2029 (USD MILLION)
TABLE 108 SPAIN REMOTE LOCATION IN MICROGRID MARKET, BY OFFERING, 2020-2029 (USD MILLION)
TABLE 109 SPAIN UTILITY IN MICROGRID MARKET, BY OFFERING, 2020-2029 (USD MILLION)
TABLE 110 SPAIN INDUSTRIAL IN MICROGRID MARKET, BY OFFERING, 2020-2029 (USD MILLION)
TABLE 111 SPAIN CAMPUS IN MICROGRID MARKET, BY OFFERING, 2020-2029 (USD MILLION)
TABLE 112 SPAIN MILITARY IN MICROGRID MARKET, BY OFFERING, 2020-2029 (USD MILLION)
TABLE 113 SPAIN SMART CITY IN MICROGRID MARKET, BY OFFERING, 2020-2029 (USD MILLION)
TABLE 114 SPAIN DATA CENTER IN MICROGRID MARKET, BY OFFERING, 2020-2029 (USD MILLION)
TABLE 115 SPAIN HOSPITAL IN MICROGRID MARKET, BY OFFERING, 2020-2029 (USD MILLION)
TABLE 116 SPAIN SCHOOL IN MICROGRID MARKET, BY OFFERING, 2020-2029 (USD MILLION)
TABLE 117 ITALY MICROGRID MARKET, BY CONNECTIVITY, 2020-2029 (USD MILLION)
TABLE 118 ITALY MICROGRID MARKET, BY OFFERING, 2020-2029 (USD MILLION)
TABLE 119 ITALY HARDWARE IN MICROGRID MARKET, BY TYPE, 2020-2029 (USD MILLION)
TABLE 120 ITALY POWER GENERATORS IN MICROGRID MARKET, BY TYPE, 2020-2029 (USD MILLION)
TABLE 121 ITALY ENERGY STORAGE & DISTRIBUTORS MICROGRID MARKET, BY TYPE, 2020-2029 (USD MILLION)
TABLE 122 ITALY SERVICES IN MICROGRID MARKET, BY TYPE, 2020-2029 (USD MILLION)
TABLE 123 ITALY MICROGRID MARKET, BY PATTERN, 2020-2029 (USD MILLION)
TABLE 124 ITALY MICROGRID MARKET, BY SOURCE, 2020-2029 (USD MILLION)
TABLE 125 ITALY MICROGRID MARKET, BY STORAGE, 2020-2029 (USD MILLION)
TABLE 126 ITALY MICROGRID MARKET, BY GRID TYPE, 2020-2029 (USD MILLION)
TABLE 127 ITALY MICROGRID MARKET, BY CAPACITY, 2020-2029 (USD MILLION)
TABLE 128 ITALY MICROGRID MARKET, BY CONTROL, 2020-2029 (USD MILLION)
TABLE 129 ITALY SECONDARY IN MICROGRID MARKET, BY TYPE, 2020-2029 (USD MILLION)
TABLE 130 ITALY MICROGRID MARKET, BY APPLICATION, 2020-2029 (USD MILLION)
TABLE 131 ITALY REMOTE LOCATION IN MICROGRID MARKET, BY OFFERING, 2020-2029 (USD MILLION)
TABLE 132 ITALY UTILITY IN MICROGRID MARKET, BY OFFERING, 2020-2029 (USD MILLION)
TABLE 133 ITALY INDUSTRIAL IN MICROGRID MARKET, BY OFFERING, 2020-2029 (USD MILLION)
TABLE 134 ITALY CAMPUS IN MICROGRID MARKET, BY OFFERING, 2020-2029 (USD MILLION)
TABLE 135 ITALY MILITARY IN MICROGRID MARKET, BY OFFERING, 2020-2029 (USD MILLION)
TABLE 136 ITALY SMART CITY IN MICROGRID MARKET, BY OFFERING, 2020-2029 (USD MILLION)
TABLE 137 ITALY DATA CENTER IN MICROGRID MARKET, BY OFFERING, 2020-2029 (USD MILLION)
TABLE 138 ITALY HOSPITAL IN MICROGRID MARKET, BY OFFERING, 2020-2029 (USD MILLION)
TABLE 139 ITALY SCHOOL IN MICROGRID MARKET, BY OFFERING, 2020-2029 (USD MILLION)
TABLE 140 RUSSIA MICROGRID MARKET, BY CONNECTIVITY, 2020-2029 (USD MILLION)
TABLE 141 RUSSIA MICROGRID MARKET, BY OFFERING, 2020-2029 (USD MILLION)
TABLE 142 RUSSIA HARDWARE IN MICROGRID MARKET, BY TYPE, 2020-2029 (USD MILLION)
TABLE 143 RUSSIA POWER GENERATORS IN MICROGRID MARKET, BY TYPE, 2020-2029 (USD MILLION)
TABLE 144 RUSSIA ENERGY STORAGE & DISTRIBUTORS MICROGRID MARKET, BY TYPE, 2020-2029 (USD MILLION)
TABLE 145 RUSSIA SERVICES IN MICROGRID MARKET, BY TYPE, 2020-2029 (USD MILLION)
TABLE 146 RUSSIA MICROGRID MARKET, BY PATTERN, 2020-2029 (USD MILLION)
TABLE 147 RUSSIA MICROGRID MARKET, BY SOURCE, 2020-2029 (USD MILLION)
TABLE 148 RUSSIA MICROGRID MARKET, BY STORAGE, 2020-2029 (USD MILLION)
TABLE 149 RUSSIA MICROGRID MARKET, BY GRID TYPE, 2020-2029 (USD MILLION)
TABLE 150 RUSSIA MICROGRID MARKET, BY CAPACITY, 2020-2029 (USD MILLION)
TABLE 151 RUSSIA MICROGRID MARKET, BY CONTROL, 2020-2029 (USD MILLION)
TABLE 152 RUSSIA SECONDARY IN MICROGRID MARKET, BY TYPE, 2020-2029 (USD MILLION)
TABLE 153 RUSSIA MICROGRID MARKET, BY APPLICATION, 2020-2029 (USD MILLION)
TABLE 154 RUSSIA REMOTE LOCATION IN MICROGRID MARKET, BY OFFERING, 2020-2029 (USD MILLION)
TABLE 155 RUSSIA UTILITY IN MICROGRID MARKET, BY OFFERING, 2020-2029 (USD MILLION)
TABLE 156 RUSSIA INDUSTRIAL IN MICROGRID MARKET, BY OFFERING, 2020-2029 (USD MILLION)
TABLE 157 RUSSIA CAMPUS IN MICROGRID MARKET, BY OFFERING, 2020-2029 (USD MILLION)
TABLE 158 RUSSIA MILITARY IN MICROGRID MARKET, BY OFFERING, 2020-2029 (USD MILLION)
TABLE 159 RUSSIA SMART CITY IN MICROGRID MARKET, BY OFFERING, 2020-2029 (USD MILLION)
TABLE 160 RUSSIA DATA CENTER IN MICROGRID MARKET, BY OFFERING, 2020-2029 (USD MILLION)
TABLE 161 RUSSIA HOSPITAL IN MICROGRID MARKET, BY OFFERING, 2020-2029 (USD MILLION)
TABLE 162 RUSSIA SCHOOL IN MICROGRID MARKET, BY OFFERING, 2020-2029 (USD MILLION)
TABLE 163 NETHERLANDS MICROGRID MARKET, BY CONNECTIVITY, 2020-2029 (USD MILLION)
TABLE 164 NETHERLANDS MICROGRID MARKET, BY OFFERING, 2020-2029 (USD MILLION)
TABLE 165 NETHERLANDS HARDWARE IN MICROGRID MARKET, BY TYPE, 2020-2029 (USD MILLION)
TABLE 166 NETHERLANDS POWER GENERATORS IN MICROGRID MARKET, BY TYPE, 2020-2029 (USD MILLION)
TABLE 167 NETHERLANDS ENERGY STORAGE & DISTRIBUTORS MICROGRID MARKET, BY TYPE, 2020-2029 (USD MILLION)
TABLE 168 NETHERLANDS SERVICES IN MICROGRID MARKET, BY TYPE, 2020-2029 (USD MILLION)
TABLE 169 NETHERLANDS MICROGRID MARKET, BY PATTERN, 2020-2029 (USD MILLION)
TABLE 170 NETHERLANDS MICROGRID MARKET, BY SOURCE, 2020-2029 (USD MILLION)
TABLE 171 NETHERLANDS MICROGRID MARKET, BY STORAGE, 2020-2029 (USD MILLION)
TABLE 172 NETHERLANDS MICROGRID MARKET, BY GRID TYPE, 2020-2029 (USD MILLION)
TABLE 173 NETHERLANDS MICROGRID MARKET, BY CAPACITY, 2020-2029 (USD MILLION)
TABLE 174 NETHERLANDS MICROGRID MARKET, BY CONTROL, 2020-2029 (USD MILLION)
TABLE 175 NETHERLANDS SECONDARY IN MICROGRID MARKET, BY TYPE, 2020-2029 (USD MILLION)
TABLE 176 NETHERLANDS MICROGRID MARKET, BY APPLICATION, 2020-2029 (USD MILLION)
TABLE 177 NETHERLANDS REMOTE LOCATION IN MICROGRID MARKET, BY OFFERING, 2020-2029 (USD MILLION)
TABLE 178 NETHERLANDS UTILITY IN MICROGRID MARKET, BY OFFERING, 2020-2029 (USD MILLION)
TABLE 179 NETHERLANDS INDUSTRIAL IN MICROGRID MARKET, BY OFFERING, 2020-2029 (USD MILLION)
TABLE 180 NETHERLANDS CAMPUS IN MICROGRID MARKET, BY OFFERING, 2020-2029 (USD MILLION)
TABLE 181 NETHERLANDS MILITARY IN MICROGRID MARKET, BY OFFERING, 2020-2029 (USD MILLION)
TABLE 182 NETHERLANDS SMART CITY IN MICROGRID MARKET, BY OFFERING, 2020-2029 (USD MILLION)
TABLE 183 NETHERLANDS DATA CENTER IN MICROGRID MARKET, BY OFFERING, 2020-2029 (USD MILLION)
TABLE 184 NETHERLANDS HOSPITAL IN MICROGRID MARKET, BY OFFERING, 2020-2029 (USD MILLION)
TABLE 185 NETHERLANDS SCHOOL IN MICROGRID MARKET, BY OFFERING, 2020-2029 (USD MILLION)
TABLE 186 SWITZERLAND MICROGRID MARKET, BY CONNECTIVITY, 2020-2029 (USD MILLION)
TABLE 187 SWITZERLAND MICROGRID MARKET, BY OFFERING, 2020-2029 (USD MILLION)
TABLE 188 SWITZERLAND HARDWARE IN MICROGRID MARKET, BY TYPE, 2020-2029 (USD MILLION)
TABLE 189 SWITZERLAND POWER GENERATORS IN MICROGRID MARKET, BY TYPE, 2020-2029 (USD MILLION)
TABLE 190 SWITZERLAND ENERGY STORAGE & DISTRIBUTORS MICROGRID MARKET, BY TYPE, 2020-2029 (USD MILLION)
TABLE 191 SWITZERLAND SERVICES IN MICROGRID MARKET, BY TYPE, 2020-2029 (USD MILLION)
TABLE 192 SWITZERLAND MICROGRID MARKET, BY PATTERN, 2020-2029 (USD MILLION)
TABLE 193 SWITZERLAND MICROGRID MARKET, BY SOURCE, 2020-2029 (USD MILLION)
TABLE 194 SWITZERLAND MICROGRID MARKET, BY STORAGE, 2020-2029 (USD MILLION)
TABLE 195 SWITZERLAND MICROGRID MARKET, BY GRID TYPE, 2020-2029 (USD MILLION)
TABLE 196 SWITZERLAND MICROGRID MARKET, BY CAPACITY, 2020-2029 (USD MILLION)
TABLE 197 SWITZERLAND MICROGRID MARKET, BY CONTROL, 2020-2029 (USD MILLION)
TABLE 198 SWITZERLAND SECONDARY IN MICROGRID MARKET, BY TYPE, 2020-2029 (USD MILLION)
TABLE 199 SWITZERLAND MICROGRID MARKET, BY APPLICATION, 2020-2029 (USD MILLION)
TABLE 200 SWITZERLAND REMOTE LOCATION IN MICROGRID MARKET, BY OFFERING, 2020-2029 (USD MILLION)
TABLE 201 SWITZERLAND UTILITY IN MICROGRID MARKET, BY OFFERING, 2020-2029 (USD MILLION)
TABLE 202 SWITZERLAND INDUSTRIAL IN MICROGRID MARKET, BY OFFERING, 2020-2029 (USD MILLION)
TABLE 203 SWITZERLAND CAMPUS IN MICROGRID MARKET, BY OFFERING, 2020-2029 (USD MILLION)
TABLE 204 SWITZERLAND MILITARY IN MICROGRID MARKET, BY OFFERING, 2020-2029 (USD MILLION)
TABLE 205 SWITZERLAND SMART CITY IN MICROGRID MARKET, BY OFFERING, 2020-2029 (USD MILLION)
TABLE 206 SWITZERLAND DATA CENTER IN MICROGRID MARKET, BY OFFERING, 2020-2029 (USD MILLION)
TABLE 207 SWITZERLAND HOSPITAL IN MICROGRID MARKET, BY OFFERING, 2020-2029 (USD MILLION)
TABLE 208 SWITZERLAND SCHOOL IN MICROGRID MARKET, BY OFFERING, 2020-2029 (USD MILLION)
TABLE 209 BELGIUM MICROGRID MARKET, BY CONNECTIVITY, 2020-2029 (USD MILLION)
TABLE 210 BELGIUM MICROGRID MARKET, BY OFFERING, 2020-2029 (USD MILLION)
TABLE 211 BELGIUM HARDWARE IN MICROGRID MARKET, BY TYPE, 2020-2029 (USD MILLION)
TABLE 212 BELGIUM POWER GENERATORS IN MICROGRID MARKET, BY TYPE, 2020-2029 (USD MILLION)
TABLE 213 BELGIUM ENERGY STORAGE & DISTRIBUTORS MICROGRID MARKET, BY TYPE, 2020-2029 (USD MILLION)
TABLE 214 BELGIUM SERVICES IN MICROGRID MARKET, BY TYPE, 2020-2029 (USD MILLION)
TABLE 215 BELGIUM MICROGRID MARKET, BY PATTERN, 2020-2029 (USD MILLION)
TABLE 216 BELGIUM MICROGRID MARKET, BY SOURCE, 2020-2029 (USD MILLION)
TABLE 217 BELGIUM MICROGRID MARKET, BY STORAGE, 2020-2029 (USD MILLION)
TABLE 218 BELGIUM MICROGRID MARKET, BY GRID TYPE, 2020-2029 (USD MILLION)
TABLE 219 BELGIUM MICROGRID MARKET, BY CAPACITY, 2020-2029 (USD MILLION)
TABLE 220 BELGIUM MICROGRID MARKET, BY CONTROL, 2020-2029 (USD MILLION)
TABLE 221 BELGIUM SECONDARY IN MICROGRID MARKET, BY TYPE, 2020-2029 (USD MILLION)
TABLE 222 BELGIUM MICROGRID MARKET, BY APPLICATION, 2020-2029 (USD MILLION)
TABLE 223 BELGIUM REMOTE LOCATION IN MICROGRID MARKET, BY OFFERING, 2020-2029 (USD MILLION)
TABLE 224 BELGIUM UTILITY IN MICROGRID MARKET, BY OFFERING, 2020-2029 (USD MILLION)
TABLE 225 BELGIUM INDUSTRIAL IN MICROGRID MARKET, BY OFFERING, 2020-2029 (USD MILLION)
TABLE 226 BELGIUM CAMPUS IN MICROGRID MARKET, BY OFFERING, 2020-2029 (USD MILLION)
TABLE 227 BELGIUM MILITARY IN MICROGRID MARKET, BY OFFERING, 2020-2029 (USD MILLION)
TABLE 228 BELGIUM SMART CITY IN MICROGRID MARKET, BY OFFERING, 2020-2029 (USD MILLION)
TABLE 229 BELGIUM DATA CENTER IN MICROGRID MARKET, BY OFFERING, 2020-2029 (USD MILLION)
TABLE 230 BELGIUM HOSPITAL IN MICROGRID MARKET, BY OFFERING, 2020-2029 (USD MILLION)
TABLE 231 BELGIUM SCHOOL IN MICROGRID MARKET, BY OFFERING, 2020-2029 (USD MILLION)
TABLE 232 TURKEY MICROGRID MARKET, BY CONNECTIVITY, 2020-2029 (USD MILLION)
TABLE 233 TURKEY MICROGRID MARKET, BY OFFERING, 2020-2029 (USD MILLION)
TABLE 234 TURKEY HARDWARE IN MICROGRID MARKET, BY TYPE, 2020-2029 (USD MILLION)
TABLE 235 TURKEY POWER GENERATORS IN MICROGRID MARKET, BY TYPE, 2020-2029 (USD MILLION)
TABLE 236 TURKEY ENERGY STORAGE & DISTRIBUTORS MICROGRID MARKET, BY TYPE, 2020-2029 (USD MILLION)
TABLE 237 TURKEY SERVICES IN MICROGRID MARKET, BY TYPE, 2020-2029 (USD MILLION)
TABLE 238 TURKEY MICROGRID MARKET, BY PATTERN, 2020-2029 (USD MILLION)
TABLE 239 TURKEY MICROGRID MARKET, BY SOURCE, 2020-2029 (USD MILLION)
TABLE 240 TURKEY MICROGRID MARKET, BY STORAGE, 2020-2029 (USD MILLION)
TABLE 241 TURKEY MICROGRID MARKET, BY GRID TYPE, 2020-2029 (USD MILLION)
TABLE 242 TURKEY MICROGRID MARKET, BY CAPACITY, 2020-2029 (USD MILLION)
TABLE 243 TURKEY MICROGRID MARKET, BY CONTROL, 2020-2029 (USD MILLION)
TABLE 244 TURKEY SECONDARY IN MICROGRID MARKET, BY TYPE, 2020-2029 (USD MILLION)
TABLE 245 TURKEY MICROGRID MARKET, BY APPLICATION, 2020-2029 (USD MILLION)
TABLE 246 TURKEY REMOTE LOCATION IN MICROGRID MARKET, BY OFFERING, 2020-2029 (USD MILLION)
TABLE 247 TURKEY UTILITY IN MICROGRID MARKET, BY OFFERING, 2020-2029 (USD MILLION)
TABLE 248 TURKEY INDUSTRIAL IN MICROGRID MARKET, BY OFFERING, 2020-2029 (USD MILLION)
TABLE 249 TURKEY CAMPUS IN MICROGRID MARKET, BY OFFERING, 2020-2029 (USD MILLION)
TABLE 250 TURKEY MILITARY IN MICROGRID MARKET, BY OFFERING, 2020-2029 (USD MILLION)
TABLE 251 TURKEY SMART CITY IN MICROGRID MARKET, BY OFFERING, 2020-2029 (USD MILLION)
TABLE 252 TURKEY DATA CENTER IN MICROGRID MARKET, BY OFFERING, 2020-2029 (USD MILLION)
TABLE 253 TURKEY HOSPITAL IN MICROGRID MARKET, BY OFFERING, 2020-2029 (USD MILLION)
TABLE 254 TURKEY SCHOOL IN MICROGRID MARKET, BY OFFERING, 2020-2029 (USD MILLION)
TABLE 255 REST OF EUROPE MICROGRID MARKET, BY CONNECTIVITY, 2020-2029 (USD MILLION)
Lista de figuras
FIGURE 1 EUROPE MICROGRID MARKET: SEGMENTATION
FIGURE 2 EUROPE MICROGRID MARKET: DATA TRIANGULATION
FIGURE 3 EUROPE MICROGRID MARKET: DROC ANALYSIS
FIGURE 4 EUROPE MICROGRID MARKET: COUNTRY VS REGIONAL MARKET ANALYSIS
FIGURE 5 EUROPE MICROGRID MARKET: COMPANY RESEARCH ANALYSIS
FIGURE 6 EUROPE MICROGRID MARKET: INTERVIEW DEMOGRAPHICS
FIGURE 7 EUROPE MICROGRID MARKET: DBMR MARKET POSITION GRID
FIGURE 8 EUROPE MICROGRID MARKET: SEGMENTATION
FIGURE 9 SHIFTING TRENDS TOWARDS GAS BASED POWER GENERATION IS EXPECTED TO DRIVE THE EUROPE MICROGRID MARKET IN THE FORECAST PERIOD OF 2022 TO 2029
FIGURE 10 GRID CONNECTED SEGMENT IS EXPECTED TO ACCOUNT FOR THE LARGEST SHARE OF EUROPE MICROGRID MARKET IN 2022 & 2029
FIGURE 11 DRIVERS, RESTRAINTS, OPPORTUNITIES, AND CHALLENGES OF THE EUROPE MICROGRID MARKET
FIGURE 12 NON-HOUSEHOLD ENERGY PRICES IN EUROPEAN UNION
FIGURE 13 EUROPE MICROGRID MARKET: BY CONNECTIVITY, 2021
FIGURE 14 EUROPE MICROGRID MARKET: BY OFFERING, 2021
FIGURE 15 EUROPE MICROGRID MARKET: BY PATTERN, 2021
FIGURE 16 EUROPE MICROGRID MARKET: BY SOURCE, 2021
FIGURE 17 EUROPE MICROGRID MARKET: BY STORAGE, 2021
FIGURE 18 EUROPE MICROGRID MARKET: BY GRID TYPE, 2021
FIGURE 19 EUROPE MICROGRID MARKET: BY CAPACITY, 2021
FIGURE 20 EUROPE MICROGRID MARKET: BY CONTROL, 2021
FIGURE 21 EUROPE MICROGRID MARKET: BY APPLICATION, 2021
FIGURE 22 EUROPE MICROGRID MARKET: SNAPSHOT (2021)
FIGURE 23 EUROPE MICROGRID MARKET: BY COUNTRY (2021)
FIGURE 24 EUROPE MICROGRID MARKET: BY COUNTRY (2022 & 2029)
FIGURE 25 EUROPE MICROGRID MARKET: BY COUNTRY (2021 & 2029)
FIGURE 26 EUROPE MICROGRID MARKET: BY CONNECTIVITY (2022-2029)
FIGURE 27 EUROPE MICROGRID MARKET: COMPANY SHARE 2021 (%)
Metodología de investigación
La recopilación de datos y el análisis del año base se realizan utilizando módulos de recopilación de datos con muestras de gran tamaño. La etapa incluye la obtención de información de mercado o datos relacionados a través de varias fuentes y estrategias. Incluye el examen y la planificación de todos los datos adquiridos del pasado con antelación. Asimismo, abarca el examen de las inconsistencias de información observadas en diferentes fuentes de información. Los datos de mercado se analizan y estiman utilizando modelos estadísticos y coherentes de mercado. Además, el análisis de la participación de mercado y el análisis de tendencias clave son los principales factores de éxito en el informe de mercado. Para obtener más información, solicite una llamada de un analista o envíe su consulta.
La metodología de investigación clave utilizada por el equipo de investigación de DBMR es la triangulación de datos, que implica la extracción de datos, el análisis del impacto de las variables de datos en el mercado y la validación primaria (experto en la industria). Los modelos de datos incluyen cuadrícula de posicionamiento de proveedores, análisis de línea de tiempo de mercado, descripción general y guía del mercado, cuadrícula de posicionamiento de la empresa, análisis de patentes, análisis de precios, análisis de participación de mercado de la empresa, estándares de medición, análisis global versus regional y de participación de proveedores. Para obtener más información sobre la metodología de investigación, envíe una consulta para hablar con nuestros expertos de la industria.
Personalización disponible
Data Bridge Market Research es líder en investigación formativa avanzada. Nos enorgullecemos de brindar servicios a nuestros clientes existentes y nuevos con datos y análisis que coinciden y se adaptan a sus objetivos. El informe se puede personalizar para incluir análisis de tendencias de precios de marcas objetivo, comprensión del mercado de países adicionales (solicite la lista de países), datos de resultados de ensayos clínicos, revisión de literatura, análisis de mercado renovado y base de productos. El análisis de mercado de competidores objetivo se puede analizar desde análisis basados en tecnología hasta estrategias de cartera de mercado. Podemos agregar tantos competidores sobre los que necesite datos en el formato y estilo de datos que esté buscando. Nuestro equipo de analistas también puede proporcionarle datos en archivos de Excel sin procesar, tablas dinámicas (libro de datos) o puede ayudarlo a crear presentaciones a partir de los conjuntos de datos disponibles en el informe.

