

Europe Lymphedema Treatment Market
Tamaño del mercado en miles de millones de dólares
Tasa de crecimiento anual compuesta (CAGR) :
% 
 USD
307.74 Million
USD
608.27 Million
2024
2032
USD
307.74 Million
USD
608.27 Million
2024
2032
| 2025 –2032 | |
| USD 307.74 Million | |
| USD 608.27 Million | |
| % | |
|
Segmentación del mercado europeo de tratamiento del linfedema, por tipo de tratamiento (terapia de compresión, cirugía, farmacoterapia, terapia con láser y otros), tipo (linfedema secundario y linfedema primario), área afectada (extremidad inferior, extremidad superior y genitales), grupo de edad (adulto, geriátrico y pediátrico), vía de administración (oral, inyectable y tópica), usuario final (hospital, clínicas especializadas, centros quirúrgicos ambulatorios y otros), canal de distribución (farmacia, tiendas, licitación directa y otros), tendencias de la industria y pronóstico hasta 2032
Tamaño del mercado europeo de tratamiento del linfedema
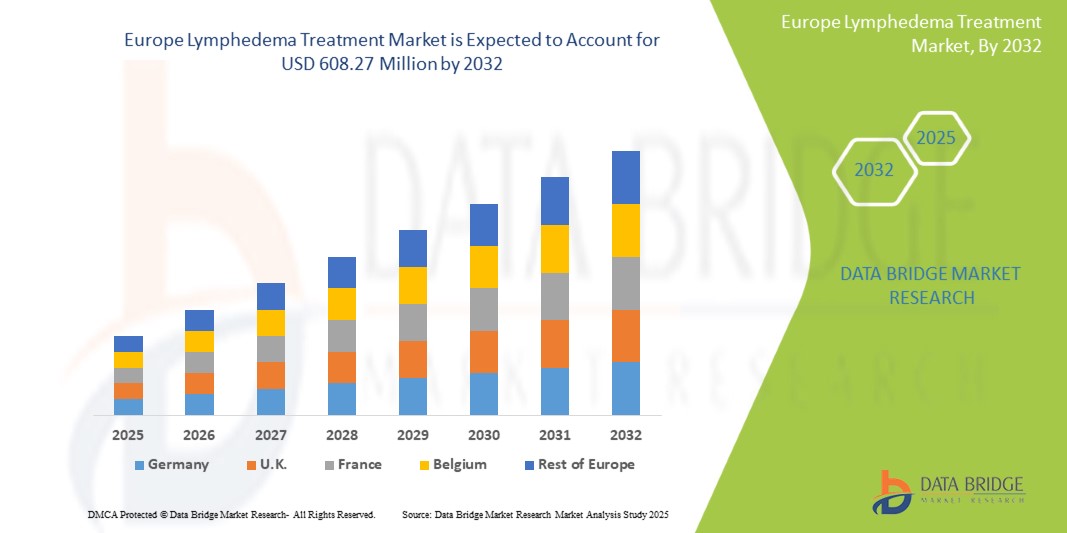
- El tamaño del mercado de tratamiento del linfedema en Europa se valoró en USD 307,74 millones en 2024 y se espera que alcance los USD 608,27 millones para 2032 , con una CAGR del 9,1% durante el período de pronóstico.
- El crecimiento del mercado en Europa está impulsado en gran medida por la creciente prevalencia regional del linfedema y el linfedema relacionado con el cáncer, junto con importantes avances tecnológicos en las modalidades de diagnóstico por imágenes y enfoques de tratamiento innovadores, lo que conduce a una mejor identificación y gestión de la afección.
- Además, la creciente demanda de pacientes y profesionales clínicos en toda la región de soluciones más efectivas, accesibles e integradas para el manejo de la inflamación crónica y la mejora de la calidad de vida está consolidando las terapias compresivas avanzadas, las técnicas de drenaje linfático y las intervenciones microquirúrgicas como el estándar moderno para el tratamiento del linfedema. Estos factores convergentes están acelerando la adopción de soluciones para el manejo del linfedema en Europa, impulsando así significativamente el crecimiento regional de la industria.
Análisis del mercado europeo de tratamiento del linfedema
- El linfedema, caracterizado por una hinchazón crónica causada por un deterioro de la función del sistema linfático, es un área de enfoque cada vez más vital en la atención médica moderna debido a su impacto significativo en la calidad de vida del paciente, y a menudo surge como una complicación del tratamiento del cáncer o predisposiciones genéticas.
- La creciente demanda de tratamientos para el linfedema se ve impulsada principalmente por la creciente prevalencia mundial del linfedema y el linfedema relacionado con el cáncer, la creciente conciencia entre los profesionales de la salud y los pacientes, y los continuos avances tecnológicos en las modalidades de diagnóstico y terapéuticas.
- Alemania dominó el mercado del linfedema en 2024, impulsada por una alta prevalencia de casos de linfedema (en particular, linfedema relacionado con el cáncer), una infraestructura de atención médica avanzada, una fuerte conciencia del consumidor y la adopción temprana de terapias innovadoras.
- El segmento de terapia de compresión dominó el mercado de tratamiento del linfedema en 2024, impulsado por su reputación establecida como el tratamiento de primera línea y más común para controlar la hinchazón, su naturaleza no invasiva y las innovaciones continuas en prendas y dispositivos de compresión que ofrecen mayor comodidad y eficacia.
Alcance del informe y segmentación del mercado europeo de tratamiento del linfedema
|
Atributos |
Perspectivas clave del mercado europeo de tratamiento del linfedema |
|
Segmentos cubiertos |
|
|
Países cubiertos |
Europa
|
|
Actores clave del mercado |
|
|
Oportunidades de mercado |
|
|
Conjuntos de información de datos de valor añadido |
Además de los conocimientos sobre escenarios de mercado, como valor de mercado, tasa de crecimiento, segmentación, cobertura geográfica y actores principales, los informes de mercado seleccionados por Data Bridge Market Research también incluyen análisis en profundidad de expertos, análisis de precios, análisis de participación de marca, encuesta de consumidores, análisis demográfico, análisis de la cadena de suministro, análisis de la cadena de valor, descripción general de materias primas/consumibles, criterios de selección de proveedores, análisis PESTLE, análisis de Porter y marco regulatorio. |
Tendencias del mercado europeo del tratamiento del linfedema
Atención al paciente mejorada mediante IA e integración digital
- Una tendencia significativa y en auge en el mercado del linfedema es la creciente integración con la inteligencia artificial (IA) y las plataformas de salud digital, que abarcan la monitorización remota, algoritmos de tratamiento personalizados y soluciones de telesalud. Esta fusión de tecnologías está mejorando significativamente la comodidad del paciente, la adherencia al tratamiento y el manejo integral de su enfermedad crónica. Por ejemplo, la creciente incidencia de cáncer y otras enfermedades crónicas que contribuyen al linfedema en la región pone de manifiesto un segmento crítico de pacientes que impulsa la demanda de soluciones para el manejo del linfedema a largo plazo.
- La integración de la IA en la atención del linfedema permite funciones como el análisis de amplios datos de pacientes para predecir posibles brotes, optimizar la presión de las prendas de compresión según las respuestas individuales y proporcionar alertas más inteligentes para una intervención temprana. Por ejemplo, se están explorando soluciones emergentes basadas en IA para mejorar la precisión de la detección temprana del linfedema mediante el análisis de datos de imágenes y para guiar a los pacientes mediante ejercicios de rehabilitación personalizados. Además, las plataformas digitales con capacidades de comunicación integradas ofrecen a los pacientes la facilidad de las consultas virtuales, permitiéndoles hablar sobre los síntomas y recibir orientación a distancia.
- La integración fluida de los dispositivos de monitorización del linfedema y las herramientas de autogestión con ecosistemas de salud digital más amplios facilita el control centralizado de diversos aspectos de la atención del paciente. A través de una única interfaz, los usuarios pueden gestionar las medidas de sus extremidades, la adherencia al tratamiento y comunicarse con su equipo de atención, creando una experiencia de gestión de la salud unificada y más proactiva.
- Esta tendencia hacia sistemas de gestión del linfedema más inteligentes, intuitivos e interconectados está transformando radicalmente las expectativas de los pacientes respecto al cuidado de las enfermedades crónicas. En consecuencia, las empresas están desarrollando herramientas de diagnóstico basadas en IA y plataformas digitales con funciones como análisis automatizado de datos, alertas personalizadas y ajustes remotos de la terapia.
- La demanda de soluciones para el linfedema que ofrezcan una integración digital e IA perfecta está creciendo rápidamente en los entornos de atención médica y los grupos demográficos de los pacientes, ya que tanto los médicos como los pacientes priorizan cada vez más el manejo eficaz, conveniente e integral de esta afección de por vida.
Dinámica del mercado europeo del tratamiento del linfedema
Conductor
Necesidad creciente debido a la creciente prevalencia de enfermedades y las capacidades de diagnóstico mejoradas
- La creciente prevalencia del linfedema, en particular el linfedema secundario resultante de los tratamientos contra el cáncer, junto con los avances acelerados en las tecnologías de diagnóstico y la creciente conciencia, es un factor importante para la mayor demanda de soluciones para el tratamiento del linfedema.
- Por ejemplo, la gran y envejecida población de pacientes en toda Europa, combinada con una creciente incidencia de enfermedades crónicas y una mejora en el acceso a la atención médica, contribuye significativamente a la creciente necesidad de un tratamiento eficaz del linfedema.
- A medida que los profesionales de la salud y los pacientes se vuelven más conscientes de las implicaciones a largo plazo del linfedema no tratado y buscan una intervención más temprana, las herramientas de diagnóstico avanzadas como la espectroscopia de bioimpedancia (BIS) y las imágenes sofisticadas (por ejemplo, la linfografía ICG) ofrecen una medición precisa y una detección temprana, lo que proporciona una ventaja convincente sobre las mediciones con cinta tradicionales.
- Además, el enfoque creciente en la atención centrada en el paciente y el deseo de una mejor calidad de vida para quienes viven con enfermedades crónicas están haciendo que el manejo integral del linfedema sea un componente integral de la atención poscáncer y el manejo de enfermedades crónicas, ofreciendo una integración perfecta con programas de rehabilitación y terapias de apoyo.
- La comodidad del diagnóstico temprano, los planes de tratamiento personalizados facilitados por herramientas de salud digital y la capacidad de autocontrolar los síntomas mediante regímenes avanzados de compresión y ejercicio son factores clave que impulsan la adopción de soluciones para el linfedema tanto en entornos clínicos como domiciliarios. La tendencia hacia el cribado proactivo y la creciente disponibilidad de productos de autocontrol fáciles de usar contribuyen aún más al crecimiento del mercado.
Restricción/Desafío
Preocupaciones sobre el infradiagnóstico y los altos costos del tratamiento
- La preocupación por el infradiagnóstico generalizado y el diagnóstico erróneo del linfedema, sumada a la considerable carga financiera que supone el tratamiento continuo, supone un reto considerable para una mayor penetración en el mercado y una atención eficaz al paciente. Dado que el linfedema suele presentarse de forma sutil en las primeras etapas y a menudo es pasado por alto por los profesionales sanitarios, conlleva un retraso en la intervención y la progresión de la enfermedad, lo que genera ansiedad entre los pacientes sobre sus resultados de salud a largo plazo.
- Por ejemplo, en muchas partes de Europa, los importantes gastos de bolsillo para el cuidado continuo del linfedema, incluidas las prendas y terapias especializadas, pueden crear una carga financiera significativa para los pacientes, en particular donde la cobertura de salud pública o los planes de seguro son limitados.
- Abordar estos problemas de infradiagnóstico mediante una mejor educación médica, protocolos de cribado estandarizados y campañas de concienciación pública es crucial para mejorar los resultados de los pacientes. Las organizaciones sanitarias regionales y locales suelen priorizar las iniciativas de promoción y educación para mejorar la detección temprana y la atención. Además, el coste relativamente alto y continuo de las prendas de compresión especializadas, las bombas neumáticas y la terapia de drenaje linfático manual puede ser un obstáculo importante para el tratamiento continuo de los consumidores sensibles a los precios, especialmente en las regiones europeas con cobertura de seguro limitada o para pacientes con dificultades económicas. Los gastos de bolsillo para el tratamiento de por vida siguen siendo considerables en toda la región.
- Si bien la conciencia está aumentando gradualmente, la percepción de falta de una "cura" y la naturaleza crónica de la enfermedad aún pueden obstaculizar el tratamiento proactivo, especialmente para quienes no tienen una cobertura de seguro adecuada o acceso a atención especializada.
- Superar estos desafíos a través de mejores iniciativas educativas para los proveedores de atención médica y el público, mejorando las políticas de reembolso de seguros y el desarrollo de opciones de tratamiento del linfedema más asequibles y accesibles será vital para el crecimiento sostenido del mercado y la mejora de la calidad de vida de millones de personas afectadas por el linfedema.
Alcance del mercado europeo de tratamiento del linfedema
El mercado está segmentado en función del tipo de tratamiento, tipo, zona afectada, grupo etario, vía de administración, usuario final y canal de distribución.
Por tipo de tratamiento
Según el tipo de tratamiento, el mercado del linfedema se segmenta en terapia de compresión, cirugía, farmacoterapia, terapia láser y otros. Se prevé que este segmento domine la mayor cuota de mercado en ingresos, con un 66,87 % en 2025, gracias a su sólida reputación como el tratamiento de referencia para el linfedema y a su naturaleza no invasiva, lo que la hace accesible a una amplia gama de pacientes. Los pacientes suelen priorizar la terapia de compresión por su eficacia para reducir la inflamación y mejorar la comodidad. El mercado también registra una fuerte demanda de prendas y bombas de compresión debido a los continuos avances en materiales y diseños, que mejoran la comodidad y la adherencia.
Se anticipa que el segmento de cirugía experimentará la tasa de crecimiento más rápida durante el período de pronóstico en la región de Europa, impulsado por los crecientes avances en técnicas microquirúrgicas como la anastomosis linfovenosa (LVA) y la transferencia de ganglios linfáticos vascularizados (VLNT), y la creciente conciencia del paciente sobre estas opciones potencialmente curativas en casos graves. Las intervenciones quirúrgicas ofrecen la posibilidad de una reducción significativa del volumen de las extremidades a largo plazo, lo que las hace adecuadas para pacientes que no responden a los tratamientos conservadores. El creciente número de centros quirúrgicos especializados en linfedema y el creciente reconocimiento de la eficacia quirúrgica también contribuyen a su creciente popularidad.
Por tipo
Según el tipo, el mercado de tratamiento del linfedema en la región europea se segmenta en linfedema primario y linfedema secundario. Se prevé que el segmento de linfedema secundario domine la mayor cuota de mercado, con un 79,05 % en 2025, debido a su prevalencia significativamente mayor en la región, atribuida en gran medida a tratamientos oncológicos como la disección de ganglios linfáticos y la radioterapia. Los profesionales sanitarios y los pacientes suelen priorizar el tratamiento del linfedema secundario debido a su asociación con intervenciones oncológicas que salvan vidas y a su inicio más fácil de identificar. El mercado también observa una fuerte demanda de soluciones dirigidas al linfedema secundario debido al aumento de las tasas de supervivencia al cáncer y a una mayor concienciación sobre sus complicaciones posteriores al tratamiento.
Se prevé que el segmento del linfedema primario experimente un crecimiento más rápido durante el período de pronóstico, impulsado por una mayor concienciación y capacidad de diagnóstico para esta afección, a menudo hereditaria y de inicio temprano, junto con avances en las pruebas genéticas y la atención especializada del linfedema pediátrico. Una mayor comprensión de las mutaciones genéticas asociadas al linfedema primario está llevando a un diagnóstico más temprano.
Por zona afectada
Según la zona afectada, el mercado europeo de tratamiento del linfedema se segmenta en extremidades inferiores, extremidades superiores y genitales. Se prevé que el segmento de extremidades inferiores siga dominando la mayor cuota de mercado, con un 53,95% en la región europea, lo que refleja las tendencias globales. Esto se debe principalmente a la alta prevalencia del linfedema filarial en ciertas zonas de Europa, así como al aumento de casos de linfedema relacionado con la insuficiencia venosa crónica y al aumento de la incidencia de cánceres ginecológicos y de próstata. Los pacientes de la región europea que padecen linfedema de extremidades inferiores suelen buscar tratamiento debido a importantes deficiencias funcionales, problemas de movilidad y molestias, lo que genera una demanda sostenida de soluciones terapéuticas.
Se prevé que el segmento de extremidades superiores experimente el mayor crecimiento durante el período de pronóstico en Europa, impulsado por el creciente número de supervivientes de cáncer de mama en la región. El tratamiento del cáncer de mama, en particular la disección de ganglios linfáticos axilares y la radioterapia, sigue siendo un factor de riesgo importante para el linfedema de extremidades superiores. La creciente concienciación entre los pacientes oncológicos y los profesionales sanitarios europeos sobre la detección, el diagnóstico precoz y la intervención del linfedema de brazo está impulsando la demanda de soluciones personalizadas. El continuo desarrollo y la creciente accesibilidad de manguitos de brazo especializados y dispositivos de compresión neumática diseñados para la extremidad superior contribuyen aún más a su creciente presencia en el mercado.
Por grupo de edad
Según el grupo de edad, el mercado europeo de tratamiento del linfedema se segmenta en adultos, geriátrico y pediátrico. Se prevé que el segmento de adultos siga dominando la mayor cuota de mercado en ingresos en la región europea. Esto se debe principalmente a la alta incidencia de linfedema secundario relacionado con tratamientos oncológicos, como los de mama, ginecológico y de próstata, cuya prevalencia es cada vez mayor en la población adulta europea debido a los cambios en el estilo de vida, los factores ambientales y la mejora en el diagnóstico del cáncer. Además, diversas causas adquiridas, como traumatismos, infecciones (como la filariasis en ciertas zonas endémicas) y otras afecciones médicas, contribuyen a la disfunción linfática en adultos. Los pacientes adultos en Europa constituyen el mayor grupo demográfico que busca tratamiento para el linfedema debido al gran tamaño de este segmento poblacional y al creciente conocimiento de las opciones de tratamiento disponibles. El mercado también se beneficia de una amplia gama de productos y soluciones específicamente diseñados para el tratamiento del linfedema en adultos.
Se prevé que el segmento geriátrico experimente la tasa de crecimiento más rápida en la región europea durante el período de pronóstico. Este crecimiento acelerado se ve impulsado por el aumento significativo de la población envejecida en toda Europa, que es inherentemente más susceptible al deterioro linfático relacionado con la edad, lo que conlleva una reducción de la función linfática. La creciente prevalencia de comorbilidades como la insuficiencia venosa crónica, la obesidad y otras enfermedades crónicas relacionadas con la edad también contribuye a la mayor incidencia de linfedema en adultos mayores. A medida que la esperanza de vida continúa aumentando en muchos países europeos, también aumenta la carga de enfermedades crónicas, incluido el linfedema, en las personas mayores.
Por vía de administración
Según la vía de administración, el mercado europeo de tratamiento del linfedema se segmenta en oral, inyectable y tópico. Se prevé que el segmento oral alcance la mayor cuota de mercado, con un 51,84%, en la región europea en 2025. Esto se debe a la comodidad del uso domiciliario de medicamentos de apoyo, como diuréticos para controlar la inflamación, antibióticos para prevenir o tratar la celulitis recurrente (una complicación común del linfedema) y diversos antiinflamatorios. También existe un creciente interés e investigación en las nuevas terapias orales destinadas a mejorar la función linfática. Los pacientes europeos suelen preferir los medicamentos orales por su facilidad de autoadministración, lo que favorece una mejor adherencia a los planes de tratamiento fuera del ámbito clínico.
Se prevé que el segmento de inyectables experimente el mayor crecimiento en la región europea durante el período de pronóstico. Esta rápida expansión se ve impulsada por los continuos esfuerzos de investigación y desarrollo en nuevas terapias biológicas, factores de crecimiento (como el VEGF-C, que estimula la regeneración linfática) y terapias génicas. Estos tratamientos avanzados suelen requerir administración parenteral (inyectable) para estimular eficazmente la regeneración linfática, reducir la inflamación o modular la progresión de la enfermedad.
Por el usuario final
En función del usuario final, el mercado global del tratamiento del linfedema se segmenta en hospitales, clínicas especializadas, centros de cirugía ambulatoria (CAA) y otros. Se prevé que el segmento hospitalario ocupe la mayor cuota de mercado. Este predominio se atribuye a la capacidad del hospital para ofrecer una gama completa de opciones de tratamiento para el linfedema, desde terapias conservadoras en etapas tempranas, como el drenaje linfático manual y la terapia compresiva, hasta procedimientos quirúrgicos avanzados, como la anastomosis linfovenosa y la transferencia de ganglios linfáticos vascularizados. Los hospitales también sirven como principal punto de referencia para casos complicados o en etapas avanzadas, que requieren atención multidisciplinaria, que incluye imágenes, diagnóstico e intervención quirúrgica.
Se prevé que el segmento de clínicas especializadas experimente el mayor crecimiento durante el período de pronóstico. Este crecimiento se debe al creciente número de centros de rehabilitación y atención ambulatoria especializados en linfedema, que ofrecen terapias no invasivas y control de enfermedades crónicas. Estas clínicas atienden especialmente a pacientes con linfedema leve a moderado que requieren sesiones de terapia regulares, lo que las convierte en alternativas rentables y convenientes a las visitas hospitalarias. Su auge se ve impulsado por las crecientes campañas de concienciación e iniciativas gubernamentales para el control del edema crónico, especialmente en entornos urbanos.
Por canal de distribución :
Según el canal de distribución, el mercado global del tratamiento del linfedema se segmenta en farmacias, tiendas, licitación directa, etc. Se prevé que el segmento de licitación directa domine el mercado. Esto se debe principalmente a la adquisición masiva de dispositivos médicos, como bombas de compresión, prendas y kits quirúrgicos, por parte de hospitales públicos, centros de rehabilitación y organismos gubernamentales de salud. Los canales de licitación directa garantizan procesos de adquisición optimizados, el cumplimiento de las normas regulatorias y precios preferenciales, lo que los convierte en la opción preferida de los grandes compradores institucionales.
Se prevé que el segmento de tiendas físicas, que incluye tanto los canales minoristas como los online, sea el de mayor crecimiento durante el período de pronóstico. Esta rápida expansión se atribuye a un cambio en el comportamiento de los pacientes hacia el tratamiento del linfedema en casa, especialmente tras la COVID-19. La comodidad de las compras online, la creciente penetración del comercio electrónico y la disponibilidad de dispositivos de autogestión, como mangas y vendajes de compresión, han acelerado el crecimiento de este segmento. Además, el auge de los servicios de telesalud ha permitido a los pacientes gestionar el linfedema en fase inicial en casa, aumentando la dependencia de los tratamientos de venta libre y online.
Análisis regional del mercado europeo de tratamiento del linfedema
- Europa tuvo una participación de mercado del 29,28% en el tratamiento del linfedema en 2024, impulsada por una alta prevalencia de casos de linfedema (en particular, linfedema relacionado con el cáncer), una sólida infraestructura de atención médica e importantes inversiones en investigación y desarrollo médico.
- Los proveedores de atención médica y los pacientes de la región valoran enormemente las herramientas de diagnóstico avanzadas disponibles, las opciones de tratamiento integrales y las campañas de concientización crecientes que ofrecen las clínicas y hospitales especializados.
- Esta adopción generalizada se ve respaldada además por los altos ingresos disponibles, la fuerte penetración del seguro de salud y un enfoque proactivo para el manejo de enfermedades crónicas, estableciendo la atención del linfedema como una parte integrada de las vías de atención de los pacientes, tanto para los sobrevivientes de cáncer como para aquellos con otros trastornos linfáticos.
Análisis del mercado alemán de tratamiento del linfedema
El mercado alemán del linfedema captó una cuota de mercado significativa en Europa, representando con frecuencia más del 17,45 % en 2024, impulsado por la rápida adopción de herramientas de diagnóstico avanzadas y la creciente tendencia hacia la atención integral del linfedema. Los profesionales sanitarios y los pacientes priorizan cada vez más la detección temprana y el tratamiento eficaz del linfedema mediante protocolos de tratamiento integrales. El creciente reconocimiento de la afección entre los profesionales sanitarios, sumado a la sólida demanda de terapias de compresión especializadas, bombas neumáticas y monitorización digital de la salud, impulsa aún más la industria del linfedema. Además, la creciente integración de políticas de apoyo, como la cobertura sanitaria nacional integral para el linfedema, junto con los avances tecnológicos en espectroscopia de bioimpedancia (BIS) y plataformas de monitorización remota de pacientes, contribuye significativamente a la expansión del mercado, mejorando el acceso y la adherencia de los pacientes a los cuidados de larga duración.
Perspectivas del mercado del tratamiento del linfedema en el Reino Unido
El mercado del linfedema en el Reino Unido obtuvo una cuota de mercado notable del 15,3% en Europa, lo que contribuyó significativamente al crecimiento regional en 2025, impulsado por la adopción gradual de herramientas de diagnóstico avanzadas y el creciente énfasis en la atención integral del linfedema dentro del Servicio Nacional de Salud (NHS). Los profesionales sanitarios y los pacientes de todo el Reino Unido priorizan cada vez más la detección temprana y el tratamiento integral del linfedema mediante protocolos de tratamiento coordinados y enfoques de atención multidisciplinares. La creciente concienciación sobre la enfermedad entre los profesionales sanitarios, sumada a la creciente demanda de prendas de compresión especializadas, dispositivos de compresión neumática y nuevas herramientas de salud digital, está impulsando constantemente el mercado del linfedema en el país. Además, el apoyo de organizaciones nacionales de defensa, como la Red de Apoyo al Linfedema, y las iniciativas del NHS que promueven la educación y el acceso de los pacientes, junto con los avances tecnológicos en modalidades de diagnóstico como la espectroscopia de bioimpedancia (BIS) y las plataformas de gestión remota de pacientes, está contribuyendo a la expansión del mercado. Estos esfuerzos están mejorando el acceso al diagnóstico oportuno y promoviendo la adherencia a las estrategias de atención a largo plazo, lo que en última instancia mejora los resultados para los pacientes del Reino Unido que viven con linfedema.
Cuota de mercado del tratamiento del linfedema en Europa
La industria del tratamiento del linfedema está liderada principalmente por empresas bien establecidas, entre las que se incluyen:
- Tactile Medical (EE. UU.)
- Essity Aktiebolag (publ) (Suecia)
- 3M (EE. UU.)
- Cardinal Health (EE. UU.)
- Lohmann & Rauscher GmbH & Co. KG (Alemania)
- PAUL HARTMANN AG (Alemania)
- medi GmbH & Co. KG (Alemania)
- ConvaTec Inc. (Reino Unido)
- Juzo (Alemania)
- Smith + Nephew (Reino Unido)
- GRUPO SIGVARIS (Suiza)
- Sanyleg Srl (Italia)
- Avet Pharmaceuticals Inc. (EE. UU.)
- ThermoTek Inc. (EE. UU.)
- Huntleigh Healthcare Limited (Reino Unido)
- KOYA MEDICAL (EE. UU.)
- AIROS Medical, Inc. (EE. UU.)
- SISTEMAS DE BIOCOMPRESIÓN (EE. UU.)
- Mego Afek Ltd. (Israel)
- GRUPO SIGVARIS (Suiza)
- Sanyleg Srl (Italia)
- Thusane (Francia)
Últimos avances en el mercado europeo del tratamiento del linfedema
- En marzo de 2025, BSN Medical (una empresa de Essity) anunció una nueva iniciativa para mejorar la formación en el cuidado de heridas en toda Europa, con el objetivo de dotar a más profesionales sanitarios de conocimientos avanzados en el tratamiento de heridas crónicas, incluyendo aspectos relevantes para el linfedema. Este programa se centra en prácticas basadas en la evidencia e innovaciones de productos para mejorar los resultados de los pacientes.
- En abril de 2025, el Grupo Lohmann & Rauscher (L&R) adquirió un distribuidor líder de dispositivos médicos en Francia, lo que fortaleció significativamente la presencia y el acceso de L&R al mercado de productos para el linfedema en los sectores hospitalario y domiciliario francés. Esta estrategia busca aprovechar la extensa cartera de productos de L&R y expandir su presencia europea.
- En febrero de 2025, medi GmbH & Co. KG presentó una línea actualizada de prendas de compresión diseñadas específicamente para el linfedema de las extremidades inferiores. Estas prendas ofrecen mayor transpirabilidad y un ajuste anatómico para mayor comodidad y cumplimiento terapéutico del paciente. Este lanzamiento responde a la creciente demanda de soluciones discretas y cómodas para el tratamiento a largo plazo.
- En octubre de 2024, Juzo GmbH lanzó su nueva línea de medias de compresión "JuzoFlex" para el linfedema de las extremidades superiores, con un tejido más ligero y opciones de tallas innovadoras. Diseñadas para el uso diario y de fácil aplicación, estas prendas buscan aumentar la adherencia del paciente y mejorar su calidad de vida.
- En julio de 2024, SIGVARIS AG anunció una colaboración con una destacada plataforma europea de telesalud para integrar la monitorización remota de pacientes en el tratamiento del linfedema. Esta colaboración permite a los pacientes realizar un seguimiento de las medidas de sus extremidades y de su adherencia al tratamiento, facilitando así las consultas virtuales con sus equipos de atención.
SKU-
Obtenga acceso en línea al informe sobre la primera nube de inteligencia de mercado del mundo

- Panel de análisis de datos interactivo
- Panel de análisis de empresas para oportunidades con alto potencial de crecimiento
- Acceso de analista de investigación para personalización y consultas
- Análisis de la competencia con panel interactivo
- Últimas noticias, actualizaciones y análisis de tendencias
- Aproveche el poder del análisis de referencia para un seguimiento integral de la competencia
Tabla de contenido
1 INTRODUCTION
1.1 OBJECTIVES OF THE STUDY
1.2 MARKET DEFINITION
1.3 OVERVIEW OF EUROPE LYMPHEDEMA TREATMENT MARKET
1.4 LIMITATIONS
1.5 MARKETS COVERED
2 MARKET SEGMENTATION
2.1 MARKETS COVERED
2.2 GEOGRAPHICAL SCOPE
2.3 YEARS CONSIDERED FOR THE STUDY
2.4 CURRENCY AND PRICING
2.5 DBMR TRIPOD DATA VALIDATION MODEL
2.6 MULTIVARIATE MODELLING
2.7 PRODUCT TYPE LIFELINE CURVE
2.8 PRIMARY INTERVIEWS WITH KEY OPINION LEADERS
2.9 DBMR MARKET POSITION GRID
2.1 MARKET END USER COVERAGE GRID
2.11 VENDOR SHARE ANALYSIS
2.12 SECONDARY SOURCES
2.13 ASSUMPTIONS
3 EXECUTIVE SUMMARY
4 PREMIUM INSIGHTS
4.1 PORTER’S FIVE FORCES
4.2 PESTEL ANALYSIS
4.3 INDUSTRY INSIGHTS –
4.3.1 MICRO AND MACROECONOMIC FACTORS
4.3.2 PENETRATION AND GROWTH PROSPECT MAPPING
4.3.3 KEY PRICING STRATEGIES
4.3.4 ANALYSIS AND RECOMMENDATION
4.4 INNOVATION TRACKER & STRATEGIC ANALYSIS
4.4.1 MAJOR DEALS AND STRATEGIC ALLIANCES ANALYSIS
4.4.1.1 MERGERS & ACQUISITIONS
4.4.1.2 TECHNOLOGY COLLABORATIONS
4.4.2 NUMBER OF PRODUCTS IN DEVELOPMENT
4.4.3 STAGE OF DEVELOPMENT
4.4.4 TIMELINES & MILESTONES
4.4.5 INNOVATION STRATEGIES & METHODOLOGIES
4.4.6 RISK ASSESSMENT & MITIGATION
4.4.7 FUTURE OUTLOOK
4.5 PIPELINE ANALYSIS – EUROPE LYMPHEDEMA TREATMENT MARKET
4.5.1 CLINICAL TRIALS AND PHASE ANALYSIS
4.5.2 DRUG THERAPY PIPELINE
4.5.3 PHASE III CANDIDATES
4.5.4 PHASE II CANDIDATES
4.5.5 PHASE I CANDIDATES
4.5.6 OTHERS (PRE-CLINICAL AND RESEARCH)
4.5.7 CONCLUSION
4.6 EPIDEMIOLOGY–
4.6.1 INCIDENCE OF LYMPHEDEMA (EUROPE & BY GENDER)
4.6.2 INCIDENCE OF LYMPHEDEMA BY GENDER
4.6.3 TREATMENT RATE
4.6.4 MORTALITY RATE
4.6.5 DRUG ADHERENCE AND THERAPY SWITCH MODEL
4.6.6 PATIENT TREATMENT SUCCESS RATES
4.7 TARIFF
4.7.1 OVERVIEW
4.7.2 TARIFF STRUCTURES
4.7.2.1 Europe vs. Regional Tariff Structures
4.7.2.2 United States: Medicare/Medicaid Tariff Policies, CMS Pricing Models
4.7.2.3 European Union: Cross-border Tariff Regulations and Reimbursement Policies
4.7.2.4 Asia-Pacific: Government-imposed Tariffs on Imported Medical Products
4.7.2.5 Emerging Markets: Challenges in Tariff Implementation
4.7.3 PHARMACEUTICAL TARIFFS AND TRADE BARRIERS
4.7.3.1 Import Duties on Prescription Drugs vs. Generics
4.7.3.2 Impact on Drug Affordability and Access
4.7.3.3 Key Trade Agreements Affecting Pharmaceutical Tariffs
4.7.4 IMPACT OF HEALTHCARE TARIFFS ON PROVIDERS AND PATIENTS
4.7.4.1 Cost Burden on Hospitals and Healthcare Facilities
4.7.4.2 Effect on Patient Affordability and Insurance Coverage
4.7.4.3 Tariffs and Their Role in Medical Tourism
4.7.5 TRADE AGREEMENTS AND HEALTHCARE TARIFFS
4.7.5.1 WTO Regulations on Healthcare Tariffs
4.7.5.2 Impact of Trade Wars on the Healthcare Supply Chain
4.7.5.3 Role of Free Trade Agreements (FTAs) in Reducing Tariffs
4.7.6 IMPACT OF TARIFFS ON HEALTHCARE COSTS AND ACCESSIBILITY
4.7.7 IMPORTANCE OF TARIFFS IN THE HEALTHCARE SECTOR
5 REGULATORY FRAMEWORK–
5.1 NORTH AMERICA
5.2 SOUTH AMERICA
5.3 EUROPE
5.4 ASIA-PACIFIC
5.5 MIDDLE EAST & AFRICA
6 MARKET OVERVIEW
6.1 DRIVERS
6.1.1 RISE IN THE NUMBER OF LYMPHEDEMA CASES GLOBALLY
6.1.2 INCREASE IN THE PREVALENCE OF CANCERS
6.1.3 INCREASING NUMBER OF HEALTHCARE FACILITIES
6.1.4 AVAILABILITY AND ADVANCEMENT OF MULTIPLE THERAPEUTIC OPTIONS
6.2 RESTRAINTS
6.2.1 SIGNIFICANT COST BURDEN ASSOCIATED WITH LYMPHEDEMA MANAGEMENT
6.2.2 LACK OF AWARENESS ABOUT THE DISEASE
6.3 OPPORTUNITIES
6.3.1 EXPANDING OPPORTUNITIES FOR DRUG DEVELOPMENT AND REGULATORY APPROVALS
6.3.2 STRATEGIC COLLABORATIONS AND ALLIANCES AMONG INDUSTRY STAKEHOLDERS
6.4 CHALLENGES
6.4.1 ABSENCE OF A DEFINITIVE CURATIVE TREATMENT
6.4.2 RESTRICTIVE AND INCONSISTENT REIMBURSEMENT POLICIES
7 EUROPE LYMPHEDEMA TREATMENT MARKET, BY TREATMENT TYPE
7.1 OVERVIEW
7.2 COMPRESSION THERAPY
7.3 SURGERY
7.4 DRUG THERAPY
7.5 LASER THERAPY
7.6 OTHERS
8 EUROPE LYMPHEDEMA TREATMENT MARKET, BY TYPE
8.1 OVERVIEW
8.2 SECONDARY LYMPHEDEMA
8.3 PRIMARY LYMPHEDEMA
9 EUROPE LYMPHEDEMA TREATMENT MARKET, BY AFFECTED AREA
9.1 OVERVIEW
9.2 LOWER EXTREMITY
9.3 UPPER EXTREMITY
9.4 GENITALIA
10 EUROPE LYMPHEDEMA TREATMENT MARKET, BY AGE GROUP
10.1 OVERVIEW
10.2 ADULT
10.3 GERIATRIC
10.4 PEDIATRIC
11 EUROPE LYMPHEDEMA TREATMENT MARKET, BY ROUTE OF ADMINISTRATION
11.1 OVERVIEW
11.2 ORAL
11.3 INJECTABLE
11.4 TOPICAL
12 EUROPE LYMPHEDEMA TREATMENT MARKET, BY END USER
12.1 OVERVIEW
12.2 HOSPITAL
12.3 SPECIALTY CLINICS
12.4 AMBULATORY SURGICAL CENTERS
12.5 OTHERS
13 EUROPE LYMPHEDEMA TREATMENT MARKET, BY DISTRIBUTION CHANNEL
13.1 OVERVIEW
13.2 PHARMACY STORES
13.3 DIRECT TENDER
13.4 OTHERS
14 EUROPE LYMPHEDEMA TREATMENT MARKET, BY REGION
14.1 EUROPE
14.1.1 GERMANY
14.1.2 FRANCE
14.1.3 UNITED KINGDOM
14.1.4 ITALY
14.1.5 RUSSIA
14.1.6 SPAIN
14.1.7 TURKEY
14.1.8 NETHERLANDS
14.1.9 SWITZERLAND
14.1.10 BELGIUM
14.1.11 POLAND
14.1.12 AUSTRIA
14.1.13 HUNGARY
14.1.14 NORWAY
14.1.15 IRELAND
14.1.16 LITHUANIA
14.1.17 REST OF EUROPE
15 EUROPE LYMPHEDEMA TREATMENT MARKET, COMPANY LANDSCAPE
15.1 COMPANY SHARE ANALYSIS: EUROPE
16 SWOT ANALYSIS
17 COMPANY PROFILE
17.1 TACTILE MEDICAL
17.1.1 COMPANY SNAPSHOT
17.1.2 REVENUE ANALYSIS
17.1.3 COMPANY SHARE ANALYSIS
17.1.4 PRODUCT PORTFOLIO
17.1.5 RECENT DEVELOPMENT
17.2 ESSITY AKTIEBOLAG (PUBL)
17.2.1 COMPANY SNAPSHOT
17.2.2 REVENUE ANALYSIS
17.2.3 COMPANY SHARE ANALYSIS
17.2.4 PRODUCT PORTFOLIO
17.2.5 RECENT DEVELOPMENT
17.3 3M
17.3.1 COMPANY SNAPSHOT
17.3.2 REVENUE ANALYSIS
17.3.3 COMPANY SHARE ANALYSIS
17.3.4 PRODUCT PORTFOLIO
17.3.5 RECENT DEVELOPMENTS
17.4 CARDINAL HEALTH
17.4.1 COMPANY SNAPSHOT
17.4.2 REVENUE ANALYSIS
17.4.3 COMPANY SHARE ANALYSIS
17.4.4 PRODUCT PORTFOLIO
17.4.5 RECENT DEVELOPMENT
17.5 LOHMANN & RAUSCHER GMBH & CO. KG
17.5.1 COMPANY SNAPSHOT
17.5.2 COMPANY SHARE ANALYSIS
17.5.3 PRODUCT PORTFOLIO
17.5.4 RECENT DEVELOPMENT
17.6 AIROS MEDICAL, INC.
17.6.1 COMPANY SNAPSHOT
17.6.2 PRODUCT PORTFOLIO
17.6.3 RECENT DEVELOPMENT
17.7 ARJO
17.7.1 COMPANY SNAPSHOT
17.7.2 REVENUE ANALYSIS
17.7.3 PRODUCT PORTFOLIO
17.7.4 RECENT DEVELOPMENTS
17.8 AVET PHARMACEUTICALS INC.
17.8.1 COMPANY SNAPSHOT
17.8.2 PRODUCT PORTFOLIO
17.8.3 RECENT DEVELOPMENT
17.9 BAUERFEIND
17.9.1 COMPANY SNAPSHOT
17.9.2 PRODUCT PORTFOLIO
17.9.3 RECENT DEVELOPMENTS
17.1 BIOCOMPRESSION SYSTEMS
17.10.1 COMPANY SNAPSHOT
17.10.2 PRODUCT PORTFOLIO
17.10.3 RECENT DEVELOPMENT
17.11 CONVATEC INC.
17.11.1 COMPANY SNAPSHOT
17.11.2 PRODUCT PORTFOLIO
17.11.3 RECENT DEVELOPMENT
17.12 ENOVIS CORPORATION
17.12.1 COMPANY SNAPSHOT
17.12.2 REVENUE ANALYSIS
17.12.3 PRODUCT PORTFOLIO
17.12.4 RECENT DEVELOPMENTS
17.13 HUNTLEIGH HEALTHCARE LIMITED
17.13.1 COMPANY SNAPSHOT
17.13.2 PRODUCT PORTFOLIO
17.13.3 RECENT DEVELOPMENT
17.14 IMPEDIMED LIMITED
17.14.1 COMPANY SNAPSHOT
17.14.2 REVENUE ANALYSIS
17.14.3 PRODUCT PORTFOLIO
17.14.4 RECENT DEVELOPMENT/NEWS
17.15 JODAS EXPOIM PVT. LTD.
17.15.1 COMPANY SNAPSHOT
17.15.2 PRODUCT PORTFOLIO
17.15.3 RECENT DEVELOPMENT
17.16 JUZO
17.16.1 COMPANY SNAPSHOT
17.16.2 PRODUCT PORTFOLIO
17.16.3 RECENT DEVELOPMENT
17.17 KOYA MEDICAL
17.17.1 COMPANY SNAPSHOT
17.17.2 PRODUCT PORTFOLIO
17.17.3 RECENT DEVELOPMENT
17.18 LLC BINNOPHARM GROUP
17.18.1 COMPANY SNAPSHOT
17.18.2 PRODUCT PORTFOLIO
17.18.3 RECENT DEVELOPMENT
17.19 MCKESSON MEDICAL-SURGICAL INC.
17.19.1 COMPANY SNAPSHOT
17.19.2 REVENUE ANALYSIS
17.19.3 PRODUCT PORTFOLIO
17.19.4 RECENT DEVELOPMENT
17.2 MEDI GMBH & CO. KG
17.20.1 COMPANY SNAPSHOT
17.20.2 PRODUCT PORTFOLIO
17.20.3 RECENT DEVELOPMENT
17.21 MEDTRONIC
17.21.1 COMPANY SNAPSHOT
17.21.2 REVENUE ANALYSIS
17.21.3 PRODUCT PORTFOLIO
17.21.4 RECENT DEVELOPMENTS
17.22 MEGO AFEK LTD
17.22.1 COMPANY SNAPSHOT
17.22.2 PRODUCT PORTFOLIO
17.22.3 RECENT DEVELOPMENT
17.23 PAUL HARTMANN AG
17.23.1 COMPANY SNAPSHOT
17.23.2 REVENUE ANALYSIS
17.23.3 PRODUCT PORTFOLIO
17.23.4 RECENT DEVELOPMENT
17.24 PERFORMANCE HEALTH
17.24.1 COMPANY SNAPSHOT
17.24.2 PRODUCT PORTFOLIO
17.24.3 RECENT DEVELOPMENTS
17.25 PURETECH HEALTH INC
17.25.1 COMPANY SNAPSHOT
17.25.2 PIPELINE PORTFOLIO
17.25.3 RECENT DEVELOPMENT
17.26 SANYLEG SRL A SOCIO UNICO
17.26.1 COMPANY SNAPSHOT
17.26.2 PRODUCT PORTFOLIO
17.26.3 RECENT DEVELOPMENT
17.27 SIGVARIS GROUP
17.27.1 COMPANY SNAPSHOT
17.27.2 PRODUCT PORTFOLIO
17.27.3 RECENT DEVELOPMENTS
17.28 SMITH+NEPHEW
17.28.1 COMPANY SNAPSHOT
17.28.2 REVENUE ANALYSIS
17.28.3 PRODUCT PORTFOLIO
17.28.4 RECENT DEVELOPMENT
17.29 THERMOTEK
17.29.1 COMPANY SNAPSHOT
17.29.2 PRODUCT PORTFOLIO
17.29.3 RECENT DEVELOPMENT
17.3 THUASNE
17.30.1 COMPANY SNAPSHOT
17.30.2 PRODUCT PORTFOLIO
17.30.3 RECENT DEVELOPMENT
17.31 VIATRIS INC.
17.31.1 COMPANY SNAPSHOT
17.31.2 REVENUE ANALYSIS
17.31.3 PRODUCT PORTFOLIO
17.31.4 RECENT DEVELOPMENT
17.32 WHITE SWAN PHARMACEUTICAL
17.32.1 COMPANY SNAPSHOT
17.32.2 PRODUCT PORTFOLIO
17.32.3 RECENT DEVELOPMENTS
18 QUESTIONNAIRE
19 RELATED REPORTS
Lista de Tablas
TABLE 1 PRODUCTS AND THEIR STAGES IN DEVELOPMENT.
TABLE 2 PHASE-WISE DISTRIBUTION: CLINICAL TRIALS
TABLE 3 PHASE 2 CANDIDATES
TABLE 4 EUROPE LYMPHEDEMA TREATMENT MARKET, BY TREATMENT TYPE, 2018-2032 (USD THOUSAND)
TABLE 5 EUROPE LYMPHEDEMA TREATMENT MARKET, BY TREATMENT TYPE, 2018-2032 (VOLUME IN THOUSAND UNITS)
TABLE 6 EUROPE COMPRESSION THERAPY IN LYMPHEDEMA TREATMENT MARKET, BY REGION 2018-2032 (USD THOUSAND)
TABLE 7 EUROPE COMPRESSION THERAPY IN LYMPHEDEMA TREATMENT MARKET, BY PRODUCT, 2018-2032 (USD THOUSAND)
TABLE 8 EUROPE COMPRESSION GARMENTS IN LYMPHEDEMA TREATMENT MARKET, BY PRODUCT, 2018-2032 (USD THOUSAND)
TABLE 9 EUROPE COMPRESSION THERAPY IN LYMPHEDEMA TREATMENT MARKET, BY TECHNIQUE, 2018-2032 (USD THOUSAND)
TABLE 10 EUROPE SURGERY IN LYMPHEDEMA TREATMENT MARKET, BY REGION, 2018-2032 (USD THOUSAND)
TABLE 11 EUROPE SURGERY IN LYMPHEDEMA TREATMENT MARKET, BY TREATMENT TYPE, 2018-2032 (USD THOUSAND)
TABLE 12 EUROPE DRUG THERAPY IN LYMPHEDEMA TREATMENT MARKET, BY REGION, 2018-2032 (USD THOUSAND)
TABLE 13 EUROPE DRUG THERAPY IN LYMPHEDEMA TREATMENT MARKET, BY TREATMENT TYPE, 2018-2032 (USD THOUSAND)
TABLE 14 EUROPE LASER THERAPY IN LYMPHEDEMA TREATMENT MARKET, BY REGION, 2018-2032 (USD THOUSAND)
TABLE 15 EUROPE OTHERS IN LYMPHEDEMA TREATMENT MARKET, BY REGION, 2018-2032 (USD THOUSAND)
TABLE 16 EUROPE LYMPHEDEMA TREATMENT MARKET, BY TYPE, 2018-2032 (USD THOUSAND)
TABLE 17 EUROPE SECONDARY LYMPHEDEMA IN LYMPHEDEMA TREATMENT MARKET, BY REGION, 2018-2032 (USD THOUSAND)
TABLE 18 EUROPE PRIMARY LYMPHEDEMA IN LYMPHEDEMA TREATMENT MARKET, BY REGION, 2018-2032 (USD THOUSAND)
TABLE 19 EUROPE PRIMARY LYMPHEDEMA IN LYMPHEDEMA TREATMENT MARKET, BY TYPE, 2018-2032 (USD THOUSAND)
TABLE 20 EUROPE LYMPHEDEMA TREATMENT MARKET, BY AFFECTED AREA, 2018-2032 (USD THOUSAND)
TABLE 21 EUROPE LOWER EXTREMITY IN LYMPHEDEMA TREATMENT MARKET, BY REGION, 2018-2032 (USD THOUSAND)
TABLE 22 EUROPE UPPER EXTREMITY IN LYMPHEDEMA TREATMENT MARKET, BY REGION, 2018-2032 (USD THOUSAND)
TABLE 23 EUROPE GENITALIA IN LYMPHEDEMA TREATMENT MARKET, BY REGION, 2018-2032 (USD THOUSAND)
TABLE 24 EUROPE LYMPHEDEMA TREATMENT MARKET, BY AGE GROUP, 2018-2032 (USD THOUSAND)
TABLE 25 EUROPE ADULT IN LYMPHEDEMA TREATMENT MARKET, BY REGION, 2018-2032 (USD THOUSAND)
TABLE 26 EUROPE GERIATRIC IN LYMPHEDEMA TREATMENT MARKET, BY REGION, 2018-2032 (USD THOUSAND)
TABLE 27 EUROPE PEDIATRIC IN LYMPHEDEMA TREATMENT MARKET, BY REGION, 2018-2032 (USD THOUSAND)
TABLE 28 EUROPE LYMPHEDEMA TREATMENT MARKET, BY ROUTE OF ADMINISTRATION, 2018-2032 (USD THOUSAND)
TABLE 29 EUROPE ORAL IN LYMPHEDEMA TREATMENT MARKET, BY REGION, 2018-2032 (USD THOUSAND)
TABLE 30 EUROPE INJECTABLE IN LYMPHEDEMA TREATMENT MARKET, BY REGION, 2018-2032 (USD THOUSAND)
TABLE 31 EUROPE TOPICAL IN LYMPHEDEMA TREATMENT MARKET, BY REGION, 2018-2032 (USD THOUSAND)
TABLE 32 EUROPE LYMPHEDEMA TREATMENT MARKET, BY END USER, 2018-2032 (USD THOUSAND)
TABLE 33 EUROPE HOSPITAL IN LYMPHEDEMA TREATMENT MARKET, BY REGION, 2018-2032 (USD THOUSAND)
TABLE 34 EUROPE SPECIALITY CLINICS IN LYMPHEDEMA TREATMENT MARKET, BY REGION, 2018-2032 (USD THOUSAND)
TABLE 35 EUROPE AMBULATORY SURGICAL CENTERS IN LYMPHEDEMA TREATMENT MARKET, BY REGION, 2018-2032 (USD THOUSAND)
TABLE 36 EUROPE OTHERS IN LYMPHEDEMA TREATMENT MARKET, BY REGION, 2018-2032 (USD THOUSAND)
TABLE 37 EUROPE LYMPHEDEMA TREATMENT MARKET, BY DISTRIBUTION CHANNEL, 2018-2032 (USD THOUSAND)
TABLE 38 EUROPE PHARMACY STORES IN LYMPHEDEMA TREATMENT MARKET, BY REGION, 2018-2032 (USD THOUSAND)
TABLE 39 EUROPE DIRECT TENDER IN LYMPHEDEMA TREATMENT MARKET, BY REGION, 2018-2032 (USD THOUSAND)
TABLE 40 EUROPE OTHERS IN LYMPHEDEMA TREATMENT MARKET, BY REGION, 2018-2032 (USD THOUSAND)
TABLE 41 EUROPE LYMPHEDEMA TREATMENT MARKET, BY COUNTRY, 2018-2032 (USD THOUSAND)
TABLE 42 EUROPE LYMPHEDEMA TREATMENT MARKET, BY TREATMENT TYPE, 2018-2032 (USD THOUSAND)
TABLE 43 EUROPE LYMPHEDEMA TREATMENT MARKET, BY TREATMENT TYPE, 2018-2032 (VOLUME IN THOUSAND UNITS)
TABLE 44 EUROPE LYMPHEDEMA TREATMENT MARKET, BY TREATMENT TYPE, 2018-2032 (ASP IN USD/UNITS)
TABLE 45 EUROPE COMPRESSION THERAPY IN LYMPHEDEMA TREATMENT MARKET, BY PRODUCT, 2018-2032 (USD THOUSAND)
TABLE 46 EUROPE COMPRESSION GARMENTS IN LYMPHEDEMA TREATMENT MARKET, BY PRODUCT, 2018-2032 (USD THOUSAND)
TABLE 47 EUROPE COMPRESSION THERAPY IN LYMPHEDEMA TREATMENT MARKET, BY TECHNIQUE, 2018-2032 (USD THOUSAND)
TABLE 48 EUROPE SURGERY IN LYMPHEDEMA TREATMENT MARKET, BY TREATMENT TYPE, 2018-2032 (USD THOUSAND)
TABLE 49 EUROPE DRUG THERAPY IN LYMPHEDEMA TREATMENT MARKET, BY TREATMENT TYPE, 2018-2032 (USD THOUSAND)
TABLE 50 EUROPE LYMPHEDEMA TREATMENT MARKET, BY TYPE, 2018-2032 (USD THOUSAND)
TABLE 51 EUROPE PRIMARY LYMPHEDEMA IN LYMPHEDEMA TREATMENT MARKET, BY TYPE, 2018-2032 (USD THOUSAND)
TABLE 52 EUROPE LYMPHEDEMA TREATMENT MARKET, BY AFFECTED AREA, 2018-2032 (USD THOUSAND)
TABLE 53 EUROPE LYMPHEDEMA TREATMENT MARKET, BY AGE GROUP, 2018-2032 (USD THOUSAND)
TABLE 54 EUROPE LYMPHEDEMA TREATMENT MARKET, BY ROUTE OF ADMINISTRATION, 2018-2032 (USD THOUSAND)
TABLE 55 EUROPE LYMPHEDEMA TREATMENT MARKET, BY END USER, 2018-2032 (USD THOUSAND)
TABLE 56 EUROPE LYMPHEDEMA TREATMENT MARKET, BY DISTRIBUTION CHANNEL, 2018-2032 (USD THOUSAND)
TABLE 57 GERMANY LYMPHEDEMA TREATMENT MARKET, BY TREATMENT TYPE, 2018-2032 (USD THOUSAND)
TABLE 58 GERMANY LYMPHEDEMA TREATMENT MARKET, BY TREATMENT TYPE, 2018-2032 (VOLUME IN THOUSAND UNITS)
TABLE 59 GERMANY LYMPHEDEMA TREATMENT MARKET, BY TREATMENT TYPE, 2018-2032 (ASP IN USD/UNITS)
TABLE 60 GERMANY COMPRESSION THERAPY IN LYMPHEDEMA TREATMENT MARKET, BY PRODUCT, 2018-2032 (USD THOUSAND)
TABLE 61 GERMANY COMPRESSION GARMENTS IN LYMPHEDEMA TREATMENT MARKET, BY PRODUCT, 2018-2032 (USD THOUSAND)
TABLE 62 GERMANY COMPRESSION THERAPY IN LYMPHEDEMA TREATMENT MARKET, BY TECHNIQUE, 2018-2032 (USD THOUSAND)
TABLE 63 GERMANY SURGERY IN LYMPHEDEMA TREATMENT MARKET, BY TREATMENT TYPE, 2018-2032 (USD THOUSAND)
TABLE 64 GERMANY DRUG THERAPY IN LYMPHEDEMA TREATMENT MARKET, BY TREATMENT TYPE, 2018-2032 (USD THOUSAND)
TABLE 65 GERMANY LYMPHEDEMA TREATMENT MARKET, BY TYPE, 2018-2032 (USD THOUSAND)
TABLE 66 GERMANY PRIMARY LYMPHEDEMA IN LYMPHEDEMA TREATMENT MARKET, BY TYPE, 2018-2032 (USD THOUSAND)
TABLE 67 GERMANY LYMPHEDEMA TREATMENT MARKET, BY AFFECTED AREA, 2018-2032 (USD THOUSAND)
TABLE 68 GERMANY LYMPHEDEMA TREATMENT MARKET, BY AGE GROUP, 2018-2032 (USD THOUSAND)
TABLE 69 GERMANY LYMPHEDEMA TREATMENT MARKET, BY ROUTE OF ADMINISTRATION, 2018-2032 (USD THOUSAND)
TABLE 70 GERMANY LYMPHEDEMA TREATMENT MARKET, BY END USER, 2018-2032 (USD THOUSAND)
TABLE 71 GERMANY LYMPHEDEMA TREATMENT MARKET, BY DISTRIBUTION CHANNEL, 2018-2032 (USD THOUSAND)
TABLE 72 FRANCE LYMPHEDEMA TREATMENT MARKET, BY TREATMENT TYPE, 2018-2032 (USD THOUSAND)
TABLE 73 FRANCE LYMPHEDEMA TREATMENT MARKET, BY TREATMENT TYPE, 2018-2032 (VOLUME IN THOUSAND UNITS)
TABLE 74 FRANCE LYMPHEDEMA TREATMENT MARKET, BY TREATMENT TYPE, 2018-2032 (ASP IN USD/UNITS)
TABLE 75 FRANCE COMPRESSION THERAPY IN LYMPHEDEMA TREATMENT MARKET, BY PRODUCT, 2018-2032 (USD THOUSAND)
TABLE 76 FRANCE COMPRESSION GARMENTS IN LYMPHEDEMA TREATMENT MARKET, BY PRODUCT, 2018-2032 (USD THOUSAND)
TABLE 77 FRANCE COMPRESSION THERAPY IN LYMPHEDEMA TREATMENT MARKET, BY TECHNIQUE, 2018-2032 (USD THOUSAND)
TABLE 78 FRANCE SURGERY IN LYMPHEDEMA TREATMENT MARKET, BY TREATMENT TYPE, 2018-2032 (USD THOUSAND)
TABLE 79 FRANCE DRUG THERAPY IN LYMPHEDEMA TREATMENT MARKET, BY TREATMENT TYPE, 2018-2032 (USD THOUSAND)
TABLE 80 FRANCE LYMPHEDEMA TREATMENT MARKET, BY TYPE, 2018-2032 (USD THOUSAND)
TABLE 81 FRANCE PRIMARY LYMPHEDEMA IN LYMPHEDEMA TREATMENT MARKET, BY TYPE, 2018-2032 (USD THOUSAND)
TABLE 82 FRANCE LYMPHEDEMA TREATMENT MARKET, BY AFFECTED AREA, 2018-2032 (USD THOUSAND)
TABLE 83 FRANCE LYMPHEDEMA TREATMENT MARKET, BY AGE GROUP, 2018-2032 (USD THOUSAND)
TABLE 84 FRANCE LYMPHEDEMA TREATMENT MARKET, BY ROUTE OF ADMINISTRATION, 2018-2032 (USD THOUSAND)
TABLE 85 FRANCE LYMPHEDEMA TREATMENT MARKET, BY END USER, 2018-2032 (USD THOUSAND)
TABLE 86 FRANCE LYMPHEDEMA TREATMENT MARKET, BY DISTRIBUTION CHANNEL, 2018-2032 (USD THOUSAND)
TABLE 87 UNITED KINGDOM LYMPHEDEMA TREATMENT MARKET, BY TREATMENT TYPE, 2018-2032 (USD THOUSAND)
TABLE 88 UNITED KINGDOM LYMPHEDEMA TREATMENT MARKET, BY TREATMENT TYPE, 2018-2032 (VOLUME IN THOUSAND UNITS)
TABLE 89 UNITED KINGDOM LYMPHEDEMA TREATMENT MARKET, BY TREATMENT TYPE, 2018-2032 (ASP IN USD/UNITS)
TABLE 90 UNITED KINGDOM COMPRESSION THERAPY IN LYMPHEDEMA TREATMENT MARKET, BY PRODUCT, 2018-2032 (USD THOUSAND)
TABLE 91 UNITED KINGDOM COMPRESSION GARMENTS IN LYMPHEDEMA TREATMENT MARKET, BY PRODUCT, 2018-2032 (USD THOUSAND)
TABLE 92 UNITED KINGDOM COMPRESSION THERAPY IN LYMPHEDEMA TREATMENT MARKET, BY TECHNIQUE, 2018-2032 (USD THOUSAND)
TABLE 93 UNITED KINGDOM SURGERY IN LYMPHEDEMA TREATMENT MARKET, BY TREATMENT TYPE, 2018-2032 (USD THOUSAND)
TABLE 94 UNITED KINGDOM DRUG THERAPY IN LYMPHEDEMA TREATMENT MARKET, BY TREATMENT TYPE, 2018-2032 (USD THOUSAND)
TABLE 95 UNITED KINGDOM LYMPHEDEMA TREATMENT MARKET, BY TYPE, 2018-2032 (USD THOUSAND)
TABLE 96 UNITED KINGDOM PRIMARY LYMPHEDEMA IN LYMPHEDEMA TREATMENT MARKET, BY TYPE, 2018-2032 (USD THOUSAND)
TABLE 97 UNITED KINGDOM LYMPHEDEMA TREATMENT MARKET, BY AFFECTED AREA, 2018-2032 (USD THOUSAND)
TABLE 98 UNITED KINGDOM LYMPHEDEMA TREATMENT MARKET, BY AGE GROUP, 2018-2032 (USD THOUSAND)
TABLE 99 UNITED KINGDOM LYMPHEDEMA TREATMENT MARKET, BY ROUTE OF ADMINISTRATION, 2018-2032 (USD THOUSAND)
TABLE 100 UNITED KINGDOM LYMPHEDEMA TREATMENT MARKET, BY END USER, 2018-2032 (USD THOUSAND)
TABLE 101 UNITED KINGDOM LYMPHEDEMA TREATMENT MARKET, BY DISTRIBUTION CHANNEL, 2018-2032 (USD THOUSAND)
TABLE 102 ITALY LYMPHEDEMA TREATMENT MARKET, BY TREATMENT TYPE, 2018-2032 (USD THOUSAND)
TABLE 103 ITALY LYMPHEDEMA TREATMENT MARKET, BY TREATMENT TYPE, 2018-2032 (VOLUME IN THOUSAND UNITS)
TABLE 104 ITALY LYMPHEDEMA TREATMENT MARKET, BY TREATMENT TYPE, 2018-2032 (ASP IN USD/UNITS)
TABLE 105 ITALY COMPRESSION THERAPY IN LYMPHEDEMA TREATMENT MARKET, BY PRODUCT, 2018-2032 (USD THOUSAND)
TABLE 106 ITALY COMPRESSION GARMENTS IN LYMPHEDEMA TREATMENT MARKET, BY PRODUCT, 2018-2032 (USD THOUSAND)
TABLE 107 ITALY COMPRESSION THERAPY IN LYMPHEDEMA TREATMENT MARKET, BY TECHNIQUE, 2018-2032 (USD THOUSAND)
TABLE 108 ITALY SURGERY IN LYMPHEDEMA TREATMENT MARKET, BY TREATMENT TYPE, 2018-2032 (USD THOUSAND)
TABLE 109 ITALY DRUG THERAPY IN LYMPHEDEMA TREATMENT MARKET, BY TREATMENT TYPE, 2018-2032 (USD THOUSAND)
TABLE 110 ITALY LYMPHEDEMA TREATMENT MARKET, BY TYPE, 2018-2032 (USD THOUSAND)
TABLE 111 ITALY PRIMARY LYMPHEDEMA IN LYMPHEDEMA TREATMENT MARKET, BY TYPE, 2018-2032 (USD THOUSAND)
TABLE 112 ITALY LYMPHEDEMA TREATMENT MARKET, BY AFFECTED AREA, 2018-2032 (USD THOUSAND)
TABLE 113 ITALY LYMPHEDEMA TREATMENT MARKET, BY AGE GROUP, 2018-2032 (USD THOUSAND)
TABLE 114 ITALY LYMPHEDEMA TREATMENT MARKET, BY ROUTE OF ADMINISTRATION, 2018-2032 (USD THOUSAND)
TABLE 115 ITALY LYMPHEDEMA TREATMENT MARKET, BY END USER, 2018-2032 (USD THOUSAND)
TABLE 116 ITALY LYMPHEDEMA TREATMENT MARKET, BY DISTRIBUTION CHANNEL, 2018-2032 (USD THOUSAND)
TABLE 117 RUSSIA LYMPHEDEMA TREATMENT MARKET, BY TREATMENT TYPE, 2018-2032 (USD THOUSAND)
TABLE 118 RUSSIA LYMPHEDEMA TREATMENT MARKET, BY TREATMENT TYPE, 2018-2032 (VOLUME IN THOUSAND UNITS)
TABLE 119 RUSSIA LYMPHEDEMA TREATMENT MARKET, BY TREATMENT TYPE, 2018-2032 (ASP IN USD/UNITS)
TABLE 120 RUSSIA COMPRESSION THERAPY IN LYMPHEDEMA TREATMENT MARKET, BY PRODUCT, 2018-2032 (USD THOUSAND)
TABLE 121 RUSSIA COMPRESSION GARMENTS IN LYMPHEDEMA TREATMENT MARKET, BY PRODUCT, 2018-2032 (USD THOUSAND)
TABLE 122 RUSSIA COMPRESSION THERAPY IN LYMPHEDEMA TREATMENT MARKET, BY TECHNIQUE, 2018-2032 (USD THOUSAND)
TABLE 123 RUSSIA SURGERY IN LYMPHEDEMA TREATMENT MARKET, BY TREATMENT TYPE, 2018-2032 (USD THOUSAND)
TABLE 124 RUSSIA DRUG THERAPY IN LYMPHEDEMA TREATMENT MARKET, BY TREATMENT TYPE, 2018-2032 (USD THOUSAND)
TABLE 125 RUSSIA LYMPHEDEMA TREATMENT MARKET, BY TYPE, 2018-2032 (USD THOUSAND)
TABLE 126 RUSSIA PRIMARY LYMPHEDEMA IN LYMPHEDEMA TREATMENT MARKET, BY TYPE, 2018-2032 (USD THOUSAND)
TABLE 127 RUSSIA LYMPHEDEMA TREATMENT MARKET, BY AFFECTED AREA, 2018-2032 (USD THOUSAND)
TABLE 128 RUSSIA LYMPHEDEMA TREATMENT MARKET, BY AGE GROUP, 2018-2032 (USD THOUSAND)
TABLE 129 RUSSIA LYMPHEDEMA TREATMENT MARKET, BY ROUTE OF ADMINISTRATION, 2018-2032 (USD THOUSAND)
TABLE 130 RUSSIA LYMPHEDEMA TREATMENT MARKET, BY END USER, 2018-2032 (USD THOUSAND)
TABLE 131 RUSSIA LYMPHEDEMA TREATMENT MARKET, BY DISTRIBUTION CHANNEL, 2018-2032 (USD THOUSAND)
TABLE 132 SPAIN LYMPHEDEMA TREATMENT MARKET, BY TREATMENT TYPE, 2018-2032 (USD THOUSAND)
TABLE 133 SPAIN LYMPHEDEMA TREATMENT MARKET, BY TREATMENT TYPE, 2018-2032 (VOLUME IN THOUSAND UNITS)
TABLE 134 SPAIN LYMPHEDEMA TREATMENT MARKET, BY TREATMENT TYPE, 2018-2032 (ASP IN USD/UNITS)
TABLE 135 SPAIN COMPRESSION THERAPY IN LYMPHEDEMA TREATMENT MARKET, BY PRODUCT, 2018-2032 (USD THOUSAND)
TABLE 136 SPAIN COMPRESSION GARMENTS IN LYMPHEDEMA TREATMENT MARKET, BY PRODUCT, 2018-2032 (USD THOUSAND)
TABLE 137 SPAIN COMPRESSION THERAPY IN LYMPHEDEMA TREATMENT MARKET, BY TECHNIQUE, 2018-2032 (USD THOUSAND)
TABLE 138 SPAIN SURGERY IN LYMPHEDEMA TREATMENT MARKET, BY TREATMENT TYPE, 2018-2032 (USD THOUSAND)
TABLE 139 SPAIN DRUG THERAPY IN LYMPHEDEMA TREATMENT MARKET, BY TREATMENT TYPE, 2018-2032 (USD THOUSAND)
TABLE 140 SPAIN LYMPHEDEMA TREATMENT MARKET, BY TYPE, 2018-2032 (USD THOUSAND)
TABLE 141 SPAIN PRIMARY LYMPHEDEMA IN LYMPHEDEMA TREATMENT MARKET, BY TYPE, 2018-2032 (USD THOUSAND)
TABLE 142 SPAIN LYMPHEDEMA TREATMENT MARKET, BY AFFECTED AREA, 2018-2032 (USD THOUSAND)
TABLE 143 SPAIN LYMPHEDEMA TREATMENT MARKET, BY AGE GROUP, 2018-2032 (USD THOUSAND)
TABLE 144 SPAIN LYMPHEDEMA TREATMENT MARKET, BY ROUTE OF ADMINISTRATION, 2018-2032 (USD THOUSAND)
TABLE 145 SPAIN LYMPHEDEMA TREATMENT MARKET, BY END USER, 2018-2032 (USD THOUSAND)
TABLE 146 SPAIN LYMPHEDEMA TREATMENT MARKET, BY DISTRIBUTION CHANNEL, 2018-2032 (USD THOUSAND)
TABLE 147 TURKEY LYMPHEDEMA TREATMENT MARKET, BY TREATMENT TYPE, 2018-2032 (USD THOUSAND)
TABLE 148 TURKEY LYMPHEDEMA TREATMENT MARKET, BY TREATMENT TYPE, 2018-2032 (VOLUME IN THOUSAND UNITS)
TABLE 149 TURKEY LYMPHEDEMA TREATMENT MARKET, BY TREATMENT TYPE, 2018-2032 (ASP IN USD/UNITS)
TABLE 150 TURKEY COMPRESSION THERAPY IN LYMPHEDEMA TREATMENT MARKET, BY PRODUCT, 2018-2032 (USD THOUSAND)
TABLE 151 TURKEY COMPRESSION GARMENTS IN LYMPHEDEMA TREATMENT MARKET, BY PRODUCT, 2018-2032 (USD THOUSAND)
TABLE 152 TURKEY COMPRESSION THERAPY IN LYMPHEDEMA TREATMENT MARKET, BY TECHNIQUE, 2018-2032 (USD THOUSAND)
TABLE 153 TURKEY SURGERY IN LYMPHEDEMA TREATMENT MARKET, BY TREATMENT TYPE, 2018-2032 (USD THOUSAND)
TABLE 154 TURKEY DRUG THERAPY IN LYMPHEDEMA TREATMENT MARKET, BY TREATMENT TYPE, 2018-2032 (USD THOUSAND)
TABLE 155 TURKEY LYMPHEDEMA TREATMENT MARKET, BY TYPE, 2018-2032 (USD THOUSAND)
TABLE 156 TURKEY PRIMARY LYMPHEDEMA IN LYMPHEDEMA TREATMENT MARKET, BY TYPE, 2018-2032 (USD THOUSAND)
TABLE 157 TURKEY LYMPHEDEMA TREATMENT MARKET, BY AFFECTED AREA, 2018-2032 (USD THOUSAND)
TABLE 158 TURKEY LYMPHEDEMA TREATMENT MARKET, BY AGE GROUP, 2018-2032 (USD THOUSAND)
TABLE 159 TURKEY LYMPHEDEMA TREATMENT MARKET, BY ROUTE OF ADMINISTRATION, 2018-2032 (USD THOUSAND)
TABLE 160 TURKEY LYMPHEDEMA TREATMENT MARKET, BY END USER, 2018-2032 (USD THOUSAND)
TABLE 161 TURKEY LYMPHEDEMA TREATMENT MARKET, BY DISTRIBUTION CHANNEL, 2018-2032 (USD THOUSAND)
TABLE 162 NETHERLANDS LYMPHEDEMA TREATMENT MARKET, BY TREATMENT TYPE, 2018-2032 (USD THOUSAND)
TABLE 163 NETHERLANDS LYMPHEDEMA TREATMENT MARKET, BY TREATMENT TYPE, 2018-2032 (VOLUME IN THOUSAND UNITS)
TABLE 164 NETHERLANDS LYMPHEDEMA TREATMENT MARKET, BY TREATMENT TYPE, 2018-2032 (ASP IN USD/UNITS)
TABLE 165 NETHERLANDS COMPRESSION THERAPY IN LYMPHEDEMA TREATMENT MARKET, BY PRODUCT, 2018-2032 (USD THOUSAND)
TABLE 166 NETHERLANDS COMPRESSION GARMENTS IN LYMPHEDEMA TREATMENT MARKET, BY PRODUCT, 2018-2032 (USD THOUSAND)
TABLE 167 NETHERLANDS COMPRESSION THERAPY IN LYMPHEDEMA TREATMENT MARKET, BY TECHNIQUE, 2018-2032 (USD THOUSAND)
TABLE 168 NETHERLANDS SURGERY IN LYMPHEDEMA TREATMENT MARKET, BY TREATMENT TYPE, 2018-2032 (USD THOUSAND)
TABLE 169 NETHERLANDS DRUG THERAPY IN LYMPHEDEMA TREATMENT MARKET, BY TREATMENT TYPE, 2018-2032 (USD THOUSAND)
TABLE 170 NETHERLANDS LYMPHEDEMA TREATMENT MARKET, BY TYPE, 2018-2032 (USD THOUSAND)
TABLE 171 NETHERLANDS PRIMARY LYMPHEDEMA IN LYMPHEDEMA TREATMENT MARKET, BY TYPE, 2018-2032 (USD THOUSAND)
TABLE 172 NETHERLANDS LYMPHEDEMA TREATMENT MARKET, BY AFFECTED AREA, 2018-2032 (USD THOUSAND)
TABLE 173 NETHERLANDS LYMPHEDEMA TREATMENT MARKET, BY AGE GROUP, 2018-2032 (USD THOUSAND)
TABLE 174 NETHERLANDS LYMPHEDEMA TREATMENT MARKET, BY ROUTE OF ADMINISTRATION, 2018-2032 (USD THOUSAND)
TABLE 175 NETHERLANDS LYMPHEDEMA TREATMENT MARKET, BY END USER, 2018-2032 (USD THOUSAND)
TABLE 176 NETHERLANDS LYMPHEDEMA TREATMENT MARKET, BY DISTRIBUTION CHANNEL, 2018-2032 (USD THOUSAND)
TABLE 177 SWITZERLAND LYMPHEDEMA TREATMENT MARKET, BY TREATMENT TYPE, 2018-2032 (USD THOUSAND)
TABLE 178 SWITZERLAND LYMPHEDEMA TREATMENT MARKET, BY TREATMENT TYPE, 2018-2032 (VOLUME IN THOUSAND UNITS)
TABLE 179 SWITZERLAND LYMPHEDEMA TREATMENT MARKET, BY TREATMENT TYPE, 2018-2032 (ASP IN USD/UNITS)
TABLE 180 SWITZERLAND COMPRESSION THERAPY IN LYMPHEDEMA TREATMENT MARKET, BY PRODUCT, 2018-2032 (USD THOUSAND)
TABLE 181 SWITZERLAND COMPRESSION GARMENTS IN LYMPHEDEMA TREATMENT MARKET, BY PRODUCT, 2018-2032 (USD THOUSAND)
TABLE 182 SWITZERLAND COMPRESSION THERAPY IN LYMPHEDEMA TREATMENT MARKET, BY TECHNIQUE, 2018-2032 (USD THOUSAND)
TABLE 183 SWITZERLAND SURGERY IN LYMPHEDEMA TREATMENT MARKET, BY TREATMENT TYPE, 2018-2032 (USD THOUSAND)
TABLE 184 SWITZERLAND DRUG THERAPY IN LYMPHEDEMA TREATMENT MARKET, BY TREATMENT TYPE, 2018-2032 (USD THOUSAND)
TABLE 185 SWITZERLAND LYMPHEDEMA TREATMENT MARKET, BY TYPE, 2018-2032 (USD THOUSAND)
TABLE 186 SWITZERLAND PRIMARY LYMPHEDEMA IN LYMPHEDEMA TREATMENT MARKET, BY TYPE, 2018-2032 (USD THOUSAND)
TABLE 187 SWITZERLAND LYMPHEDEMA TREATMENT MARKET, BY AFFECTED AREA, 2018-2032 (USD THOUSAND)
TABLE 188 SWITZERLAND LYMPHEDEMA TREATMENT MARKET, BY AGE GROUP, 2018-2032 (USD THOUSAND)
TABLE 189 SWITZERLAND LYMPHEDEMA TREATMENT MARKET, BY ROUTE OF ADMINISTRATION, 2018-2032 (USD THOUSAND)
TABLE 190 SWITZERLAND LYMPHEDEMA TREATMENT MARKET, BY END USER, 2018-2032 (USD THOUSAND)
TABLE 191 SWITZERLAND LYMPHEDEMA TREATMENT MARKET, BY DISTRIBUTION CHANNEL, 2018-2032 (USD THOUSAND)
TABLE 192 BELGIUM LYMPHEDEMA TREATMENT MARKET, BY TREATMENT TYPE, 2018-2032 (USD THOUSAND)
TABLE 193 BELGIUM LYMPHEDEMA TREATMENT MARKET, BY TREATMENT TYPE, 2018-2032 (VOLUME IN THOUSAND UNITS)
TABLE 194 BELGIUM LYMPHEDEMA TREATMENT MARKET, BY TREATMENT TYPE, 2018-2032 (ASP IN USD/UNITS)
TABLE 195 BELGIUM COMPRESSION THERAPY IN LYMPHEDEMA TREATMENT MARKET, BY PRODUCT, 2018-2032 (USD THOUSAND)
TABLE 196 BELGIUM COMPRESSION GARMENTS IN LYMPHEDEMA TREATMENT MARKET, BY PRODUCT, 2018-2032 (USD THOUSAND)
TABLE 197 BELGIUM COMPRESSION THERAPY IN LYMPHEDEMA TREATMENT MARKET, BY TECHNIQUE, 2018-2032 (USD THOUSAND)
TABLE 198 BELGIUM SURGERY IN LYMPHEDEMA TREATMENT MARKET, BY TREATMENT TYPE, 2018-2032 (USD THOUSAND)
TABLE 199 BELGIUM DRUG THERAPY IN LYMPHEDEMA TREATMENT MARKET, BY TREATMENT TYPE, 2018-2032 (USD THOUSAND)
TABLE 200 BELGIUM LYMPHEDEMA TREATMENT MARKET, BY TYPE, 2018-2032 (USD THOUSAND)
TABLE 201 BELGIUM PRIMARY LYMPHEDEMA IN LYMPHEDEMA TREATMENT MARKET, BY TYPE, 2018-2032 (USD THOUSAND)
TABLE 202 BELGIUM LYMPHEDEMA TREATMENT MARKET, BY AFFECTED AREA, 2018-2032 (USD THOUSAND)
TABLE 203 BELGIUM LYMPHEDEMA TREATMENT MARKET, BY AGE GROUP, 2018-2032 (USD THOUSAND)
TABLE 204 BELGIUM LYMPHEDEMA TREATMENT MARKET, BY ROUTE OF ADMINISTRATION, 2018-2032 (USD THOUSAND)
TABLE 205 BELGIUM LYMPHEDEMA TREATMENT MARKET, BY END USER, 2018-2032 (USD THOUSAND)
TABLE 206 BELGIUM LYMPHEDEMA TREATMENT MARKET, BY DISTRIBUTION CHANNEL, 2018-2032 (USD THOUSAND)
TABLE 207 POLAND LYMPHEDEMA TREATMENT MARKET, BY TREATMENT TYPE, 2018-2032 (USD THOUSAND)
TABLE 208 POLAND LYMPHEDEMA TREATMENT MARKET, BY TREATMENT TYPE, 2018-2032 (VOLUME IN THOUSAND UNITS)
TABLE 209 POLAND LYMPHEDEMA TREATMENT MARKET, BY TREATMENT TYPE, 2018-2032 (ASP IN USD/UNITS)
TABLE 210 POLAND COMPRESSION THERAPY IN LYMPHEDEMA TREATMENT MARKET, BY PRODUCT, 2018-2032 (USD THOUSAND)
TABLE 211 POLAND COMPRESSION GARMENTS IN LYMPHEDEMA TREATMENT MARKET, BY PRODUCT, 2018-2032 (USD THOUSAND)
TABLE 212 POLAND COMPRESSION THERAPY IN LYMPHEDEMA TREATMENT MARKET, BY TECHNIQUE, 2018-2032 (USD THOUSAND)
TABLE 213 POLAND SURGERY IN LYMPHEDEMA TREATMENT MARKET, BY TREATMENT TYPE, 2018-2032 (USD THOUSAND)
TABLE 214 POLAND DRUG THERAPY IN LYMPHEDEMA TREATMENT MARKET, BY TREATMENT TYPE, 2018-2032 (USD THOUSAND)
TABLE 215 POLAND LYMPHEDEMA TREATMENT MARKET, BY TYPE, 2018-2032 (USD THOUSAND)
TABLE 216 POLAND PRIMARY LYMPHEDEMA IN LYMPHEDEMA TREATMENT MARKET, BY TYPE, 2018-2032 (USD THOUSAND)
TABLE 217 POLAND LYMPHEDEMA TREATMENT MARKET, BY AFFECTED AREA, 2018-2032 (USD THOUSAND)
TABLE 218 POLAND LYMPHEDEMA TREATMENT MARKET, BY AGE GROUP, 2018-2032 (USD THOUSAND)
TABLE 219 POLAND LYMPHEDEMA TREATMENT MARKET, BY ROUTE OF ADMINISTRATION, 2018-2032 (USD THOUSAND)
TABLE 220 POLAND LYMPHEDEMA TREATMENT MARKET, BY END USER, 2018-2032 (USD THOUSAND)
TABLE 221 POLAND LYMPHEDEMA TREATMENT MARKET, BY DISTRIBUTION CHANNEL, 2018-2032 (USD THOUSAND)
TABLE 222 AUSTRIA LYMPHEDEMA TREATMENT MARKET, BY TREATMENT TYPE, 2018-2032 (USD THOUSAND)
TABLE 223 AUSTRIA LYMPHEDEMA TREATMENT MARKET, BY TREATMENT TYPE, 2018-2032 (VOLUME IN THOUSAND UNITS)
TABLE 224 AUSTRIA LYMPHEDEMA TREATMENT MARKET, BY TREATMENT TYPE, 2018-2032 (ASP IN USD/UNITS)
TABLE 225 AUSTRIA COMPRESSION THERAPY IN LYMPHEDEMA TREATMENT MARKET, BY PRODUCT, 2018-2032 (USD THOUSAND)
TABLE 226 AUSTRIA COMPRESSION GARMENTS IN LYMPHEDEMA TREATMENT MARKET, BY PRODUCT, 2018-2032 (USD THOUSAND)
TABLE 227 AUSTRIA COMPRESSION THERAPY IN LYMPHEDEMA TREATMENT MARKET, BY TECHNIQUE, 2018-2032 (USD THOUSAND)
TABLE 228 AUSTRIA SURGERY IN LYMPHEDEMA TREATMENT MARKET, BY TREATMENT TYPE, 2018-2032 (USD THOUSAND)
TABLE 229 AUSTRIA DRUG THERAPY IN LYMPHEDEMA TREATMENT MARKET, BY TREATMENT TYPE, 2018-2032 (USD THOUSAND)
TABLE 230 AUSTRIA LYMPHEDEMA TREATMENT MARKET, BY TYPE, 2018-2032 (USD THOUSAND)
TABLE 231 AUSTRIA PRIMARY LYMPHEDEMA IN LYMPHEDEMA TREATMENT MARKET, BY TYPE, 2018-2032 (USD THOUSAND)
TABLE 232 AUSTRIA LYMPHEDEMA TREATMENT MARKET, BY AFFECTED AREA, 2018-2032 (USD THOUSAND)
TABLE 233 AUSTRIA LYMPHEDEMA TREATMENT MARKET, BY AGE GROUP, 2018-2032 (USD THOUSAND)
TABLE 234 AUSTRIA LYMPHEDEMA TREATMENT MARKET, BY ROUTE OF ADMINISTRATION, 2018-2032 (USD THOUSAND)
TABLE 235 AUSTRIA LYMPHEDEMA TREATMENT MARKET, BY END USER, 2018-2032 (USD THOUSAND)
TABLE 236 AUSTRIA LYMPHEDEMA TREATMENT MARKET, BY DISTRIBUTION CHANNEL, 2018-2032 (USD THOUSAND)
TABLE 237 HUNGARY LYMPHEDEMA TREATMENT MARKET, BY TREATMENT TYPE, 2018-2032 (USD THOUSAND)
TABLE 238 HUNGARY LYMPHEDEMA TREATMENT MARKET, BY TREATMENT TYPE, 2018-2032 (VOLUME IN THOUSAND UNITS)
TABLE 239 HUNGARY LYMPHEDEMA TREATMENT MARKET, BY TREATMENT TYPE, 2018-2032 (ASP IN USD/UNITS)
TABLE 240 HUNGARY COMPRESSION THERAPY IN LYMPHEDEMA TREATMENT MARKET, BY PRODUCT, 2018-2032 (USD THOUSAND)
TABLE 241 HUNGARY COMPRESSION GARMENTS IN LYMPHEDEMA TREATMENT MARKET, BY PRODUCT, 2018-2032 (USD THOUSAND)
TABLE 242 HUNGARY COMPRESSION THERAPY IN LYMPHEDEMA TREATMENT MARKET, BY TECHNIQUE, 2018-2032 (USD THOUSAND)
TABLE 243 HUNGARY SURGERY IN LYMPHEDEMA TREATMENT MARKET, BY TREATMENT TYPE, 2018-2032 (USD THOUSAND)
TABLE 244 HUNGARY DRUG THERAPY IN LYMPHEDEMA TREATMENT MARKET, BY TREATMENT TYPE, 2018-2032 (USD THOUSAND)
TABLE 245 HUNGARY LYMPHEDEMA TREATMENT MARKET, BY TYPE, 2018-2032 (USD THOUSAND)
TABLE 246 HUNGARY PRIMARY LYMPHEDEMA IN LYMPHEDEMA TREATMENT MARKET, BY TYPE, 2018-2032 (USD THOUSAND)
TABLE 247 HUNGARY LYMPHEDEMA TREATMENT MARKET, BY AFFECTED AREA, 2018-2032 (USD THOUSAND)
TABLE 248 HUNGARY LYMPHEDEMA TREATMENT MARKET, BY AGE GROUP, 2018-2032 (USD THOUSAND)
TABLE 249 HUNGARY LYMPHEDEMA TREATMENT MARKET, BY ROUTE OF ADMINISTRATION, 2018-2032 (USD THOUSAND)
TABLE 250 HUNGARY LYMPHEDEMA TREATMENT MARKET, BY END USER, 2018-2032 (USD THOUSAND)
TABLE 251 HUNGARY LYMPHEDEMA TREATMENT MARKET, BY DISTRIBUTION CHANNEL, 2018-2032 (USD THOUSAND)
TABLE 252 NORWAY LYMPHEDEMA TREATMENT MARKET, BY TREATMENT TYPE, 2018-2032 (USD THOUSAND)
TABLE 253 NORWAY LYMPHEDEMA TREATMENT MARKET, BY TREATMENT TYPE, 2018-2032 (VOLUME IN THOUSAND UNITS)
TABLE 254 NORWAY LYMPHEDEMA TREATMENT MARKET, BY TREATMENT TYPE, 2018-2032 (ASP IN USD/UNITS)
TABLE 255 NORWAY COMPRESSION THERAPY IN LYMPHEDEMA TREATMENT MARKET, BY PRODUCT, 2018-2032 (USD THOUSAND)
TABLE 256 NORWAY COMPRESSION GARMENTS IN LYMPHEDEMA TREATMENT MARKET, BY PRODUCT, 2018-2032 (USD THOUSAND)
TABLE 257 NORWAY COMPRESSION THERAPY IN LYMPHEDEMA TREATMENT MARKET, BY TECHNIQUE, 2018-2032 (USD THOUSAND)
TABLE 258 NORWAY SURGERY IN LYMPHEDEMA TREATMENT MARKET, BY TREATMENT TYPE, 2018-2032 (USD THOUSAND)
TABLE 259 NORWAY DRUG THERAPY IN LYMPHEDEMA TREATMENT MARKET, BY TREATMENT TYPE, 2018-2032 (USD THOUSAND)
TABLE 260 NORWAY LYMPHEDEMA TREATMENT MARKET, BY TYPE, 2018-2032 (USD THOUSAND)
TABLE 261 NORWAY PRIMARY LYMPHEDEMA IN LYMPHEDEMA TREATMENT MARKET, BY TYPE, 2018-2032 (USD THOUSAND)
TABLE 262 NORWAY LYMPHEDEMA TREATMENT MARKET, BY AFFECTED AREA, 2018-2032 (USD THOUSAND)
TABLE 263 NORWAY LYMPHEDEMA TREATMENT MARKET, BY AGE GROUP, 2018-2032 (USD THOUSAND)
TABLE 264 NORWAY LYMPHEDEMA TREATMENT MARKET, BY ROUTE OF ADMINISTRATION, 2018-2032 (USD THOUSAND)
TABLE 265 NORWAY LYMPHEDEMA TREATMENT MARKET, BY END USER, 2018-2032 (USD THOUSAND)
TABLE 266 NORWAY LYMPHEDEMA TREATMENT MARKET, BY DISTRIBUTION CHANNEL, 2018-2032 (USD THOUSAND)
TABLE 267 IRELAND LYMPHEDEMA TREATMENT MARKET, BY TREATMENT TYPE, 2018-2032 (USD THOUSAND)
TABLE 268 IRELAND LYMPHEDEMA TREATMENT MARKET, BY TREATMENT TYPE, 2018-2032 (VOLUME IN THOUSAND UNITS)
TABLE 269 IRELAND LYMPHEDEMA TREATMENT MARKET, BY TREATMENT TYPE, 2018-2032 (ASP IN USD/UNITS)
TABLE 270 IRELAND COMPRESSION THERAPY IN LYMPHEDEMA TREATMENT MARKET, BY PRODUCT, 2018-2032 (USD THOUSAND)
TABLE 271 IRELAND COMPRESSION GARMENTS IN LYMPHEDEMA TREATMENT MARKET, BY PRODUCT, 2018-2032 (USD THOUSAND)
TABLE 272 IRELAND COMPRESSION THERAPY IN LYMPHEDEMA TREATMENT MARKET, BY TECHNIQUE, 2018-2032 (USD THOUSAND)
TABLE 273 IRELAND SURGERY IN LYMPHEDEMA TREATMENT MARKET, BY TREATMENT TYPE, 2018-2032 (USD THOUSAND)
TABLE 274 IRELAND DRUG THERAPY IN LYMPHEDEMA TREATMENT MARKET, BY TREATMENT TYPE, 2018-2032 (USD THOUSAND)
TABLE 275 IRELAND LYMPHEDEMA TREATMENT MARKET, BY TYPE, 2018-2032 (USD THOUSAND)
TABLE 276 IRELAND PRIMARY LYMPHEDEMA IN LYMPHEDEMA TREATMENT MARKET, BY TYPE, 2018-2032 (USD THOUSAND)
TABLE 277 IRELAND LYMPHEDEMA TREATMENT MARKET, BY AFFECTED AREA, 2018-2032 (USD THOUSAND)
TABLE 278 IRELAND LYMPHEDEMA TREATMENT MARKET, BY AGE GROUP, 2018-2032 (USD THOUSAND)
TABLE 279 IRELAND LYMPHEDEMA TREATMENT MARKET, BY ROUTE OF ADMINISTRATION, 2018-2032 (USD THOUSAND)
TABLE 280 IRELAND LYMPHEDEMA TREATMENT MARKET, BY END USER, 2018-2032 (USD THOUSAND)
TABLE 281 IRELAND LYMPHEDEMA TREATMENT MARKET, BY DISTRIBUTION CHANNEL, 2018-2032 (USD THOUSAND)
TABLE 282 LITHUANIA LYMPHEDEMA TREATMENT MARKET, BY TREATMENT TYPE, 2018-2032 (USD THOUSAND)
TABLE 283 LITHUANIA LYMPHEDEMA TREATMENT MARKET, BY TREATMENT TYPE, 2018-2032 (VOLUME IN THOUSAND UNITS)
TABLE 284 LITHUANIA LYMPHEDEMA TREATMENT MARKET, BY TREATMENT TYPE, 2018-2032 (ASP IN USD/UNITS)
TABLE 285 LITHUANIA COMPRESSION THERAPY IN LYMPHEDEMA TREATMENT MARKET, BY PRODUCT, 2018-2032 (USD THOUSAND)
TABLE 286 LITHUANIA COMPRESSION GARMENTS IN LYMPHEDEMA TREATMENT MARKET, BY PRODUCT, 2018-2032 (USD THOUSAND)
TABLE 287 LITHUANIA COMPRESSION THERAPY IN LYMPHEDEMA TREATMENT MARKET, BY TECHNIQUE, 2018-2032 (USD THOUSAND)
TABLE 288 LITHUANIA SURGERY IN LYMPHEDEMA TREATMENT MARKET, BY TREATMENT TYPE, 2018-2032 (USD THOUSAND)
TABLE 289 LITHUANIA DRUG THERAPY IN LYMPHEDEMA TREATMENT MARKET, BY TREATMENT TYPE, 2018-2032 (USD THOUSAND)
TABLE 290 LITHUANIA LYMPHEDEMA TREATMENT MARKET, BY TYPE, 2018-2032 (USD THOUSAND)
TABLE 291 LITHUANIA PRIMARY LYMPHEDEMA IN LYMPHEDEMA TREATMENT MARKET, BY TYPE, 2018-2032 (USD THOUSAND)
TABLE 292 LITHUANIA LYMPHEDEMA TREATMENT MARKET, BY AFFECTED AREA, 2018-2032 (USD THOUSAND)
TABLE 293 LITHUANIA LYMPHEDEMA TREATMENT MARKET, BY AGE GROUP, 2018-2032 (USD THOUSAND)
TABLE 294 LITHUANIA LYMPHEDEMA TREATMENT MARKET, BY ROUTE OF ADMINISTRATION, 2018-2032 (USD THOUSAND)
TABLE 295 LITHUANIA LYMPHEDEMA TREATMENT MARKET, BY END USER, 2018-2032 (USD THOUSAND)
TABLE 296 LITHUANIA LYMPHEDEMA TREATMENT MARKET, BY DISTRIBUTION CHANNEL, 2018-2032 (USD THOUSAND)
TABLE 297 REST OF EUROPE LYMPHEDEMA TREATMENT MARKET, BY TREATMENT TYPE, 2018-2032 (USD THOUSAND)
TABLE 298 REST OF EUROPE LYMPHEDEMA TREATMENT MARKET, BY TREATMENT TYPE, 2018-2032 (VOLUME IN THOUSAND UNITS)
TABLE 299 REST OF EUROPE LYMPHEDEMA TREATMENT MARKET, BY TREATMENT TYPE, 2018-2032 (ASP IN USD/UNITS)
Lista de figuras
FIGURE 1 EUROPE LYMPHEDEMA TREATMENT MARKET: SEGMENTATION
FIGURE 2 EUROPE LYMPHEDEMA TREATMENT MARKET: DATA TRIANGULATION
FIGURE 3 EUROPE LYMPHEDEMA TREATMENT MARKET: DROC ANALYSIS
FIGURE 4 EUROPE LYMPHEDEMA TREATMENT MARKET: EUROPE VS REGIONAL ANALYSIS
FIGURE 5 EUROPE LYMPHEDEMA TREATMENT MARKET: COMPANY RESEARCH ANALYSIS
FIGURE 6 EUROPE LYMPHEDEMA TREATMENT MARKET: INTERVIEW DEMOGRAPHICS
FIGURE 7 EUROPE LYMPHEDEMA TREATMENT MARKET: DBMR MARKET POSITION GRID
FIGURE 8 EUROPE LYMPHEDEMA TREATMENT MARKET: MARKET END USER COVERAGE GRID
FIGURE 9 EUROPE LYMPHEDEMA TREATMENT MARKET: VENDOR SHARE ANALYSIS
FIGURE 10 EXECUTIVE SUMMARY
FIGURE 11 FIVE SEGMENTS COMPRISE THE EUROPE LYMPHEDEMA TREATMENT MARKET, BY TREATMENT TYPE (2024)
FIGURE 12 STRATEGIC DECISIONS
FIGURE 13 EUROPE LYMPHEDEMA TREATMENT MARKET: SEGMENTATION
FIGURE 14 INCREASE IN THE PREVALENCE OF CANCERS IS EXPECTED TO DRIVE THE EUROPE LYMPHEDEMA TREATMENT MARKET IN THE FORECAST PERIOD OF 2025 TO 2032
FIGURE 15 THE COMPRESSION THERAPY SEGMENT IS EXPECTED TO ACCOUNT FOR THE LARGEST SHARE OF THE EUROPE LYMPHEDEMA TREATMENT MARKET IN 2025 AND 2032
FIGURE 16 DRIVERS, RESTRAINTS, OPPORTUNITIES AND CHALLENGES OF INDONESIA ZEOLITE MARKET
FIGURE 17 EUROPE LYMPHEDEMA TREATMENT MARKET: BY TREATMENT TYPE, 2024
FIGURE 18 EUROPE LYMPHEDEMA TREATMENT MARKET: BY TREATMENT TYPE, 2025-2032 (USD THOUSAND)
FIGURE 19 EUROPE LYMPHEDEMA TREATMENT MARKET: BY TREATMENT TYPE, CAGR (2025-2032)
FIGURE 20 EUROPE LYMPHEDEMA TREATMENT MARKET: BY TREATMENT TYPE, LIFELINE CURVE
FIGURE 21 EUROPE LYMPHEDEMA TREATMENT MARKET: BY TYPE, 2024
FIGURE 22 EUROPE LYMPHEDEMA TREATMENT MARKET: BY TYPE, 2025-2032 (USD THOUSAND)
FIGURE 23 EUROPE LYMPHEDEMA TREATMENT MARKET: BY TYPE, CAGR (2025-2032)
FIGURE 24 EUROPE LYMPHEDEMA TREATMENT MARKET: BY TYPE, LIFELINE CURVE
FIGURE 25 EUROPE LYMPHEDEMA TREATMENT MARKET: BY AFFECTED AREA, 2024
FIGURE 26 EUROPE LYMPHEDEMA TREATMENT MARKET: BY AFFECTED AREA, 2025-2032 (USD THOUSAND)
FIGURE 27 EUROPE LYMPHEDEMA TREATMENT MARKET: BY AFFECTED AREA, CAGR (2025-2032)
FIGURE 28 EUROPE LYMPHEDEMA TREATMENT MARKET: BY AFFECTED AREA, LIFELINE CURVE
FIGURE 29 EUROPE LYMPHEDEMA TREATMENT MARKET: BY AGE GROUP, 2024
FIGURE 30 EUROPE LYMPHEDEMA TREATMENT MARKET: BY AGE GROUP, 2025-2032 (USD THOUSAND)
FIGURE 31 EUROPE LYMPHEDEMA TREATMENT MARKET: BY AGE GROUP, CAGR (2025-2032)
FIGURE 32 EUROPE LYMPHEDEMA TREATMENT MARKET: BY AGE GROUP, LIFELINE CURVE
FIGURE 33 EUROPE LYMPHEDEMA TREATMENT MARKET: BY ROUTE OF ADMINISTRATION, 2024
FIGURE 34 EUROPE LYMPHEDEMA TREATMENT MARKET: BY ROUTE OF ADMINISTRATION, 2025-2032 (USD THOUSAND)
FIGURE 35 EUROPE LYMPHEDEMA TREATMENT MARKET: BY ROUTE OF ADMINISTRATION, CAGR (2025-2032)
FIGURE 36 EUROPE LYMPHEDEMA TREATMENT MARKET: BY ROUTE OF ADMINISTRATION, LIFELINE CURVE
FIGURE 37 EUROPE LYMPHEDEMA TREATMENT MARKET: BY END USER, 2024
FIGURE 38 EUROPE LYMPHEDEMA TREATMENT MARKET: BY END USER, 2025-2032 (USD THOUSAND)
FIGURE 39 EUROPE LYMPHEDEMA TREATMENT MARKET: BY END USER, CAGR (2025-2032)
FIGURE 40 EUROPE LYMPHEDEMA TREATMENT MARKET: BY END USER, LIFELINE CURVE
FIGURE 41 EUROPE LYMPHEDEMA TREATMENT MARKET: BY DISTRIBUTION CHANNEL, 2024
FIGURE 42 EUROPE LYMPHEDEMA TREATMENT MARKET: BY DISTRIBUTION CHANNEL, 2025-2032 (USD THOUSAND)
FIGURE 43 EUROPE LYMPHEDEMA TREATMENT MARKET: BY DISTRIBUTION CHANNEL, CAGR (2025-2032)
FIGURE 44 EUROPE LYMPHEDEMA TREATMENT MARKET: BY DISTRIBUTION CHANNEL, LIFELINE CURVE
FIGURE 45 EUROPE LYMPHEDEMA TREATMENT MARKET: SNAPSHOT (2024)
FIGURE 46 EUROPE LYMPHEDEMA TREATMENT MARKET: COMPANY SHARE 2024 (%)
Metodología de investigación
La recopilación de datos y el análisis del año base se realizan utilizando módulos de recopilación de datos con muestras de gran tamaño. La etapa incluye la obtención de información de mercado o datos relacionados a través de varias fuentes y estrategias. Incluye el examen y la planificación de todos los datos adquiridos del pasado con antelación. Asimismo, abarca el examen de las inconsistencias de información observadas en diferentes fuentes de información. Los datos de mercado se analizan y estiman utilizando modelos estadísticos y coherentes de mercado. Además, el análisis de la participación de mercado y el análisis de tendencias clave son los principales factores de éxito en el informe de mercado. Para obtener más información, solicite una llamada de un analista o envíe su consulta.
La metodología de investigación clave utilizada por el equipo de investigación de DBMR es la triangulación de datos, que implica la extracción de datos, el análisis del impacto de las variables de datos en el mercado y la validación primaria (experto en la industria). Los modelos de datos incluyen cuadrícula de posicionamiento de proveedores, análisis de línea de tiempo de mercado, descripción general y guía del mercado, cuadrícula de posicionamiento de la empresa, análisis de patentes, análisis de precios, análisis de participación de mercado de la empresa, estándares de medición, análisis global versus regional y de participación de proveedores. Para obtener más información sobre la metodología de investigación, envíe una consulta para hablar con nuestros expertos de la industria.
Personalización disponible
Data Bridge Market Research es líder en investigación formativa avanzada. Nos enorgullecemos de brindar servicios a nuestros clientes existentes y nuevos con datos y análisis que coinciden y se adaptan a sus objetivos. El informe se puede personalizar para incluir análisis de tendencias de precios de marcas objetivo, comprensión del mercado de países adicionales (solicite la lista de países), datos de resultados de ensayos clínicos, revisión de literatura, análisis de mercado renovado y base de productos. El análisis de mercado de competidores objetivo se puede analizar desde análisis basados en tecnología hasta estrategias de cartera de mercado. Podemos agregar tantos competidores sobre los que necesite datos en el formato y estilo de datos que esté buscando. Nuestro equipo de analistas también puede proporcionarle datos en archivos de Excel sin procesar, tablas dinámicas (libro de datos) o puede ayudarlo a crear presentaciones a partir de los conjuntos de datos disponibles en el informe.

