
Europe Invisible Orthodontics Market
Tamaño del mercado en miles de millones de dólares
Tasa de crecimiento anual compuesta (CAGR) :
% 
 USD
1,269.44 Million
USD
2,983.05 Million
2021
2029
USD
1,269.44 Million
USD
2,983.05 Million
2021
2029
| 2022 –2029 | |
| USD 1,269.44 Million | |
| USD 2,983.05 Million | |
| % | |
Mercado europeo de ortodoncia invisible, por productos y servicios (Productos y servicios), grupo de edad (adultos, adolescentes y niños), aplicación ( maloclusión , apiñamiento, espaciamiento excesivo y otros), usuario final (hospitales, clínicas dentales, clínicas de ortodoncia y otros), canal de distribución (ventas directas y distribuidores externos), país (Alemania, Reino Unido, Francia, Italia, España, Suiza, Países Bajos, Bélgica, Rusia, Turquía y resto de Europa), tendencias de la industria y pronóstico hasta 2029.
Análisis y perspectivas del mercado : mercado europeo de ortodoncia invisible
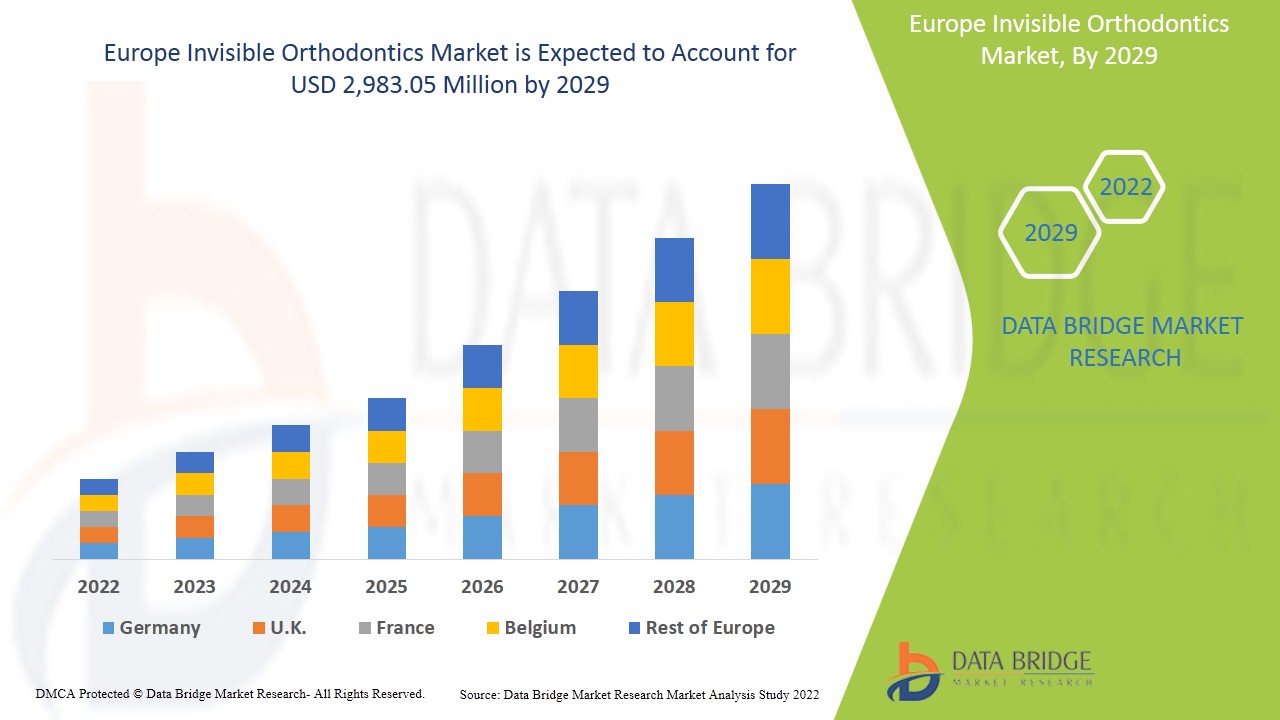
Se espera que el mercado europeo de ortodoncia invisible alcance los 2.983,05 millones de dólares en 2029, frente a los 1.269,44 millones de dólares en 2021, creciendo a una tasa compuesta anual del 11,3 % en el período previsto de 2022 a 2029. La creciente demanda de apariencia estética ha impulsado aún más la demanda de tratamientos de ortodoncia en todo el mundo. Por tanto, la creciente prevalencia de la maloclusión actúa como un motor del crecimiento del mercado de la ortodoncia invisible.
El mercado de la ortodoncia invisible se ocupa de productos y servicios como alineadores transparentes, brackets cerámicos, brackets linguales y retenedores transparentes para el tratamiento de problemas dentales menores como apiñamiento, espaciamiento excesivo y maloclusión. Estas opciones de tratamiento tienen una gran demanda debido al atractivo estético que brindan junto con la opción deseada, además de la creciente conciencia de la odontología cosmética que ha impulsado aún más la demanda de la ortodoncia invisible. Las organizaciones públicas y privadas se están centrando en atender las necesidades cambiantes de los clientes en términos de proporcionar demostraciones, realizar campañas y controles dentales. Por lo tanto, el empleo de tales estrategias promete un crecimiento sustancial de la ortodoncia invisible.
La evolución en el campo de la odontología ha dado lugar a programas de concienciación cada vez mayores por parte de organizaciones públicas y privadas, lo que se espera que actúe como motor del crecimiento del mercado de la ortodoncia invisible en todo el mundo. Sin embargo, el alto coste de la ortodoncia invisible actúa como un freno para su crecimiento en el mercado. La creciente demanda de una apariencia estética actúa como una oportunidad para el crecimiento del mercado. Sin embargo, los efectos secundarios asociados pueden actuar como un desafío para el crecimiento del mercado.
El mercado europeo de ortodoncia invisible proporciona detalles sobre la participación de mercado, nuevos desarrollos y análisis de la cartera de productos, el impacto de los actores del mercado nacional y local, analiza las oportunidades en términos de segmentos de ingresos emergentes, cambios en las regulaciones del mercado, aprobaciones de productos, decisiones estratégicas, lanzamientos de productos, expansiones geográficas e innovaciones tecnológicas en el mercado. Para comprender el análisis y el escenario del mercado, contáctenos para obtener un resumen analítico; nuestro equipo lo ayudará a crear una solución de impacto en los ingresos para lograr su objetivo deseado.
Alcance y tamaño del mercado de ortodoncia invisible en Europa
El mercado europeo de ortodoncia invisible se clasifica en cinco segmentos notables que se basan en productos y servicios, grupos de edad, aplicación, usuario final y canal de distribución.
- En función de los productos y servicios, el mercado europeo de ortodoncia invisible se segmenta en productos y servicios. En 2022, se espera que el segmento de productos domine el mercado europeo de ortodoncia invisible, ya que es el tratamiento preferido por los usuarios finales.
- En función de los grupos de edad, el mercado europeo de ortodoncia invisible se segmenta en niños, adultos y adolescentes. En 2022, se espera que el segmento de adultos domine el mercado europeo de ortodoncia invisible debido a la creciente demanda de un aspecto estético.
- En función de la aplicación, el mercado europeo de ortodoncia invisible se segmenta en apiñamiento, espaciamiento excesivo, maloclusión y otros. En 2022, se espera que el segmento de maloclusión domine el mercado europeo de ortodoncia invisible debido al avance en el tratamiento de ortodoncia invisible.
- En función del usuario final, el mercado europeo de ortodoncia invisible se segmenta en hospitales, clínicas dentales, clínicas de ortodoncia y otros. En 2022, el segmento de hospitales en el usuario final dominará el mercado, ya que los pacientes visitan principalmente los hospitales por cualquier situación médica.
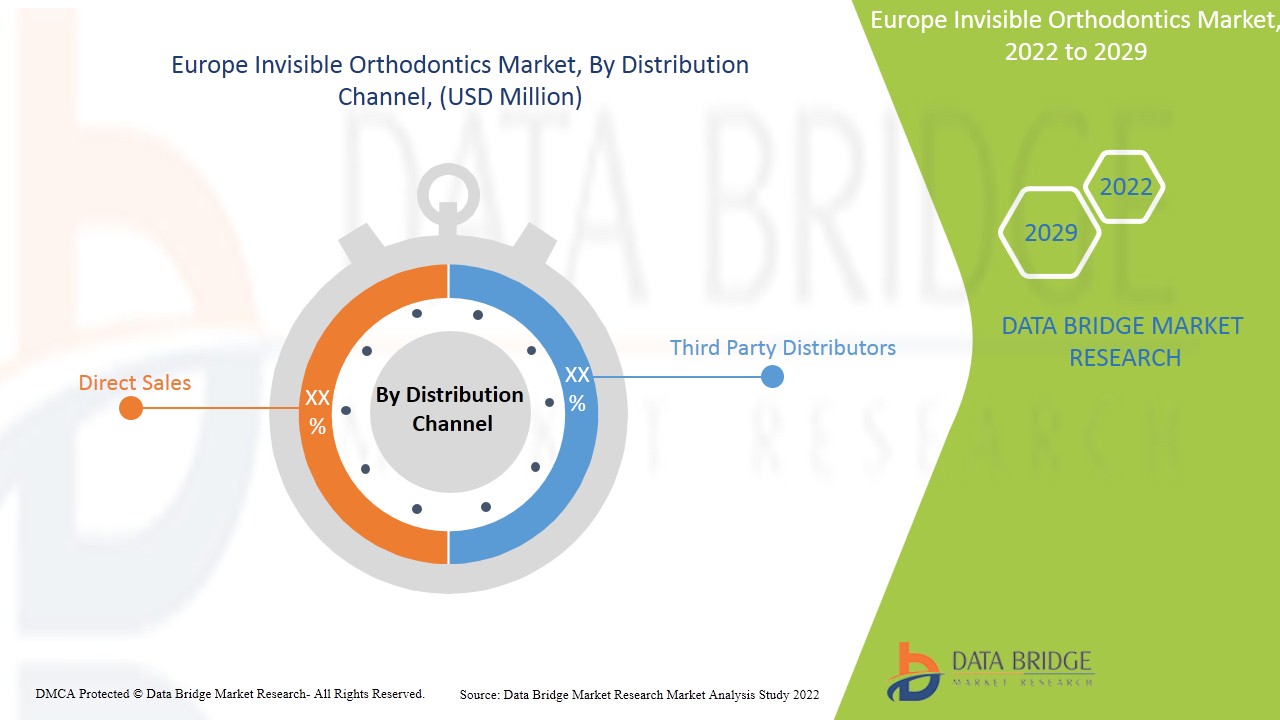
- En función del canal de distribución, el mercado europeo de ortodoncia invisible se segmenta en ventas directas y distribuidores externos. En 2022, el segmento de ventas directas en el canal de distribución dominará el mercado, debido a la creciente demanda de las clínicas dentales.
Análisis a nivel de país del mercado de ortodoncia invisible
Se analiza el mercado de ortodoncia invisible y se proporciona información sobre el tamaño del mercado por productos y servicios, grupo de edad, aplicación, usuario final y canal de distribución. Los países incluidos en el informe sobre el mercado de ortodoncia invisible en Europa son Alemania, Reino Unido, Francia, Italia, España, Suiza, Países Bajos, Bélgica, Rusia, Turquía y el resto de Europa.
Se espera que Europa crezca a medida que aumenta la demanda de apariencia estética invisible. Se espera que el Reino Unido domine el mercado europeo debido al creciente número de actores en el mercado.
La sección de países del informe también proporciona factores de impacto individuales en el mercado y cambios en la regulación en el mercado a nivel nacional que afectan las tendencias actuales y futuras del mercado. Los puntos de datos como nuevas ventas, ventas de reemplazo, demografía del país, leyes regulatorias y aranceles de importación y exportación son algunos de los principales indicadores utilizados para pronosticar el escenario del mercado para países individuales. Además, se considera la presencia y disponibilidad de marcas europeas y los desafíos que enfrentan debido a la competencia grande o escasa de las marcas locales y nacionales, el impacto de los canales de venta al proporcionar un análisis de pronóstico de los datos del país.
Los lanzamientos de nuevos productos por parte de los fabricantes están creando nuevas oportunidades para los actores del mercado de la ortodoncia invisible
El mercado de ortodoncia invisible también le proporciona un análisis detallado del mercado de cada país, el crecimiento del mercado de ortodoncia invisible con las ventas del mercado de ortodoncia invisible, el impacto del avance en el mercado de ortodoncia invisible y los cambios en los escenarios regulatorios con su apoyo al mercado de ortodoncia invisible. Los datos están disponibles para el período histórico de 2011 a 2020.
Análisis del panorama competitivo y de la cuota de mercado de la ortodoncia invisible
El panorama competitivo del mercado de ortodoncia invisible proporciona detalles por competidor. Los detalles incluidos son una descripción general de la empresa, las finanzas de la empresa, los ingresos generados, el potencial de mercado, la inversión en investigación y desarrollo, las nuevas iniciativas de mercado, los sitios e instalaciones de producción, las fortalezas y debilidades de la empresa, el lanzamiento de productos, los procesos de prueba de productos, las aprobaciones de productos, las patentes, la amplitud y la extensión de los productos, el dominio de las aplicaciones y la curva de la línea de vida de la tecnología. Los puntos de datos anteriores proporcionados solo están relacionados con el enfoque de la empresa relacionado con el mercado de ortodoncia invisible.
Algunos de los principales actores que operan en el mercado europeo de ortodoncia invisible son 3M, Henry Schein Orthodontics (una subsidiaria de Henry Schein, Inc.), TP Orthodontics, Inc., DynaFlex, American Orthodontics, Align Technology, Inc., Rocky Mountain Orthodontics, DB Orthodontics, Ortho-Care (UK) Ltd, FORESTADENT - Bernhard Foerster GmbH, DENTAURUM GmbH & Co. KG, Institut Straumann AG, Ormco Corporation (una subsidiaria de Envista), Dentsply Sirona, SmileDirectClub, SMILE2IMPRESS SL, Sunshine Smile GmbH, Straight Teeth Direct y Wondersmile, entre otros.
Muchos lanzamientos de productos y acuerdos también son iniciados por empresas de todo el mundo que también están acelerando el mercado de la ortodoncia invisible.
Por ejemplo,
- En noviembre de 2020, SmileDirectClub anunció que se había asociado con Unified Smiles, una organización de apoyo dental en los EE. UU. Esta asociación realizada por la empresa aumentará su demanda y sus ventas en la región, lo que generará mayores ingresos en el futuro.
Este nuevo producto lanzado por la empresa ha aumentado su cartera de productos de estimación de proteínas en el mercado. La colaboración, las empresas conjuntas y otras estrategias del actor del mercado están mejorando el mercado de la empresa en el mercado de la ortodoncia invisible, lo que también brinda el beneficio a las organizaciones de mejorar su oferta para el mercado de la ortodoncia invisible.
SKU-
Obtenga acceso en línea al informe sobre la primera nube de inteligencia de mercado del mundo

- Panel de análisis de datos interactivo
- Panel de análisis de empresas para oportunidades con alto potencial de crecimiento
- Acceso de analista de investigación para personalización y consultas
- Análisis de la competencia con panel interactivo
- Últimas noticias, actualizaciones y análisis de tendencias
- Aproveche el poder del análisis de referencia para un seguimiento integral de la competencia
Tabla de contenido
- introduction
- OBJECTIVES OF THE STUDY
- MARKET DEFINITION
- OVERVIEW of EUROPE INVISIBLE ORTHODONTICS MARKET
- Currency and pricing
- LIMITATIONs
- MARKETS COVERED
- MARKET SEGMENTATION
- MARKETS COVERED
- geographical scope
- years considered for the study
- DBMR TRIPOD DATA VALIDATION MODEL
- primary interviews with key opinion leaders
- MULTIVARIATE MODELLING
- productS and services LIFELINE CURVE
- DBMR MARKET POSITION GRID
- VENDOR SHARE ANALYSIS
- MARKET application COVERAGE GRID
- secondary sourcEs
- assumptions
- EXECUTIVE SUMMARY
- premium insight
- REGULATIONS OF INVISIBLE ORTHODONTICS MARKET
- Market Overview
- drivers
- Increase in Prevalence of Malocclusion
- Growing Adult Orthodontics
- Increased Cosmetic Awareness
- Growing Number of GPs Offering Orthodontic Services
- Rising demand for minimally invasive surgical techniques
- Restraints
- High price of invisible orthodontics
- Strict regulatory approval
- OPPORTUNITIES
- Technological advancement of cosmetic dentistry techniques
- Introduction of CAM/CAD technology in orthodontics
- Increasing health care expenditure
- Strategic Initiatives by Key market players
- CHALLENGEs
- Limitations associated with the invisible orthodontics
- Market Competition
- Emergence of COVID-19
- Impact of COVID-19
- impact on price
- impact on demand
- IMPACT ON SUPPLY CHAIN
- STRATEGIC DECISIONS of Government and MANUFACTURERS
- Conclusion
- Europe invisible orthodontics Market, By application
- overview
- Malocclusion
- Clear Aligners
- Ceramic Braces
- Clear Retainers
- Lingual Braces
- Crowding
- Clear Aligners
- Ceramic Braces
- Clear Retainers
- Lingual Braces
- Excessive Spacing
- Clear Aligners
- Ceramic Braces
- Clear Retainers
- Lingual Braces
- Others
- Europe invisible orthodontics Market, By age groups
- overview
- Adults
- Clear Aligners
- Ceramic Braces
- Clear Retainers
- Lingual Braces
- Teenagers
- Clear Aligners
- Ceramic Braces
- Clear Retainers
- Lingual Braces
- Children
- Clear Aligners
- Ceramic Braces
- Clear Retainers
- Lingual Braces
- Europe invisible orthodontics Market, By distribution channel
- overview
- DIRECT SALES
- Third Party Distributors
- Europe invisible orthodontics Market, By product and services
- overview
- products
- Clear Aligners
- Ceramic Braces
- Clear Retainers
- Lingual Braces
- services
- Europe invisible orthodontics Market, By end user
- overview
- Hospitals
- Dental Clinics
- Orthodontic Clinics
- Others
- EUROPE invisible orthodontics MARKET, BY GEOGRAPHY
- OVERVIEW
- Europe
- U.K.
- Germany
- france
- Italy
- Spain
- Russia
- Switzerland
- Netherlands
- Belgium
- Turkey
- rest of Europe
- Europe Invisible Orthodontics Market: COMPANY landscape
- company share analysis: Europe
- swot
- Company profile
- Align Technology, Inc.
- COMPANY SNAPSHOT
- REVENUE ANALYSIS
- company share analysis
- SOLUTION PORTFOLIO
- RECENT DEVELOPMENTS
- SmileDirectClub
- COMPANY SNAPSHOT
- REVENUE ANALYSIS
- company share analysis
- PRODUCT PORTFOLIO
- RECENT DEVELOPMENTS
- 3M
- COMPANY SNAPSHOT
- REVENUE ANALYSIS
- company share analysis
- PRODUCT PORTFOLIO
- RECENT DEVELOPMENTS
- Henry Schein Orthodontics (A subsidiary of Henry Schein, Inc.)
- COMPANY SNAPSHOT
- REVENUE ANALYSIS
- company share analysis
- PRODUCT PORTFOLIO
- RECENT DEVELOPMENTS
- alignerco
- COMPANY SNAPSHOT
- PRODUCT PORTFOLIO
- RECENT DEVELOPMENT
- american Orthodontics
- COMPANY SNAPSHOT
- PRODUCT PORTFOLIO
- RECENT DEVELOPMENTS
- candid care co.
- COMPANY SNAPSHOT
- PRODUCT PORTFOLIO
- RECENT DEVELOPMENTS
- DB Orthodontics
- COMPANY SNAPSHOT
- PRODUCT PORTFOLIO
- RECENT DEVELOPMENTS
- DENTAURUM GmbH & Co. KG
- COMPANY SNAPSHOT
- PRODUCT PORTFOLIO
- RECENT DEVELOPMENTS
- dentsply sirona
- COMPANY SNAPSHOT
- REVENUE ANALYSIS
- PRODUCT PORTFOLIO
- RECENT DEVELOPMENTS
- Dr Smile Dental Clinic
- COMPANY SNAPSHOT
- SERVICE PORTFOLIO
- RECENT DEVELOPMENT
- DynaFlex
- COMPANY SNAPSHOT
- PRODUCT PORTFOLIO
- RECENT DEVELOPMENT
- FORESTADENT - Bernhard Foerster GmbH
- COMPANY SNAPSHOT
- PRODUCT PORTFOLIO
- RECENT DEVELOPMENTS
- G&H Orthodontics
- COMPANY SNAPSHOT
- PRODUCT PORTFOLIO
- RECENT DEVELOPMENT
- Great Lakes Dental Technologies
- COMPANY SNAPSHOT
- PRODUCT PORTFOLIO
- RECENT DEVELOPMENT
- Institut Straumann AG
- COMPANY SNAPSHOT
- REVENUE ANALYSIS
- PRODUCT PORTFOLIO
- RECENT DEVELOPMENTS
- ormco corporation (a subsidiary of Envista)
- COMPANY SNAPSHOT
- REVENUE ANALYSIS
- PRODUCT PORTFOLIO
- RECENT DEVELOPMENTS
- Ortho-Care (UK) Ltd
- COMPANY SNAPSHOT
- PRODUCT PORTFOLIO
- RECENT DEVELOPMENT
- rocky mountain orthodontics
- COMPANY SNAPSHOT
- PRODUCT PORTFOLIO
- RECENT DEVELOPMENTS
- SMILE2IMPRESS SL
- COMPANY SNAPSHOT
- PRODUCT PORTFOLIO
- RECENT DEVELOPMENT
- Straight Teeth Direct
- COMPANY SNAPSHOT
- PRODUCT PORTFOLIO
- RECENT DEVELOPMENT
- Sunshine Smile GmbH
- COMPANY SNAPSHOT
- PRODUCT PORTFOLIO
- RECENT DEVELOPMENTS
- TP Orthodontics, Inc.
- COMPANY SNAPSHOT
- PRODUCT PORTFOLIO
- RECENT DEVELOPMENT
- Wondersmile
- COMPANY SNAPSHOT
- PRODUCT PORTFOLIO
- RECENT DEVELOPMENT
- questionnaire
- related reports
Lista de Tablas
TABLE 1 Cost of ceramic braces in the u.s.
TABLE 2 Europe invisible orthodontics market, By application, 2019-2028 (USD million)
TABLE 3 Europe Malocclusion in Invisible Orthodontics Market, By Application 2019-2028 (USD Million)
TABLE 4 Europe Invisible Orthodontics Market, By Malocclusion, By Region, 2019-2028 (USD Million)
TABLE 5 Europe Crowding in Invisible Orthodontics Market, By Application 2019-2028 (USD Million)
TABLE 6 Europe Invisible Orthodontics Market, By Crowding, By Region, 2019-2028 (USD Million)
TABLE 7 Europe Excessive Spacing in Invisible Orthodontics Market, By Application 2019-2028 (USD Million)
TABLE 8 Europe Invisible Orthodontics Market, By Excessive Spacing, By Region, 2019-2028 (USD Million)
TABLE 9 Europe Invisible Orthodontics Market, By Others, By Region, 2019-2028 (USD Million)
TABLE 10 Europe invisible orthodontics market, By age groups, 2019-2028 (USD million)
TABLE 11 Europe Invisible Orthodontics Market, By Adults, By Region, 2019-2028 (USD Million)
TABLE 12 Europe Adults in Invisible Orthodontics Market, By Age Groups 2019-2028 (USD Million)
TABLE 13 Europe Invisible Orthodontics Market, By Teenagers, By Region, 2019-2028 (USD Million)
TABLE 14 Europe Teenagers in Invisible Orthodontics Market, By Age Groups 2019-2028 (USD Million)
TABLE 15 Europe Invisible Orthodontics Market, By Children, By Region, 2019-2028 (USD Million)
TABLE 16 Europe Children in Invisible Orthodontics Market, By Age Groups 2019-2028 (USD Million)
TABLE 17 Europe invisible orthodontics market, By distribution channel, 2019-2028 (USD million)
TABLE 18 Europe Invisible Orthodontics Market, By Direct Sales, By Region, 2019-2028 (USD Million)
TABLE 19 Europe Invisible Orthodontics Market, By Third Party Distributors, By Region, 2019-2028 (USD Million)
TABLE 20 Europe invisible orthodontics market, By product and services, 2019-2028 (USD million)
TABLE 21 Europe Invisible Orthodontics Market, By Product, By Region, 2019-2028 (USD Million)
TABLE 22 Europe Invisible Orthodontics Market, By Product 2019-2028 (USD Million)
TABLE 23 Europe Invisible Orthodontics Market, By Product 2019-2028 (Units)
TABLE 24 Europe Invisible Orthodontics Market, By Services, By Region, 2019-2028 (USD Million)
TABLE 25 Europe invisible orthodontics market, By end user, 2019-2028 (USD million)
TABLE 26 Europe Invisible Orthodontics Market, By Hospitals, By Region, 2019-2028 (USD Million)
TABLE 27 Europe Invisible Orthodontics Market, By Dental Clinics, By Region, 2019-2028 (USD Million)
TABLE 28 Europe Invisible Orthodontics Market, By Orthodontic Clinics, By Region, 2019-2028 (USD Million)
TABLE 29 Europe Invisible Orthodontics Market, By Others, By Region, 2019-2028 (USD Million)
TABLE 30 EUROPE INVISIBLE ORTHODONTICS MARKET, BY REGION, 2019-2028 (USD MILLION)
TABLE 31 Europe INVISIBLE ORTHODONTICS Market, By country, 2019-2028 (USD Million)
TABLE 32 EUROPE Invisible orthodontics Market, By Product & Services, 2019-2028 (USD Million)
TABLE 33 EUROPE Invisible orthodontics Market, By Product, 2019-2028 (USD million)
TABLE 34 Europe Invisible Orthodontics Market, By Product 2019-2028 (Units)
TABLE 35 EUROPE Invisible orthodontics Market, By age groups, 2019-2028 (USD Million)
TABLE 36 EUROPE adults in Invisible orthodontics Market, By Age Groups, 2019-2028 (USD million)
TABLE 37 EUROPE teenagers in Invisible orthodontics Market, By Age Groups, 2019-2028 (USD million)
TABLE 38 EUROPE children in Invisible orthodontics Market, By Age Groups, 2019-2028 (USD million)
TABLE 39 EUROPE Invisible orthodontics Market, By application, 2019-2028 (USD Million)
TABLE 40 Europe maloccusion in Invisible Orthodontics Market, By Application 2019-2028 (USD Million)
TABLE 41 Europe Crowding in Invisible Orthodontics Market, By Application 2019-2028 (USD Million)
TABLE 42 Europe Excessive spacing in Invisible Orthodontics Market, By Application 2019-2028 (USD Million)
TABLE 43 EUROPE Invisible orthodontics Market, By end user, 2019-2028 (USD Million)
TABLE 44 EUROPE Invisible orthodontics Market, By distribtion channel, 2019-2028 (USD Million)
TABLE 45 U.K. Invisible orthodontics Market, By Product & Services, 2019-2028 (USD Million)
TABLE 46 U.K. Invisible orthodontics Market, By Product, 2019-2028 (USD million)
TABLE 47 U.K. Invisible Orthodontics Market, By Product 2019-2028 (Units)
TABLE 48 U.K. Invisible orthodontics Market, By age groups, 2019-2028 (USD Million)
TABLE 49 U.K. adults in Invisible orthodontics Market, By Age Groups, 2019-2028 (USD million)
TABLE 50 U.K. teenagers in Invisible orthodontics Market, By Age Groups, 2019-2028 (USD million)
TABLE 51 U.K. children in Invisible orthodontics Market, By Age Groups, 2019-2028 (USD million)
TABLE 52 U.K. Invisible orthodontics Market, By application, 2019-2028 (USD Million)
TABLE 53 U.K. maloccusion in Invisible Orthodontics Market, By Application 2019-2028 (USD Million)
TABLE 54 U.K. Crowding in Invisible Orthodontics Market, By Application 2019-2028 (USD Million)
TABLE 55 U.K. Excessive spacing in Invisible Orthodontics Market, By Application 2019-2028 (USD Million)
TABLE 56 U.K. Invisible orthodontics Market, By end user, 2019-2028 (USD Million)
TABLE 57 U.K. Invisible orthodontics Market, By distribtion channel, 2019-2028 (USD Million)
TABLE 58 GERMANY Invisible orthodontics Market, By Product & Services, 2019-2028 (USD Million)
TABLE 59 GERMANY Invisible orthodontics Market, By Product, 2019-2028 (USD million)
TABLE 60 Germany Invisible Orthodontics Market, By Product 2019-2028 (units)
TABLE 61 GERMANY Invisible orthodontics Market, By age groups, 2019-2028 (USD Million)
TABLE 62 GERMANY adults in Invisible orthodontics Market, By Age Groups, 2019-2028 (USD million)
TABLE 63 GERMANY teenagers in Invisible orthodontics Market, By Age Groups, 2019-2028 (USD million)
TABLE 64 GERMANY children in Invisible orthodontics Market, By Age Groups, 2019-2028 (USD million)
TABLE 65 GERMANY Invisible orthodontics Market, By application, 2019-2028 (USD Million)
TABLE 66 GERMANY maloccusion in Invisible Orthodontics Market, By Application 2019-2028 (USD Million)
TABLE 67 GERMANY Crowding in Invisible Orthodontics Market, By Application 2019-2028 (USD Million)
TABLE 68 GERMANY Excessive spacing in Invisible Orthodontics Market, By Application 2019-2028 (USD Million)
TABLE 69 GERMANY Invisible orthodontics Market, By end user, 2019-2028 (USD Million)
TABLE 70 GERMANY Invisible orthodontics Market, By distribtion channel, 2019-2028 (USD Million)
TABLE 71 FRANCE Invisible orthodontics Market, By Product & Services, 2019-2028 (USD Million)
TABLE 72 FRANCE Invisible orthodontics Market, By Product, 2019-2028 (USD million)
TABLE 73 France Invisible Orthodontics Market, By Product 2019-2028 (units)
TABLE 74 FRANCE Invisible orthodontics Market, By age groups, 2019-2028 (USD Million)
TABLE 75 fRANCE adults in Invisible orthodontics Market, By Age Groups, 2019-2028 (USD million)
TABLE 76 FRANCE teenagers in Invisible orthodontics Market, By Age Groups, 2019-2028 (USD million)
TABLE 77 FRANCE children in Invisible orthodontics Market, By Age Groups, 2019-2028 (USD million)
TABLE 78 FRANCE Invisible orthodontics Market, By application, 2019-2028 (USD Million)
TABLE 79 FRANCE maloccusion in Invisible Orthodontics Market, By Application 2019-2028 (USD Million)
TABLE 80 FRANCE Crowding in Invisible Orthodontics Market, By Application 2019-2028 (USD Million)
TABLE 81 FRANCE Excessive spacing in Invisible Orthodontics Market, By Application 2019-2028 (USD Million)
TABLE 82 FRANCE Invisible orthodontics Market, By end user, 2019-2028 (USD Million)
TABLE 83 FRANCE Invisible orthodontics Market, By distribtion channel, 2019-2028 (USD Million)
TABLE 84 ITALY Invisible orthodontics Market, By Product & Services, 2019-2028 (USD Million)
TABLE 85 ITALY Invisible orthodontics Market, By Product, 2019-2028 (USD million)
TABLE 86 Italy Invisible Orthodontics Market, By Product 2019-2028 (units)
TABLE 87 ITALY Invisible orthodontics Market, By age groups, 2019-2028 (USD Million)
TABLE 88 ITALY adults in Invisible orthodontics Market, By Age Groups, 2019-2028 (USD million)
TABLE 89 ITALY teenagers in Invisible orthodontics Market, By Age Groups, 2019-2028 (USD million)
TABLE 90 ITALY children in Invisible orthodontics Market, By Age Groups, 2019-2028 (USD million)
TABLE 91 ITALY Invisible orthodontics Market, By application, 2019-2028 (USD Million)
TABLE 92 ITALY maloccusion in Invisible Orthodontics Market, By Application 2019-2028 (USD Million)
TABLE 93 ITALY Crowding in Invisible Orthodontics Market, By Application 2019-2028 (USD Million)
TABLE 94 ITALY Excessive spacing in Invisible Orthodontics Market, By Application 2019-2028 (USD Million)
TABLE 95 ITALY Invisible orthodontics Market, By end user, 2019-2028 (USD Million)
TABLE 96 ITALY Invisible orthodontics Market, By distribtion channel, 2019-2028 (USD Million)
TABLE 97 SPAIN Invisible orthodontics Market, By Product & Services, 2019-2028 (USD Million)
TABLE 98 SPAIN Invisible orthodontics Market, By Product, 2019-2028 (USD million)
TABLE 99 Spain Invisible Orthodontics Market, By Product 2019-2028 (UNITS)
TABLE 100 SPAIN Invisible orthodontics Market, By age groups, 2019-2028 (USD Million)
TABLE 101 SPAIN adults in Invisible orthodontics Market, By Age Groups, 2019-2028 (USD million)
TABLE 102 SPAIN teenagers in Invisible orthodontics Market, By Age Groups, 2019-2028 (USD million)
TABLE 103 SPAIN children in Invisible orthodontics Market, By Age Groups, 2019-2028 (USD million)
TABLE 104 SPAIN Invisible orthodontics Market, By application, 2019-2028 (USD Million)
TABLE 105 SPAIN maloccusion in Invisible Orthodontics Market, By Application 2019-2028 (USD Million)
TABLE 106 SPAIN Crowding in Invisible Orthodontics Market, By Application 2019-2028 (USD Million)
TABLE 107 SPAIN Excessive spacing in Invisible Orthodontics Market, By Application 2019-2028 (USD Million)
TABLE 108 SPAIN Invisible orthodontics Market, By end user, 2019-2028 (USD Million)
TABLE 109 SPAIN Invisible orthodontics Market, By distribtion channel, 2019-2028 (USD Million)
TABLE 110 RUSSIA Invisible orthodontics Market, By Product & Services, 2019-2028 (USD Million)
TABLE 111 RUSSIA Invisible orthodontics Market, By Product, 2019-2028 (USD million)
TABLE 112 Russia Invisible Orthodontics Market, By Product 2019-2028 (UNITS)
TABLE 113 RUSSIA Invisible orthodontics Market, By age groups, 2019-2028 (USD Million)
TABLE 114 RUSSIA adults in Invisible orthodontics Market, By Age Groups, 2019-2028 (USD million)
TABLE 115 RUSSIA teenagers in Invisible orthodontics Market, By Age Groups, 2019-2028 (USD million)
TABLE 116 RUSSIA children in Invisible orthodontics Market, By Age Groups, 2019-2028 (USD million)
TABLE 117 RUSSIA Invisible orthodontics Market, By application, 2019-2028 (USD Million)
TABLE 118 RUSSIA maloccusion in Invisible Orthodontics Market, By Application 2019-2028 (USD Million)
TABLE 119 RUSSIA Crowding in Invisible Orthodontics Market, By Application 2019-2028 (USD Million)
TABLE 120 RUSSIA Excessive spacing in Invisible Orthodontics Market, By Application 2019-2028 (USD Million)
TABLE 121 RUSSIA Invisible orthodontics Market, By end user, 2019-2028 (USD Million)
TABLE 122 RUSSIA Invisible orthodontics Market, By distribtion channel, 2019-2028 (USD Million)
TABLE 123 SWITZERLAND Invisible orthodontics Market, By Product & Services, 2019-2028 (USD Million)
TABLE 124 SWITZERLAND Invisible orthodontics Market, By Product, 2019-2028 (USD million)
TABLE 125 Switzerland Invisible Orthodontics Market, By Product 2019-2028 (units)
TABLE 126 SWITZERLAND Invisible orthodontics Market, By age groups, 2019-2028 (USD Million)
TABLE 127 SWITZERLAND adults in Invisible orthodontics Market, By Age Groups, 2019-2028 (USD million)
TABLE 128 SWITZERLAND teenagers in Invisible orthodontics Market, By Age Groups, 2019-2028 (USD million)
TABLE 129 SWITZERLAND children in Invisible orthodontics Market, By Age Groups, 2019-2028 (USD million)
TABLE 130 SWITZERLAND Invisible orthodontics Market, By application, 2019-2028 (USD Million)
TABLE 131 SWITZERLAND maloccusion in Invisible Orthodontics Market, By Application 2019-2028 (USD Million)
TABLE 132 SWITZERLAND Crowding in Invisible Orthodontics Market, By Application 2019-2028 (USD Million)
TABLE 133 SWITZERLAND Excessive spacing in Invisible Orthodontics Market, By Application 2019-2028 (USD Million)
TABLE 134 SWITZERLAND Invisible orthodontics Market, By end user, 2019-2028 (USD Million)
TABLE 135 SWITZERLAND Invisible orthodontics Market, By distribtion channel, 2019-2028 (USD Million)
TABLE 136 NETHERLANDS Invisible orthodontics Market, By Product & Services, 2019-2028 (USD Million)
TABLE 137 NETHERLANDS Invisible orthodontics Market, By Product, 2019-2028 (USD million)
TABLE 138 Netherlands Invisible Orthodontics Market, By Product 2019-2028 (units)
TABLE 139 NETHERLANDS Invisible orthodontics Market, By age groups, 2019-2028 (USD Million)
TABLE 140 NETHERLANDS adults in Invisible orthodontics Market, By Age Groups, 2019-2028 (USD million)
TABLE 141 NETHERLANDS teenagers in Invisible orthodontics Market, By Age Groups, 2019-2028 (USD million)
TABLE 142 NETHERLANDS children in Invisible orthodontics Market, By Age Groups, 2019-2028 (USD million)
TABLE 143 NETHERLANDS Invisible orthodontics Market, By application, 2019-2028 (USD Million)
TABLE 144 NETHERLANDS maloccusion in Invisible Orthodontics Market, By Application 2019-2028 (USD Million)
TABLE 145 NETHERLANDS Crowding in Invisible Orthodontics Market, By Application 2019-2028 (USD Million)
TABLE 146 NETHERLANDS Excessive spacing in Invisible Orthodontics Market, By Application 2019-2028 (USD Million)
TABLE 147 NETHERLANDS Invisible orthodontics Market, By end user, 2019-2028 (USD Million)
TABLE 148 NETHERLANDS Invisible orthodontics Market, By distribtion channel, 2019-2028 (USD Million)
TABLE 149 BELGIUM Invisible orthodontics Market, By Product & Services, 2019-2028 (USD Million)
TABLE 150 BELGIUM Invisible orthodontics Market, By Product, 2019-2028 (USD million)
TABLE 151 Belgium Invisible Orthodontics Market, By Product 2019-2028 (units)
TABLE 152 BELGIUM Invisible orthodontics Market, By age groups, 2019-2028 (USD Million)
TABLE 153 BELGIUM adults in Invisible orthodontics Market, By Age Groups, 2019-2028 (USD million)
TABLE 154 BELGIUM teenagers in Invisible orthodontics Market, By Age Groups, 2019-2028 (USD million)
TABLE 155 BELGIUM children in Invisible orthodontics Market, By Age Groups, 2019-2028 (USD million)
TABLE 156 BELGIUM Invisible orthodontics Market, By application, 2019-2028 (USD Million)
TABLE 157 BELGIUM maloccusion in Invisible Orthodontics Market, By Application 2019-2028 (USD Million)
TABLE 158 BELGIUM Crowding in Invisible Orthodontics Market, By Application 2019-2028 (USD Million)
TABLE 159 BELGIUM Excessive spacing in Invisible Orthodontics Market, By Application 2019-2028 (USD Million)
TABLE 160 BELGIUM Invisible orthodontics Market, By end user, 2019-2028 (USD Million)
TABLE 161 BELGIUM Invisible orthodontics Market, By distribtion channel, 2019-2028 (USD Million)
TABLE 162 TURKEY Invisible orthodontics Market, By Product & Services, 2019-2028 (USD Million)
TABLE 163 TURKEY Invisible orthodontics Market, By Product, 2019-2028 (USD million)
TABLE 164 Turkey Invisible Orthodontics Market, By Product 2019-2028 (Units)
TABLE 165 TURKEY Invisible orthodontics Market, By age groups, 2019-2028 (USD Million)
TABLE 166 TURKEY adults in Invisible orthodontics Market, By Age Groups, 2019-2028 (USD million)
TABLE 167 TURKEY teenagers in Invisible orthodontics Market, By Age Groups, 2019-2028 (USD million)
TABLE 168 TURKEY children in Invisible orthodontics Market, By Age Groups, 2019-2028 (USD million)
TABLE 169 TURKEY Invisible orthodontics Market, By application, 2019-2028 (USD Million)
TABLE 170 TURKEY maloccusion in Invisible Orthodontics Market, By Application 2019-2028 (USD Million)
TABLE 171 TURKEY Crowding in Invisible Orthodontics Market, By Application 2019-2028 (USD Million)
TABLE 172 TURKEY Excessive spacing in Invisible Orthodontics Market, By Application 2019-2028 (USD Million)
TABLE 173 TURKEY Invisible orthodontics Market, By end user, 2019-2028 (USD Million)
TABLE 174 TURKEY Invisible orthodontics Market, By distribtion channel, 2019-2028 (USD Million)
TABLE 175 Rest of Europe Invisible orthodontics Market, By Product & Services, 2019-2028 (USD Million)
Lista de figuras
FIGURE 1 EUROPE INVISIBLE ORTHODONTICS MARKET: segmentation
FIGURE 2 EUROPE INVISIBLE ORTHODONTICS MARKET: data triangulation
FIGURE 3 EUROPE INVISIBLE ORTHODONTICS MARKET: DROC ANALYSIS
FIGURE 4 EUROPE INVISIBLE ORTHODONTICS MARKET: EUROPE vs REGIONAL MARKET ANALYSIS
FIGURE 5 EUROPE INVISIBLE ORTHODONTICS MARKET: COMPANY RESEARCH ANALYSIS
FIGURE 6 EUROPE INVISIBLE ORTHODONTICS MARKET: INTERVIEW DEMOGRAPHICS
FIGURE 7 EUROPE INVISIBLE ORTHODONTICS MARKET: DBMR MARKET POSITION GRID
FIGURE 8 Europe INVISIBLE ORTHODONTICS Market: vendor share analysis
FIGURE 9 EUROPE INVISIBLE ORTHODONTICS MARKET: MARKET application COVERAGE GRID
FIGURE 10 EUROPE INVISIBLE ORTHODONTICS MARKET: SEGMENTATION
FIGURE 11 growing adult orthodontics is expected to drive the EUROPE INVISIBLE ORTHODONTICS MARKET in the forecast period of 2021 to 2028
FIGURE 12 productS and services segment is expected to account for the largest share of the EUROPE INVISIBLE ORTHODONTICS MARKET in 2021 & 2028
FIGURE 13 DRIVERS, RESTRAINTS, OPPORTUNITIES AND CHALLENGEs OF the Europe invisible orthodontics market
FIGURE 14 Government healthcare expenditure by share of healthcare providers in the U.K. in 2018
FIGURE 15 Europe invisible orthodontics market: By application, 2020
FIGURE 16 Europe invisible orthodontics market: By application, 2020-2028 (USD Million)
FIGURE 17 Europe invisible orthodontics market: By application, CAGR (2020-2028)
FIGURE 18 Europe invisible orthodontics market: By application, LIFELINE CURVE
FIGURE 19 Europe invisible orthodontics market: By age groups, 2020
FIGURE 20 Europe invisible orthodontics market: By age groups, 2020-2028 (USD Million)
FIGURE 21 Europe invisible orthodontics market: By age groups, CAGR (2020-2028)
FIGURE 22 Europe invisible orthodontics market: By age groups, LIFELINE CURVE
FIGURE 23 Europe invisible orthodontics market: By distribution channel, 2020
FIGURE 24 Europe invisible orthodontics market: By distribution channel, 2020-2028 (USD Million)
FIGURE 25 Europe invisible orthodontics market: By distribution channel, CAGR (2020-2028)
FIGURE 26 Europe invisible orthodontics market: By distribution channel, LIFELINE CURVE
FIGURE 27 Europe invisible orthodontics market: By product and services, 2020
FIGURE 28 Europe invisible orthodontics market: By product and services, 2020-2028 (USD Million)
FIGURE 29 Europe invisible orthodontics market: By product and services, CAGR (2020-2028)
FIGURE 30 Europe invisible orthodontics market: By product and services, LIFELINE CURVE
FIGURE 31 Europe invisible orthodontics market: By end user, 2020
FIGURE 32 Europe invisible orthodontics market: By end user, 2020-2028 (USD Million)
FIGURE 33 Europe invisible orthodontics market: By end user, CAGR (2020-2028)
FIGURE 34 Europe invisible orthodontics market: By end user, LIFELINE CURVE
FIGURE 35 Europe invisible orthodontics MARKET: SNAPSHOT (2020)
FIGURE 36 Europe invisible orthodontics MARKET: BY COUNTRY (2020)
FIGURE 37 Europe invisible orthodontics MARKET: BY COUNTRY (2020 & 2028)
FIGURE 38 Europe invisible orthodontics MARKET: BY COUNTRY (2020 & 2028)
FIGURE 39 Europe invisible orthodontics MARKET: BY type (2020-2028)
FIGURE 40 Europe INVISIBLE ORTHODONTICS MARKET: SNAPSHOT (2020)
FIGURE 41 Europe INVISIBLE ORTHODONTICS MARKET: BY COUNTRY (2020)
FIGURE 42 Europe INVISIBLE ORTHODONTICS MARKET: BY COUNTRY (2021 & 2028)
FIGURE 43 Europe INVISIBLE ORTHODONTICS MARKET: BY COUNTRY (2020 & 2028)
FIGURE 44 Europe INVISIBLE ORTHODONTICS MARKET: BY type (2021-2028)
FIGURE 45 Europe Invisible Orthodontics Market: company share 2020 (%)
Metodología de investigación
La recopilación de datos y el análisis del año base se realizan utilizando módulos de recopilación de datos con muestras de gran tamaño. La etapa incluye la obtención de información de mercado o datos relacionados a través de varias fuentes y estrategias. Incluye el examen y la planificación de todos los datos adquiridos del pasado con antelación. Asimismo, abarca el examen de las inconsistencias de información observadas en diferentes fuentes de información. Los datos de mercado se analizan y estiman utilizando modelos estadísticos y coherentes de mercado. Además, el análisis de la participación de mercado y el análisis de tendencias clave son los principales factores de éxito en el informe de mercado. Para obtener más información, solicite una llamada de un analista o envíe su consulta.
La metodología de investigación clave utilizada por el equipo de investigación de DBMR es la triangulación de datos, que implica la extracción de datos, el análisis del impacto de las variables de datos en el mercado y la validación primaria (experto en la industria). Los modelos de datos incluyen cuadrícula de posicionamiento de proveedores, análisis de línea de tiempo de mercado, descripción general y guía del mercado, cuadrícula de posicionamiento de la empresa, análisis de patentes, análisis de precios, análisis de participación de mercado de la empresa, estándares de medición, análisis global versus regional y de participación de proveedores. Para obtener más información sobre la metodología de investigación, envíe una consulta para hablar con nuestros expertos de la industria.
Personalización disponible
Data Bridge Market Research es líder en investigación formativa avanzada. Nos enorgullecemos de brindar servicios a nuestros clientes existentes y nuevos con datos y análisis que coinciden y se adaptan a sus objetivos. El informe se puede personalizar para incluir análisis de tendencias de precios de marcas objetivo, comprensión del mercado de países adicionales (solicite la lista de países), datos de resultados de ensayos clínicos, revisión de literatura, análisis de mercado renovado y base de productos. El análisis de mercado de competidores objetivo se puede analizar desde análisis basados en tecnología hasta estrategias de cartera de mercado. Podemos agregar tantos competidores sobre los que necesite datos en el formato y estilo de datos que esté buscando. Nuestro equipo de analistas también puede proporcionarle datos en archivos de Excel sin procesar, tablas dinámicas (libro de datos) o puede ayudarlo a crear presentaciones a partir de los conjuntos de datos disponibles en el informe.

