Image

Mercado europeo de sabores y edulcorantes para piensos: tendencias de la industria y pronóstico hasta 2027

Bebida alimenticia

Image

Mercado europeo de sabores y edulcorantes para piensos: tendencias de la industria y pronóstico hasta 2027

  • Bebida alimenticia
  • Informe publicado
  • junio de 2020
  • Europa
  • 350 páginas
  • Número de mesas: 226
  • Número de figuras: 27

Mercado europeo de edulcorantes y sabores para piensos, por tipo (sabores para piensos, edulcorantes para piensos), naturaleza (convencional, orgánico), forma (seca, líquida), ganado (rumiantes, cerdos, aves de corral, mascotas, equinos, acuicultura, otros), país ( Alemania, Reino Unido, Francia, España, Italia, Dinamarca, Países Bajos, Suiza, Polonia, Rusia, Suecia, Bélgica, Turquía y resto de Europa) Tendencias de la industria y pronóstico para 2027

Europe Feed Flavors and Sweeteners MarketAnálisis e información del mercado: mercado europeo de sabores y edulcorantes para piensos.

Se espera que el mercado de sabores y edulcorantes para piensos gane crecimiento en el período previsto de 2020 a 2027. Data Bridge Market Research analiza que el mercado está creciendo con una tasa compuesta anual del 4,8% en el período previsto de 2020 a 2027 y se espera que alcance los 498,09 dólares estadounidenses. millones para 2027. Mayor participación de programas orientados a la investigación para desarrollar piensos modificados para la nutrición animal y participación de los organismos reguladores para establecer directrices para buenas prácticas de cría.

La apuesta de los fabricantes por utilizar diversas plataformas digitales para el desarrollo de productos modificados para la acuicultura ha proporcionado un nuevo alcance a la plataforma de nutrición animal.

Por ejemplo,

  • En febrero de 2020, Alltech amplió su capacidad de investigación con la apertura del laboratorio AlltechIFM en la Universidad Harper Adams (Europa). El laboratorio estará equipado con la tecnología IFM que se utiliza en la evaluación de la digestibilidad del alimento con los animales. La introducción de las nuevas instalaciones en Europa ha dejado su huella para analizar los beneficios para el cliente con su apoyo en el mercado.

Este informe de mercado de Sabores y edulcorantes para piensos proporciona detalles de la participación de mercado, los nuevos desarrollos y el análisis de la cartera de productos, el impacto de los actores del mercado nacional y localizado, analiza las oportunidades en términos de bolsillos de ingresos emergentes, cambios en las regulaciones del mercado, aprobaciones de productos, decisiones estratégicas, producto. lanzamientos, expansiones geográficas e innovaciones tecnológicas en el mercado. Para comprender el análisis y el escenario del mercado contáctenos para una Resumen del analista, nuestro equipo lo ayudará a crear una solución de impacto en los ingresos para lograr el objetivo deseado.

Europe Feed Flavors and Sweeteners MarketÁmbito de mercado y tamaño del mercado de Sabores y edulcorantes para piensos en Europa

Mercado de sabores y edulcorantes alimentarios por tipo, naturaleza, forma y ganado. El crecimiento entre segmentos le ayuda a analizar nichos de crecimiento y estrategias para acercarse al mercado y determinar sus áreas de aplicación principales y la diferencia en sus mercados objetivo.

  • Según el tipo, el mercado europeo de edulcorantes y sabores para piensos se segmenta en sabores y edulcorantes para piensos. En 2020, el segmento de sabores de piensos está dominando el mercado debido a la creciente demanda de aditivos de petabilidad debido a su sabor, aroma y nutrientes esenciales equilibrados en el pienso, independientemente de que el ganado rechace los piensos de petabilidad debido al amargor del sabor. el crecimiento de los agentes aromatizantes en los aditivos alimentarios.
  • Sobre la base de la naturaleza, el mercado europeo de edulcorantes y sabores para piensos está segmentado en convencional y orgánico. En 2020, el segmento convencional comprende la mayor participación de mercado, ya que la mayoría de la cría de animales es de criadores y el alto costo de producción de ganado no transgénico ha impulsado el consumo de saborizantes y edulcorantes de base convencional. Sin embargo, el segmento orgánico está creciendo con la CAGR más alta debido a la creciente conciencia sobre el consumo de productos cárnicos con etiquetas limpias.
  • Según la forma, el mercado europeo de edulcorantes y sabores para piensos se segmenta en secos y líquidos. En 2020, el segmento de forma seca domina el mercado y está creciendo con la CAGR más alta, ya que la mayoría de los sabores dulces y edulcorantes que fabrica el proveedor se encuentran en forma seca, incluidos agregados y polvo, debido a su consistencia y facilidad de manipulación.
  • Con base en la ganadería, el mercado se segmenta en rumiantes, aves, porcinos, acuicultura, mascotas, equinos y otros. El segmento de rumiantes se subdivide en terneros, ganado lechero, ganado vacuno y otros. El segmento avícola domina el mercado ya que las calderas se producen y consumen principalmente en todo el mundo y debido a su mayor preferencia por diferentes productos alimenticios.

Sabores y edulcorantes para piensos Mercado Análisis a nivel de país

Se analiza el mercado de sabores y edulcorantes y se proporciona información sobre el tamaño del mercado por tipo, naturaleza, forma, ganado y países mencionados anteriormente.

Los países cubiertos en el informe de mercado de Sabores y edulcorantes para piensos son Alemania, Reino Unido, Francia, España, Italia, Dinamarca, Países Bajos, Suiza, Polonia, Rusia, Suecia, Bélgica, Turquía y el resto de Europa.

El mercado de edulcorantes y sabores para piensos domina debido al avance de la tecnología nutricional animal y al desarrollo de plataformas digitales por parte de los fabricantes para guiar a las granjas locales para el desarrollo de los avicultores que han impulsado la industria general de piensos para animales.

El mercado europeo de aromas y edulcorantes para piensos
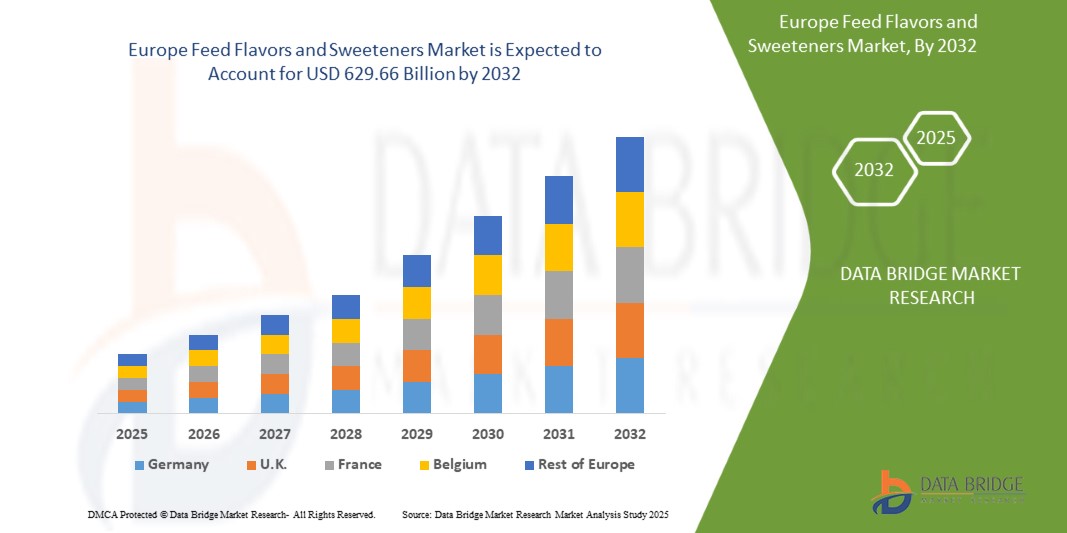
, debido a la mayor producción de animales vivos, ha aumentado la necesidad de piensos para su producción y ayuda en su gestión. España domina el mercado europeo, ya que la producción total de ganado vacuno y búfalos vivos en España fue de aproximadamente 6.465.747 miles en 2017, que aumentó en 2018 a aproximadamente 6.510.592 miles.

La sección de países del informe de mercado de sabores y edulcorantes para piensos también proporciona factores que impactan el mercado individual y cambios en la regulación en el mercado a nivel nacional que impactan las tendencias actuales y futuras del mercado. Datos como ventas nuevas, ventas de reemplazo, demografía de los países, leyes regulatorias y aranceles de importación y exportación son algunos de los principales indicadores utilizados para pronosticar el escenario del mercado para cada país. Además, se consideran la presencia y disponibilidad de las marcas y los desafíos que enfrentan debido a la competencia grande o escasa de las marcas locales y nacionales, y el impacto de los canales de ventas, al tiempo que se proporciona un análisis de pronóstico de los datos del país.

Establecimiento de Directrices para Buenas Prácticas de Manejo

El mercado de sabores y edulcorantes para piensos también le proporciona un análisis de mercado detallado para el crecimiento de cada país en la industria de detección de patógenos con ventas de detección de patógenos, ventas de componentes, impacto del desarrollo tecnológico en sabores y edulcorantes para piensos y cambios en los escenarios regulatorios con su apoyo a los sabores y edulcorantes para piensos. mercado de edulcorantes. Los datos están disponibles para el período histórico 2010 a 2018.

Panorama competitivo y cuota de mercado Análisis Sabores y edulcorantes para piensos

El panorama competitivo del mercado de sabores y edulcorantes para piensos proporciona detalles por competidor. Los detalles incluidos son descripción general de la empresa, finanzas de la empresa, ingresos generados, potencial de mercado, inversión en investigación y desarrollo, nuevas iniciativas de mercado, presencia en Europa, sitios e instalaciones de producción, fortalezas y debilidades de la empresa, lanzamiento de productos, proyectos de prueba de productos, nuevos edulcorantes, aprobaciones de productos. , patentes, informes de mejoras en el sabor de los productos, dominio de las aplicaciones, curva de línea de vida tecnológica. Los puntos de datos anteriores proporcionados sólo están relacionados con el enfoque de las empresas en el mercado de sabores y edulcorantes.

Los principales actores cubiertos en el informe son Prinova Group LLC., Kemin Industries, Inc., Pancosma, Norel Animal Nutrition, Layn Corp., Dupont, Lucta, Pet Flavors Inc., Phytobiotics Futterzusatzstoffe GmbH, Alltech, INROADS INTERNATIONAL, Palital Feed Additives. BV, Jefo, Adisseo, HYET sweet y Barentz, entre otras. Los analistas de DBMR comprenden las fortalezas competitivas y brindan análisis competitivos para cada competidor por separado.

Por ejemplo,

  • En marzo de 2019, Phytobiotics Futterzusatzstoffe GmbH lanzó su nueva línea de productos de sabores y edulcorantes conocida como Miraco en VIV Europe. Esto ampliará su cartera de productos al satisfacer las diversas necesidades y requisitos de los clientes en el mercado.
  • En septiembre de 2015, HYET Sweet adquirió Ajinomoto Sweeteners Europe SAS (ASE). Esto ha ayudado a la empresa a ampliar aún más su negocio y reforzar su presencia en el norte de Francia.


SKU-

LISTA DE TABLAS

TABLA 1 PRECIO DEL AZÚCAR CRUDO DEL 2015 AL 2019

TABLA 2 MERCADO EUROPEO DE SABORES Y EDULCORANTES PARA PIENSOS, POR TIPO, 2018-2027 (MILLONES DE USD)

TABLA 3 SABORES EUROPEFEED EN EL MERCADO DE SABORES Y EDULCORANTES PARA PIENSOS, POR REGIÓN, 2018-2027 (MILLONES DE USD)

TABLA 4 SABORES DE PIENSOS EN EUROPA EN EL MERCADO DE SABORES DE PIENSOS Y EDULCORANTES, POR TIPO, 2018-2027 (MILLONES DE USD)

TABLA 5 MERCADO DE FRUTALES EN PIENSOS Y EDULCORANTES EN EUROPA, POR TIPO, 2018-2027 (MILLONES DE USD)

TABLA 6 MERCADO EUROPEO DE SABOR EN SABORES Y EDULCORANTES PARA PIENSOS, POR TIPO, 2018-2027 (MILLONES DE USD)

TABLA 7 MERCADO EUROPEO DE NUECES EN SABORES Y EDULCORANTES PARA PIENSOS, POR TIPO, 2018-2027 (MILLONES DE USD)

TABLA 8 EDULCORANTES EUROPEFEED EN SABORES DE PIENSOS Y MERCADO DE EDULCORANTES, POR REGIÓN, 2018-2027 (MILLONES DE USD)

TABLA 9 MERCADO DE EDULCORANTES Y SABORES PARA PIENSOS EUROPEFEED, POR TIPO, 2018-2027 (MILLONES DE USD)

TABLA 10 MERCADO DE EUROPESACARINA EN SABORES Y EDULCORANTES PARA PIENSOS, POR TIPO, 2018-2027 (MILLONES DE USD)

TABLA 11 MERCADO EUROPEO DE SABORES Y EDULCORANTES PARA PIENSOS POR NATURALEZA, 2018-2027 (MILLONES DE USD)

TABLA 12 MERCADO CONVENCIONAL EUROPEO EN SABORES Y EDULCORANTES PARA PIENSOS, POR REGIÓN, 2018-2027 (MILLONES DE USD)

TABLA 13 MERCADO EUROPEO ORGÁNICO EN SABORES Y EDULCORANTES PARA PIENSOS, POR REGIÓN, 2018-2027 (MILLONES DE USD)

TABLA 14 MERCADO EUROPEO DE SABORES Y EDULCORANTES PARA PIENSOS POR FORMA, 2018-2027 (MILLONES DE USD)

TABLA 15 MERCADO DE SABORES Y EDULCORANTES PARA PIENSOS SECO EN EUROPA, POR REGIÓN, 2018-2027 (MILLONES DE USD)

TABLA 16 MERCADO DE LÍQUIDOS EN PIENSOS Y EDULCORANTES EN EUROPA, POR REGIÓN, 2018-2027 (MILLONES DE USD)

CUADRO 17 MERCADO EUROPEO DE SABORES DE PIENSOS Y EDULCORANTES POR GANADO, 2018-2027 (MILLONES DE USD)

CUADRO 18 MERCADO DE AVES DE CORRAL DE EUROPA EN SABORES Y EDULCORANTES PARA PIENSOS, POR REGIÓN, 2018-2027 (MILLONES DE USD)

TABLA 19 MERCADO EUROPEO DE AVES DE CORRAL EN SABORES Y EDULCORANTES PARA PIENSOS, POR TIPO, 2018-2027 (MILLONES DE USD)

CUADRO 20 MERCADO DEL VINO EN EUROPA EN SABORES Y EDULCORANTES PARA PIENSOS, POR REGIÓN, 2018-2027 (MILLONES DE USD)

CUADRO 21 MERCADO EUROPEO DEL VINO EN SABORES Y EDULCORANTES PARA PIENSOS, POR TIPO, 2018-2027 (MILLONES DE USD)

CUADRO 22 MERCADO EUROPERUMINANTES EN SABORES Y EDULCORANTES PARA PIENSOS, POR REGIÓN, 2018-2027 (MILLONES DE USD)

CUADRO 23 MERCADO DE EUROPERUMINANTES EN SABORES Y EDULCORANTES PARA PIENSOS, POR TIPO, 2018-2027 (MILLONES DE USD)

TABLA 24 EUROPETAS EN EL MERCADO DE SABORES Y EDULCORANTES PARA PIENSOS, POR REGIÓN, 2018-2027 (MILLONES DE USD)

TABLA 25 MERCADO DE EUROPETAS EN SABORES Y EDULCORANTES PARA PIENSOS, POR TIPO, 2018-2027 (MILLONES DE USD)

TABLA 26 MERCADO DE SABORES Y EDULCORANTES PARA PIENSOS EQUINOS EN EUROPA, POR REGIÓN, 2018-2027 (MILLONES DE USD)

CUADRO 27 MERCADO EUROPEO DE ACUICULTURA EN SABORES Y EDULCORANTES PARA PIENSOS, POR REGIÓN, 2018-2027 (MILLONES DE USD)

CUADRO 28 MERCADO DE OTROS EN EUROPA DE SABORES Y EDULCORANTES PARA PIENSOS, POR REGIÓN, 2018-2027 (MILLONES DE USD)

CUADRO 29 MERCADO DE AROMAS Y EDULCORANTES PARA PIENSOS EN EUROPA, POR PAÍS, 2018-2027 (MILLONES DE USD)

CUADRO 30 MERCADO DE SABORES Y EDULCORANTES DE EUROPEFEED, POR TIPO, 2018-2027 (MILLONES DE USD)

TABLA 31 SABORES EUROPEFEED EN EL MERCADO DE SABORES Y EDULCORANTES PARA PIENSOS, POR TIPO, 2018-2027 (MILLONES DE USD)

CUADRO 32 MERCADO DE FRUTALES EN PIENSOS Y EDULCORANTES EN EUROPA, POR TIPO, 2018-2027 (MILLONES DE USD)

TABLA 33 MERCADO EUROPEO DE SABOR EN SABORES Y EDULCORANTES PARA PIENSOS, POR TIPO, 2018-2027 (MILLONES DE USD)

TABLA 34 MERCADO EUROPEO DE NUECES EN SABORES Y EDULCORANTES PARA PIENSOS, POR TIPO, 2018-2027 (MILLONES DE USD)

TABLA 35 MERCADO DE EDULCORANTES PARA PIENSOS EN EUROPA, SABORES Y EDULCORANTES PARA PIENSOS, POR TIPO, 2018-2027 (MILLONES DE USD)

CUADRO 36 MERCADO EUROPEO DE SACARINA EN SABORES Y EDULCORANTES PARA PIENSOS, POR TIPO, 2018-2027 (MILLONES DE USD)

CUADRO 37 MERCADO EUROPEO DE SABORES Y EDULCORANTES PARA PIENSOS, POR NATURALEZA, 2018-2027 (MILLONES DE USD)

CUADRO 38 MERCADO EUROPEO DE SABORES Y EDULCORANTES PARA PIENSOS, POR FORMA, 2018-2027 (MILLONES DE USD)

CUADRO 39 MERCADO DE AROMAS Y EDULCORANTES PARA PIENSOS EN EUROPA, POR GANADO, 2018-2027 (MILLONES DE USD)

CUADRO 40 MERCADO DE RUMIANTES EN EUROPA EN SABORES Y EDULCORANTES PARA PIENSOS, POR TIPO, 2018-2027 (MILLONES DE USD)

TABLA 41 MERCADO PORCINO EN EUROPA EN SABORES Y EDULCORANTES PARA ALIMENTOS, POR TIPO, 2018-2027 (MILLONES DE USD)

CUADRO 42 MERCADO DE AVES DE CORRAL EN EUROPA EN SABORES Y EDULCORANTES PARA PIENSOS, POR TIPO, 2018-2027 (MILLONES DE USD)

TABLA 43 MERCADO DE EUROPETAS EN SABORES Y EDULCORANTES PARA PIENSOS, POR TIPO, 2018-2027 (MILLONES DE USD)

CUADRO 44 MERCADO DE SABORES Y EDULCORANTES DE PIENSOS EN ESPAÑA, POR TIPO, 2018-2027 (MILLONES DE USD)

TABLA 45 SABORES DE PIENSOS EN EL MERCADO DE SABORES Y EDULCORANTES PARA PIENSOS, POR TIPO, 2018-2027 (MILLONES DE USD)

CUADRO 46 MERCADO DE AFRUTADOS EN PIENSOS Y EDULCORANTES DE ESPAÑA, POR TIPO, 2018-2027 (MILLONES DE USD)

TABLA 47 MERCADO DE ESPAÑA DE SABOR EN SABORES Y EDULCORANTES PARA PIENSOS, POR TIPO, 2018-2027 (MILLONES DE USD)

TABLA 48 MERCADO DE NUECES DE ESPAÑA EN SABORES Y EDULCORANTES PARA PIENSOS, POR TIPO, 2018-2027 (MILLONES DE USD)

TABLA 49 ESPAÑA EDULCORANTES PARA PIENSOS EN EL MERCADO DE SABORES Y EDULCORANTES PARA PIENSOS, POR TIPO, 2018-2027 (MILLONES DE USD)

TABLA 50 MERCADO DE SACARINA EN PIENSOS Y EDULCORANTES EN ESPAÑA, POR TIPO, 2018-2027 (MILLONES DE USD)

TABLA 51 MERCADO DE ESPAÑA DE SABORES Y EDULCORANTES PARA PIENSOS, POR NATURALEZA, 2018-2027 (MILLONES DE USD)

CUADRO 52 MERCADO DE ESPAÑA DE AROMAS Y EDULCORANTES PARA PIENSOS, POR FORMA, 2018-2027 (MILLONES DE USD)

CUADRO 53 MERCADO DE ESPAÑA DE AROMAS Y EDULCORANTES PARA PIENSOS, POR GANADO, 2018-2027 (MILLONES DE USD)

CUADRO 54 MERCADO DE RUMIANTES EN ESPAÑA EN SABORES Y EDULCORANTES PARA PIENSOS, POR TIPO, 2018-2027 (MILLONES DE USD)

TABLA 55 MERCADO PORCINO DE ESPAÑA EN SABORES Y EDULCORANTES PARA PIENSOS, POR TIPO, 2018-2027 (MILLONES DE USD)

CUADRO 56 MERCADO DE AVES DE CORRAL EN ESPAÑA EN SABORES Y EDULCORANTES PARA PIENSOS, POR TIPO, 2018-2027 (MILLONES DE USD)

TABLA 57 SPAINPETS EN EL MERCADO DE SABORES Y EDULCORANTES PARA PIENSOS, POR TIPO, 2018-2027 (MILLONES DE USD)

CUADRO 58 MERCADO DE SABORES Y EDULCORANTES PARA PIENSOS EN ALEMANIA, POR TIPO, 2018-2027 (MILLONES DE USD)

CUADRO 59 ALEMANIA SABORES DE PIENSOS EN EL MERCADO DE SABORES Y EDULCORANTES PARA PIENSOS, POR TIPO, 2018-2027 (MILLONES DE USD)

CUADRO 60 MERCADO DE FRUTALES EN ALEMANIA PARA SABORES Y EDULCORANTES PARA PIENSOS, POR TIPO, 2018-2027 (MILLONES DE USD)

TABLA 61 MERCADO DE AJARDINAS EN ALEMANIA EN SABORES Y EDULCORANTES PARA PIENSOS, POR TIPO, 2018-2027 (MILLONES DE USD)

TABLA 62 MERCADO DE NUECES DE ALEMANIA EN SABORES Y EDULCORANTES PARA PIENSOS, POR TIPO, 2018-2027 (MILLONES DE USD)

TABLA 63 MERCADO DE EDULCORANTES PARA PIENSOS EN ALEMANIA, SABORES Y EDULCORANTES PARA PIENSOS, POR TIPO, 2018-2027 (MILLONES DE USD)

TABLA 64 MERCADO DE SACARINA EN PIENSOS Y EDULCORANTES DE ALEMANIA, POR TIPO, 2018-2027 (MILLONES DE USD)

CUADRO 65 MERCADO DE SABORES Y EDULCORANTES PARA PIENSOS EN ALEMANIA, POR NATURALEZA, 2018-2027 (MILLONES DE USD)

CUADRO 66 MERCADO DE SABORES Y EDULCORANTES PARA PIENSOS EN ALEMANIA, POR FORMA, 2018-2027 (MILLONES DE USD)

CUADRO 67 MERCADO DE AROMAS Y EDULCORANTES PARA PIENSOS EN ALEMANIA, POR GANADO, 2018-2027 (MILLONES DE USD)

CUADRO 68 MERCADO DE RUMIANTES EN ALEMANIA PARA SABORES Y EDULCORANTES PARA PIENSOS, POR TIPO, 2018-2027 (MILLONES DE USD)

TABLA 69 MERCADO PORCINO DE ALEMANIA EN SABORES Y EDULCORANTES PARA ALIMENTOS, POR TIPO, 2018-2027 (MILLONES DE USD)

TABLA 70 MERCADO DE AVES DE CORRAL EN ALEMANIA EN SABORES Y EDULCORANTES PARA PIENSOS, POR TIPO, 2018-2027 (MILLONES DE USD)

TABLA 71 MERCADO DE SABORES Y EDULCORANTES PARA PIENSOS ALEMANIA, POR TIPO, 2018-2027 (MILLONES DE USD)

CUADRO 72 MERCADO FRANCIA DE SABORES Y EDULCORANTES PARA PIENSOS, POR TIPO, 2018-2027 (MILLONES DE USD)

CUADRO 73 FRANCIA SABORES DE PIENSOS EN EL MERCADO DE SABORES Y EDULCORANTES, POR TIPO, 2018-2027 (MILLONES DE USD)

CUADRO 74 MERCADO FRANCIA DE SABORES Y EDULCORANTES PARA PIENSOS, POR TIPO, 2018-2027 (MILLONES DE USD)

CUADRO 75 MERCADO FRANCIA DE SABORES Y EDULCORANTES PARA PIENSOS, POR TIPO, 2018-2027 (MILLONES DE USD)

TABLA 76 MERCADO DE NUECES FRANCIA EN SABORES Y EDULCORANTES PARA PIENSOS, POR TIPO, 2018-2027 (MILLONES DE USD)

TABLA 77 MERCADO DE EDULCORANTES PARA PIENSOS EN FRANCIA, SABORES Y EDULCORANTES PARA PIENSOS, POR TIPO, 2018-2027 (MILLONES DE USD)

CUADRO 78 MERCADO FRANCIA DE SACARINA EN SABORES Y EDULCORANTES PARA PIENSOS, POR TIPO, 2018-2027 (MILLONES DE USD)

CUADRO 79 MERCADO FRANCIA DE AROMAS Y EDULCORANTES PARA PIENSOS, POR NATURALEZA, 2018-2027 (MILLONES DE USD)

CUADRO 80 MERCADO DE FRANCIA DE SABORES Y EDULCORANTES PARA PIENSOS, POR FORMA, 2018-2027 (MILLONES DE USD)

CUADRO 81 MERCADO DE FRANCIA DE AROMAS Y EDULCORANTES PARA PIENSOS, POR GANADO, 2018-2027 (MILLONES DE USD)

CUADRO 82 MERCADO DE RUMIANTES EN FRANCIA EN SABORES Y EDULCORANTES PARA PIENSOS, POR TIPO, 2018-2027 (MILLONES DE USD)

CUADRO 83 MERCADO PORCINO DE FRANCIA EN SABORES Y EDULCORANTES PARA ALIMENTOS, POR TIPO, 2018-2027 (MILLONES DE USD)

CUADRO 84 MERCADO DE AVES DE CORRAL EN FRANCIA EN SABORES DE PIENSOS Y EDULCORANTES, POR TIPO, 2018-2027 (MILLONES DE USD)

CUADRO 85 FRANCEPETS EN EL MERCADO DE SABORES Y EDULCORANTES PARA PIENSOS, POR TIPO, 2018-2027 (MILLONES DE USD)

CUADRO 86 MERCADO RUSIA DE SABORES Y EDULCORANTES, POR TIPO, 2018-2027 (MILLONES DE USD)

CUADRO 87 SABORES DE PIENSOS RUSIA EN EL MERCADO DE SABORES Y EDULCORANTES PARA PIENSOS, POR TIPO, 2018-2027 (MILLONES DE USD)

CUADRO 88 MERCADO DE FRUTAS DE RUSIA EN SABORES Y EDULCORANTES PARA PIENSOS, POR TIPO, 2018-2027 (MILLONES DE USD)

TABLA 89 MERCADO DE SABOR Y EDULCORANTES PARA PIENSOS DE RUSIA, POR TIPO, 2018-2027 (MILLONES DE USD)

TABLA 90 MERCADO DE NUECES DE RUSIA EN SABORES Y EDULCORANTES PARA PIENSOS, POR TIPO, 2018-2027 (MILLONES DE USD)

TABLA 91 MERCADO DE EDULCORANTES PARA PIENSOS EN RUSIA, SABORES Y EDULCORANTES PARA PIENSOS, POR TIPO, 2018-2027 (MILLONES DE USD)

CUADRO 92 MERCADO DE SACARINA DE RUSIA EN SABORES Y EDULCORANTES PARA PIENSOS, POR TIPO, 2018-2027 (MILLONES DE USD)

CUADRO 93 MERCADO DE SABORES Y EDULCORANTES PARA PIENSOS EN RUSIA, POR NATURALEZA, 2018-2027 (MILLONES DE USD)

CUADRO 94 MERCADO DE SABORES Y EDULCORANTES PARA PIENSOS EN RUSIA, POR FORMA, 2018-2027 (MILLONES DE USD)

CUADRO 95 MERCADO DE SABORES Y EDULCORANTES PARA PIENSOS EN RUSIA, POR GANADO, 2018-2027 (MILLONES DE USD)

CUADRO 96 MERCADO DE RUMIANTES DE RUSIA EN SABORES Y EDULCORANTES PARA PIENSOS, POR TIPO, 2018-2027 (MILLONES DE USD)

TABLA 97 MERCADO PORCINO DE RUSIA EN SABORES Y EDULCORANTES PARA ALIMENTOS, POR TIPO, 2018-2027 (MILLONES DE USD)

CUADRO 98 MERCADO DE AVES DE CORRAL DE RUSIA EN SABORES Y EDULCORANTES PARA PIENSOS, POR TIPO, 2018-2027 (MILLONES DE USD)

CUADRO 99 RUSSIAPETS EN EL MERCADO DE SABORES Y EDULCORANTES PARA PIENSOS, POR TIPO, 2018-2027 (MILLONES DE USD)

TABLA 100 MERCADO DE SABORES Y EDULCORANTES PARA PIENSOS DEL REINO UNIDO, POR TIPO, 2018-2027 (MILLONES DE USD)

TABLA 101 SABORES DE PIENSOS DEL REINO UNIDO EN EL MERCADO DE SABORES DE PIENSOS Y EDULCORANTES, POR TIPO, 2018-2027 (MILLONES DE USD)

TABLA 102 MERCADO DE AFRUTADOS EN PIENSOS Y EDULCORANTES DEL REINO UNIDO, POR TIPO, 2018-2027 (MILLONES DE USD)

TABLA 103 MERCADO DE SABOR Y EDULCORANTES PARA PIENSOS DEL REINO UNIDO, POR TIPO, 2018-2027 (MILLONES DE USD)

TABLA 104 MERCADO DE NUECES EN PIENSOS Y EDULCORANTES DEL REINO UNIDO, POR TIPO, 2018-2027 (MILLONES DE USD)

TABLA 105 MERCADO DE EDULCORANTES PARA PIENSOS EN EL REINO UNIDO, POR TIPO, 2018-2027 (MILLONES DE USD)

TABLA 106 MERCADO DE SACARINA EN PIENSOS Y EDULCORANTES DEL REINO UNIDO, POR TIPO, 2018-2027 (MILLONES DE USD)

CUADRO 107 MERCADO DE SABORES Y EDULCORANTES PARA PIENSOS DEL REINO UNIDO, POR NATURALEZA, 2018-2027 (MILLONES DE USD)

CUADRO 108 MERCADO DE SABORES Y EDULCORANTES PARA PIENSOS DEL REINO UNIDO, POR FORMA, 2018-2027 (MILLONES DE USD)

CUADRO 109 MERCADO DE SABORES Y EDULCORANTES PARA PIENSOS DEL REINO UNIDO, POR GANADO, 2018-2027 (MILLONES DE USD)

CUADRO 110 MERCADO DE RUMIANTES EN EL REINO UNIDO EN SABORES Y EDULCORANTES PARA PIENSOS, POR TIPO, 2018-2027 (MILLONES DE USD)

TABLA 111 MERCADO PORCINO DEL REINO UNIDO EN SABORES Y EDULCORANTES PARA ALIMENTOS, POR TIPO, 2018-2027 (MILLONES DE USD)

TABLA 112 MERCADO DE AVES DE CORRAL DEL REINO UNIDO EN SABORES Y EDULCORANTES PARA PIENSOS, POR TIPO, 2018-2027 (MILLONES DE USD)

TABLA 113 MERCADO DE SABORES Y EDULCORANTES PARA PIENSOS PETSIN DEL REINO UNIDO, POR TIPO, 2018-2027 (MILLONES DE USD)

CUADRO 114 MERCADO ITALIA DE SABORES Y EDULCORANTES PARA PIENSOS, POR TIPO, 2018-2027 (MILLONES DE USD)

TABLA 115 ITALIA SABORES DE PIENSOS EN EL MERCADO DE SABORES Y EDULCORANTES DE PIENSOS, POR TIPO, 2018-2027 (MILLONES DE USD)

CUADRO 116 MERCADO DE FRUTOS EN ITALIA EN SABORES Y EDULCORANTES PARA PIENSOS, POR TIPO, 2018-2027 (MILLONES DE USD)

TABLA 117 MERCADO DE SABOR Y EDULCORANTES PARA PIENSOS DE ITALIA, POR TIPO, 2018-2027 (MILLONES DE USD)

TABLA 118 MERCADO DE NUECES EN ITALIA EN SABORES Y EDULCORANTES PARA PIENSOS, POR TIPO, 2018-2027 (MILLONES DE USD)

TABLA 119 MERCADO DE EDULCORANTES PARA PIENSOS EN ITALIA, SABORES Y EDULCORANTES PARA PIENSOS, POR TIPO, 2018-2027 (MILLONES DE USD)

CUADRO 120 MERCADO DE SACARINA EN ITALIA EN SABORES Y EDULCORANTES PARA PIENSOS, POR TIPO, 2018-2027 (MILLONES DE USD)

CUADRO 121 MERCADO ITALIA DE SABORES Y EDULCORANTES PARA PIENSOS, POR NATURALEZA, 2018-2027 (MILLONES DE USD)

CUADRO 122 MERCADO DE SABORES Y EDULCORANTES PARA PIENSOS EN ITALIA, POR FORMA, 2018-2027 (MILLONES DE USD)

CUADRO 123 MERCADO DE SABORES Y EDULCORANTES PARA PIENSOS EN ITALIA, POR GANADO, 2018-2027 (MILLONES DE USD)

CUADRO 124 MERCADO DE RUMIANTES EN ITALIA EN SABORES Y EDULCORANTES PARA PIENSOS, POR TIPO, 2018-2027 (MILLONES DE USD)

CUADRO 125 MERCADO PORCINO DE ITALIA EN SABORES Y EDULCORANTES PARA ALIMENTOS, POR TIPO, 2018-2027 (MILLONES DE USD)

CUADRO 126 MERCADO DE AVES DE CORRAL EN ITALIA EN SABORES Y EDULCORANTES PARA PIENSOS, POR TIPO, 2018-2027 (MILLONES DE USD)

TABLA 127 ITALYPETS EN EL MERCADO DE SABORES Y EDULCORANTES PARA PIENSOS, POR TIPO, 2018-2027 (MILLONES DE USD)

CUADRO 128 MERCADO DE AROMAS Y EDULCORANTES PARA PIENSOS DE LOS PAÍSES BAJOS, POR TIPO, 2018-2027 (MILLONES DE USD)

CUADRO 129 SABOR DE PIENSOS HOLANDA EN EL MERCADO DE SABORES DE PIENSOS Y EDULCORANTES, POR TIPO, 2018-2027 (MILLONES DE USD)

CUADRO 130 MERCADO DE FRUTALES EN PIENSOS Y EDULCORANTES DE LOS PAÍSES BAJOS, POR TIPO, 2018-2027 (MILLONES DE USD)

CUADRO 131 MERCADO DE SABOR Y EDULCORANTES DE LOS PAÍSES BAJOS, POR TIPO, 2018-2027 (MILLONES DE USD)

CUADRO 132 MERCADO DE NUECES EN PIENSOS Y EDULCORANTES DE LOS PAÍSES BAJOS, POR TIPO, 2018-2027 (MILLONES DE USD)

CUADRO 133 PAÍSES BAJOS EDULCORANTES PARA PIENSOS EN EL MERCADO DE SABORES Y EDULCORANTES PARA PIENSOS, POR TIPO, 2018-2027 (MILLONES DE USD)

CUADRO 134 MERCADO DE SACARINA HOLANDESA EN SABORES Y EDULCORANTES PARA PIENSOS, POR TIPO, 2018-2027 (MILLONES DE USD)

CUADRO 135 MERCADO DE AROMAS Y EDULCORANTES PARA PIENSOS DE LOS PAÍSES BAJOS, POR NATURALEZA, 2018-2027 (MILLONES DE USD)

CUADRO 136 MERCADO DE AROMAS Y EDULCORANTES PARA PIENSOS DE LOS PAÍSES BAJOS, POR FORMA, 2018-2027 (MILLONES DE USD)

CUADRO 137 MERCADO DE AROMAS Y EDULCORANTES PARA PIENSOS DE LOS PAÍSES BAJOS, POR GANADO, 2018-2027 (MILLONES DE USD)

CUADRO 138 RUMIANTES DE LOS PAÍSES BAJOS EN EL MERCADO DE SABORES Y EDULCORANTES PARA PIENSOS, POR TIPO, 2018-2027 (MILLONES DE USD)

CUADRO 139 MERCADO PORCINO DE LOS PAÍSES BAJOS EN SABORES Y EDULCORANTES PARA ALIMENTOS, POR TIPO, 2018-2027 (MILLONES DE USD)

CUADRO 140 MERCADO DE AVES DE CORRAL DE LOS PAÍSES BAJOS EN SABORES Y EDULCORANTES PARA PIENSOS, POR TIPO, 2018-2027 (MILLONES DE USD)

CUADRO 141 MERCADO DE SABORES Y EDULCORANTES PARA MASCOTAS DE LOS PAÍSES BAJOS, POR TIPO, 2018-2027 (MILLONES DE USD)

CUADRO 142 MERCADO DE SABORES Y EDULCORANTES DE ALIMENTOS PARA PAVO, POR TIPO, 2018-2027 (MILLONES DE USD)

CUADRO 143 SABORES DE ALIMENTOS PARA PAVO EN EL MERCADO DE SABORES Y EDULCORANTES PARA PIENSOS, POR TIPO, 2018-2027 (MILLONES DE USD)

CUADRO 144 MERCADO DE FRUTAS DE TURQUÍA EN SABORES Y EDULCORANTES PARA PIENSOS, POR TIPO, 2018-2027 (MILLONES DE USD)

CUADRO 145 MERCADO DE SABOR DE PAVO EN SABORES Y EDULCORANTES PARA PIENSOS, POR TIPO, 2018-2027 (MILLONES DE USD)

TABLA 146 MERCADO DE NUECES DE PAVO EN SABORES Y EDULCORANTES PARA PIENSOS, POR TIPO, 2018-2027 (MILLONES DE USD)

TABLA 147 MERCADO DE EDULCORANTES PARA ALIMENTOS EN TURQUÍA, SABORES Y EDULCORANTES, POR TIPO, 2018-2027 (MILLONES DE USD)

CUADRO 148 MERCADO DE SACARINA DE PAVO EN SABORES Y EDULCORANTES PARA PIENSOS, POR TIPO, 2018-2027 (MILLONES DE USD)

CUADRO 149 MERCADO DE SABORES Y EDULCORANTES PARA PIENSOS PARA PAVO, POR NATURALEZA, 2018-2027 (MILLONES DE USD)

CUADRO 150 MERCADO DE SABORES Y EDULCORANTES PARA PIENSOS PARA PAVO, POR FORMA, 2018-2027 (MILLONES DE USD)

CUADRO 151 MERCADO DE SABORES Y EDULCORANTES PARA PIENSOS PARA PAVO, POR GANADO, 2018-2027 (MILLONES DE USD)

CUADRO 152 MERCADO DE RUMIANTES DE TURQUÍA EN SABORES Y EDULCORANTES PARA PIENSOS, POR TIPO, 2018-2027 (MILLONES DE USD)

CUADRO 153 MERCADO DE SABORES Y EDULCORANTES PARA ALIMENTOS PORCINO DE TURQUÍA, POR TIPO, 2018-2027 (MILLONES DE USD)

CUADRO 154 MERCADO DE AVES DE CORRAL DE TURQUÍA EN SABORES Y EDULCORANTES PARA ALIMENTOS, POR TIPO, 2018-2027 (MILLONES DE USD)

CUADRO 155 PAVO EN EL MERCADO DE SABORES Y EDULCORANTES PARA PIENSOS, POR TIPO, 2018-2027 (MILLONES DE USD)

CUADRO 156 MERCADO DE SABORES Y EDULCORANTES PARA PIENSOS POLONIA, POR TIPO, 2018-2027 (MILLONES DE USD)

CUADRO 157 POLONIA SABORES DE PIENSOS EN EL MERCADO DE SABORES Y EDULCORANTES, POR TIPO, 2018-2027 (MILLONES DE USD)

CUADRO 158 MERCADO DE FRUTOS EN PIENSOS Y EDULCORANTES, POR TIPO, 2018-2027 (MILLONES DE USD)

CUADRO 159 MERCADO DE SABOR Y EDULCORANTES DE POLONIA, POR TIPO, 2018-2027 (MILLONES DE USD)

TABLA 160 MERCADO DE NUECES DE POLONIA EN SABORES Y EDULCORANTES PARA PIENSOS, POR TIPO, 2018-2027 (MILLONES DE USD)

CUADRO 161 POLONIA EDULCORANTES PARA PIENSOS EN EL MERCADO DE SABORES Y EDULCORANTES PARA PIENSOS, POR TIPO, 2018-2027 (MILLONES DE USD)

CUADRO 162 MERCADO DE SACARINA DE POLONIA EN SABORES Y EDULCORANTES PARA PIENSOS, POR TIPO, 2018-2027 (MILLONES DE USD)

CUADRO 163 MERCADO DE SABORES Y EDULCORANTES PARA PIENSOS DE POLONIA, POR NATURALEZA, 2018-2027 (MILLONES DE USD)

CUADRO 164 MERCADO DE SABORES Y EDULCORANTES PARA PIENSOS DE POLONIA, POR FORMA, 2018-2027 (MILLONES DE USD)

CUADRO 165 MERCADO DE SABORES Y EDULCORANTES DE PIENSOS DE POLONIA, POR GANADO, 2018-2027 (MILLONES DE USD)

CUADRO 166 RUMIANTES DE POLONIA EN EL MERCADO DE SABORES Y EDULCORANTES PARA PIENSOS, POR TIPO, 2018-2027 (MILLONES DE USD)

CUADRO 167 MERCADO PORCINO DE POLONIA EN SABORES Y EDULCORANTES PARA ALIMENTOS, POR TIPO, 2018-2027 (MILLONES DE USD)

CUADRO 168 MERCADO DE AVES DE CORRAL DE POLONIA EN SABORES Y EDULCORANTES PARA ALIMENTOS, POR TIPO, 2018-2027 (MILLONES DE USD)

TABLA 169 POLANDPETS EN EL MERCADO DE SABORES Y EDULCORANTES PARA PIENSOS, POR TIPO, 2018-2027 (MILLONES DE USD)

CUADRO 170 MERCADO DE SABORES Y EDULCORANTES PARA PIENSOS BELGICA, POR TIPO, 2018-2027 (MILLONES DE USD)

CUADRO 171 BÉLGICA SABORES DE PIENSOS EN EL MERCADO DE SABORES Y EDULCORANTES PARA PIENSOS, POR TIPO, 2018-2027 (MILLONES DE USD)

CUADRO 172 MERCADO DE FRUTALES DE BÉLGICA EN SABORES Y EDULCORANTES PARA PIENSOS, POR TIPO, 2018-2027 (MILLONES DE USD)

CUADRO 173 MERCADO DE SABOR Y EDULCORANTES PARA PIENSOS DE BÉLGICA, POR TIPO, 2018-2027 (MILLONES DE USD)

TABLA 174 MERCADO DE NUECES BELGICA EN SABORES Y EDULCORANTES PARA PIENSOS, POR TIPO, 2018-2027 (MILLONES DE USD)

CUADRO 175 MERCADO DE EDULCORANTES PIENSOS EN SABORES Y EDULCORANTES PARA PIENSOS DE BÉLGICA, POR TIPO, 2018-2027 (MILLONES DE USD)

CUADRO 176 MERCADO DE SACARINA BÉLGICA EN SABORES Y EDULCORANTES PARA PIENSOS, POR TIPO, 2018-2027 (MILLONES DE USD)

CUADRO 177 MERCADO DE AROMAS Y EDULCORANTES PARA PIENSOS EN BÉLGICA, POR NATURALEZA, 2018-2027 (MILLONES DE USD)

CUADRO 178 MERCADO DE AROMAS Y EDULCORANTES PARA PIENSOS EN BÉLGICA, POR FORMA, 2018-2027 (MILLONES DE USD)

CUADRO 179 MERCADO DE AROMAS Y EDULCORANTES PARA PIENSOS EN BÉLGICA, POR GANADO, 2018-2027 (MILLONES DE USD)

CUADRO 180 MERCADO DE RUMIANTES DE BÉLGICA EN SABORES Y EDULCORANTES PARA PIENSOS, POR TIPO, 2018-2027 (MILLONES DE USD)

CUADRO 181 MERCADO PORCINO DE BÉLGICA EN SABORES Y EDULCORANTES PARA ALIMENTOS, POR TIPO, 2018-2027 (MILLONES DE USD)

CUADRO 182 MERCADO DE AVES DE CORRAL DE BÉLGICA EN SABORES Y EDULCORANTES PARA PIENSOS, POR TIPO, 2018-2027 (MILLONES DE USD)

CUADRO 183 MERCADO DE SABORES Y EDULCORANTES PARA PIENSOS BELGIUMPETS, POR TIPO, 2018-2027 (MILLONES DE USD)

CUADRO 184 MERCADO DE SABORES Y EDULCORANTES PARA PIENSOS EN DINAMARCA, POR TIPO, 2018-2027 (MILLONES DE USD)

CUADRO 185 DINAMARCA SABORES DE PIENSOS EN EL MERCADO DE SABORES DE PIENSOS Y EDULCORANTES, POR TIPO, 2018-2027 (MILLONES DE USD)

CUADRO 186 MERCADO DE FRUTOS EN DINAMARCA PARA SABORES Y EDULCORANTES PARA PIENSOS, POR TIPO, 2018-2027 (MILLONES DE USD)

CUADRO 187 MERCADO DE SABOR Y EDULCORANTES DE DINAMARCA, POR TIPO, 2018-2027 (MILLONES DE USD)

TABLA 188 MERCADO DE NUECES DE DINAMARCA EN SABORES Y EDULCORANTES PARA PIENSOS, POR TIPO, 2018-2027 (MILLONES DE USD)

CUADRO 189 DINAMARCA EDULCORANTES PARA PIENSOS EN SABORES DE PIENSOS Y MERCADO DE EDULCORANTES, POR TIPO, 2018-2027 (MILLONES DE USD)

CUADRO 190 MERCADO DE SACARINA EN PIENSOS Y EDULCORANTES EN DINAMARCA, POR TIPO, 2018-2027 (MILLONES DE USD)

CUADRO 191 MERCADO DE SABORES Y EDULCORANTES PARA PIENSOS EN DINAMARCA, POR NATURALEZA, 2018-2027 (MILLONES DE USD)

CUADRO 192 MERCADO DE SABORES Y EDULCORANTES PARA PIENSOS EN DINAMARCA, POR FORMA, 2018-2027 (MILLONES DE USD)

CUADRO 193 MERCADO DE AROMAS Y EDULCORANTES PARA PIENSOS EN DINAMARCA, POR GANADO, 2018-2027 (MILLONES DE USD)

CUADRO 194 DINAMARCA RUMIANTES EN EL MERCADO DE SABORES Y EDULCORANTES PARA PIENSOS, POR TIPO, 2018-2027 (MILLONES DE USD)

CUADRO 195 MERCADO PORCINO DE DINAMARCA EN SABORES Y EDULCORANTES PARA ALIMENTOS, POR TIPO, 2018-2027 (MILLONES DE USD)

CUADRO 196 DINAMARCA AVES DE CORRAL EN EL MERCADO DE SABORES Y EDULCORANTES PARA PIENSOS, POR TIPO, 2018-2027 (MILLONES DE USD)

CUADRO 197 DINAMARCA MASCOTAS EN EL MERCADO DE SABORES Y EDULCORANTES PARA PIENSOS, POR TIPO, 2018-2027 (MILLONES DE USD)

CUADRO 198 MERCADO SUECIA DE AROMAS Y EDULCORANTES, POR TIPO, 2018-2027 (MILLONES DE USD)

CUADRO 199 SABORES DE PIENSOS SUECOS EN EL MERCADO DE SABORES Y EDULCORANTES PARA PIENSOS, POR TIPO, 2018-2027 (MILLONES DE USD)

CUADRO 200 MERCADO DE SUECIA DE SABORES Y EDULCORANTES PARA PIENSOS, POR TIPO, 2018-2027 (MILLONES DE USD)

TABLA 201 MERCADO DE SUECIA EN SABORES Y EDULCORANTES PARA PIENSOS, POR TIPO, 2018-2027 (MILLONES DE USD)

TABLA 202 MERCADO DE NUECES EN SABORES Y EDULCORANTES PARA PIENSOS DE SUECIA, POR TIPO, 2018-2027 (MILLONES DE USD)

TABLA 203 MERCADO DE EDULCORANTES PARA PIENSOS EN SUECIA, SABORES Y EDULCORANTES PARA PIENSOS, POR TIPO, 2018-2027 (MILLONES DE USD)

CUADRO 204 MERCADO DE SACARINA EN SUECIA EN SABORES Y EDULCORANTES PARA PIENSOS, POR TIPO, 2018-2027 (MILLONES DE USD)

CUADRO 205 MERCADO DE SUECIA DE SABORES Y EDULCORANTES PARA PIENSOS, POR NATURALEZA, 2018-2027 (MILLONES DE USD)

CUADRO 206 MERCADO DE SABORES Y EDULCORANTES PARA PIENSOS EN SUECIA, POR FORMA, 2018-2027 (MILLONES DE USD)

CUADRO 207 MERCADO DE SABORES Y EDULCORANTES DE PIENSOS EN SUECIA, POR GANADO, 2018-2027 (MILLONES DE USD)

CUADRO 208 MERCADO DE RUMIANTES EN SUECIA EN SABORES Y EDULCORANTES PARA PIENSOS, POR TIPO, 2018-2027 (MILLONES DE USD)

CUADRO 209 MERCADO DE SUECIA PORCINO EN SABORES Y EDULCORANTES PARA ALIMENTOS, POR TIPO, 2018-2027 (MILLONES DE USD)

CUADRO 210 MERCADO DE AVES DE CORRAL EN SUECIA EN SABORES Y EDULCORANTES PARA PIENSOS, POR TIPO, 2018-2027 (MILLONES DE USD)

TABLA 211 MERCADO DE SUECIA PARA MASCOTAS EN SABORES Y EDULCORANTES, POR TIPO, 2018-2027 (MILLONES DE USD)

CUADRO 212 MERCADO DE AROMAS Y EDULCORANTES PARA PIENSOS EN SUIZA, POR TIPO, 2018-2027 (MILLONES DE USD)

CUADRO 213 SABORES DE PIENSOS EN EL MERCADO DE SABORES Y EDULCORANTES DE PIENSOS, POR TIPO, 2018-2027 (MILLONES DE USD)

CUADRO 214 MERCADO DE FRUTALES EN PIENSOS Y EDULCORANTES DE SUIZA, POR TIPO, 2018-2027 (MILLONES DE USD)

CUADRO 215 MERCADO DE SABOR Y EDULCORANTES PARA PIENSOS DE SUIZA, POR TIPO, 2018-2027 (MILLONES DE USD)

TABLA 216 MERCADO DE NUECES EN PIENSOS Y EDULCORANTES DE SUIZA, POR TIPO, 2018-2027 (MILLONES DE USD)

CUADRO 217 MERCADO DE EDULCORANTES PARA PIENSOS EN SUIZA, SABORES Y EDULCORANTES PARA PIENSOS, POR TIPO, 2018-2027 (MILLONES DE USD)

CUADRO 218 MERCADO DE SACARINA EN PIENSOS Y EDULCORANTES DE SUIZA, POR TIPO, 2018-2027 (MILLONES DE USD)

CUADRO 219 MERCADO DE SABORES Y EDULCORANTES PARA PIENSOS EN SUIZA, POR NATURALEZA, 2018-2027 (MILLONES DE USD)

CUADRO 220 MERCADO DE AROMAS Y EDULCORANTES PARA PIENSOS EN SUIZA, POR FORMA, 2018-2027 (MILLONES DE USD)

CUADRO 221 MERCADO DE AROMAS Y EDULCORANTES PARA PIENSOS EN SUIZA, POR GANADO, 2018-2027 (MILLONES DE USD)

CUADRO 222 MERCADO DE RUMIANTES EN SUIZA PARA SABORES Y EDULCORANTES PARA PIENSOS, POR TIPO, 2018-2027 (MILLONES DE USD)

CUADRO 223 MERCADO PORCINO DE SUIZA EN SABORES Y EDULCORANTES PARA ALIMENTOS, POR TIPO, 2018-2027 (MILLONES DE USD)

CUADRO 224 MERCADO DE AVES DE CORRAL DE SUIZA EN SABORES DE ALIMENTOS Y EDULCORANTES, POR TIPO, 2018-2027 (MILLONES DE USD)

CUADRO 225 SUIZA MASCOTAS EN EL MERCADO DE SABORES Y EDULCORANTES PARA PIENSOS, POR TIPO, 2018-2027 (MILLONES DE USD)

CUADRO 226 RESTO DEL MERCADO DE SABORES Y EDULCORANTES DE EUROPEFEED, POR TIPO, 2018-2027 (MILLONES DE USD)


Por favor complete el siguiente formulario para Infografías

Al hacer clic en el botón "Enviar", usted acepta la investigación de mercado de Data Bridge. política de privacidad y Términos y condiciones

Metodología de investigación:

La recopilación de datos y el análisis del año base se realizan mediante módulos de recopilación de datos con muestras de gran tamaño. La etapa incluye la obtención de información de mercado o datos relacionados a través de diversas fuentes y estrategias. Incluye examinar y planificar de antemano todos los datos adquiridos del pasado. Asimismo, abarca el examen de las inconsistencias de la información observadas en diferentes fuentes de información. Los datos de mercado se analizan y estiman utilizando modelos estadísticos y coherentes de mercado. Además, el análisis de la cuota de mercado y el análisis de tendencias clave son los principales factores de éxito en el informe de mercado. Para saber más, solicite una llamada de analista o envíe su consulta.

La metodología de investigación clave utilizada por el equipo de investigación de DBMR es la triangulación de datos, que implica extracción de datos, análisis del impacto de las variables de datos en el mercado y validación primaria (experto de la industria). Los modelos de datos incluyen cuadrícula de posicionamiento de proveedores, análisis de la línea de tiempo del mercado, descripción general y guía del mercado, cuadrícula de posicionamiento de la empresa, análisis de patentes, análisis de precios, análisis de participación de mercado de la empresa, estándares de medición, análisis global versus regional y de participación de proveedores. Para saber más sobre la metodología de investigación, envíe una consulta para hablar con nuestros expertos de la industria.

Por favor complete el siguiente formulario para Metodología de Investigación

Al hacer clic en el botón "Enviar", usted acepta la investigación de mercado de Data Bridge. política de privacidad y Términos y condiciones

Personalización disponible:

Data Bridge Market Research es líder en investigación formativa avanzada. Estamos orgullosos de brindar servicios a nuestros clientes nuevos y existentes con datos y análisis que coinciden y se adaptan a sus objetivos. El informe se puede personalizar para incluir análisis de tendencias de precios de marcas objetivo que comprendan el mercado de países adicionales (solicite la lista de países), datos de resultados de ensayos clínicos, revisión de literatura, mercado renovado y análisis de la base de productos. El análisis de mercado de los competidores objetivo se puede analizar desde análisis basados ​​en tecnología hasta estrategias de cartera de mercado. Podemos agregar tantos competidores sobre los que necesite datos en el formato y estilo de datos que esté buscando. Nuestro equipo de analistas también puede proporcionarle datos en tablas dinámicas de archivos de Excel sin procesar (libro de datos) o puede ayudarlo a crear presentaciones a partir de los conjuntos de datos disponibles en el informe.

Complete el siguiente formulario para personalizar disponible

Al hacer clic en el botón "Enviar", usted acepta la investigación de mercado de Data Bridge. política de privacidad y Términos y condiciones

Obtenga acceso en línea al informe sobre la primera nube de inteligencia de mercado del mundo

  • Panel de análisis de datos interactivo
  • Panel de análisis de la empresa para oportunidades de alto potencial de crecimiento
  • Acceso de analista de investigación para personalización y consultas
  • Análisis de la competencia con panel interactivo
  • Últimas noticias, actualizaciones y análisis de tendencias
  • Aproveche el poder del análisis de referencia para un seguimiento integral de la competencia
Solicitar muestra
Informe de muestra gratuito

ELEGIR TIPO DE LICENCIA

  • 4200.00
  • 3500.00
  • 2000.00
  • 5500.00
  • 7500.00

Por qué elegirnos

Cobertura de la industria

DBMR trabaja en todo el mundo en múltiples industrias, lo que nos brinda conocimiento en todos los sectores verticales y brinda a nuestros clientes información no solo de su industria sino también de cómo otras industrias afectarán su ecosistema.

Cobertura Regional

La cobertura de Data Bridge no se limita a las economías desarrolladas o emergentes. Trabajamos en todo el mundo cubriendo la mayor variedad de países donde ninguna otra firma de investigación de mercado o consultoría de negocios ha realizado investigaciones; creando oportunidades de crecimiento para nuestros clientes en áreas aún desconocidas.

Cobertura Tecnológica

En el mundo actual, la tecnología impulsa el sentimiento del mercado, por lo que nuestra visión es brindar a nuestros clientes información no solo sobre las tecnologías desarrolladas, sino también sobre los cambios tecnológicos futuros e disruptivos a lo largo del ciclo de vida del producto, brindándoles oportunidades imprevistas en el mercado que crearán disrupciones en su industria. . Esto lleva a la innovación y a que nuestros clientes salgan ganadores.

Soluciones orientadas a objetivos

El objetivo de DBMR es ayudar a nuestros clientes a alcanzar sus objetivos a través de nuestras soluciones; por lo tanto, creamos de manera formativa las soluciones más adecuadas para las necesidades de nuestros clientes, ahorrándoles tiempo y esfuerzos para impulsar sus grandes estrategias.

Soporte de analista incomparable

Nuestros analistas se enorgullecen del éxito de nuestros clientes. A diferencia de otros, creemos en trabajar junto a nuestros clientes para lograr sus objetivos con soporte de analistas las 24 horas para determinar las necesidades correctas e inspirar la innovación a través del servicio.

Banner

testimonios de clientes