

Mercado europeo de agentes quelantes, por tipo (agentes quelantes sintéticos y agentes quelantes naturales), forma (biodegradable y no biodegradable), canal de distribución (ventas directas/B2B, tiendas especializadas, almacenes, comercio electrónico y otros), aplicación ( pulpa y papel , agricultura, limpiadores y detergentes, limpieza/desincrustación industrial, minería, procesamiento textil, petróleo y gas, producción de polímeros, construcción y edificación, fotografía, electricidad y electrónica, aditivos para alimentos y piensos, cuidado personal, productos farmacéuticos y otros): tendencias de la industria y pronóstico hasta 2030.
Análisis y perspectivas del mercado de agentes quelantes en Europa
El mercado de agentes quelantes está experimentando un crecimiento significativo debido al aumento del uso de estos agentes en diversos sectores. Se utilizan en diferentes industrias, como el cuidado personal, la pulpa y el papel, la agricultura, entre otros productos, y tienen una gran demanda en el mercado.
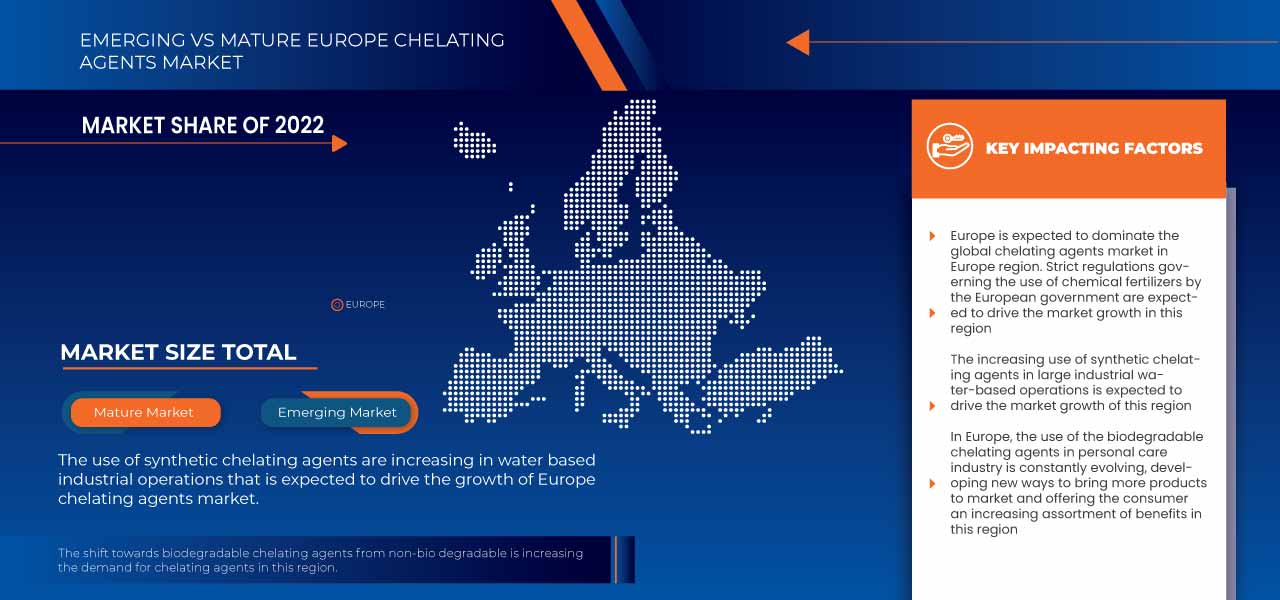
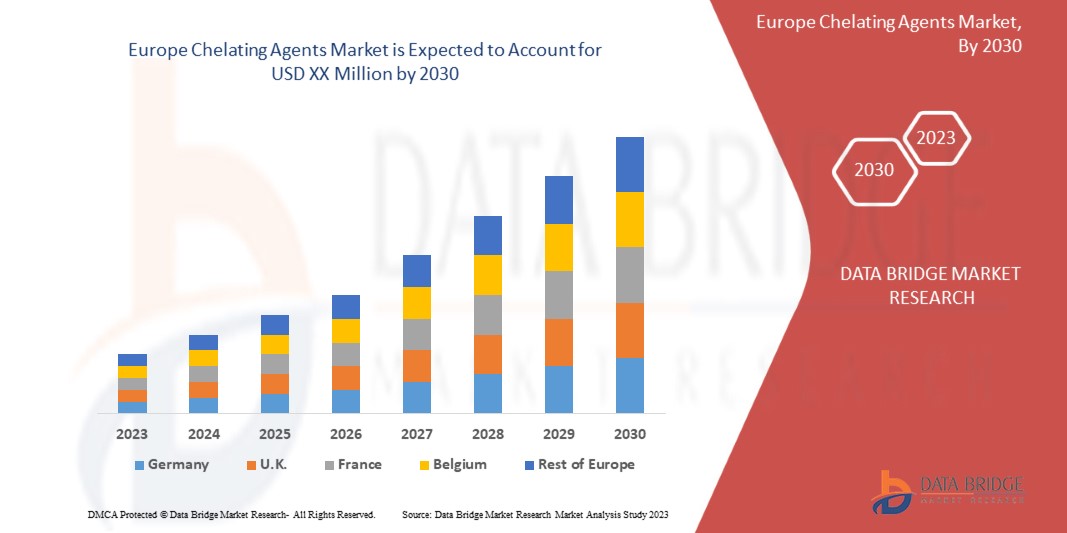
El principal factor que impulsa el crecimiento de este mercado es el aumento en el consumo de agua tratada para uso industrial y la alta demanda de limpieza del hogar que impulsa el mercado en el período previsto, mientras que, por otro lado, los riesgos ecotoxicológicos de los agentes quelantes convencionales y la disminución del consumo de agentes a base de fosfato afectan el mercado de agentes quelantes de Europa. Data Bridge Market Research analiza que el mercado de agentes quelantes crecerá a una CAGR del 4,7% durante el período de pronóstico de 2023 a 2030.
|
Métrica del informe |
Detalles |
|
Período de pronóstico |
2023 a 2030 |
|
Año base |
2022 |
|
Años históricos |
2021 (Personalizable para 2020 - 2016) |
|
Unidades cuantitativas |
Ingresos en millones, volumen en miles de toneladas, precios en USD |
|
Segmentos cubiertos |
Por tipo (agentes quelantes sintéticos y agentes quelantes naturales), forma (biodegradables y no biodegradables), canal de distribución (ventas directas/B2B, tiendas especializadas, almacenes, comercio electrónico y otros), aplicación (pulpa y papel, agricultura, limpiadores y detergentes, limpieza/desincrustación industrial, minería, procesamiento textil, petróleo y gas, producción de polímeros, construcción y edificación, fotografía, electricidad y electrónica, aditivos para alimentos y piensos, cuidado personal, productos farmacéuticos y otros) |
|
Regiones cubiertas |
|
|
Actores del mercado cubiertos |
BASF SE, Eastman Chemical Company, Chevron Phillips Chemical Company LLC, LANXESS, INEOS, ADM, Mitsubishi Chemical Corporation, SABIC, Dow, Nouryon, Kemira, Ascend Performance Materials, NIPPON SHOKUBAI CO., LTD., Lonza, Evonik Industries AG, Zhonglan Industry Co., Ltd., Akzo Nobel NV, entre otros.
|
Definición de mercado
Los agentes quelantes son compuestos químicos cuyas composiciones hacen que dos o más átomos (o sitios) donantes se conecten simultáneamente al mismo ion metálico y creen uno o más anillos. Estos complejos metálicos tienen el potencial de disolverse en formas ópticamente activas (R&L). La estabilidad de los complejos metálicos varía según el patrón de formación de la matriz y la inestabilidad de la variación se vuelve más importante en soluciones cada vez más saturadas de procesos biológicos como el suero o el tejido. La cinética tóxica y la dinámica tóxica de los metales y los agentes quelantes son compuestos químicos cuyas composiciones permiten que dos o más átomos (o sitios) donantes se unan simultáneamente al mismo ion metálico y creen uno o más anillos.
Dinámica del mercado de los agentes quelantes
En esta sección se aborda la comprensión de los factores impulsores, las oportunidades, las limitaciones y los desafíos del mercado. Todo esto se analiza en detalle a continuación:
Conductores
-
Aumento de la demanda de la industria de pulpa y papel
Los agentes quelantes desempeñan un papel importante en la industria de la pulpa y el papel. El funcionamiento sin acumulación de iones metálicos solubles se ve obstaculizado por los agentes quelantes, ácido etilendiaminotetraacético (EDTA) y ácido dietilenetriaminopentaacético (DTPA) en la pulpa y el papel utilizados en el blanqueo de voltaje. Los agentes quelantes se utilizan en cadenas de blanqueo, en particular en procesos de dióxido de cloro e hidrosulfato de sodio. También se pueden utilizar para aplicaciones de entintado y decapado. Existen diversas propiedades de los agentes quelantes en la purificación química y acústica del agua y el uso de agentes quelantes en el fabricante de exfoliación con cloro.
En la industria de la pulpa y el papel, se utilizan agentes quelantes para mejorar la precisión del proceso, como el secado con cloro. Los aminopolicarboxilatos, incluidos el EDTA y el DTPA, son, con diferencia, los agentes quelantes más utilizados.
-
Aumento del consumo de agua tratada para uso industrial
Los agentes quelantes son ablandadores de agua que se utilizan en análisis químicos. El EDTA es un agente quelante sintético común. Se utiliza en programas de tratamiento de agua, en particular en tecnología de vapor, en sistemas de tratamiento de agua de calderas. El agente quelante se utiliza en la caldera para disolver los tipos comunes de incrustaciones y proporcionar una eliminación eficaz de las incrustaciones en línea y fuera de línea dentro de la caldera.
Los agentes quelantes forman complejos solubles en agua con iones de metales alcalinos y de transición, lo que aumenta la solubilidad del metal y evita las reacciones catalizadas por metales. Los agentes quelantes de aminopolicarboxilato se utilizan ampliamente en diversos productos domésticos y procesos industriales, siendo las aplicaciones más importantes el tratamiento de aguas industriales.
Oportunidades
1 Desarrollo de agentes quelantes ecológicos para aplicaciones de limpieza.
Los agentes quelantes han demostrado tener enormes aplicaciones en la limpieza, especialmente en la acción de los detergentes. Los agentes quelantes y su capacidad para producir metales complejos se utilizan ampliamente en muchas aplicaciones industriales, domésticas y agrícolas. En las últimas décadas, se han utilizado en diversas aplicaciones, incluidas las de limpieza.
Los agentes quelantes se utilizan habitualmente en los detergentes domésticos para evitar que los iones metálicos presentes de forma natural en el agua formen restos de jabón. Existen muchos agentes quelantes, pero el EDTA y el ácido cítrico son dos de los que se encuentran habitualmente en los productos de limpieza, utilizando ácidos fosfóricos que están prohibidos en la mayoría de los países. Se utiliza con mayor frecuencia en productos de limpieza para evitar que reaccione con los depósitos minerales y cree restos de jabón. El mecanismo por el que funcionan los agentes quelantes es complejo. Básicamente, se unen a determinados iones metálicos para formar complejos moleculares que atrapan o quelan los iones de calcio para que no presenten propiedades iónicas.
Restricciones/Desafíos
- Disminución del consumo de agentes a base de fosfato
En suelos sin fertilizantes fosfatados adicionales, el EDTA y el HEEDTA producen un aumento sustancial en las concentraciones de WSP, así como un aumento en las concentraciones de Mehlich-1 P y Mehlich-3 P.
El uso de agentes quelantes, con y sin fertilizantes fosfóricos, podría teóricamente mejorar el suministro de fósforo a las plantas y, por lo tanto, disminuir el fertilizante fosfórico. Se ha descubierto que las raíces de los agentes quelantes naturales alternativos ayudan a eliminar los iones metálicos dentro de la rizosfera. Los investigadores han estudiado la interacción entre los fármacos excretores y los metales de la superficie en respuesta a los agentes quelantes sintetizados. Los iones metálicos se absorben una vez que tienen orbitales vacíos que hacen que el ion metálico interactúe con un sitio de unión que incluye un átomo con un par de electrones. Determinado por la estructura química, los agentes quelantes pueden requerir más de una molécula para unirse al ácido carboxílico metálico debido a la cantidad de conceptos y habilidades en el ligando.
Acontecimientos recientes
- En octubre de 2021, el gluconato de sodio de Jungbunzlauer se produce mediante la fermentación de materias primas renovables, como los carbohidratos del maíz. Muchos organismos lo biodegradan fácilmente en condiciones aeróbicas y anaeróbicas de aguas residuales, así como en el medio ambiente natural.
- Los agentes quelantes de Dow combinan una unión superior de iones metálicos con fórmulas relativamente simples. Son una parte integral y económica de la mayoría de los agentes de limpieza. En comparación con muchos otros agentes quelantes, los agentes quelantes de Dow superan a los contaminantes de iones metálicos tradicionales.
Alcance del mercado de los agentes quelantes
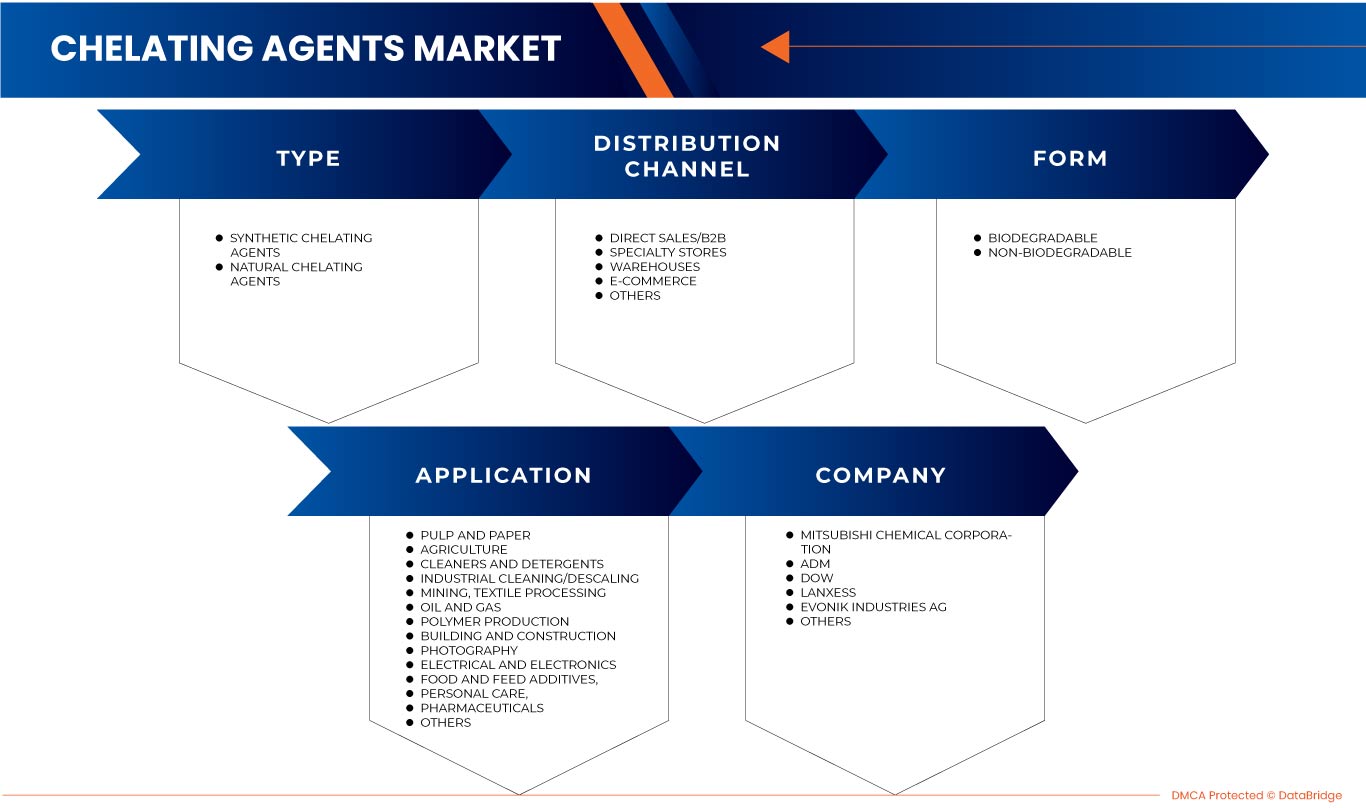
El mercado de agentes quelantes está segmentado en función del tipo, la forma, el canal de distribución y la aplicación. El crecimiento entre estos segmentos le ayudará a analizar los principales segmentos de crecimiento en las industrias y brindará a los usuarios una valiosa descripción general del mercado y conocimientos del mercado para tomar decisiones estratégicas para identificar las principales aplicaciones del mercado.
Tipo
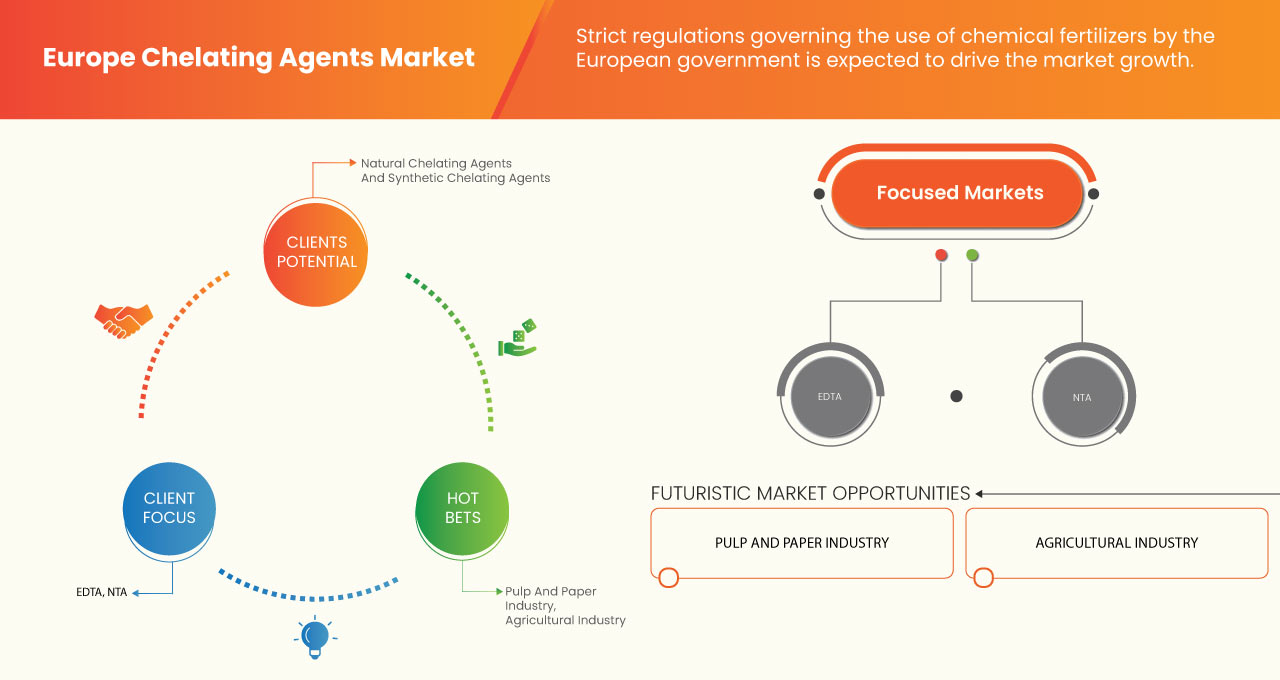
- Agentes quelantes sintéticos
- Agentes quelantes naturales
Según el tipo, el mercado está segmentado en agentes quelantes sintéticos y agentes quelantes naturales.
Forma
- Biodegradable
- No biodegradable
Sobre la base de la forma, el mercado de agentes quelantes se segmenta en biodegradables y no biodegradables.
Canal de distribución
- Ventas directas/B2B
- Tiendas especializadas
- Almacenes
- Comercio electrónico
- Otros
Sobre la base del canal de distribución, el mercado de agentes quelantes se segmenta en ventas directas/B2B, tiendas especializadas, almacenes, comercio electrónico y otros.
Solicitud
- Pulpa y papel
- Agricultura
- Limpiadores y detergentes
- Limpieza industrial/desincrustación
- Minería
- Procesamiento de textiles
- Petróleo y gas
- Producción de polímeros
- Construcción y edificación
- Fotografía
- Electricidad y electrónica
- Alimentos y aditivos para piensos
- Cuidado personal
- Productos farmacéuticos
- Otros
Sobre la base de la aplicación, el mercado de agentes quelantes está segmentado en pulpa y papel, agricultura, limpiadores y detergentes, limpieza/descalcificación industrial, minería, procesamiento textil, petróleo y gas, producción de polímeros, construcción y edificación, fotografía, electricidad y electrónica, alimentos y aditivos para piensos, cuidado personal, productos farmacéuticos y otros.
Análisis y perspectivas regionales del mercado de agentes quelantes
Se analiza el mercado de agentes quelantes y se proporcionan información y tendencias del tamaño del mercado según lo mencionado anteriormente.
Los países cubiertos en el informe del mercado de agentes quelantes son Alemania, Francia, Reino Unido, Países Bajos, Suiza, Bélgica, Rusia, Italia, España, Turquía y el resto de Europa.
Se espera que Alemania domine el mercado de agentes quelantes debido a la creciente demanda de agentes quelantes en las industrias de fertilizantes.
La sección de regiones del informe también proporciona factores de impacto de mercado individuales y cambios en las regulaciones del mercado que afectan las tendencias actuales y futuras del mercado. Los puntos de datos, como las ventas nuevas y de reemplazo, la demografía del país, la epidemiología de las enfermedades y los aranceles de importación y exportación, son algunos de los principales indicadores utilizados para pronosticar el escenario del mercado para cada país. Además, se consideran la presencia y disponibilidad de marcas europeas y los desafíos que enfrentan debido a la alta competencia de las marcas locales y nacionales y el impacto de los canales de venta al proporcionar un análisis de pronóstico de los datos del país.
Análisis del panorama competitivo y de la cuota de mercado de los agentes quelantes
El mercado competitivo de agentes quelantes proporciona detalles sobre los competidores. Los detalles incluyen una descripción general de la empresa, las finanzas de la empresa, los ingresos generados, el potencial de mercado, la inversión en investigación y desarrollo, las nuevas iniciativas de mercado, la presencia en Europa, los sitios e instalaciones de producción, las capacidades de producción, las fortalezas y debilidades de la empresa, el lanzamiento del producto, la amplitud y la variedad del producto y el dominio de la aplicación. Los puntos de datos anteriores solo están relacionados con el enfoque de las empresas en el mercado de agentes quelantes.
Algunos de los principales actores que operan en el mercado son BASF SE, Eastman Chemical Company, Chevron Phillips Chemical Company LLC, LANXESS, INEOS, ADM, Mitsubishi Chemical Corporation, SABIC, Dow, Nouryon, Kemira, Ascend Performance Materials, NIPPON SHOKUBAI CO., LTD., Lonza, Evonik Industries AG, Zhonglan Industry Co., Ltd., Akzo Nobel NV, entre otros.
SKU-
Obtenga acceso en línea al informe sobre la primera nube de inteligencia de mercado del mundo

- Panel de análisis de datos interactivo
- Panel de análisis de empresas para oportunidades con alto potencial de crecimiento
- Acceso de analista de investigación para personalización y consultas
- Análisis de la competencia con panel interactivo
- Últimas noticias, actualizaciones y análisis de tendencias
- Aproveche el poder del análisis de referencia para un seguimiento integral de la competencia
Tabla de contenido
1 INTRODUCTION
1.1 OBJECTIVES OF THE STUDY
1.2 MARKET DEFINITION
1.3 OVERVIEW OF THE EUROPE CHELATING AGENTS MARKET
1.4 LIMITATION
1.5 MARKETS COVERED
2 MARKET SEGMENTATION
2.1 MARKETS COVERED
2.2 GEOGRAPHICAL SCOPE
2.3 YEARS CONSIDERED FOR THE STUDY
2.4 CURRENCY AND PRICING
2.5 DBMR TRIPOD DATA VALIDATION MODEL
2.6 MULTIVARIATE MODELLING
2.7 TESTING TYPE LIFELINE CURVE
2.8 PRIMARY INTERVIEWS WITH KEY OPINION LEADERS
2.9 DBMR MARKET POSITION GRID
2.1 MARKET APPLICATION COVERAGE GRID
2.11 SECONDARY SOURCES
2.12 ASSUMPTIONS
3 EXECUTIVE SUMMARY
4 PREMIUM INSIGHTS
4.1 PRICING ANALYSIS –EUROPE CHELATING AGENTS MARKET
4.2 GROWTH STRATEGIES ADOPTED BY KEY MARKET PLAYERS
4.3 IMPACT OF ECONOMIC SLOWDOWN ON THE MARKET –EUROPE CHELATING AGENTS MARKET
5 MARKET OVERVIEW
5.1 DRIVERS
5.1.1 RISE IN DEMAND FROM THE PULP & PAPER INDUSTRY
5.1.2 INCREASE IN CONSUMPTION OF TREATED WATER FOR INDUSTRIAL USAGE
5.1.3 HIGH DEMAND FOR CHELATING AGENTS IN HOUSEHOLD CLEANING
5.1.4 SHIFT TOWARDS BIODEGRADABLE CHELATING AGENTS FROM NON-BIODEGRADABLE
5.2 RESTRAINTS
5.2.1 ECO-TOXICOLOGICAL RISKS OF CONVENTIONAL CHELATING AGENTS
5.2.2 DECLINE IN CONSUMPTION OF PHOSPHATE-BASED AGENTS
5.2.3 POOR DEGRADABILITY OF EDTA AND DTPA
5.3 OPPORTUNITIES
5.3.1 GROWTH IN R&D INVESTMENT TO DEVELOP BIO-BASED CHELATING AGENTS
5.3.2 DEVELOPMENT OF ECO-FRIENDLY CHELATING AGENTS FOR CLEANING APPLICATION
5.3.3 INCREASE IN THE USE OF CHELATING AGENTS FOR THE PHARMACEUTICAL INDUSTRY
5.4 CHALLENGES
5.4.1 ENVIRONMENTAL CONCERNS RELATED TO CHELATING AGENTS
5.4.2 LESS AWARENESS IN DEVELOPING ECONOMIES ABOUT THE BENEFITS OF GREEN CHELATES
6 EUROPE CHELATING AGENTS MARKET, BY TYPE
6.1 OVERVIEW
6.2 SYNTHETIC CHELATING AGENTS
6.2.1 AMINOPOLYCARBOLXYLATES (APCS)
6.2.1.1 ETHYLENEDIAMINETETRAACETIC ACID (EDTA)
6.2.1.2 DIETHYLENETRIAMINEPENTAACETIC ACID (DTPA)
6.2.1.3 NITRILOTRIACETIC ACID (NTA)
6.2.1.4 OTHERS
6.2.2 ORGANOPHOSPHATES
6.2.2.1 DIETHYLENETRIAMINE PENTA (METHYLENE PHOSPHONIC ACID)(DTPMP)
6.2.2.2 HYDROXYETHYLIDENEDIPHOSPHONIC ACID (HEDP)
6.2.2.3 NITRILOTRIMETHYLENEPHOSPHONIC ACID (NTMP)
6.2.2.4 OTHERS
6.2.3 ORGANIC ACIDS
6.2.3.1 CITRIC ACID
6.2.3.2 TARTARIC ACID
6.2.3.3 OTHERS
6.2.4 OTHERS
6.3 NATURAL CHELATING AGENTS
6.3.1 FOOD-GRADE ACTIVATED CHARCOAL
6.3.2 CHLORELLA
6.3.3 GLYCINE
6.3.4 OTHERS
7 EUROPE CHELATING AGENTS MARKET, BY FORM
7.1 OVERVIEW
7.2 BIODEGRADABLE
7.2.1 NTA
7.2.2 GLDA
7.2.3 MGDA
7.2.4 OTHERS
7.3 NON-BIODEGRADABLE
8 EUROPE CHELATING AGENTS MARKET, BY DISTRIBUTION CHANNEL
8.1 OVERVIEW
8.2 DIRECT SALES/B2B
8.3 SPECIALTY STORES
8.4 WAREHOUSES
8.5 E-COMMERCE
8.6 OTHERS
9 EUROPE CHELATING AGENTS MARKET, BY END USER
9.1 OVERVIEW
9.2 PULP AND PAPER
9.2.1 BIODEGRADABLE
9.2.2 NON-BIODEGRADABLE
9.3 AGRICULTURE
9.3.1 BIODEGRADABLE
9.3.2 NON-BIODEGRADABLE
9.4 CLEANERS AND DETERGENTS
9.4.1 BIODEGRADABLE
9.4.2 NON-BIODEGRADABLE
9.5 INDUSTRIAL CLEANING/DESCALING
9.5.1 BIODEGRADABLE
9.5.2 NON-BIODEGRADABLE
9.6 MINING
9.6.1 BIODEGRADABLE
9.6.2 NON-BIODEGRADABLE
9.7 TEXTILE PROCESSING
9.7.1 BIODEGRADABLE
9.7.2 NON-BIODEGRADABLE
9.8 OIL AND GAS
9.8.1 BIODEGRADABLE
9.8.2 NON-BIODEGRADABLE
9.9 POLYMER PRODUCTION
9.9.1 BIODEGRADABLE
9.9.2 NON-BIODEGRADABLE
9.1 BUILDING AND CONSTRUCTION
9.10.1 BIODEGRADABLE
9.10.2 NON-BIODEGRADABLE
9.11 PHOTOGRAPHY
9.11.1 BIODEGRADABLE
9.11.2 NON-BIODEGRADABLE
9.12 ELECTRICAL AND ELECTRONICS
9.12.1 BIODEGRADABLE
9.12.2 NON-BIODEGRADABLE
9.13 FOOD AND FEED ADDITIVES
9.13.1 BIODEGRADABLE
9.13.2 NON-BIODEGRADABLE
9.14 PERSONAL CARE
9.14.1 BIODEGRADABLE
9.14.2 NON-BIODEGRADABLE
9.15 PHARMACEUTICALS
9.15.1 BIODEGRADABLE
9.15.2 NON-BIODEGRADABLE
9.16 OTHERS
9.16.1 BIODEGRADABLE
9.16.2 NON-BIODEGRADABLE
10 EUROPE CHELATING AGENTS MARKET, BY REGION
10.1 EUROPE
10.1.1 GERMANY
10.1.2 U.K.
10.1.3 FRANCE
10.1.4 ITALY
10.1.5 SPAIN
10.1.6 NETHERLANDS
10.1.7 BELGIUM
10.1.8 RUSSIA
10.1.9 TURKEY
10.1.10 SWITZERLAND
10.1.11 REST OF EUROPE
11 EUROPE CHELATING AGENTS MARKET COMPANY LANDSCAPE
11.1 COMPANY SHARE ANALYSIS: EUROPE
12 SWOT ANALYSIS
13 COMPANY PROFILE
13.1 ADM
13.1.1 COMPANY SNAPSHOT
13.1.2 REVENUE ANALYSIS
13.1.3 COMPANY SHARE ANALYSIS
13.1.4 PRODUCT PORTFOLIO
13.1.5 RECENT UPDATE
13.2 MITSUBISHI CHEMICAL CORPORATION
13.2.1 COMPANY SNAPSHOT
13.2.2 RECENT FINANCIALS
13.2.3 COMPANY SHARE ANALYSIS
13.2.4 PRODUCT PORTFOLIO
13.2.5 RECENT DEVELOPMENT
13.3 LANXESS
13.3.1 COMPANY SNAPSHOT
13.3.2 RECENT FINANCIALS
13.3.3 COMPANY SHARE ANALYSIS
13.3.4 PRODUCT PORTFOLIO
13.3.5 RECENT DEVELOPMENT
13.4 DOW
13.4.1 COMPANY SNAPSHOT
13.4.2 REVENUE ANALYSIS
13.4.3 COMPANY SHARE ANALYSIS
13.4.4 PRODUCT PORTFOLIO
13.4.5 RECENT UPDATE
13.5 EVONIK INDUSTRIES AG
13.5.1 COMPANY SNAPSHOT
13.5.2 RECENT FINANCIALS
13.5.3 COMPANY SHARE ANALYSIS
13.5.4 PRODUCT PORTFOLIO
13.5.5 RECENT DEVELOPMENT
13.6 AQUAPHARM CHEMICAL PVT LTD.
13.6.1 COMPANY SNAPSHOT
13.6.2 PRODUCT PORTFOLIO
13.6.3 RECENT DEVELOPMENT
13.7 ASCEND PERFORMANCE MATERIALS
13.7.1 COMPANY SNAPSHOT
13.7.2 PRODUCT PORTFOLIO
13.7.3 RECENT DEVELOPMENT
13.8 AVA CHEMICALS PRIVATE LIMITED
13.8.1 COMPANY SNAPSHOT
13.8.2 PRODUCT PORTFOLIO
13.8.3 RECENT DEVELOPMENT
13.9 BASF SE
13.9.1 COMPANY SNAPSHOT
13.9.2 REVENUE ANALYSIS
13.9.3 PRODUCT PORTFOLIO
13.9.4 RECENT UPDATE
13.1 CHEVRON PHILLIPS CHEMICAL COMPANY
13.10.1 COMPANY SNAPSHOT
13.10.2 PRODUCT PORTFOLIO
13.10.3 RECENT DEVELOPMENT
13.11 EASTMAN CHEMICAL COMPANY
13.11.1 COMPANY SNAPSHOT
13.11.2 RECENT FINANCIALS
13.11.3 PRODUCT PORTFOLIO
13.11.4 RECENT DEVELOPMENT
13.12 JARCHEM INNOVATIVE INGREDIENTS LLC
13.12.1 COMPANY SNAPSHOT
13.12.2 PRODUCT PORTFOLIO
13.12.3 RECENT DEVELOPMENT
13.13 KEMIRA
13.13.1 COMPANY SNAPSHOT
13.13.2 REVENUE ANALYSIS
13.13.3 PRODUCT PORTFOLIO
13.13.4 RECENT UPDATES
13.14 LONZA
13.14.1 COMPANY SNAPSHOT
13.14.2 RECENT FINANCIALS
13.14.3 PRODUCT PORTFOLIO
13.14.4 RECENT DEVELOPMENT
13.15 NANJING SUNRISE IMP. & EXP. CO., LTD
13.15.1 COMPANY SNAPSHOT
13.15.2 PRODUCT PORTFOLIO
13.15.3 RECENT DEVELOPMENT
13.16 NIPPON SHKUBAI CO., LTD.
13.16.1 COMPANY SNAPSHOT
13.16.2 RECENT FINANCIALS
13.16.3 PRODUCT PORTFOLIO
13.16.4 RECENT DEVELOPMENT
13.17 NOURYON
13.17.1 COMPANY SNAPSHOT
13.17.2 PRODUCT PORTFOLIO
13.17.3 RECENT UPDATE
13.18 SABIC
13.18.1 COMPANY SNAPSHOT
13.18.2 RECENT FINANCIALS
13.18.3 .PRODUCT PORTFOLIO
13.18.4 RECENT DEVELOPMENT
13.19 SHANDONG IRO CHELATING CHEMICAL CO., LTD.
13.19.1 COMPANY SNAPSHOT
13.19.2 PRODUCT PORTFOLIO
13.19.3 RECENT DEVELOPMENT
13.2 ZHONGLAN INDUSTRY CO., LTD
13.20.1 COMPANY SNAPSHOT
13.20.2 PRODUCT PORTFOLIO
13.20.3 RECENT DEVELOPMENT
14 QUESTIONNAIRE
15 RELATED REPORTS
Lista de Tablas
TABLE 1 EUROPE CHELATING AGENTS MARKET, BY TYPE, 2016-2030 (USD MILLION)
TABLE 2 EUROPE CHELATING AGENTS MARKET, BY TYPE, 2016-2030 (TONS)
TABLE 3 EUROPE SYNTHETIC CHELATING AGENTS IN CHELATING AGENTS MARKET, BY REGION, 2016-2030 (USD MILLION)
TABLE 4 EUROPE SYNTHETIC CHELATING AGENTS IN CHELATING AGENTS MARKET, BY TYPE, 2016-2030 (USD MILLION)
TABLE 5 EUROPE SYNTHETIC CHELATING AGENTS IN CHELATING AGENTS MARKET, BY TYPE, 2016-2030 (TONS)
TABLE 6 EUROPE AMINOPOLYCARBOLXYLATES (APCS) IN CHELATING AGENTS MARKET, BY TYPE, 2016-2030 (USD MILLION)
TABLE 7 EUROPE AMINOPOLYCARBOLXYLATES (APCS) IN CHELATING AGENTS MARKET, BY TYPE, 2016-2030 (TONS)
TABLE 8 EUROPE ORGANOPHOSPHATES IN CHELATING AGENTS MARKET, BY TYPE, 2016-2030 (USD MILLION)
TABLE 9 EUROPE ORGANOPHOSPHATES IN CHELATING AGENTS MARKET, BY TYPE, 2016-2030 (TONS)
TABLE 10 EUROPE ORGANIC ACIDS IN CHELATING AGENTS MARKET, BY TYPE, 2016-2030 (USD MILLION)
TABLE 11 EUROPE ORGANIC ACIDS IN CHELATING AGENTS MARKET, BY TYPE, 2016-2030 (TONS)
TABLE 12 EUROPE NATURAL CHELATING AGENTS IN CHELATING AGENTS MARKET, BY REGION, 2016-2030 (USD MILLION)
TABLE 13 EUROPE NATURAL CHELATING AGENTS IN CHELATING AGENTS MARKET, BY TYPE, 2016-2030 (USD MILLION)
TABLE 14 EUROPE NATURAL CHELATING AGENTS IN CHELATING AGENTS MARKET, BY TYPE, 2016-2030 (TONS)
TABLE 15 EUROPE CHELATING AGENTS MARKET, BY FORM, 2016-2030 (USD MILLION)
TABLE 16 EUROPE CHELATING AGENTS MARKET, BY FORM, 2016-2030 (TONS)
TABLE 17 EUROPE BIODEGRADABLE IN CHELATING AGENTS MARKET, BY REGION, 2016-2030 (USD MILLION)
TABLE 18 EUROPE BIODEGRADABLE IN CHELATING AGENTS MARKET, BY FORM, 2016-2030 (USD MILLION)
TABLE 19 EUROPE BIODEGRADABLE IN CHELATING AGENTS MARKET, BY FORM, 2016-2030 (TONS)
TABLE 20 EUROPE NON-BIODEGRADEABLE IN CHELATING AGENTS MARKET, BY REGION, 2016-2030 (USD MILLION)
TABLE 21 EUROPE CHELATING AGENTS MARKET, BY DISTRIBUTION CHANNEL, 2016-2030 (USD MILLION)
TABLE 22 EUROPE CHELATING AGENTS MARKET, BY DISTRIBUTION CHANNEL, 2016-2030 (TONS)
TABLE 23 EUROPE DIRECT SALES/B2B IN CHELATING AGENTS MARKET, BY REGION, 2016-2030 (USD MILLION)
TABLE 24 EUROPE SPECIALTY STORES IN CHELATING AGENTS MARKET, BY REGION, 2016-2030 (USD MILLION)
TABLE 25 EUROPE WAREHOUSES IN CHELATING AGENTS MARKET, BY REGION, 2016-2030 (USD MILLION)
TABLE 26 EUROPE E-COMMERCE IN CHELATING AGENTS MARKET, BY REGION, 2016-2030 (USD MILLION)
TABLE 27 EUROPE OTHERS IN CHELATING AGENTS MARKET, BY REGION, 2016-2030 (USD MILLION)
TABLE 28 EUROPE CHELATING AGENTS MARKET, BY END USER, 2016-2030 (USD MILLION)
TABLE 29 EUROPE CHELATING AGENTS MARKET, BY END USER, 2016-2030 (TONS)
TABLE 30 EUROPE PULP AND PAPER IN CHELATING AGENTS MARKET, BY REGION, 2016-2030 (USD MILLION)
TABLE 31 EUROPE PULP AND PAPER IN CHELATING AGENTS MARKET, BY FORM, 2016-2030 (USD MILLION)
TABLE 32 EUROPE AGRICULTURE IN CHELATING AGENTS MARKET, BY REGION, 2016-2030 (USD MILLION)
TABLE 33 EUROPE AGRICULTURE IN CHELATING AGENTS MARKET, BY FORM, 2016-2030 (USD MILLION)
TABLE 34 EUROPE CLEANERS AND DETERGENTS IN CHELATING AGENTS MARKET, BY REGION, 2016-2030 (USD MILLION)
TABLE 35 EUROPE CLEANERS AND DETERGENTS IN CHELATING AGENTS MARKET, BY FORM, 2016-2030 (USD MILLION)
TABLE 36 EUROPE INDUSTRIAL CLEANING/DESCALING IN CHELATING AGENTS MARKET, BY REGION, 2016-2030 (USD MILLION)
TABLE 37 EUROPE INDUSTRIAL CLEANING/DESCALING IN CHELATING AGENTS MARKET, BY FORM, 2016-2030 (USD MILLION)
TABLE 38 EUROPE MINING IN CHELATING AGENTS MARKET, BY REGION, 2016-2030 (USD MILLION)
TABLE 39 EUROPE MINING IN CHELATING AGENTS MARKET, BY FORM, 2016-2030 (USD MILLION)
TABLE 40 EUROPE TEXTILE PROCESSING IN CHELATING AGENTS MARKET, BY REGION, 2016-2030 (USD MILLION)
TABLE 41 EUROPE TEXTILE PROCESSING IN CHELATING AGENTS MARKET, BY FORM, 2016-2030 (USD MILLION)
TABLE 42 EUROPE OIL AND GAS IN CHELATING AGENTS MARKET, BY REGION, 2016-2030 (USD MILLION)
TABLE 43 EUROPE OIL AND GAS IN CHELATING AGENTS MARKET, BY FORM, 2016-2030 (USD MILLION)
TABLE 44 EUROPE POLYMER PRODUCTION IN CHELATING AGENTS MARKET, BY REGION, 2016-2030 (USD MILLION)
TABLE 45 EUROPE POLYMER PRODUCTION IN CHELATING AGENTS MARKET, BY FROM, 2016-2030 (USD MILLION)
TABLE 46 EUROPE BUILDING AND CONSTRUCTION IN CHELATING AGENTS MARKET, BY REGION, 2016-2030 (USD MILLION)
TABLE 47 EUROPE BUILDING AND CONSTRUCTION IN CHELATING AGENTS MARKET, BY FORM, 2016-2030 (USD MILLION)
TABLE 48 EUROPE PHOTOGRAPHY IN CHELATING AGENTS MARKET, BY REGION, 2016-2030 (USD MILLION)
TABLE 49 EUROPE PHOTOGRAPHY IN CHELATING AGENTS MARKET, BY FORM, 2016-2030 (USD MILLION)
TABLE 50 EUROPE ELECTRICAL AND ELECTRONICS IN CHELATING AGENTS MARKET, BY REGION, 2016-2030 (USD MILLION)
TABLE 51 EUROPE ELECTRICAL AND ELECTRONICS IN CHELATING AGENTS MARKET, BY FORM, 2016-2030 (USD MILLION)
TABLE 52 EUROPE FOOD AND FEED ADDITIVES IN CHELATING AGENTS MARKET, BY REGION, 2016-2030 (USD MILLION)
TABLE 53 EUROPE FOOD AND FEED ADDITIVES IN CHELATING AGENTS MARKET, BY FORM, 2016-2030 (USD MILLION)
TABLE 54 EUROPE PERSONAL CARE IN CHELATING AGENTS MARKET, BY REGION, 2016-2030 (USD MILLION)
TABLE 55 EUROPE PERSONAL CARE IN CHELATING AGENTS MARKET, BY FORM, 2016-2030 (USD MILLION)
TABLE 56 EUROPE PHARMACEUTICALS IN CHELATING AGENTS MARKET, BY REGION, 2016-2030 (USD MILLION)
TABLE 57 EUROPE PHARMACEUTICALS IN CHELATING AGENTS MARKET BY FORM, 2016-2030 (USD MILLION)
TABLE 58 EUROPE OTHERS IN CHELATING AGENTS MARKET, BY REGION, 2016-2030 (USD MILLION)
TABLE 59 EUROPE CHELATING AGENTS MARKET, OTHERS BY TYPE, 2016-2030 (USD MILLION)
TABLE 60 EUROPE CHELATING AGENTS MARKET, COUNTRY, 2016-2030 (USD MILLION)
TABLE 61 EUROPE CHELATING AGENTS MARKET, COUNTRY, 2016-2030 (TONS)
TABLE 62 EUROPE CHELATING AGENTS MARKET, TYPE, 2016-2030 (USD MILLION)
TABLE 63 EUROPE CHELATING AGENTS MARKET, BY TYPE, 2016-2030 (TONS)
TABLE 64 EUROPE SYNTHETIC IN CHELATING AGENTS MARKET, BY TYPE, 2016-2030 (USD MILLION)
TABLE 65 EUROPE SYNTHETIC IN CHELATING AGENTS MARKET, BY TYPE, 2016-2030 (TONS)
TABLE 66 EUROPE AMINOPOLYCARBOLXYLATES (APCS) IN CHELATING AGENTS MARKET, BY TYPE, 2016-2030 (USD MILLION)
TABLE 67 EUROPE AMINOPOLYCARBOLXYLATES (APCS) IN CHELATING AGENTS MARKET, BY TYPE, 2016-2030 (TONS)
TABLE 68 EUROPE ORGANOPHOSPHATES IN CHELATING AGENTS MARKET, BY TYPE, 2016-2030 (USD MILLION)
TABLE 69 EUROPE ORGANOPHOSPHATES IN CHELATING AGENTS MARKET, BY TYPE, 2016-2030 (TONS)
TABLE 70 EUROPE ORGANIC ACIDS IN CHELATING AGENTS MARKET, BY TYPE, 2016-2030 (USD MILLION)
TABLE 71 EUROPE ORGANIC ACIDS IN CHELATING AGENTS MARKET, BY TYPE, 2016-2030 (TONS)
TABLE 72 EUROPE NATURAL IN CHELATING AGENTS MARKET, BY TYPE, 2016-2030 (USD MILLION)
TABLE 73 EUROPE NATURAL IN CHELATING AGENTS MARKET, BY TYPE, 2016-2030 (TONS)
TABLE 74 EUROPE CHELATING AGENTS MARKET, BY FORM, 2016-2030 (USD MILLION)
TABLE 75 EUROPE CHELATING AGENTS MARKET, BY FORM, 2016-2030 (TONS)
TABLE 76 EUROPE BIODEGRADABLE IN CHELATING AGENTS MARKET, BY FORM, 2016-2030 (USD MILLION)
TABLE 77 EUROPE BIODEGRADABLE IN CHELATING AGENTS MARKET, BY FORM, 2016-2030 (TONS)
TABLE 78 EUROPE CHELATING AGENTS MARKET, BY DISTRIBUTION CHANNEL, 2016-2030 (USD MILLION)
TABLE 79 EUROPE CHELATING AGENTS MARKET, BY DISTRIBUTION CHANNEL, 2016-2030 (TONS)
TABLE 80 EUROPE CHELATING AGENTS MARKET, BY END-USER, 2016-2030 (USD MILLION)
TABLE 81 EUROPE CHELATING AGENTS MARKET, BY END-USER, 2016-2030 (TONS)
TABLE 82 EUROPE PULP AND PAPER IN CHELATING AGENTS MARKET, BY FORM, 2016-2030 (USD MILLION)
TABLE 83 EUROPE AGRICULTURE IN CHELATING AGENTS MARKET, BY TYPE, 2016-2030 (USD MILLION)
TABLE 84 EUROPE CLEANERS AND DETERGENTS IN CHELATING AGENTS MARKET, BY FORM, 2016-2030 (USD MILLION)
TABLE 85 EUROPE INDUSTRIAL CLEANING/DESCALING IN CHELATING AGENTS MARKET, BY FORM, 2016-2030 (USD MILLION)
TABLE 86 EUROPE MINING IN CHELATING AGENTS MARKET, BY FORM, 2016-2030 (USD MILLION)
TABLE 87 EUROPE TEXTILE PROCESSING IN CHELATING AGENTS MARKET, BY FORM, 2016-2030 (USD MILLION)
TABLE 88 EUROPE OIL AND GAS IN CHELATING AGENTS MARKET, BY TYPE, 2016-2030 (USD MILLION)
TABLE 89 EUROPE POLYMER PRODUCTION IN CHELATING AGENTS MARKET, BY FORM, 2016-2030 (USD MILLION)
TABLE 90 EUROPE BUILDING AND CONSTRUCTION IN CHELATING AGENTS MARKET, BY FORM, 2016-2030 (USD MILLION)
TABLE 91 EUROPE PHOTOGRAPHY IN CHELATING AGENTS MARKET, BY FORM, 2016-2030 (USD MILLION)
TABLE 92 EUROPE ELECTRICAL AND ELECTRONICS IN CHELATING AGENTS MARKET, BY FORM, 2016-2030 (USD MILLION)
TABLE 93 EUROPE FOOD AND FEED ADDITIVES IN CHELATING AGENTS MARKET, BY FORM, 2016-2030 (USD MILLION)
TABLE 94 EUROPE PERSONAL CARE IN CHELATING AGENTS MARKET, BY FORM, 2016-2030 (USD MILLION)
TABLE 95 EUROPE PHARMACEUTICALS IN CHELATING AGENTS MARKET, BY FORM, 2016-2030 (USD MILLION)
TABLE 96 EUROPE OTHERS IN CHELATING AGENTS MARKET, BY FORM, 2016-2030 (USD MILLION)
TABLE 97 GERMANY CHELATING AGENTS MARKET, BY TYPE, 2016-2030 (USD MILLION)
TABLE 98 GERMANY CHELATING AGENTS MARKET, BY TYPE, 2016-2030 (TONS)
TABLE 99 GERMANY SYNTHETIC IN CHELATING AGENTS MARKET, BY TYPE, 2016-2030 (USD MILLION)
TABLE 100 GERMANY SYNTHETIC IN CHELATING AGENTS MARKET, BY TYPE, 2016-2030 (TONS)
TABLE 101 GERMANY AMINOPOLYCARBOLXYLATES (APCS) IN CHELATING AGENTS MARKET, BY TYPE, 2016-2030 (USD MILLION)
TABLE 102 GERMANY AMINOPOLYCARBOLXYLATES (APCS) IN CHELATING AGENTS MARKET, BY TYPE, 2016-2030 (TONS)
TABLE 103 GERMANY ORGANOPHOSPHATES IN CHELATING AGENTS MARKET, BY TYPE, 2016-2030 (USD MILLION)
TABLE 104 GERMANY ORGANOPHOSPHATES IN CHELATING AGENTS MARKET, BY TYPE, 2016-2030 (TONS)
TABLE 105 GERMANY ORGANIC ACIDS IN CHELATING AGENTS MARKET, BY TYPE, 2016-2030 (USD MILLION)
TABLE 106 GERMANY ORGANIC ACIDS IN CHELATING AGENTS MARKET, BY TYPE, 2016-2030 (TONS)
TABLE 107 GERMANY NATURAL IN CHELATING AGENTS MARKET, BY TYPE, 2016-2030 (USD MILLION)
TABLE 108 GERMANY NATURAL IN CHELATING AGENTS MARKET, BY TYPE, 2016-2030 (TONS)
TABLE 109 GERMANY CHELATING AGENTS MARKET, BY FORM, 2016-2030 (USD MILLION)
TABLE 110 GERMANY CHELATING AGENTS MARKET, BY FORM, 2016-2030 (TONS)
TABLE 111 GERMANY BIODEGRADABLE IN CHELATING AGENTS MARKET, BY FORM, 2016-2030 (USD MILLION)
TABLE 112 GERMANY BIODEGRADABLE IN CHELATING AGENTS MARKET, BY FORM, 2016-2030 (TONS)
TABLE 113 GERMANY CHELATING AGENTS MARKET, BY DISTRIBUTION CHANNEL, 2016-2030 (USD MILLION)
TABLE 114 GERMANY CHELATING AGENTS MARKET, BY DISTRIBUTION CHANNEL, 2016-2030 (TONS)
TABLE 115 GERMANY CHELATING AGENTS MARKET, BY END-USER, 2016-2030 (USD MILLION)
TABLE 116 GERMANY CHELATING AGENTS MARKET, BY END-USER, 2016-2030 (TONS)
TABLE 117 GERMANY PULP AND PAPER IN CHELATING AGENTS MARKET, BY FORM, 2016-2030 (USD MILLION)
TABLE 118 GERMANY AGRICULTURE IN CHELATING AGENTS MARKET, BY TYPE, 2016-2030 (USD MILLION)
TABLE 119 GERMANY CLEANERS AND DETERGENTS IN CHELATING AGENTS MARKET, BY FORM, 2016-2030 (USD MILLION)
TABLE 120 GERMANY INDUSTRIAL CLEANING/DESCALING IN CHELATING AGENTS MARKET, BY FORM, 2016-2030 (USD MILLION)
TABLE 121 GERMANY MINING IN CHELATING AGENTS MARKET, BY FORM, 2016-2030 (USD MILLION)
TABLE 122 GERMANY TEXTILE PROCESSING IN CHELATING AGENTS MARKET, BY FORM, 2016-2030 (USD MILLION)
TABLE 123 GERMANY OIL AND GAS IN CHELATING AGENTS MARKET, BY TYPE, 2016-2030 (USD MILLION)
TABLE 124 GERMANY POLYMER PRODUCTION IN CHELATING AGENTS MARKET, BY FORM, 2016-2030 (USD MILLION)
TABLE 125 GERMANY BUILDING AND CONSTRUCTION IN CHELATING AGENTS MARKET, BY FORM, 2016-2030 (USD MILLION)
TABLE 126 GERMANY PHOTOGRAPHY IN CHELATING AGENTS MARKET, BY FORM, 2016-2030 (USD MILLION)
TABLE 127 GERMANY ELECTRICAL AND ELECTRONICS IN CHELATING AGENTS MARKET, BY FORM, 2016-2030 (USD MILLION)
TABLE 128 GERMANY FOOD AND FEED ADDITIVES IN CHELATING AGENTS MARKET, BY FORM, 2016-2030 (USD MILLION)
TABLE 129 GERMANY PERSONAL CARE IN CHELATING AGENTS MARKET, BY FORM, 2016-2030 (USD MILLION)
TABLE 130 GERMANY PHARMACEUTICALS IN CHELATING AGENTS MARKET, BY FORM, 2016-2030 (USD MILLION)
TABLE 131 GERMANY OTHERS IN CHELATING AGENTS MARKET, BY FORM, 2016-2030 (USD MILLION)
TABLE 132 U.K. CHELATING AGENTS MARKET, BY TYPE, 2016-2030 (USD MILLION)
TABLE 133 U.K. CHELATING AGENTS MARKET, BY TYPE, 2016-2030 (TONS)
TABLE 134 U.K. SYNTHETIC IN CHELATING AGENTS MARKET, BY TYPE, 2016-2030 (USD MILLION)
TABLE 135 U.K. SYNTHETIC IN CHELATING AGENTS MARKET, BY TYPE, 2016-2030 (TONS)
TABLE 136 U.K. AMINOPOLYCARBOLXYLATES (APCS) IN CHELATING AGENTS MARKET, BY TYPE, 2016-2030 (USD MILLION)
TABLE 137 U.K. AMINOPOLYCARBOLXYLATES (APCS) IN CHELATING AGENTS MARKET, BY TYPE, 2016-2030 (TONS)
TABLE 138 U.K. ORGANOPHOSPHATES IN CHELATING AGENTS MARKET, BY TYPE, 2016-2030 (USD MILLION)
TABLE 139 U.K. ORGANOPHOSPHATES IN CHELATING AGENTS MARKET, BY TYPE, 2016-2030 (TONS)
TABLE 140 U.K. ORGANIC ACIDS IN CHELATING AGENTS MARKET, BY TYPE, 2016-2030 (USD MILLION)
TABLE 141 U.K. ORGANIC ACIDS IN CHELATING AGENTS MARKET, BY TYPE, 2016-2030 (TONS)
TABLE 142 U.K. NATURAL IN CHELATING AGENTS MARKET, BY TYPE, 2016-2030 (USD MILLION)
TABLE 143 U.K. NATURAL IN CHELATING AGENTS MARKET, BY TYPE, 2016-2030 (TONS)
TABLE 144 U.K. CHELATING AGENTS MARKET, BY FORM, 2016-2030 (USD MILLION)
TABLE 145 U.K. CHELATING AGENTS MARKET, BY FORM, 2016-2030 (TONS)
TABLE 146 U.K. BIODEGRADABLE IN CHELATING AGENTS MARKET, BY FORM, 2016-2030 (USD MILLION)
TABLE 147 U.K. BIODEGRADABLE IN CHELATING AGENTS MARKET, BY FORM, 2016-2030 (TONS)
TABLE 148 U.K. CHELATING AGENTS MARKET, BY DISTRIBUTION CHANNEL, 2016-2030 (USD MILLION)
TABLE 149 U.K. CHELATING AGENTS MARKET, BY DISTRIBUTION CHANNEL, 2016-2030 (TONS)
TABLE 150 U.K. CHELATING AGENTS MARKET, BY END-USER, 2016-2030 (USD MILLION)
TABLE 151 U.K. CHELATING AGENTS MARKET, BY END-USER, 2016-2030 (TONS)
TABLE 152 U.K. PULP AND PAPER IN CHELATING AGENTS MARKET, BY FORM, 2016-2030 (USD MILLION)
TABLE 153 U.K. AGRICULTURE IN CHELATING AGENTS MARKET, BY TYPE, 2016-2030 (USD MILLION)
TABLE 154 U.K. CLEANERS AND DETERGENTS IN CHELATING AGENTS MARKET, BY FORM, 2016-2030 (USD MILLION)
TABLE 155 U.K. INDUSTRIAL CLEANING/DESCALING IN CHELATING AGENTS MARKET, BY FORM, 2016-2030 (USD MILLION)
TABLE 156 U.K. MINING IN CHELATING AGENTS MARKET, BY FORM, 2016-2030 (USD MILLION)
TABLE 157 U.K. TEXTILE PROCESSING IN CHELATING AGENTS MARKET, BY FORM, 2016-2030 (USD MILLION)
TABLE 158 U.K. OIL AND GAS IN CHELATING AGENTS MARKET, BY TYPE, 2016-2030 (USD MILLION)
TABLE 159 U.K. POLYMER PRODUCTION IN CHELATING AGENTS MARKET, BY FORM, 2016-2030 (USD MILLION)
TABLE 160 U.K. BUILDING AND CONSTRUCTION IN CHELATING AGENTS MARKET, BY FORM, 2016-2030 (USD MILLION)
TABLE 161 U.K. PHOTOGRAPHY IN CHELATING AGENTS MARKET, BY FORM, 2016-2030 (USD MILLION)
TABLE 162 U.K. ELECTRICAL AND ELECTRONICS IN CHELATING AGENTS MARKET, BY FORM, 2016-2030 (USD MILLION)
TABLE 163 U.K. FOOD AND FEED ADDITIVES IN CHELATING AGENTS MARKET, BY FORM, 2016-2030 (USD MILLION)
TABLE 164 U.K. PERSONAL CARE IN CHELATING AGENTS MARKET, BY FORM, 2016-2030 (USD MILLION)
TABLE 165 U.K. PHARMACEUTICALS IN CHELATING AGENTS MARKET, BY FORM, 2016-2030 (USD MILLION)
TABLE 166 U.K. OTHERS IN CHELATING AGENTS MARKET, BY FORM, 2016-2030 (USD MILLION)
TABLE 167 FRANCE CHELATING AGENTS MARKET, BY TYPE, 2016-2030 (USD MILLION)
TABLE 168 FRANCE CHELATING AGENTS MARKET, BY TYPE, 2016-2030 (TONS)
TABLE 169 FRANCE SYNTHETIC IN CHELATING AGENTS MARKET, BY TYPE, 2016-2030 (USD MILLION)
TABLE 170 FRANCE SYNTHETIC IN CHELATING AGENTS MARKET, BY TYPE, 2016-2030 (TONS)
TABLE 171 FRANCE AMINOPOLYCARBOLXYLATES (APCS) IN CHELATING AGENTS MARKET, BY TYPE, 2016-2030 (USD MILLION)
TABLE 172 FRANCE AMINOPOLYCARBOLXYLATES (APCS) IN CHELATING AGENTS MARKET, BY TYPE, 2016-2030 (TONS)
TABLE 173 FRANCE ORGANOPHOSPHATES IN CHELATING AGENTS MARKET, BY TYPE, 2016-2030 (USD MILLION)
TABLE 174 FRANCE ORGANOPHOSPHATES IN CHELATING AGENTS MARKET, BY TYPE, 2016-2030 (TONS)
TABLE 175 FRANCE ORGANIC ACIDS IN CHELATING AGENTS MARKET, BY TYPE, 2016-2030 (USD MILLION)
TABLE 176 FRANCE ORGANIC ACIDS IN CHELATING AGENTS MARKET, BY TYPE, 2016-2030 (TONS)
TABLE 177 FRANCE NATURAL IN CHELATING AGENTS MARKET, BY TYPE, 2016-2030 (USD MILLION)
TABLE 178 FRANCE NATURAL IN CHELATING AGENTS MARKET, BY TYPE, 2016-2030 (TONS)
TABLE 179 FRANCE CHELATING AGENTS MARKET, BY FORM, 2016-2030 (USD MILLION)
TABLE 180 FRANCE CHELATING AGENTS MARKET, BY FORM, 2016-2030 (TONS)
TABLE 181 FRANCE BIODEGRADABLE IN CHELATING AGENTS MARKET, BY FORM, 2016-2030 (USD MILLION)
TABLE 182 FRANCE BIODEGRADABLE IN CHELATING AGENTS MARKET, BY FORM, 2016-2030 (TONS)
TABLE 183 FRANCE CHELATING AGENTS MARKET, BY DISTRIBUTION CHANNEL, 2016-2030 (USD MILLION)
TABLE 184 FRANCE CHELATING AGENTS MARKET, BY DISTRIBUTION CHANNEL, 2016-2030 (TONS)
TABLE 185 FRANCE CHELATING AGENTS MARKET, BY END-USER, 2016-2030 (USD MILLION)
TABLE 186 FRANCE CHELATING AGENTS MARKET, BY END-USER, 2016-2030 (TONS)
TABLE 187 FRANCE PULP AND PAPER IN CHELATING AGENTS MARKET, BY FORM, 2016-2030 (USD MILLION)
TABLE 188 FRANCE AGRICULTURE IN CHELATING AGENTS MARKET, BY TYPE, 2016-2030 (USD MILLION)
TABLE 189 FRANCE CLEANERS AND DETERGENTS IN CHELATING AGENTS MARKET, BY FORM, 2016-2030 (USD MILLION)
TABLE 190 FRANCE INDUSTRIAL CLEANING/DESCALING IN CHELATING AGENTS MARKET, BY FORM, 2016-2030 (USD MILLION)
TABLE 191 FRANCE MINING IN CHELATING AGENTS MARKET, BY FORM, 2016-2030 (USD MILLION)
TABLE 192 FRANCE TEXTILE PROCESSING IN CHELATING AGENTS MARKET, BY FORM, 2016-2030 (USD MILLION)
TABLE 193 FRANCE OIL AND GAS IN CHELATING AGENTS MARKET, BY TYPE, 2016-2030 (USD MILLION)
TABLE 194 FRANCE POLYMER PRODUCTION IN CHELATING AGENTS MARKET, BY FORM, 2016-2030 (USD MILLION)
TABLE 195 FRANCE BUILDING AND CONSTRUCTION IN CHELATING AGENTS MARKET, BY FORM, 2016-2030 (USD MILLION)
TABLE 196 FRANCE PHOTOGRAPHY IN CHELATING AGENTS MARKET, BY FORM, 2016-2030 (USD MILLION)
TABLE 197 FRANCE ELECTRICAL AND ELECTRONICS IN CHELATING AGENTS MARKET, BY FORM, 2016-2030 (USD MILLION)
TABLE 198 FRANCE FOOD AND FEED ADDITIVES IN CHELATING AGENTS MARKET, BY FORM, 2016-2030 (USD MILLION)
TABLE 199 FRANCE PERSONAL CARE IN CHELATING AGENTS MARKET, BY FORM, 2016-2030 (USD MILLION)
TABLE 200 FRANCE PHARMACEUTICALS IN CHELATING AGENTS MARKET, BY FORM, 2016-2030 (USD MILLION)
TABLE 201 FRANCE OTHERS IN CHELATING AGENTS MARKET, BY FORM, 2016-2030 (USD MILLION)
TABLE 202 ITALY CHELATING AGENTS MARKET, BY TYPE, 2016-2030 (USD MILLION)
TABLE 203 ITALY CHELATING AGENTS MARKET, BY TYPE, 2016-2030 (TONS)
TABLE 204 ITALY SYNTHETIC IN CHELATING AGENTS MARKET, BY TYPE, 2016-2030 (USD MILLION)
TABLE 205 ITALY SYNTHETIC IN CHELATING AGENTS MARKET, BY TYPE, 2016-2030 (TONS)
TABLE 206 ITALY AMINOPOLYCARBOLXYLATES (APCS) IN CHELATING AGENTS MARKET, BY TYPE, 2016-2030 (USD MILLION)
TABLE 207 ITALY AMINOPOLYCARBOLXYLATES (APCS) IN CHELATING AGENTS MARKET, BY TYPE, 2016-2030 (TONS)
TABLE 208 ITALY ORGANOPHOSPHATES IN CHELATING AGENTS MARKET, BY TYPE, 2016-2030 (USD MILLION)
TABLE 209 ITALY ORGANOPHOSPHATES IN CHELATING AGENTS MARKET, BY TYPE, 2016-2030 (TONS)
TABLE 210 ITALY ORGANIC ACIDS IN CHELATING AGENTS MARKET, BY TYPE, 2016-2030 (USD MILLION)
TABLE 211 ITALY ORGANIC ACIDS IN CHELATING AGENTS MARKET, BY TYPE, 2016-2030 (TONS)
TABLE 212 ITALY NATURAL IN CHELATING AGENTS MARKET, BY TYPE, 2016-2030 (USD MILLION)
TABLE 213 ITALY NATURAL IN CHELATING AGENTS MARKET, BY TYPE, 2016-2030 (TONS)
TABLE 214 ITALY CHELATING AGENTS MARKET, BY FORM, 2016-2030 (USD MILLION)
TABLE 215 ITALY CHELATING AGENTS MARKET, BY FORM, 2016-2030 (TONS)
TABLE 216 ITALY BIODEGRADABLE IN CHELATING AGENTS MARKET, BY FORM, 2016-2030 (USD MILLION)
TABLE 217 ITALY BIODEGRADABLE IN CHELATING AGENTS MARKET, BY FORM, 2016-2030 (TONS)
TABLE 218 ITALY CHELATING AGENTS MARKET, BY DISTRIBUTION CHANNEL, 2016-2030 (USD MILLION)
TABLE 219 ITALY CHELATING AGENTS MARKET, BY DISTRIBUTION CHANNEL, 2016-2030 (TONS)
TABLE 220 ITALY CHELATING AGENTS MARKET, BY END-USER, 2016-2030 (USD MILLION)
TABLE 221 ITALY CHELATING AGENTS MARKET, BY END-USER, 2016-2030 (TONS)
TABLE 222 ITALY PULP AND PAPER IN CHELATING AGENTS MARKET, BY FORM, 2016-2030 (USD MILLION)
TABLE 223 U.S. AGRICULTURE IN CHELATING AGENTS MARKET, BY TYPE, 2016-2030 (USD MILLION)
TABLE 224 ITALY CLEANERS AND DETERGENTS IN CHELATING AGENTS MARKET, BY FORM, 2016-2030 (USD MILLION)
TABLE 225 ITALY INDUSTRIAL CLEANING/DESCALING IN CHELATING AGENTS MARKET, BY FORM, 2016-2030 (USD MILLION)
TABLE 226 ITALY MINING IN CHELATING AGENTS MARKET, BY FORM, 2016-2030 (USD MILLION)
TABLE 227 ITALY TEXTILE PROCESSING IN CHELATING AGENTS MARKET, BY FORM, 2016-2030 (USD MILLION)
TABLE 228 ITALY OIL AND GAS IN CHELATING AGENTS MARKET, BY TYPE, 2016-2030 (USD MILLION)
TABLE 229 ITALY POLYMER PRODUCTION IN CHELATING AGENTS MARKET, BY FORM, 2016-2030 (USD MILLION)
TABLE 230 ITALY BUILDING AND CONSTRUCTION IN CHELATING AGENTS MARKET, BY FORM, 2016-2030 (USD MILLION)
TABLE 231 ITALY PHOTOGRAPHY IN CHELATING AGENTS MARKET, BY FORM, 2016-2030 (USD MILLION)
TABLE 232 ITALY ELECTRICAL AND ELECTRONICS IN CHELATING AGENTS MARKET, BY FORM, 2016-2030 (USD MILLION)
TABLE 233 ITALY FOOD AND FEED ADDITIVES IN CHELATING AGENTS MARKET, BY FORM, 2016-2030 (USD MILLION)
TABLE 234 ITALY PERSONAL CARE IN CHELATING AGENTS MARKET, BY FORM, 2016-2030 (USD MILLION)
TABLE 235 ITALY PHARMACEUTICALS IN CHELATING AGENTS MARKET, BY FORM, 2016-2030 (USD MILLION)
TABLE 236 ITALY OTHERS IN CHELATING AGENTS MARKET, BY FORM, 2016-2030 (USD MILLION)
TABLE 237 SPAIN CHELATING AGENTS MARKET, BY TYPE, 2016-2030 (USD MILLION)
TABLE 238 SPAIN CHELATING AGENTS MARKET, BY TYPE, 2016-2030 (TONS)
TABLE 239 SPAIN SYNTHETIC IN CHELATING AGENTS MARKET, BY TYPE, 2016-2030 (USD MILLION)
TABLE 240 SPAIN SYNTHETIC IN CHELATING AGENTS MARKET, BY TYPE, 2016-2030 (TONS)
TABLE 241 SPAIN AMINOPOLYCARBOLXYLATES (APCS) IN CHELATING AGENTS MARKET, BY TYPE, 2016-2030 (USD MILLION)
TABLE 242 SPAIN AMINOPOLYCARBOLXYLATES (APCS) IN CHELATING AGENTS MARKET, BY TYPE, 2016-2030 (TONS)
TABLE 243 SPAIN ORGANOPHOSPHATES IN CHELATING AGENTS MARKET, BY TYPE, 2016-2030 (USD MILLION)
TABLE 244 SPAIN ORGANOPHOSPHATES IN CHELATING AGENTS MARKET, BY TYPE, 2016-2030 (TONS)
TABLE 245 SPAIN ORGANIC ACIDS IN CHELATING AGENTS MARKET, BY TYPE, 2016-2030 (USD MILLION)
TABLE 246 SPAIN ORGANIC ACIDS IN CHELATING AGENTS MARKET, BY TYPE, 2016-2030 (TONS)
TABLE 247 SPAIN NATURAL IN CHELATING AGENTS MARKET, BY TYPE, 2016-2030 (USD MILLION)
TABLE 248 SPAIN NATURAL IN CHELATING AGENTS MARKET, BY TYPE, 2016-2030 (TONS)
TABLE 249 SPAIN CHELATING AGENTS MARKET, BY FORM, 2016-2030 (USD MILLION)
TABLE 250 SPAIN CHELATING AGENTS MARKET, BY FORM, 2016-2030 (TONS)
TABLE 251 SPAIN BIODEGRADABLE IN CHELATING AGENTS MARKET, BY FORM, 2016-2030 (USD MILLION)
TABLE 252 SPAIN BIODEGRADABLE IN CHELATING AGENTS MARKET, BY FORM, 2016-2030 (TONS)
TABLE 253 SPAIN CHELATING AGENTS MARKET, BY DISTRIBUTION CHANNEL, 2016-2030 (USD MILLION)
TABLE 254 SPAIN CHELATING AGENTS MARKET, BY DISTRIBUTION CHANNEL, 2016-2030 (TONS)
TABLE 255 SPAIN CHELATING AGENTS MARKET, BY END-USER, 2016-2030 (USD MILLION)
TABLE 256 SPAIN CHELATING AGENTS MARKET, BY END-USER, 2016-2030 (TONS)
TABLE 257 SPAIN PULP AND PAPER IN CHELATING AGENTS MARKET, BY FORM, 2016-2030 (USD MILLION)
TABLE 258 SPAIN AGRICULTURE IN CHELATING AGENTS MARKET, BY TYPE, 2016-2030 (USD MILLION)
TABLE 259 SPAIN CLEANERS AND DETERGENTS IN CHELATING AGENTS MARKET, BY FORM, 2016-2030 (USD MILLION)
TABLE 260 SPAIN INDUSTRIAL CLEANING/DESCALING IN CHELATING AGENTS MARKET, BY FORM, 2016-2030 (USD MILLION)
TABLE 261 SPAIN MINING IN CHELATING AGENTS MARKET, BY FORM, 2016-2030 (USD MILLION)
TABLE 262 SPAIN TEXTILE PROCESSING IN CHELATING AGENTS MARKET, BY FORM, 2016-2030 (USD MILLION)
TABLE 263 SPAIN OIL AND GAS IN CHELATING AGENTS MARKET, BY TYPE, 2016-2030 (USD MILLION)
TABLE 264 SPAIN POLYMER PRODUCTION IN CHELATING AGENTS MARKET, BY FORM, 2016-2030 (USD MILLION)
TABLE 265 SPAIN BUILDING AND CONSTRUCTION IN CHELATING AGENTS MARKET, BY FORM, 2016-2030 (USD MILLION)
TABLE 266 SPAIN PHOTOGRAPHY IN CHELATING AGENTS MARKET, BY FORM, 2016-2030 (USD MILLION)
TABLE 267 SPAIN ELECTRICAL AND ELECTRONICS IN CHELATING AGENTS MARKET, BY FORM, 2016-2030 (USD MILLION)
TABLE 268 SPAIN FOOD AND FEED ADDITIVES IN CHELATING AGENTS MARKET, BY FORM, 2016-2030 (USD MILLION)
TABLE 269 SPAIN PERSONAL CARE IN CHELATING AGENTS MARKET, BY FORM, 2016-2030 (USD MILLION)
TABLE 270 SPAIN PHARMACEUTICALS IN CHELATING AGENTS MARKET, BY FORM, 2016-2030 (USD MILLION)
TABLE 271 SPAIN OTHERS IN CHELATING AGENTS MARKET, BY FORM, 2016-2030 (USD MILLION)
TABLE 272 NETHERLANDS CHELATING AGENTS MARKET, BY TYPE, 2016-2030 (USD MILLION)
TABLE 273 NETHERLANDS CHELATING AGENTS MARKET, BY TYPE, 2016-2030 (TONS)
TABLE 274 NETHERLANDS SYNTHETIC IN CHELATING AGENTS MARKET, BY TYPE, 2016-2030 (USD MILLION)
TABLE 275 NETHERLANDS SYNTHETIC IN CHELATING AGENTS MARKET, BY TYPE, 2016-2030 (TONS)
TABLE 276 NETHERLANDS AMINOPOLYCARBOLXYLATES (APCS) IN CHELATING AGENTS MARKET, BY TYPE, 2016-2030 (USD MILLION)
TABLE 277 NETHERLANDS AMINOPOLYCARBOLXYLATES (APCS) IN CHELATING AGENTS MARKET, BY TYPE, 2016-2030 (TONS)
TABLE 278 NETHERLANDS ORGANOPHOSPHATES IN CHELATING AGENTS MARKET, BY TYPE, 2016-2030 (USD MILLION)
TABLE 279 NETHERLANDS ORGANOPHOSPHATES IN CHELATING AGENTS MARKET, BY TYPE, 2016-2030 (TONS)
TABLE 280 NETHERLANDS ORGANIC ACIDS IN CHELATING AGENTS MARKET, BY TYPE, 2016-2030 (USD MILLION)
TABLE 281 NETHERLANDS ORGANIC ACIDS IN CHELATING AGENTS MARKET, BY TYPE, 2016-2030 (TONS)
TABLE 282 NETHERLANDS NATURAL IN CHELATING AGENTS MARKET, BY TYPE, 2016-2030 (USD MILLION)
TABLE 283 NETHERLANDS NATURAL IN CHELATING AGENTS MARKET, BY TYPE, 2016-2030 (TONS)
TABLE 284 NETHERLANDS CHELATING AGENTS MARKET, BY FORM, 2016-2030 (USD MILLION)
TABLE 285 NETHERLANDS CHELATING AGENTS MARKET, BY FORM, 2016-2030 (TONS)
TABLE 286 NETHERLANDS BIODEGRADABLE IN CHELATING AGENTS MARKET, BY FORM, 2016-2030 (USD MILLION)
TABLE 287 NETHERLANDS BIODEGRADABLE IN CHELATING AGENTS MARKET, BY FORM, 2016-2030 (TONS)
TABLE 288 NETHERLANDS CHELATING AGENTS MARKET, BY DISTRIBUTION CHANNEL, 2016-2030 (USD MILLION)
TABLE 289 NETHERLANDS CHELATING AGENTS MARKET, BY DISTRIBUTION CHANNEL, 2016-2030 (TONS)
TABLE 290 NETHERLANDS CHELATING AGENTS MARKET, BY END-USER, 2016-2030 (USD MILLION)
TABLE 291 NETHERLANDS CHELATING AGENTS MARKET, BY END-USER, 2016-2030 (TONS)
TABLE 292 NETHERLANDS PULP AND PAPER IN CHELATING AGENTS MARKET, BY FORM, 2016-2030 (USD MILLION)
TABLE 293 NETHERLANDS AGRICULTURE IN CHELATING AGENTS MARKET, BY TYPE, 2016-2030 (USD MILLION)
TABLE 294 NETHERLANDS CLEANERS AND DETERGENTS IN CHELATING AGENTS MARKET, BY FORM, 2016-2030 (USD MILLION)
TABLE 295 NETHERLANDS INDUSTRIAL CLEANING/DESCALING IN CHELATING AGENTS MARKET, BY FORM, 2016-2030 (USD MILLION)
TABLE 296 NETHERLANDS MINING IN CHELATING AGENTS MARKET, BY FORM, 2016-2030 (USD MILLION)
TABLE 297 NETHERLANDS TEXTILE PROCESSING IN CHELATING AGENTS MARKET, BY FORM, 2016-2030 (USD MILLION)
TABLE 298 NETHERLANDS OIL AND GAS IN CHELATING AGENTS MARKET, BY TYPE, 2016-2030 (USD MILLION)
TABLE 299 NETHERLANDS POLYMER PRODUCTION IN CHELATING AGENTS MARKET, BY FORM, 2016-2030 (USD MILLION)
TABLE 300 NETHERLANDS BUILDING AND CONSTRUCTION IN CHELATING AGENTS MARKET, BY FORM, 2016-2030 (USD MILLION)
TABLE 301 NETHERLANDS PHOTOGRAPHY IN CHELATING AGENTS MARKET, BY FORM, 2016-2030 (USD MILLION)
TABLE 302 NETHERLANDS ELECTRICAL AND ELECTRONICS IN CHELATING AGENTS MARKET, BY FORM, 2016-2030 (USD MILLION)
TABLE 303 NETHERLANDS FOOD AND FEED ADDITIVES IN CHELATING AGENTS MARKET, BY FORM, 2016-2030 (USD MILLION)
TABLE 304 NETHERLANDS PERSONAL CARE IN CHELATING AGENTS MARKET, BY FORM, 2016-2030 (USD MILLION)
TABLE 305 NETHERLANDS PHARMACEUTICALS IN CHELATING AGENTS MARKET, BY FORM, 2016-2030 (USD MILLION)
TABLE 306 NETHERLANDS OTHERS IN CHELATING AGENTS MARKET, BY FORM, 2016-2030 (USD MILLION)
TABLE 307 BELGIUM CHELATING AGENTS MARKET, BY TYPE, 2016-2030 (USD MILLION)
TABLE 308 BELGIUM CHELATING AGENTS MARKET, BY TYPE, 2016-2030 (TONS)
TABLE 309 BELGIUM SYNTHETIC IN CHELATING AGENTS MARKET, BY TYPE, 2016-2030 (USD MILLION)
TABLE 310 BELGIUM SYNTHETIC IN CHELATING AGENTS MARKET, BY TYPE, 2016-2030 (TONS)
TABLE 311 BELGIUM AMINOPOLYCARBOLXYLATES (APCS) IN CHELATING AGENTS MARKET, BY TYPE, 2016-2030 (USD MILLION)
TABLE 312 BELGIUM AMINOPOLYCARBOLXYLATES (APCS) IN CHELATING AGENTS MARKET, BY TYPE, 2016-2030 (TONS)
TABLE 313 BELGIUM ORGANOPHOSPHATES IN CHELATING AGENTS MARKET, BY TYPE, 2016-2030 (USD MILLION)
TABLE 314 BELGIUM ORGANOPHOSPHATES IN CHELATING AGENTS MARKET, BY TYPE, 2016-2030 (TONS)
TABLE 315 BELGIUM ORGANIC ACIDS IN CHELATING AGENTS MARKET, BY TYPE, 2016-2030 (USD MILLION)
TABLE 316 BELGIUM ORGANIC ACIDS IN CHELATING AGENTS MARKET, BY TYPE, 2016-2030 (TONS)
TABLE 317 BELGIUM NATURAL IN CHELATING AGENTS MARKET, BY TYPE, 2016-2030 (USD MILLION)
TABLE 318 BELGIUM NATURAL IN CHELATING AGENTS MARKET, BY TYPE, 2016-2030 (TONS)
TABLE 319 BELGIUM CHELATING AGENTS MARKET, BY FORM, 2016-2030 (USD MILLION)
TABLE 320 BELGIUM CHELATING AGENTS MARKET, BY FORM, 2016-2030 (TONS)
TABLE 321 BELGIUM BIODEGRADABLE IN CHELATING AGENTS MARKET, BY FORM, 2016-2030 (USD MILLION)
TABLE 322 BELGIUM BIODEGRADABLE IN CHELATING AGENTS MARKET, BY FORM, 2016-2030 (TONS)
TABLE 323 BELGIUM CHELATING AGENTS MARKET, BY DISTRIBUTION CHANNEL, 2016-2030 (USD MILLION)
TABLE 324 BELGIUM CHELATING AGENTS MARKET, BY DISTRIBUTION CHANNEL, 2016-2030 (TONS)
TABLE 325 BELGIUM CHELATING AGENTS MARKET, BY END-USER, 2016-2030 (USD MILLION)
TABLE 326 BELGIUM CHELATING AGENTS MARKET, BY END-USER, 2016-2030 (TONS)
TABLE 327 BELGIUM PULP AND PAPER IN CHELATING AGENTS MARKET, BY FORM, 2016-2030 (USD MILLION)
TABLE 328 BELGIUM AGRICULTURE IN CHELATING AGENTS MARKET, BY TYPE, 2016-2030 (USD MILLION)
TABLE 329 BELGIUM CLEANERS AND DETERGENTS IN CHELATING AGENTS MARKET, BY FORM, 2016-2030 (USD MILLION)
TABLE 330 BELGIUM INDUSTRIAL CLEANING/DESCALING IN CHELATING AGENTS MARKET, BY FORM, 2016-2030 (USD MILLION)
TABLE 331 BELGIUM MINING IN CHELATING AGENTS MARKET, BY FORM, 2016-2030 (USD MILLION)
TABLE 332 BELGIUM TEXTILE PROCESSING IN CHELATING AGENTS MARKET, BY FORM, 2016-2030 (USD MILLION)
TABLE 333 BELGIUM OIL AND GAS IN CHELATING AGENTS MARKET, BY TYPE, 2016-2030 (USD MILLION)
TABLE 334 BELGIUM POLYMER PRODUCTION IN CHELATING AGENTS MARKET, BY FORM, 2016-2030 (USD MILLION)
TABLE 335 BELGIUM BUILDING AND CONSTRUCTION IN CHELATING AGENTS MARKET, BY FORM, 2016-2030 (USD MILLION)
TABLE 336 BELGIUM PHOTOGRAPHY IN CHELATING AGENTS MARKET, BY FORM, 2016-2030 (USD MILLION)
TABLE 337 BELGIUM ELECTRICAL AND ELECTRONICS IN CHELATING AGENTS MARKET, BY FORM, 2016-2030 (USD MILLION)
TABLE 338 BELGIUM FOOD AND FEED ADDITIVES IN CHELATING AGENTS MARKET, BY FORM, 2016-2030 (USD MILLION)
TABLE 339 BELGIUM PERSONAL CARE IN CHELATING AGENTS MARKET, BY FORM, 2016-2030 (USD MILLION)
TABLE 340 BELGIUM PHARMACEUTICALS IN CHELATING AGENTS MARKET, BY FORM, 2016-2030 (USD MILLION)
TABLE 341 BELGIUM OTHERS IN CHELATING AGENTS MARKET, BY FORM, 2016-2030 (USD MILLION)
TABLE 342 RUSSIA CHELATING AGENTS MARKET, BY TYPE, 2016-2030 (USD MILLION)
TABLE 343 RUSSIA CHELATING AGENTS MARKET, BY TYPE, 2016-2030 (TONS)
TABLE 344 RUSSIA SYNTHETIC IN CHELATING AGENTS MARKET, BY TYPE, 2016-2030 (USD MILLION)
TABLE 345 RUSSIA SYNTHETIC IN CHELATING AGENTS MARKET, BY TYPE, 2016-2030 (TONS)
TABLE 346 RUSSIA AMINOPOLYCARBOLXYLATES (APCS) IN CHELATING AGENTS MARKET, BY TYPE, 2016-2030 (USD MILLION)
TABLE 347 RUSSIA AMINOPOLYCARBOLXYLATES (APCS) IN CHELATING AGENTS MARKET, BY TYPE, 2016-2030 (TONS)
TABLE 348 RUSSIA ORGANOPHOSPHATES IN CHELATING AGENTS MARKET, BY TYPE, 2016-2030 (USD MILLION)
TABLE 349 RUSSIA ORGANOPHOSPHATES IN CHELATING AGENTS MARKET, BY TYPE, 2016-2030 (TONS)
TABLE 350 RUSSIA ORGANIC ACIDS IN CHELATING AGENTS MARKET, BY TYPE, 2016-2030 (USD MILLION)
TABLE 351 RUSSIA ORGANIC ACIDS IN CHELATING AGENTS MARKET, BY TYPE, 2016-2030 (TONS)
TABLE 352 RUSSIA NATURAL IN CHELATING AGENTS MARKET, BY TYPE, 2016-2030 (USD MILLION)
TABLE 353 RUSSIA NATURAL IN CHELATING AGENTS MARKET, BY TYPE, 2016-2030 (TONS)
TABLE 354 RUSSIA CHELATING AGENTS MARKET, BY FORM, 2016-2030 (USD MILLION)
TABLE 355 RUSSIA CHELATING AGENTS MARKET, BY FORM, 2016-2030 (TONS)
TABLE 356 RUSSIA BIODEGRADABLE IN CHELATING AGENTS MARKET, BY FORM, 2016-2030 (USD MILLION)
TABLE 357 RUSSIA BIODEGRADABLE IN CHELATING AGENTS MARKET, BY FORM, 2016-2030 (TONS)
TABLE 358 RUSSIA CHELATING AGENTS MARKET, BY DISTRIBUTION CHANNEL, 2016-2030 (USD MILLION)
TABLE 359 RUSSIA CHELATING AGENTS MARKET, BY DISTRIBUTION CHANNEL, 2016-2030 (TONS)
TABLE 360 RUSSIA CHELATING AGENTS MARKET, BY END-USER, 2016-2030 (USD MILLION)
TABLE 361 RUSSIA CHELATING AGENTS MARKET, BY END-USER, 2016-2030 (TONS)
TABLE 362 RUSSIA PULP AND PAPER IN CHELATING AGENTS MARKET, BY FORM, 2016-2030 (USD MILLION)
TABLE 363 RUSSIA AGRICULTURE IN CHELATING AGENTS MARKET, BY TYPE, 2016-2030 (USD MILLION)
TABLE 364 RUSSIA CLEANERS AND DETERGENTS IN CHELATING AGENTS MARKET, BY FORM, 2016-2030 (USD MILLION)
TABLE 365 RUSSIA INDUSTRIAL CLEANING/DESCALING IN CHELATING AGENTS MARKET, BY FORM, 2016-2030 (USD MILLION)
TABLE 366 RUSSIA MINING IN CHELATING AGENTS MARKET, BY FORM, 2016-2030 (USD MILLION)
TABLE 367 RUSSIA TEXTILE PROCESSING IN CHELATING AGENTS MARKET, BY FORM, 2016-2030 (USD MILLION)
TABLE 368 RUSSIA OIL AND GAS IN CHELATING AGENTS MARKET, BY TYPE, 2016-2030 (USD MILLION)
TABLE 369 RUSSIA POLYMER PRODUCTION IN CHELATING AGENTS MARKET, BY FORM, 2016-2030 (USD MILLION)
TABLE 370 RUSSIA BUILDING AND CONSTRUCTION IN CHELATING AGENTS MARKET, BY FORM, 2016-2030 (USD MILLION)
TABLE 371 RUSSIA PHOTOGRAPHY IN CHELATING AGENTS MARKET, BY FORM, 2016-2030 (USD MILLION)
TABLE 372 RUSSIA ELECTRICAL AND ELECTRONICS IN CHELATING AGENTS MARKET, BY FORM, 2016-2030 (USD MILLION)
TABLE 373 RUSSIA FOOD AND FEED ADDITIVES IN CHELATING AGENTS MARKET, BY FORM, 2016-2030 (USD MILLION)
TABLE 374 RUSSIA PERSONAL CARE IN CHELATING AGENTS MARKET, BY FORM, 2016-2030 (USD MILLION)
TABLE 375 RUSSIA PHARMACEUTICALS IN CHELATING AGENTS MARKET, BY FORM, 2016-2030 (USD MILLION)
TABLE 376 RUSSIA OTHERS IN CHELATING AGENTS MARKET, BY FORM, 2016-2030 (USD MILLION)
TABLE 377 TURKEY CHELATING AGENTS MARKET, BY TYPE, 2016-2030 (USD MILLION)
TABLE 378 TURKEY CHELATING AGENTS MARKET, BY TYPE, 2016-2030 (TONS)
TABLE 379 TURKEY SYNTHETIC IN CHELATING AGENTS MARKET, BY TYPE, 2016-2030 (USD MILLION)
TABLE 380 TURKEY SYNTHETIC IN CHELATING AGENTS MARKET, BY TYPE, 2016-2030 (TONS)
TABLE 381 TURKEY AMINOPOLYCARBOLXYLATES (APCS) IN CHELATING AGENTS MARKET, BY TYPE, 2016-2030 (USD MILLION)
TABLE 382 TURKEY AMINOPOLYCARBOLXYLATES (APCS) IN CHELATING AGENTS MARKET, BY TYPE, 2016-2030 (TONS)
TABLE 383 TURKEY ORGANOPHOSPHATES IN CHELATING AGENTS MARKET, BY TYPE, 2016-2030 (USD MILLION)
TABLE 384 TURKEY ORGANOPHOSPHATES IN CHELATING AGENTS MARKET, BY TYPE, 2016-2030 (TONS)
TABLE 385 TURKEY ORGANIC ACIDS IN CHELATING AGENTS MARKET, BY TYPE, 2016-2030 (USD MILLION)
TABLE 386 TURKEY ORGANIC ACIDS IN CHELATING AGENTS MARKET, BY TYPE, 2016-2030 (TONS)
TABLE 387 TURKEY NATURAL IN CHELATING AGENTS MARKET, BY TYPE, 2016-2030 (USD MILLION)
TABLE 388 TURKEY NATURAL IN CHELATING AGENTS MARKET, BY TYPE, 2016-2030 (TONS)
TABLE 389 TURKEY CHELATING AGENTS MARKET, BY FORM, 2016-2030 (USD MILLION)
TABLE 390 TURKEY CHELATING AGENTS MARKET, BY FORM, 2016-2030 (TONS)
TABLE 391 TURKEY BIODEGRADABLE IN CHELATING AGENTS MARKET, BY FORM, 2016-2030 (USD MILLION)
TABLE 392 TURKEY BIODEGRADABLE IN CHELATING AGENTS MARKET, BY FORM, 2016-2030 (TONS)
TABLE 393 TURKEY CHELATING AGENTS MARKET, BY DISTRIBUTION CHANNEL, 2016-2030 (USD MILLION)
TABLE 394 TURKEY CHELATING AGENTS MARKET, BY DISTRIBUTION CHANNEL, 2016-2030 (TONS)
TABLE 395 TURKEY CHELATING AGENTS MARKET, BY END-USER, 2016-2030 (USD MILLION)
TABLE 396 TURKEY CHELATING AGENTS MARKET, BY END-USER, 2016-2030 (TONS)
TABLE 397 TURKEY PULP AND PAPER IN CHELATING AGENTS MARKET, BY FORM, 2016-2030 (USD MILLION)
TABLE 398 TURKEY AGRICULTURE IN CHELATING AGENTS MARKET, BY TYPE, 2016-2030 (USD MILLION)
TABLE 399 TURKEY CLEANERS AND DETERGENTS IN CHELATING AGENTS MARKET, BY FORM, 2016-2030 (USD MILLION)
TABLE 400 TURKEY INDUSTRIAL CLEANING/DESCALING IN CHELATING AGENTS MARKET, BY FORM, 2016-2030 (USD MILLION)
TABLE 401 TURKEY MINING IN CHELATING AGENTS MARKET, BY FORM, 2016-2030 (USD MILLION)
TABLE 402 TURKEY TEXTILE PROCESSING IN CHELATING AGENTS MARKET, BY FORM, 2016-2030 (USD MILLION)
TABLE 403 TURKEY OIL AND GAS IN CHELATING AGENTS MARKET, BY TYPE, 2016-2030 (USD MILLION)
TABLE 404 TURKEY POLYMER PRODUCTION IN CHELATING AGENTS MARKET, BY FORM, 2016-2030 (USD MILLION)
TABLE 405 TURKEY BUILDING AND CONSTRUCTION IN CHELATING AGENTS MARKET, BY FORM, 2016-2030 (USD MILLION)
TABLE 406 TURKEY PHOTOGRAPHY IN CHELATING AGENTS MARKET, BY FORM, 2016-2030 (USD MILLION)
TABLE 407 TURKEY ELECTRICAL AND ELECTRONICS IN CHELATING AGENTS MARKET, BY FORM, 2016-2030 (USD MILLION)
TABLE 408 TURKEY FOOD AND FEED ADDITIVES IN CHELATING AGENTS MARKET, BY FORM, 2016-2030 (USD MILLION)
TABLE 409 TURKEY PERSONAL CARE IN CHELATING AGENTS MARKET, BY FORM, 2016-2030 (USD MILLION)
TABLE 410 TURKEY PHARMACEUTICALS IN CHELATING AGENTS MARKET, BY FORM, 2016-2030 (USD MILLION)
TABLE 411 TURKEY OTHERS IN CHELATING AGENTS MARKET, BY FORM, 2016-2030 (USD MILLION)
TABLE 412 SWITZERLAND CHELATING AGENTS MARKET, BY TYPE, 2016-2030 (USD MILLION)
TABLE 413 SWITZERLAND CHELATING AGENTS MARKET, BY TYPE, 2016-2030 (TONS)
TABLE 414 SWITZERLAND SYNTHETIC IN CHELATING AGENTS MARKET, BY TYPE, 2016-2030 (USD MILLION)
TABLE 415 SWITZERLAND SYNTHETIC IN CHELATING AGENTS MARKET, BY TYPE, 2016-2030 (TONS)
TABLE 416 SWITZERLAND AMINOPOLYCARBOLXYLATES (APCS) IN CHELATING AGENTS MARKET, BY TYPE, 2016-2030 (USD MILLION)
TABLE 417 SWITZERLAND AMINOPOLYCARBOLXYLATES (APCS) IN CHELATING AGENTS MARKET, BY TYPE, 2016-2030 (TONS)
TABLE 418 SWITZERLAND ORGANOPHOSPHATES IN CHELATING AGENTS MARKET, BY TYPE, 2016-2030 (USD MILLION)
TABLE 419 SWITZERLAND ORGANOPHOSPHATES IN CHELATING AGENTS MARKET, BY TYPE, 2016-2030 (TONS)
TABLE 420 SWITZERLAND ORGANIC ACIDS IN CHELATING AGENTS MARKET, BY TYPE, 2016-2030 (USD MILLION)
TABLE 421 SWITZERLAND ORGANIC ACIDS IN CHELATING AGENTS MARKET, BY TYPE, 2016-2030 (TONS)
TABLE 422 SWITZERLAND NATURAL IN CHELATING AGENTS MARKET, BY TYPE, 2016-2030 (USD MILLION)
TABLE 423 SWITZERLAND NATURAL IN CHELATING AGENTS MARKET, BY TYPE, 2016-2030 (TONS)
TABLE 424 SWITZERLAND CHELATING AGENTS MARKET, BY FORM, 2016-2030 (TONS)
TABLE 425 SWITZERLAND BIODEGRADABLE IN CHELATING AGENTS MARKET, BY FORM, 2016-2030 (USD MILLION)
TABLE 426 SWITZERLAND BIODEGRADABLE IN CHELATING AGENTS MARKET, BY FORM, 2016-2030 (TONS)
TABLE 427 SWITZERLAND CHELATING AGENTS MARKET, BY DISTRIBUTION CHANNEL, 2016-2030 (USD MILLION)
TABLE 428 SWITZERLAND CHELATING AGENTS MARKET, BY DISTRIBUTION CHANNEL, 2016-2030 (TONS)
TABLE 429 SWITZERLAND CHELATING AGENTS MARKET, BY END-USER, 2016-2030 (USD MILLION)
TABLE 430 SWITZERLAND CHELATING AGENTS MARKET, BY END-USER, 2016-2030 (TONS)
TABLE 431 SWITZERLAND PULP AND PAPER IN CHELATING AGENTS MARKET, BY FORM, 2016-2030 (USD MILLION)
TABLE 432 SWITZERLAND AGRICULTURE IN CHELATING AGENTS MARKET, BY TYPE, 2016-2030 (USD MILLION)
TABLE 433 SWITZERLAND CLEANERS AND DETERGENTS IN CHELATING AGENTS MARKET, BY FORM, 2016-2030 (USD MILLION)
TABLE 434 SWITZERLAND INDUSTRIAL CLEANING/DESCALING IN CHELATING AGENTS MARKET, BY FORM, 2016-2030 (USD MILLION)
TABLE 435 SWITZERLAND MINING IN CHELATING AGENTS MARKET, BY FORM, 2016-2030 (USD MILLION)
TABLE 436 SWITZERLAND TEXTILE PROCESSING IN CHELATING AGENTS MARKET, BY FORM, 2016-2030 (USD MILLION)
TABLE 437 SWITZERLAND OIL AND GAS IN CHELATING AGENTS MARKET, BY TYPE, 2016-2030 (USD MILLION)
TABLE 438 SWITZERLAND POLYMER PRODUCTION IN CHELATING AGENTS MARKET, BY FORM, 2016-2030 (USD MILLION)
TABLE 439 SWITZERLAND BUILDING AND CONSTRUCTION IN CHELATING AGENTS MARKET, BY FORM, 2016-2030 (USD MILLION)
TABLE 440 SWITZERLAND PHOTOGRAPHY IN CHELATING AGENTS MARKET, BY FORM, 2016-2030 (USD MILLION)
TABLE 441 SWITZERLAND ELECTRICAL AND ELECTRONICS IN CHELATING AGENTS MARKET, BY FORM, 2016-2030 (USD MILLION)
TABLE 442 SWITZERLAND FOOD AND FEED ADDITIVES IN CHELATING AGENTS MARKET, BY FORM, 2016-2030 (USD MILLION)
TABLE 443 SWITZERLAND PERSONAL CARE IN CHELATING AGENTS MARKET, BY FORM, 2016-2030 (USD MILLION)
TABLE 444 SWITZERLAND PHARMACEUTICALS IN CHELATING AGENTS MARKET, BY FORM, 2016-2030 (USD MILLION)
TABLE 445 SWITZERLAND OTHERS IN CHELATING AGENTS MARKET, BY FORM, 2016-2030 (USD MILLION)
TABLE 446 REST OF EUROPE CHELATING AGENTS MARKET, BY TYPE, 2016-2030 (USD MILLION)
TABLE 447 REST OF EUROPE CHELATING AGENTS MARKET, BY TYPE, 2016-2030 (TONS)
Lista de figuras
FIGURE 1 EUROPE CHELATING AGENTS MARKET: SEGMENTATION
FIGURE 2 EUROPE CHELATING AGENTS MARKET: DATA TRIANGULATION
FIGURE 3 EUROPE CHELATING AGENTS MARKET: DROC ANALYSIS
FIGURE 4 EUROPE CHELATING AGENTS MARKET : EUROPE VS REGIONAL MARKET ANALYSIS
FIGURE 5 EUROPE CHELATING AGENTS MARKET : COMPANY RESEARCH ANALYSIS
FIGURE 6 EUROPE CHELATING AGENTS MARKET: INTERVIEW DEMOGRAPHICS
FIGURE 7 EUROPE CHELATING AGENTS MARKET: DBMR MARKET POSITION GRID
FIGURE 8 EUROPE CHELATING AGENTS MARKET: MARKET APPLICATION COVERAGE GRID
FIGURE 9 EUROPE CHELATING AGENTS MARKET: SEGMENTATION
FIGURE 10 RISE IN DEMAND FROM PULP & PAPER INDUSTRY IS DRIVING THE EUROPE CHELATING AGENTS MARKET IN THE FORECAST PERIOD OF 2023 TO 2030
FIGURE 11 THE SYNTHETIC CHELATING AGENTS SEGMENT IS EXPECTED TO ACCOUNT FOR THE LARGEST SHARE OF THE EUROPE CHELATING AGENTS MARKET IN 2023 & 2030
FIGURE 12 THE CHANGE IN PRICES OF CHELATING AGENTS IN THE EUROPE MARKET HAS BEEN GIVEN BELOW.
FIGURE 13 DRIVERS, RESTRAINTS, OPPORTUNITIES AND CHALLENGES OF EUROPE CHELATING AGENTS MARKET
FIGURE 14 EUROPE CHELATING AGENTS MARKET: BY TYPE, 2022
FIGURE 15 EUROPE CHELATING AGENTS MARKET: BY FORM, 2022
FIGURE 16 EUROPE CHELATING AGENTS MARKET: BY DISTRIBUTION CHANNEL, 2022
FIGURE 17 EUROPE CHELATING AGENTS MARKET: BY END USER, 2022
FIGURE 18 EUROPE CHELATING AGENTS MARKET: SNAPSHOT (2022)
FIGURE 19 EUROPE CHELATING AGENTS MARKET: BY COUNTRY (2022)
FIGURE 20 EUROPE CHELATING AGENTS MARKET: BY COUNTRY (2023 & 2030)
FIGURE 21 EUROPE CHELATING AGENTS MARKET: BY COUNTRY (2022 & 2030)
FIGURE 22 EUROPE CHELATING AGENTS MARKET: BY TYPE (2023-2030)
FIGURE 23 EUROPE CHELATING AGENTS MARKET: COMPANY SHARE 2022 (%)
Metodología de investigación
La recopilación de datos y el análisis del año base se realizan utilizando módulos de recopilación de datos con muestras de gran tamaño. La etapa incluye la obtención de información de mercado o datos relacionados a través de varias fuentes y estrategias. Incluye el examen y la planificación de todos los datos adquiridos del pasado con antelación. Asimismo, abarca el examen de las inconsistencias de información observadas en diferentes fuentes de información. Los datos de mercado se analizan y estiman utilizando modelos estadísticos y coherentes de mercado. Además, el análisis de la participación de mercado y el análisis de tendencias clave son los principales factores de éxito en el informe de mercado. Para obtener más información, solicite una llamada de un analista o envíe su consulta.
La metodología de investigación clave utilizada por el equipo de investigación de DBMR es la triangulación de datos, que implica la extracción de datos, el análisis del impacto de las variables de datos en el mercado y la validación primaria (experto en la industria). Los modelos de datos incluyen cuadrícula de posicionamiento de proveedores, análisis de línea de tiempo de mercado, descripción general y guía del mercado, cuadrícula de posicionamiento de la empresa, análisis de patentes, análisis de precios, análisis de participación de mercado de la empresa, estándares de medición, análisis global versus regional y de participación de proveedores. Para obtener más información sobre la metodología de investigación, envíe una consulta para hablar con nuestros expertos de la industria.
Personalización disponible
Data Bridge Market Research es líder en investigación formativa avanzada. Nos enorgullecemos de brindar servicios a nuestros clientes existentes y nuevos con datos y análisis que coinciden y se adaptan a sus objetivos. El informe se puede personalizar para incluir análisis de tendencias de precios de marcas objetivo, comprensión del mercado de países adicionales (solicite la lista de países), datos de resultados de ensayos clínicos, revisión de literatura, análisis de mercado renovado y base de productos. El análisis de mercado de competidores objetivo se puede analizar desde análisis basados en tecnología hasta estrategias de cartera de mercado. Podemos agregar tantos competidores sobre los que necesite datos en el formato y estilo de datos que esté buscando. Nuestro equipo de analistas también puede proporcionarle datos en archivos de Excel sin procesar, tablas dinámicas (libro de datos) o puede ayudarlo a crear presentaciones a partir de los conjuntos de datos disponibles en el informe.

