Europe Car T Cell Therapy Treatment Market
Tamaño del mercado en miles de millones de dólares
Tasa de crecimiento anual compuesta (CAGR) :
% 
 USD
3.77 Billion
USD
29.63 Billion
2024
2032
USD
3.77 Billion
USD
29.63 Billion
2024
2032
| 2025 –2032 | |
| USD 3.77 Billion | |
| USD 29.63 Billion | |
| % | |
|
Segmentación del mercado europeo de terapia con células CAR-T por producto (células CAR-T autólogas, células CAR-T alogénicas), estructura (células CAR-T de primera generación, células CAR-T de segunda generación, células CAR-T de tercera generación, células CAR-T de cuarta generación), antígenos diana (antígenos en tumores sólidos, antígenos en neoplasias hematológicas, otros), marca (Yescarta, Kymriah, Tecartus, otras), aplicación terapéutica (neoplasias hematológicas, cáncer de páncreas, cáncer de mama, cáncer de pulmón, cáncer gástrico , mieloma múltiple, leucemia linfocítica crónica, linfoma de células del manto, linfoma folicular, linfoma difuso de células B grandes, leucemia linfoblástica aguda, otros), usuario final (hospitales, clínicas especializadas, otros), canal de distribución (farmacias hospitalarias, otros): tendencias del sector y previsiones hasta 2032.
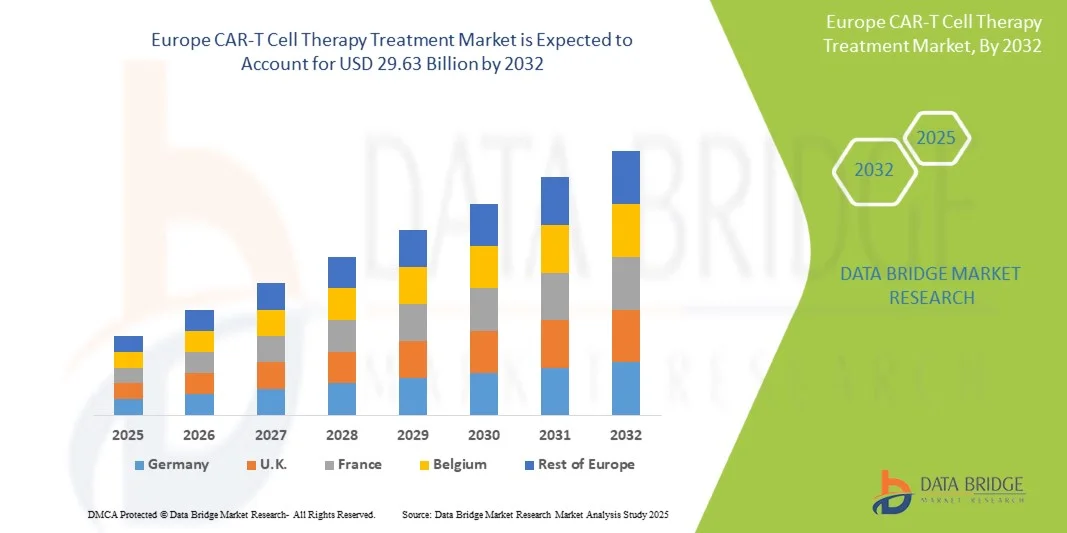
Tamaño del mercado europeo de tratamientos con terapia de células CAR-T
- El tamaño del mercado europeo de tratamientos con terapia de células CAR-T se valoró en 3.770 millones de dólares en 2024 y se espera que alcance los 29.630 millones de dólares en 2032 , con una tasa de crecimiento anual compuesta (TCAC) del 29,40% durante el período de previsión.
- El crecimiento del mercado se debe en gran medida a la creciente prevalencia de neoplasias hematológicas y otros tipos de cáncer, junto con los rápidos avances en las tecnologías de inmunoterapia celular, lo que conlleva una mayor adopción de las terapias con células CAR-T en la práctica clínica.
- Además, la creciente demanda de los pacientes por opciones de tratamiento personalizadas, específicas y eficaces está impulsando la adopción de soluciones de terapia con células CAR-T, lo que a su vez impulsa significativamente el crecimiento del sector.
Análisis del mercado europeo de tratamientos con terapia de células CAR-T
- La terapia con células CAR-T, que ofrece inmunoterapia celular personalizada y dirigida para el tratamiento del cáncer, se está convirtiendo cada vez más en un componente vital de la oncología moderna, tanto en hospitales como en clínicas especializadas, debido a su alta eficacia y potencial para la remisión a largo plazo.
- La creciente demanda de terapia con células CAR-T se debe principalmente al aumento de la prevalencia del cáncer, los avances en la investigación de la inmunoterapia y la creciente preferencia de los pacientes por soluciones de tratamiento innovadoras y de precisión.
- El Reino Unido dominó el mercado de tratamientos con terapia de células CAR-T en 2024, con la mayor cuota de ingresos (36,8%), impulsado por sólidas inversiones en investigación oncológica, la fuerte presencia de empresas biofarmacéuticas líderes y la rápida adopción de terapias celulares y génicas avanzadas en el sistema sanitario del país. Las iniciativas del Servicio Nacional de Salud (NHS) del Reino Unido que apoyan los tratamientos oncológicos personalizados y basados en inmunoterapia, junto con un marco regulatorio favorable, están impulsando aún más la expansión del mercado de tratamientos con terapia de células CAR-T.
- Se prevé que Alemania sea el país con mayor crecimiento en el mercado de tratamientos con células CAR-T durante el período de pronóstico, con una tasa de crecimiento anual compuesta (TCAC) del 12,4%, debido al significativo aumento de la investigación en biotecnología, la mayor financiación para ensayos clínicos y la creciente colaboración entre instituciones académicas y empresas farmacéuticas. El enfoque del país en la medicina de precisión, la innovación tecnológica y el mejor acceso a terapias oncológicas avanzadas sigue impulsando el crecimiento del mercado de tratamientos con células CAR-T en Alemania.
- El segmento de neoplasias hematológicas dominó el mercado con una cuota de ingresos del 69,7 % en 2024, gracias a las aprobaciones tempranas, la alta prevalencia y los excelentes resultados clínicos. Los hospitales y clínicas especializadas ofrecen terapia y monitorización centralizadas.
Alcance del informe y segmentación del mercado europeo de tratamientos con terapia de células CAR-T
|
Atributos |
Información clave del mercado europeo sobre el tratamiento con terapia de células CAR-T |
|
Segmentos cubiertos |
|
|
Países cubiertos |
Europa
|
|
Principales actores del mercado |
|
|
Oportunidades de mercado |
|
|
Conjuntos de datos de valor añadido |
Además de los datos sobre escenarios de mercado como el valor de mercado, la tasa de crecimiento, la segmentación, la cobertura geográfica y los principales actores, los informes de mercado elaborados por Data Bridge Market Research también incluyen análisis de expertos en profundidad, epidemiología de pacientes, análisis de proyectos en desarrollo, análisis de precios y marco regulatorio. |
Tendencias del mercado europeo de tratamientos con terapia de células CAR-T
“ Mayor comodidad gracias a plataformas de terapia avanzadas ”
- Una tendencia significativa y en auge en el mercado europeo de tratamientos con terapia de células CAR-T es la creciente integración de plataformas terapéuticas avanzadas con soluciones de salud digital y sistemas de monitorización asistidos por IA. Estas tecnologías mejoran la toma de decisiones clínicas, la monitorización de pacientes y la planificación de tratamientos personalizados para las terapias CAR-T.
- Por ejemplo, las plataformas CAR-T hospitalarias están cada vez más equipadas con sistemas de seguimiento de pacientes basados en IA, lo que permite a los médicos monitorizar la liberación de citocinas, la respuesta inmunitaria y los efectos adversos relacionados con la terapia en tiempo real. Del mismo modo, los sistemas automatizados de gestión de terapias pueden optimizar las pautas de dosificación y los protocolos de infusión celular.
- La integración de la IA en la terapia CAR-T permite funciones como la predicción de la respuesta del paciente, la optimización de los plazos de fabricación de células CAR-T autólogas y alogénicas, y la detección temprana de posibles toxicidades. Este enfoque basado en datos mejora la seguridad y la eficacia del tratamiento.
- La perfecta integración de las plataformas de tratamiento CAR-T con los registros médicos electrónicos (RME) hospitalarios facilita la gestión centralizada de los flujos de trabajo de la terapia, el historial del paciente y los calendarios de seguimiento. Mediante una interfaz unificada, los profesionales clínicos pueden coordinar de forma eficiente el acondicionamiento previo al tratamiento, la infusión y la atención posterior a la infusión.
- Esta tendencia hacia plataformas CAR-T más inteligentes, basadas en datos e interconectadas está transformando radicalmente las expectativas sobre los resultados de los tratamientos oncológicos. En consecuencia, empresas como Novartis, Gilead y Bristol Myers Squibb están desarrollando plataformas con funciones de monitorización mediante IA, análisis en tiempo real y optimización de la terapia.
- La demanda de terapias CAR-T con integración de plataforma mejorada está creciendo rápidamente en hospitales y centros oncológicos especializados, ya que los pacientes y los profesionales sanitarios priorizan cada vez más la seguridad, la eficacia y la personalización del tratamiento.
Dinámica del mercado europeo de tratamientos con terapia de células CAR-T
Conductor
“Necesidad creciente debido al aumento de la prevalencia del cáncer y la adopción de terapias avanzadas”
- La creciente prevalencia de neoplasias hematológicas y tumores sólidos, junto con la mayor adopción de inmunoterapias avanzadas, es un factor importante que impulsa la elevada demanda de terapias con células CAR-T.
- Por ejemplo, en 2024, varios productos CAR-T recibieron indicaciones ampliadas para el linfoma difuso de células B grandes, el mieloma múltiple y la leucemia linfoblástica aguda, lo que permitió una mayor adopción clínica. Se espera que estas aprobaciones regulatorias impulsen el crecimiento del mercado durante el período de pronóstico.
- A medida que los profesionales de la salud buscan opciones de tratamiento más eficaces y duraderas, las terapias CAR-T ofrecen enfoques personalizados y específicos que pueden producir remisión a largo plazo en pacientes con cáncer refractario o en recaída.
- Además, el aumento de las inversiones en infraestructura de fabricación de terapias CAR-T, la expansión de los programas de ensayos clínicos y la mejora de la logística de la cadena de suministro están haciendo que estas terapias sean más accesibles para los pacientes de todo el mundo.
- La combinación de programas de concientización para pacientes, una mayor cobertura de reembolso y centros de tratamiento especializados capaces de administrar la terapia CAR-T está impulsando aún más su adopción en el mercado. Las plataformas de terapia avanzadas que permiten una producción a gran escala y una planificación de tratamiento personalizada son factores clave para este crecimiento.
Restricción/Desafío
“ Preocupaciones relacionadas con la seguridad, la complejidad de la fabricación y los elevados costes de la terapia ”
- Las preocupaciones en torno a eventos adversos graves, como el síndrome de liberación de citocinas (SLC) y la neurotoxicidad, representan importantes desafíos para una mayor penetración en el mercado. El monitoreo y el manejo continuos son fundamentales para mitigar los riesgos relacionados con la terapia.
- El complejo y laborioso proceso de fabricación de células CAR-T autólogas, que implica la recolección personalizada de células, la modificación genética y la reinfusión, puede limitar la escalabilidad y la accesibilidad del tratamiento.
- Abordar estos desafíos mediante protocolos estandarizados, una mejor gestión de la seguridad y la automatización en la fabricación es crucial para aumentar el acceso de los pacientes y la adopción clínica.
- El elevado coste de la terapia CAR-T, que a menudo supera los cientos de miles de dólares por tratamiento, sigue siendo una barrera para los pacientes de mercados emergentes o aquellos sin una cobertura de seguro integral. Se requieren estrategias de contención de costes y una ampliación de los reembolsos para mejorar la accesibilidad económica.
- Además, las complejidades regulatorias para la aprobación de terapias, el control de calidad y la farmacovigilancia posterior a la comercialización pueden ralentizar el crecimiento del mercado. La armonización de las directrices entre países es esencial para agilizar la adopción en Europa.
- Superar estos desafíos mediante la innovación tecnológica, la mejora de los protocolos de seguridad y los programas de apoyo al paciente será vital para el crecimiento sostenido del mercado de tratamientos con terapia de células CAR-T.
Alcance del mercado europeo de tratamientos con terapia de células CAR-T
El mercado está segmentado en función del producto, la estructura, los antígenos objetivo, la marca, la aplicación terapéutica, el usuario final y el canal de distribución.
• Por producto
Según el tipo de producto, el mercado de la terapia con células CAR-T se segmenta en células CAR-T autólogas y células CAR-T alogénicas. El segmento de células CAR-T autólogas dominó el mercado con la mayor cuota de ingresos (62,5 %) en 2024, gracias a su enfoque personalizado, que minimiza los riesgos de la enfermedad de injerto contra huésped y maximiza la eficacia terapéutica. Los hospitales y clínicas especializadas utilizan ampliamente la terapia con células CAR-T autólogas para las neoplasias hematológicas, ofreciendo resultados óptimos para los pacientes. Las aprobaciones regulatorias en mercados clave como Estados Unidos, Alemania y China respaldan su adopción constante. La sólida evidencia clínica, los datos de respuesta a largo plazo de los pacientes y los protocolos de fabricación establecidos fortalecen su posición en el mercado. El apoyo al reembolso, la concienciación de los pacientes y las tecnologías avanzadas de procesamiento celular también impulsan el crecimiento. La I+D continua, la expansión de los ensayos clínicos y los programas de formación médica mejoran su adopción clínica. La disponibilidad de terapias combinadas con células CAR-T autólogas consolida aún más su dominio del mercado.
Se prevé que el segmento de células CAR-T alogénicas experimente el mayor crecimiento anual compuesto (CAGR) del 14,2 % entre 2025 y 2032, impulsado por terapias listas para usar que permiten la administración inmediata. Estos productos reducen el tiempo y el costo de fabricación, mejorando el acceso de los pacientes. Los avances en la edición genética y las tecnologías de células donantes universales mejoran la seguridad y la escalabilidad. Los ensayos clínicos dirigidos a tumores hematológicos y sólidos están acelerando el desarrollo. Las colaboraciones estratégicas entre empresas biotecnológicas y organizaciones de fabricación por contrato (CMO) están ampliando la capacidad de producción. El enfoque de soluciones listas para usar aborda necesidades médicas no cubiertas y amplía la cobertura del tratamiento. La inversión en mejoras de seguridad y eficacia impulsa la adopción en el mercado. El progreso regulatorio en múltiples regiones fomenta aprobaciones más rápidas. Las alianzas con hospitales y centros especializados mejoran la distribución y la concientización. El creciente número de pacientes en los mercados emergentes también respalda el rápido crecimiento.
• Por estructura
Según su estructura, el mercado se segmenta en células CAR-T de primera, segunda, tercera y cuarta generación. El segmento de células CAR-T de segunda generación dominó el mercado en 2024 con una cuota de ingresos del 55,8%, gracias a los dominios coestimuladores que mejoran la persistencia de las células T y su actividad citotóxica. La mayoría de los productos CAR-T aprobados comercialmente pertenecen a esta generación. Los hospitales y clínicas especializadas adoptan ampliamente estas terapias debido a su eficacia y seguridad demostradas. La sólida evidencia de ensayos clínicos, las aprobaciones regulatorias y la cobertura de reembolso refuerzan su posición. Los estándares de fabricación avanzados garantizan una entrega de alta calidad. Este segmento se beneficia de opciones optimizadas de terapia combinada. La innovación continua en la modificación genética y la expansión de células T apoya la adopción clínica. Los resultados de los pacientes y los datos de supervivencia a largo plazo consolidan el dominio del mercado. Las campañas de concienciación y los programas de formación médica en Europa fomentan la adopción por parte de los médicos. Las colaboraciones con instituciones de investigación fortalecen aún más el liderazgo del mercado.
Se prevé que el segmento de células CAR-T de tercera generación experimente el mayor crecimiento anual compuesto (CAGR) del 12,5 % entre 2025 y 2032, impulsado por diseños multicoestimuladores que mejoran la actividad antitumoral. Su potencial aplicación tanto en tumores hematológicos como sólidos está fomentando el interés en la investigación. Los primeros datos clínicos muestran resultados prometedores. Las colaboraciones biotecnológicas y las alianzas académicas están acelerando el desarrollo. Las terapias CAR-T de tercera generación ofrecen mayor persistencia, menor riesgo de recaída y mejores perfiles de seguridad. La financiación para la investigación en inmunoterapia respalda la expansión del segmento. Los hospitales y las clínicas especializadas están adoptando gradualmente estos productos avanzados. La normativa es cada vez más favorable. El conocimiento de las nuevas innovaciones en CAR-T por parte de pacientes y médicos impulsa la demanda. El mayor enfoque en la medicina personalizada impulsa su rápida adopción. La penetración de mercado en las regiones emergentes se está expandiendo.
• Mediante antígenos específicos
Según los antígenos diana, el mercado se segmenta en antígenos en tumores sólidos, antígenos en neoplasias hematológicas y otros. El segmento de neoplasias hematológicas dominó el mercado en 2024 con una cuota de ingresos del 67,3 %, gracias a la aprobación y amplia adopción de las terapias CAR-T para neoplasias de células B como el linfoma difuso de células B grandes (LDCBG), la leucemia linfoblástica aguda (LLA) y el mieloma múltiple. Los sólidos resultados clínicos, la adopción hospitalaria y el apoyo regulatorio impulsan este dominio. La cobertura de reembolso garantiza el acceso de los pacientes. Numerosos datos de ensayos clínicos validan la eficacia y la seguridad. Los centros de tratamiento especializados aseguran una gestión óptima de la terapia. La formación y la sensibilización de los médicos contribuyen a su adopción. Los hospitales y las clínicas especializadas son los principales centros de administración. Los datos de supervivencia a largo plazo refuerzan la confianza en el mercado. La demanda de pacientes está en aumento. Las guías de tratamiento europeas recomiendan la terapia CAR-T para los pacientes elegibles. La I+D continua respalda la expansión.
Se prevé que el segmento de tumores sólidos experimente el mayor crecimiento anual compuesto (CAGR) del 13,8 % entre 2025 y 2032, impulsado por ensayos clínicos dirigidos a HER2, EGFR, mesotelina y otros antígenos de tumores sólidos. Los avances en la modulación del microambiente tumoral mejoran las tasas de respuesta. Se están investigando combinaciones de inhibidores de puntos de control inmunitario. La inversión en investigación y desarrollo está aumentando a nivel mundial. Los hospitales y clínicas especializadas están ampliando su participación en ensayos clínicos. Las nuevas construcciones de terapias CAR-T muestran un perfil de seguridad y eficacia prometedor. La colaboración entre empresas biotecnológicas e instituciones académicas acelera el crecimiento. La demanda de terapias innovadoras por parte de los pacientes está en aumento. La flexibilidad regulatoria en oncología fomenta la expansión de los ensayos clínicos. Los programas de concientización para médicos y pacientes promueven su adopción. Las innovaciones tecnológicas en edición genética mejoran la focalización de tumores sólidos. La penetración de mercado en regiones emergentes impulsa un rápido crecimiento.
• Por marca
Según la marca, el mercado se segmenta en Yescarta, Kymriah, Tecartus y otras. El segmento de Yescarta dominó el mercado con una cuota de ingresos del 38,4 % en 2024, gracias a su aprobación temprana para el linfoma difuso de células B grandes (LDCBG) y su amplia adopción hospitalaria. Su sólido perfil de seguridad, su robusta eficacia clínica y sus programas estructurados de apoyo al paciente refuerzan su posición dominante. La cobertura de reembolso, la formación médica y la concienciación de los pacientes impulsan su adopción. Los hospitales y las clínicas especializadas implementan protocolos estandarizados. La capacidad de fabricación garantiza un suministro fiable del producto. Los estudios posteriores a la comercialización en curso aumentan la confianza. Las colaboraciones con centros médicos en Europa amplían su alcance. Los resultados para los pacientes son favorables. La innovación continua y las terapias combinadas mantienen su liderazgo en el mercado.
Se prevé que el segmento de Tecartus experimente el mayor crecimiento anual compuesto (CAGR) del 15,1 % entre 2025 y 2032, impulsado por su aprobación para el linfoma de células del manto y las neoplasias malignas de células B recidivantes/refractarias. Los ensayos clínicos y los programas de acceso ampliado aceleran su adopción. Las clínicas y hospitales especializados están implementando cada vez más la terapia con Tecartus. Las alianzas con empresas biotecnológicas mejoran la distribución. Los resultados clínicos iniciales positivos aumentan la confianza. La inversión en la ampliación de la capacidad de producción respalda la demanda. Los incentivos regulatorios permiten aprobaciones más rápidas. Los programas de divulgación y sensibilización mejoran el conocimiento de los médicos sobre el tratamiento. La preferencia de los pacientes por las nuevas terapias va en aumento. La adopción en Europa se está expandiendo. La I+D continua mejora el potencial terapéutico.
• Mediante aplicación terapéutica
Según su aplicación terapéutica, el mercado se segmenta en neoplasias hematológicas, cáncer de páncreas, cáncer de mama, cáncer de pulmón, cáncer gástrico, mieloma múltiple, leucemia linfocítica crónica, linfoma de células del manto, linfoma folicular, linfoma difuso de células B grandes, leucemia linfoblástica aguda y otras. El segmento de neoplasias hematológicas dominó el mercado en 2024 con una cuota de ingresos del 69,7%, gracias a las aprobaciones tempranas, la alta prevalencia y los excelentes resultados clínicos. Los hospitales y clínicas especializadas ofrecen terapia y seguimiento centralizados. La cobertura de reembolso y el respaldo de las guías clínicas fomentan su adopción. Los equipos multidisciplinarios garantizan la seguridad. Los datos a largo plazo de los pacientes refuerzan la eficacia. El respaldo de los ensayos clínicos garantiza el cumplimiento normativo. Los médicos priorizan la terapia CAR-T para los pacientes elegibles. El acceso a instalaciones especializadas respalda el liderazgo. Existe un alto grado de concienciación entre los pacientes. La I+D continua fortalece la cartera de tratamientos. La colaboración con centros académicos garantiza el crecimiento.
Se prevé que el segmento de cáncer de páncreas experimente el mayor crecimiento anual compuesto (CAGR) del 12,9 % entre 2025 y 2032, gracias a las innovadoras terapias CAR-T dirigidas a KRAS, mesotelina y otros antígenos. Los ensayos clínicos muestran resultados prometedores. Las terapias combinadas mejoran la eficacia. Los hospitales y clínicas especializadas amplían su capacidad para realizar ensayos clínicos. Las inversiones en biotecnología impulsan el desarrollo. La flexibilidad regulatoria facilita aprobaciones más rápidas. Los programas de concientización médica incrementan la adopción de estas terapias. El interés de los pacientes en las nuevas terapias va en aumento. Las colaboraciones académicas impulsan la investigación. La escalabilidad de la producción mejora el acceso. La precisión de las terapias dirigidas favorece el crecimiento. La penetración en el mercado de las regiones emergentes impulsa una rápida adopción.
• Por el usuario final
Según el usuario final, el mercado se segmenta en hospitales, clínicas especializadas y otros. El segmento de hospitales dominó el mercado en 2024 con una cuota de ingresos del 58,6%, gracias a la administración centralizada de la terapia CAR-T, los equipos multidisciplinarios, la infraestructura avanzada y el seguimiento integral del paciente. Los hospitales gestionan la infusión, los eventos adversos y la atención posterior al tratamiento. El cumplimiento normativo y la cobertura de reembolso garantizan su adopción. Los centros con múltiples sedes proporcionan una atención uniforme. La evidencia clínica y los resultados a largo plazo de los pacientes refuerzan su liderazgo. La integración con los cuidados paliativos mejora la seguridad. Los protocolos de tratamiento estandarizados mejoran la eficacia. La familiaridad del médico con el tratamiento fomenta la preferencia. La confianza del paciente es mayor en los entornos hospitalarios. Las alianzas con empresas de biotecnología mejoran el acceso.
Se prevé que el segmento de Clínicas Especializadas experimente el mayor crecimiento anual compuesto (CAGR) del 11,3 % entre 2025 y 2032, impulsado por centros oncológicos ambulatorios especializados que ofrecen atención personalizada. Los tiempos de espera más cortos, la atención centrada en el paciente y las terapias de precisión incrementan la preferencia de los pacientes. La expansión de los tratamientos basados en ensayos clínicos favorece su adopción. La mayor concienciación de los médicos y el personal especializado mejoran los resultados. Las colaboraciones académicas aceleran el intercambio de conocimientos. Las terapias innovadoras son más accesibles. Las clínicas ofrecen horarios flexibles y seguimiento continuo. Los modelos de atención centrados en el paciente atraen a nuevos usuarios. Las campañas de concienciación impulsan la demanda. Las mejoras en la infraestructura aumentan la capacidad. La adopción en los mercados emergentes está en aumento.
• Por canal de distribución
Según el canal de distribución, el mercado se segmenta en farmacias hospitalarias y otros. El segmento de farmacias hospitalarias ostentó la mayor cuota de mercado, con un 52,1 % en 2024, gracias a la dispensación controlada de terapias CAR-T de alto costo, las instalaciones de almacenamiento, el cumplimiento normativo y el personal capacitado. La adquisición a granel, los programas gubernamentales y las cadenas de suministro integradas respaldan su posición dominante. Los protocolos de garantía de calidad aseguran la seguridad. Los hospitales brindan acceso oportuno a los pacientes. La cobertura de reembolso facilita la accesibilidad económica. Los equipos de apoyo clínico gestionan la terapia y los eventos adversos. La adopción se ve favorecida por los procedimientos hospitalarios estandarizados. La normativa refuerza el cumplimiento. La distribución centralizada mejora la eficiencia. Los resultados para los pacientes son mejores en entornos hospitalarios.
Se prevé que el segmento «Otros» experimente el mayor crecimiento anual compuesto (CAGR) del 10,7 % entre 2025 y 2032, incluyendo distribuidores especializados y soluciones logísticas emergentes. Este canal mejora el acceso en regiones con infraestructura hospitalaria limitada. La integración del comercio electrónico y la telemedicina facilita la entrega. Una distribución más rápida y cadenas de suministro flexibles impulsan la adopción. La colaboración con empresas de biotecnología garantiza la fiabilidad del producto. El marco regulatorio facilita la expansión. Los programas de concientización aumentan la confianza de los médicos. Las zonas remotas y desatendidas se benefician. La logística especializada garantiza una manipulación segura. La penetración de mercado en regiones en desarrollo se acelera. El seguimiento tecnológico refuerza la confianza. El acceso flexible favorece un rápido crecimiento.
Análisis regional del mercado europeo de tratamientos con terapia de células CAR-T
- Se prevé que el mercado europeo de tratamientos con terapia de células CAR-T experimente un crecimiento significativo durante el período de pronóstico, impulsado principalmente por el aumento de las inversiones en terapias oncológicas avanzadas, la creciente concienciación sobre la medicina personalizada y las iniciativas regulatorias de apoyo que promueven la investigación en terapia celular y génica.
- La sólida infraestructura biotecnológica de la región, la creciente actividad de ensayos clínicos y las colaboraciones entre empresas farmacéuticas e instituciones de investigación están impulsando avances sustanciales en los tratamientos con células CAR-T.
- Europa está presenciando una mayor adopción de la terapia con células CAR-T en los principales sistemas de salud para neoplasias hematológicas y tumores sólidos, lo que refleja un cambio hacia una atención oncológica de precisión.
Perspectivas del mercado de tratamientos con terapia de células CAR-T en el Reino Unido
En 2024, el mercado británico de tratamientos con terapia de células CAR-T dominó el mercado europeo con una cuota de ingresos del 36,8%, impulsado por las sólidas inversiones en investigación oncológica, la fuerte presencia de empresas biofarmacéuticas líderes y la rápida adopción de terapias celulares y génicas avanzadas en el sistema sanitario del país. Las iniciativas del Servicio Nacional de Salud (NHS) del Reino Unido que apoyan los tratamientos oncológicos personalizados y basados en inmunoterapia, junto con un marco regulatorio favorable y programas de innovación respaldados por el gobierno, impulsan aún más la expansión del mercado. Además, los continuos avances en las capacidades de fabricación y el establecimiento de centros especializados en terapia celular refuerzan el liderazgo del Reino Unido en el mercado europeo de terapia CAR-T.
Perspectivas del mercado alemán de tratamientos con terapia de células CAR-T
Se prevé que Alemania registre el mayor crecimiento en el mercado de tratamientos con células CAR-T durante el período de pronóstico, con una tasa de crecimiento anual compuesta (TCAC) del 12,4%. Este crecimiento se debe al significativo aumento de la investigación biotecnológica , la mayor financiación para ensayos clínicos y la creciente colaboración entre instituciones académicas y empresas farmacéuticas. El fuerte énfasis del país en la medicina de precisión , la innovación tecnológica y el mayor acceso a terapias oncológicas avanzadas está acelerando la adopción de los tratamientos con células CAR-T. La sólida infraestructura sanitaria alemana, el apoyo gubernamental a la I+D y el enfoque en el desarrollo de modelos escalables de fabricación y distribución de células CAR-T contribuyen aún más al rápido crecimiento del mercado en el país.
Cuota de mercado europea del tratamiento con terapia de células CAR-T
La industria del tratamiento con terapia de células CAR-T está liderada principalmente por empresas bien establecidas, entre las que se incluyen:
- Novartis AG (Suiza)
- GSK plc (Reino Unido)
- Bristol Myers Squibb (Irlanda)
- Autolus Therapeutics plc (Reino Unido)
- Miltenyi Biotec (Alemania)
- Cellectis SA (Francia)
- Thermo Fisher Scientific Inc (Alemania)
- Orchard Therapeutics (Reino Unido)
- BioNTech SE (Alemania)
- Oxford BioTherapeutics (Reino Unido)
- GEMoaB Monoclonals GmbH (Alemania)
- Mabion SA (Polonia)
- Anaveon AG (Suiza)
- TC BioPharm (Reino Unido)
Últimos avances en el mercado europeo de tratamientos con terapia de células CAR-T
- En marzo de 2021, la Administración de Alimentos y Medicamentos de los Estados Unidos (FDA) aprobó idecabtagene vicleucel (nombre comercial Abecma) para pacientes adultos con mieloma múltiple recidivante o refractario tras cuatro o más líneas de tratamiento previas. Esta fue la primera terapia con células CAR-T aprobada por la FDA para el mieloma múltiple, lo que representa un hito importante en la oncología personalizada y amplía las opciones de tratamiento para pacientes con múltiples líneas de tratamiento previas.
- En febrero de 2022, la FDA aprobó ciltacabtagene autoleucel (nombre comercial CARVYKTI) para pacientes adultos con mieloma múltiple recidivante o refractario tras cuatro o más líneas de tratamiento previas. Desarrollado por Janssen y Legend Biotech, CARVYKTI demostró altas tasas de respuesta global en ensayos clínicos, lo que refuerza la creciente importancia de las terapias con células CAR-T en el tratamiento de neoplasias hematológicas.
- En noviembre de 2023, la Administración de Alimentos y Medicamentos de los Estados Unidos (FDA) anunció que estaba investigando un posible riesgo de neoplasias malignas de células T asociadas con las terapias de células CAR-T autólogas dirigidas contra BCMA o CD19. Esta medida reflejó una mayor vigilancia regulatoria en torno al seguimiento de la seguridad a largo plazo de los productos CAR-T e impulsó revisiones de seguridad en todas las terapias CAR-T aprobadas en los Estados Unidos.
- En abril de 2024, la FDA aprobó un uso ampliado de las terapias Abecma y CARVYKTI, permitiendo su administración en una etapa más temprana del tratamiento para pacientes con mieloma múltiple recidivante o refractario. Esta decisión amplió significativamente la elegibilidad de los pacientes y subrayó la confianza de la agencia en los perfiles de seguridad y eficacia de estas terapias CAR-T.
SKU-
Obtenga acceso en línea al informe sobre la primera nube de inteligencia de mercado del mundo
- Panel de análisis de datos interactivo
- Panel de análisis de empresas para oportunidades con alto potencial de crecimiento
- Acceso de analista de investigación para personalización y consultas
- Análisis de la competencia con panel interactivo
- Últimas noticias, actualizaciones y análisis de tendencias
- Aproveche el poder del análisis de referencia para un seguimiento integral de la competencia
Metodología de investigación
La recopilación de datos y el análisis del año base se realizan utilizando módulos de recopilación de datos con muestras de gran tamaño. La etapa incluye la obtención de información de mercado o datos relacionados a través de varias fuentes y estrategias. Incluye el examen y la planificación de todos los datos adquiridos del pasado con antelación. Asimismo, abarca el examen de las inconsistencias de información observadas en diferentes fuentes de información. Los datos de mercado se analizan y estiman utilizando modelos estadísticos y coherentes de mercado. Además, el análisis de la participación de mercado y el análisis de tendencias clave son los principales factores de éxito en el informe de mercado. Para obtener más información, solicite una llamada de un analista o envíe su consulta.
La metodología de investigación clave utilizada por el equipo de investigación de DBMR es la triangulación de datos, que implica la extracción de datos, el análisis del impacto de las variables de datos en el mercado y la validación primaria (experto en la industria). Los modelos de datos incluyen cuadrícula de posicionamiento de proveedores, análisis de línea de tiempo de mercado, descripción general y guía del mercado, cuadrícula de posicionamiento de la empresa, análisis de patentes, análisis de precios, análisis de participación de mercado de la empresa, estándares de medición, análisis global versus regional y de participación de proveedores. Para obtener más información sobre la metodología de investigación, envíe una consulta para hablar con nuestros expertos de la industria.
Personalización disponible
Data Bridge Market Research es líder en investigación formativa avanzada. Nos enorgullecemos de brindar servicios a nuestros clientes existentes y nuevos con datos y análisis que coinciden y se adaptan a sus objetivos. El informe se puede personalizar para incluir análisis de tendencias de precios de marcas objetivo, comprensión del mercado de países adicionales (solicite la lista de países), datos de resultados de ensayos clínicos, revisión de literatura, análisis de mercado renovado y base de productos. El análisis de mercado de competidores objetivo se puede analizar desde análisis basados en tecnología hasta estrategias de cartera de mercado. Podemos agregar tantos competidores sobre los que necesite datos en el formato y estilo de datos que esté buscando. Nuestro equipo de analistas también puede proporcionarle datos en archivos de Excel sin procesar, tablas dinámicas (libro de datos) o puede ayudarlo a crear presentaciones a partir de los conjuntos de datos disponibles en el informe.