Mercado europeo de ingredientes bioactivos: tendencias de la industria y pronóstico hasta 2028

Solicitud de índiceSolicitud de índice Hable con el analistaHable con el analista Comprar ahoraComprar ahora Consultar antes de comprarConsultar antes Informe de muestra gratuitoInforme de muestra gratuito

Mercado europeo de ingredientes bioactivos: tendencias de la industria y pronóstico hasta 2028

  • Food & Beverage
  • Published Report
  • Aug 2021
  • Europe
  • 350 Páginas
  • Número de tablas: 290
  • Número de figuras: 9

>El mercado europeo de recubrimientos hidrofóbicos está segmentado por tipo de ingrediente (prebióticos, probióticos, aminoácidos, péptidos, omega 3 y lípidos estructurados, fitoquímicos y extractos de plantas, minerales, vitaminas, fibras y carbohidratos especiales, carotenoides y antioxidantes y otros), aplicación (alimentos funcionales, suplementos dietéticos, suplementos gomosos, nutrición animal, cuidado personal y otros) y fuente (planta, animal y microbiana), país (Alemania, Reino Unido, Francia, Italia, España, Países Bajos, Bélgica, Rusia, Turquía, Suiza, Dinamarca, Suecia, Polonia, resto de Europa), tendencias de la industria y pronóstico hasta 2028.
Mercado europeo de ingredientes bioactivosAnálisis y perspectivas del mercado: mercado europeo de ingredientes bioactivos

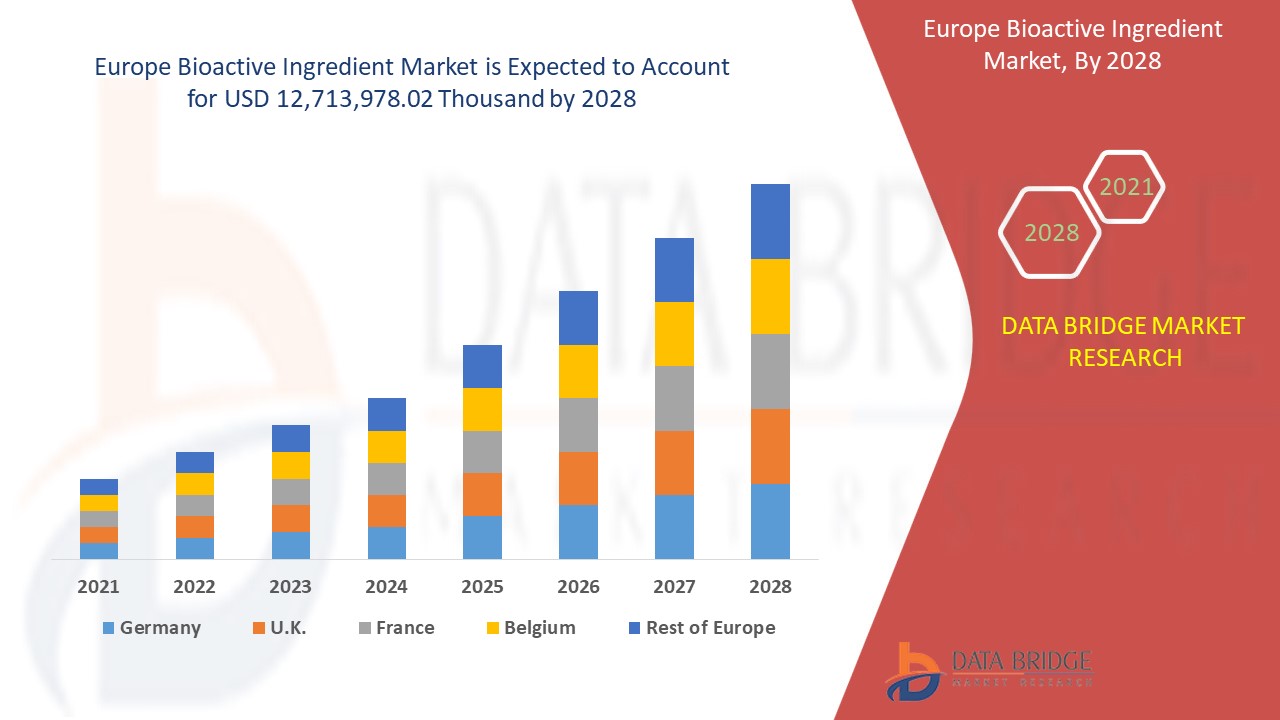
Se espera que el mercado europeo de ingredientes bioactivos gane crecimiento de mercado en el período de pronóstico de 2021 a 2028. Data Bridge Market Research analiza que el mercado está creciendo a una CAGR del 7,1% en el período de pronóstico de 2021 a 2028 y se espera que alcance los USD 12 713 978,02 miles para 2028.

Los ingredientes bioactivos son sustancias que tienen un efecto biológico sobre los organismos vivos. Los componentes provienen de diversas fuentes, como plantas, alimentos, animales, el mar y microorganismos. Las sustancias bioactivas se añaden a los alimentos y piensos para mejorar la salud física y fisiológica de los clientes. Los alimentos y bebidas funcionales, los suplementos nutricionales y la nutrición de los recién nacidos hacen un uso extensivo de sustancias bioactivas. Estas sustancias químicas pueden ayudar a prevenir el cáncer, las enfermedades cardíacas y otras enfermedades.

Las sustancias bioactivas se utilizan ampliamente en diversos sectores, incluidos los alimentos y bebidas, los medicamentos y nutracéuticos, los artículos de cuidado personal y los alimentos para animales. Los carotenoides, los aceites esenciales y los antioxidantes son ejemplos de sustancias bioactivas que se utilizan en los alimentos funcionales para mejorar sus cualidades sensoriales y nutricionales. Son un tipo de biomoléculas que ayudan en el proceso metabólico de las moléculas saludables que se añaden a los alimentos y a diferentes tipos de productos.

El informe de mercado de ingredientes bioactivos proporciona detalles de la participación de mercado, nuevos desarrollos y análisis de la cartera de productos, el impacto de los actores del mercado nacional y localizado, analiza las oportunidades en términos de bolsillos de ingresos emergentes, cambios en las regulaciones del mercado, aprobaciones de productos, decisiones estratégicas, lanzamientos de productos, expansiones geográficas e innovaciones tecnológicas en el mercado. Para comprender el análisis y el escenario del mercado, comuníquese con nosotros para obtener un resumen analítico; nuestro equipo lo ayudará a crear una solución de impacto en los ingresos para lograr su objetivo deseado.
Mercado europeo de ingredientes bioactivosAlcance y tamaño del mercado de ingredientes bioactivos en Europa

El mercado europeo de ingredientes bioactivos se clasifica en tres segmentos notables, que se basan en el tipo de ingrediente, la aplicación y la fuente. El crecimiento entre segmentos le ayuda a analizar nichos de crecimiento y estrategias para abordar el mercado y determinar sus áreas de aplicación principales y la diferencia en sus mercados objetivo.

  • On the basis of ingredient type, the global bioactive ingredient market is segmented into prebiotic, probiotics, amino acid, peptides, omega 3 and structured lipid, phytochemicals & plant extracts, minerals, vitamins, fibers, and specialty carbohydrates, carotenoids and antioxidants and others. Prebiotic is further segmented into fructans, galacto-oligosaccharides, starch and glucose-derived oligosaccharides, non-carbohydrate oligosaccharides, and others. Probiotics is further segmented into lactobacilli, bifidobacteria, yeasts. Amino acid is further segmented into isoleucine, histidine, leucine, lysine, methionine, phenylalanine, threonine, tryptophan, valine and others. Peptides are further segmented into dipeptides, tripeptides, oligopeptides, and polypeptides. Minerals are further segmented into calcium, phosphorus, magnesium, sodium, potassium, manganese, iron, copper, iodine, zinc and others. Vitamins are further segmented into vitamin A, vitamin C, vitamin D, vitamin E, vitamin K, vitamin B1, vitamin B2, vitamin B3, vitamin B6, vitamin B12 and others.
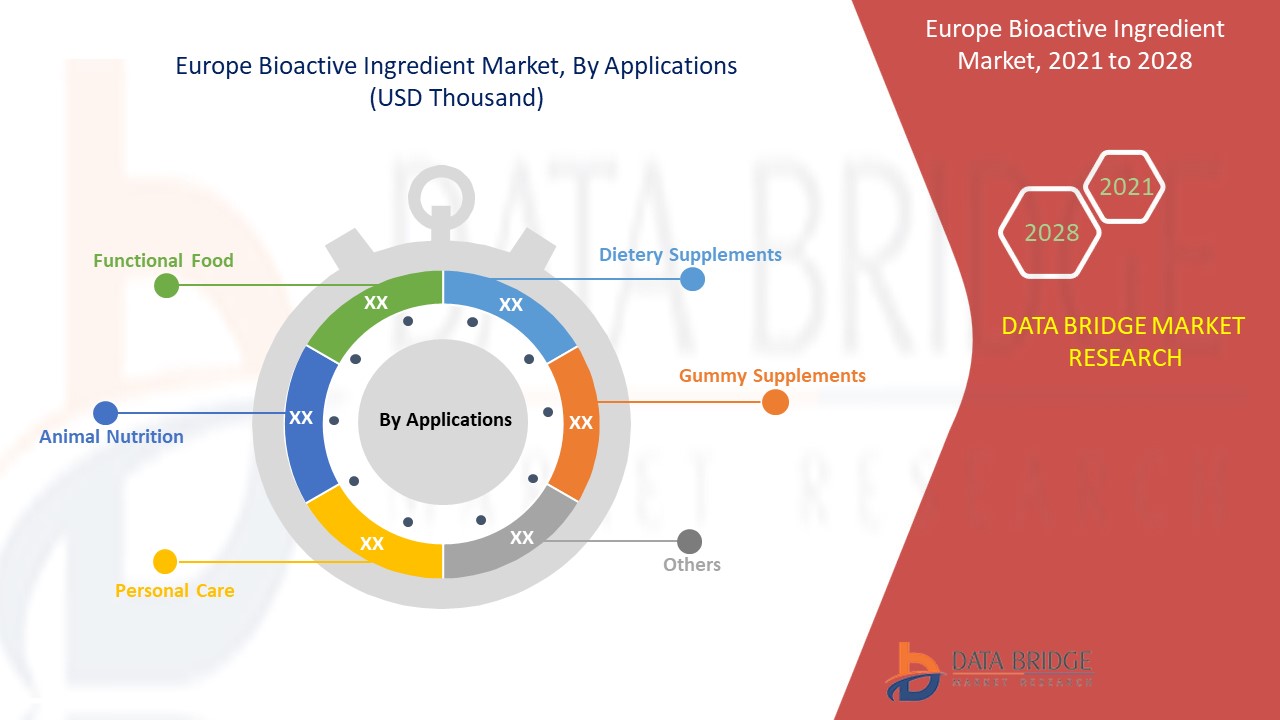
  • On the basis of application, the global bioactive ingredient market is segmented into functional food, dietary supplements, gummy supplements, animal nutrition, personal care, and others. Functional food is further segmented into dairy, dairy alternatives, bread, pasta, cereal, egg products, snack bars, bars, and beverages. Dairy is further sub-segmented into milk, yogurt, cheese, butter, and others. Dairy alternatives are further sub-segmented into plant-based milk, plant-based yogurt, bioactive ingredients and others. Bars are further sub-segmented into protein bars, sports nutrition bars, yoga bars, pre-workout bars, post-workout bars, and others. Beverages are further sub-segmented into juices and smoothies. Animal nutrition is further segmented by animal category into beef, poultry, seafood and pork. Personal care is further segmented into hair care and skincare.
  • On the basis of source, the global bioactive ingredient market is segmented into plant, animal and microbial.

Europe Bioactive ingredient Market Country Level Analysis

Europe bioactive ingredient market is analysed and market size information is provided by Ingredient, Application, Source.

The countries covered in Europe Bioactive Ingredient  market report are Germany, U.K., France, Italy, Spain, Netherlands, Belgium, Russia, Turkey, Switzerland, Poland, Denmark, and Rest of Europe.

Europe Bioactive ingredient market is dominating the market due to the growing population and rising illness in major section of the society

La sección de países del informe también proporciona factores de impacto individuales en el mercado y cambios en la regulación en el mercado a nivel nacional que afectan las tendencias actuales y futuras del mercado. Los puntos de datos como nuevas ventas, ventas de reemplazo, demografía del país, leyes regulatorias y aranceles de importación y exportación son algunos de los principales indicadores utilizados para pronosticar el escenario del mercado para países individuales. Además, la presencia y disponibilidad de marcas y sus desafíos enfrentados debido a la competencia grande o escasa de las marcas locales y nacionales, el impacto de los canales de venta se consideran al proporcionar un análisis de pronóstico de los datos del país.

Crecimiento de la industria de ingredientes bioactivos

El mercado europeo de ingredientes bioactivos también le ofrece un análisis detallado del mercado de cada país, el crecimiento de la base instalada de diferentes tipos de productos para el mercado de ingredientes bioactivos, el impacto de la tecnología mediante curvas de línea de vida y los cambios en los escenarios regulatorios de las fórmulas infantiles y su impacto en el mercado de ingredientes bioactivos. Los datos están disponibles para el período histórico de 2010 a 2019.

Análisis del panorama competitivo y de la cuota de mercado de los ingredientes bioactivos

El panorama competitivo del mercado de ingredientes bioactivos de Europa proporciona detalles por competidor. Los detalles incluidos son una descripción general de la empresa, las finanzas de la empresa, los ingresos generados, el potencial de mercado, la inversión en investigación y desarrollo, las nuevas iniciativas de mercado, la presencia global, los sitios e instalaciones de producción, las fortalezas y debilidades de la empresa, el lanzamiento de productos, las líneas de ensayos clínicos, el análisis de la marca, las aprobaciones de productos, las patentes, la amplitud y amplitud de los productos, el dominio de las aplicaciones y la curva de la línea de vida de la tecnología. Los puntos de datos anteriores proporcionados solo están relacionados con el enfoque de la empresa en relación con el mercado de ingredientes bioactivos de Europa.

Los principales actores del mercado involucrados en el mercado global de ingredientes bioactivos son DSM, BASF SE, Kerry, DuPont, ADM, Global Bio-chem Technology Group Company Limited, Evonik Industries AG, Cargill, Incorporated, Arla Food Ingredients Group P/S (una subsidiaria de Arla Foods amba), FMC Corporation, Sunrise Nutrachem Group, Adisseo (una subsidiaria de Bluestar Adisseo Co., Ltd.), Chr.Hansen Holding A/S, Sabinsa, Ajinomoto Co., Inc, NOVUS INTERNATIONAL (una subsidiaria de Mitsui & Co. (USA), Inc.), Ingredion, Roquette Frères, Probi y Advanced Animal Nutrition Pty Ltd. entre otros.

Por ejemplo,

  • En junio de 2020, Sabinsa lanzó un nuevo ingrediente de extracto de hierbas, 'Curcumins', que ayuda a reforzar el sistema inmunológico. El producto se implementó para brindar una nueva solución al mercado durante la época de COVID-19


SKU-

Obtenga acceso en línea al informe sobre la primera nube de inteligencia de mercado del mundo

  • Panel de análisis de datos interactivo
  • Panel de análisis de empresas para oportunidades con alto potencial de crecimiento
  • Acceso de analista de investigación para personalización y consultas
  • Análisis de la competencia con panel interactivo
  • Últimas noticias, actualizaciones y análisis de tendencias
  • Aproveche el poder del análisis de referencia para un seguimiento integral de la competencia
Solicitud de demostración

Tabla de contenido

  1. introduction
    1. OBJECTIVES OF THE STUDY
    2. MARKET DEFINITION
    3. OVERVIEW of EUROPE BIOACTIVE INGREDIENT MARKET
    4. LIMITATION
    5. MARKETS COVERED
  2. MARKET SEGMENTATION
    1. MARKETS COVERED
    2. geographicAL scope
    3. years considered for the study
    4. currency and pricing
    5. DBMR TRIPOD DATA VALIDATION MODEL
    6. Ingredient LIFE LINE CURVE
    7. MULTIVARIATE MODELING
    8. primary interviews with key opinion leaders
    9. DBMR MARKET POSITION GRID
    10. MARKET application COVERAGE GRID
    11. DBMR MARKET CHALLENGE MATRIX
    12. vendor share analysis
    13. IMPORT-EXPORT DATA
    14. secondary sourcEs
    15. assumptions
  3. EXECUTIVE SUMMARY
  4. premium insights
    1. Factors Influencing Purchasing Decision:
    2. MAJOR BRANDS COMPETITIVE ANALYSIS:
      1. NEW PRODUCT BRAND LAUNCHES AND INNOVATIONS
      2. Investments Made by Top Manufacturers
    3. REGULATORY FRAMEWORK AND GUIDELINES
    4. supply chain analysis
  5. market overview
    1. drivers
      1. Progressive use of bioactive ingredients in personal care products
      2. Growth in the co-prescription of bioactive ingredient along with traditional drugs
      3. Rising demand of bioactive ingredients in functional food
      4. Increasing adoption of bioactive ingredients in pharmaceuticals for chronic diseases
      5. Surge in the incidence of lifestyle diseases and lack of nutrition
    2. RESTRAINTS
      1. Lack of regulatory framework for validating heath claims
      2. Therapeutic constraints allied with bioactive ingredient
      3. Inadequate controls on safety and quality of bioactive ingredients
    3. OPPORTUNITIES
      1. Increasing awareness among consumers with rising preference for prevention instead of cure
      2. ADVANCEMENT IN R&D ASSOCIATED WITH ENCAPSULATION OF BIOACTIVE INGREDIENTS
      3. Growing trust among the consumers towards herbal ingredients and its involvement in bioactive market
    4. Challenges
      1. EXTRACTION OF THE BIOACTIVE COMPOUNDS AND MAINTAINING GOOD RECOVERY
      2. Valorization of fruit and vegetable wastes as bioactive compounds
  6. Analysis on Impact of Covid-19 on ‘Europe Bioactive ingredient Market”
    1. IMPACT ON PRICE
    2. IMPACT ON DEMAND
    3. Impact on supply chain
    4. Conclusion
  7. Europe Bioactive ingredient market, BY Ingredient Type
    1. overview
    2. Peptides
      1. Dipeptides
      2. Tripeptides
      3. Oligopeptides
      4. Polypeptides
    3. Prebiotic
      1. Fructans
      2. Galacto-Oligosaccharides
      3. Starch and Glucose-Derived Oligosaccharides
      4. Non-Carbohydrate Oligosaccharides
      5. Others
    4. Probiotics
      1. Lactobacilli
      2. Bifidobacteria
      3. Yeasts
    5. Minerals
      1. Zinc
      2. Calcium
      3. Phosphorus
      4. Magnesium
      5. Sodium
      6. Potassium
      7. Manganese
      8. Iron
      9. Copper
      10. Iodine
      11. Others
    6. Vitamins
      1. Vitamin A
      2. Vitamin c
      3. Vitamin d
      4. Vitamin E
      5. Vitamin K
      6. Vitamin B1
      7. Vitamin B2
      8. Vitamin B3
      9. Vitamin B6
      10. Vitamin B12
      11. Others
    7. Amino Acid
      1. Isoleucine
      2. Histidine
      3. Leucine
      4. Lysine
      5. Methionine
      6. Phenylalanine
      7. Threonine
      8. Tryptophan
      9. Valine
      10. Others
    8. Omega 3 and Structured Lipi
    9. Phytochemicals & Plant Extracts
    10. Fibers and Specialty Carbohydrates
    11. Carotenoids & Antioxidants
    12. Others
  8. Europe Bioactive ingredient market, BY Applications
    1. overview
    2. Functional Food
      1. Dairy
        1. Milk
        2. Yogurt
        3. Cheese
        4. Butter
        5. Others
    3. Dairy Alternatives
      1. Plant-Based Milk
      2. Plant-Based Yogurt
      3. Bioactive Ingredients
      4. Others
    4. Bread
    5. Cereal
    6. Egg Products
    7. Beverages
      1. Juices
      2. Smoothies
    8. Bars
      1. Protein Bars
      2. Sports Nutrition Bars
      3. Pre Work Out Bars
      4. Post Work Out Bars
      5. Others
    9. Pasta
    10. Snack Bars
    11. Animal Nutrition
      1. ANIMAL NUTRITION, BY ANIMAL CATEGORY
        1. Poultry
        2. Seafood
        3. Beef
        4. Pork
    12. Personal Care
      1. Hair Care
      2. Skin Care
    13. Dietary Supplements
    14. Gummy Supplements
    15. Others
  9. Europe Bioactive ingredient market, BY Source
    1. overview
    2. Plant
    3. Animal
    4. Microbial
  10. EUROPE Bioactive ingredient Market, BY GEOGRAPHY
    1. Europe
      1. Germany
      2. U.K.
      3. France
      4. ITALY
      5. Spain
      6. Netherlands
      7. Belgium
      8. Russia
      9. Turkey
      10. SWItzerland
      11. Denmark
      12. Sweden
      13. Poland
      14. Rest of Europe
  11. EUROPE BIOACTIVE INGREDIENT MARKET: COMPANY landscape
    1. company share analysis: EUROPE
  12. COMPANY PROFILE
    1. dsm
      1. COMPANY SNAPSHOT
      2. REVENUE ANALYSIS
      3. COMPANY SHARE ANALYSIS
      4. PRODUCT PORTFOLIO
      5. RECENT UPDATE
    2. basf se
      1. COMPANY SNAPSHOT
      2. REVENUE ANALYSIS
      3. COMPANY SHARE ANALYSIS
      4. PRODUCT PORTFOLIO
      5. RECENT UPDATES
    3. KERRY
      1. COMPANY SNAPSHOT
      2. REVENUE ANALYSIS
      3. COMPANY SHARE ANALYSIS
      4. PRODUCT PORTFOLIO
      5. RECENT UPDATE
    4. dupont
      1. COMPANY SNAPSHOT
      2. REVENUE ANALYSIS
      3. COMPANY SHARE ANALYSIS
      4. PRODUCT PORTFOLIO
      5. RECENT UPDATES
    5. ADM
      1. COMPANY SNAPSHOT
      2. REVENUE ANALYSIS
      3. COMPANY SHARE ANALYSIS
      4. PRODUCT PORTFOLIO
      5. RECENT UPDATE
    6. EUROPE BIO-CHEM TECHNOLOGY GROUP COMPANY LIMITED
      1. COMPANY SNAPSHOT
      2. REVENUE ANALYSIS
      3. PRODUCT PORTFOLIO
      4. RECENT UPDATE
    7. EVONIK Industries AG
      1. COMPANY SNAPSHOT
      2. REVENUE ANALYSIS
      3. PRODUCT PORTFOLIO
      4. RECENT UPDATE
    8. CARGILL, Incorporated
      1. COMPANY SNAPSHOT
      2. REVENUE ANALYSIS
      3. PRODUCT PORTFOLIO
      4. RECENT UPDATE
    9. Adisseo (A subsidiary of bluestar adisseo co., ltd.)
      1. COMPANY SNAPSHOT
      2. REVENUE ANALYSIS
      3. PRODUCT PORTFOLIO
      4. RECENT UPDATE
    10. Advanced animal nutrition pty ltd.
      1. COMPANY SNAPSHOT
      2. PRODUCT PORTFOLIO
      3. RECENT UPDATE
    11. Ajinomoto Co., Inc.
      1. COMPANY SNAPSHOT
      2. REVENUE ANALYSIS
      3. PRODUCT PORTFOLIO
      4. RECENT UPDATES
    12. Arla Food Ingrediants Group P/S (a subsidiary of Arla foods amba)
      1. COMPANY SNAPSHOT
      2. REVENUE ANALYSIS
      3. PRODUCT PORTFOLIO
      4. RECENT UPDATES
    13. Chr. hansen holding a/s
      1. COMPANY SNAPSHOT
      2. REVENUE ANALYSIS
      3. PRODUCT PORTFOLIO
      4. RECENT UPDATES
    14. FMC CORPORATION
      1. COMPANY SNAPSHOT
      2. REVENUE ANALYSIS
      3. PRODUCT PORTFOLIO
      4. RECENT UPDATE
    15. INGREDION
      1. COMPANY SNAPSHOT
      2. REVENUE ANALYSIS
      3. PRODUCT PORTFOLIO
      4. RECENT UPDATE
    16. novus international (A SUBSIDIARY OF Mitsui & Co. (U.S.A.), Inc.)
      1. COMPANY SNAPSHOT
      2. REVENUE ANALYSIS
      3. PRODUCT PORTFOLIO
      4. RECENT UPDATE
    17. pROBI
      1. COMPANY SNAPSHOT
      2. REVENUE ANALYSIS
      3. SOLUTION PORTFOLIO
      4. RECENT UPDATE
    18. Roquette FrèreS
      1. COMPANY SNAPSHOT
      2. PRODUCT PORTFOLIO
      3. RECENT UPDATE
    19. SabinsA
      1. COMPANY SNAPSHOT
      2. PRODUCT PORTFOLIO
      3. RECENT UPDATES
    20. sunrise nutrachem grouP
      1. COMPANY SNAPSHOT
      2. PRODUCT PORTFOLIO
      3. RECENT UPDATES
  13. QUESTIONNAIRES
  14. related reports

Lista de Tablas

TABLE 1 IMPORT DATA of Food preparations, n.e.s.; HS Code - 210690 (USD Thousand)

TABLE 2 EXPORT DATA OF FOOD PREPARATIONS, N.E.S.; HS CODE - 210690 (USD THOUSAND)

TABLE 1 Europe bioactive ingredient market, By Ingredient Type, 2019-2028 (USD Thousand)

TABLE 2 Europe Bioactive ingredient Market, By Ingredient Type, 2019-2028 (Tons)

TABLE 3 Europe Peptides in bioactive ingredient MARKET, BY REGION, 2019-2028 (USD Thousand)

TABLE 4 Europe Peptides in bioactive ingredient MARKET, BY REGION, 2019-2028 (Tons)

TABLE 5 Europe Peptides in Bioactive Ingredient Market, By Ingredient Type, 2019-2028 (USD Thousand)

TABLE 6 Europe prebiotic in bioactive ingredient MARKET, BY REGION, 2019-2028 (USD Thousand)

TABLE 7 Europe prebiotic in bioactive ingredient MARKET, BY REGION, 2019-2028 (Tons)

TABLE 8 Europe Prebiotic in Bioactive Ingredient Market, By Ingredient Type, 2019-2028 (USD Thousand)

TABLE 9 Europe Probiotics in bioactive ingredient MARKET, BY REGION, 2019-2028 (USD Thousand)

TABLE 10 Europe Probiotics in bioactive ingredient MARKET, BY REGION, 2019-2028 (Tons)

TABLE 11 Europe Probiotic in Bioactive Ingredient Market, By Ingredient Type, 2019-2028 (USD Thousand)

TABLE 12 Europe Minerals in bioactive ingredient MARKET, BY REGION, 2019-2028 (USD Thousand)

TABLE 13 Europe Minerals in bioactive ingredient MARKET, BY REGION, 2019-2028 (Tons)

TABLE 14 Europe Minerals in Bioactive Ingredient Market, By Ingredient Type, 2019-2028 (USD Thousand)

TABLE 15 Europe Vitamins in bioactive ingredient MARKET, BY REGION, 2019-2028 (USD Thousand)

TABLE 16 Europe Vitamins in bioactive ingredient MARKET, BY REGION, 2019-2028 (Tons)

TABLE 17 Europe Vitamins in Bioactive Ingredient Market, By Ingredient Type, 2019-2028 (USD Thousand)

TABLE 18 Europe Amino Acid in bioactive ingredient MARKET, BY REGION, 2019-2028 (USD Thousand)

TABLE 19 Europe Amino Acid in bioactive ingredient MARKET, BY REGION, 2019-2028 (Tons)

TABLE 20 Europe AMINO ACID in Bioactive Ingredient Market, By Ingredient Type, 2019-2028 (USD Thousand)

TABLE 21 Europe Omega 3 and Structured Lipi in bioactive ingredient MARKET, BY REGION, 2019-2028 (USD Thousand)

TABLE 22 Europe Omega 3 and Structured Lipi in bioactive ingredient MARKET, BY REGION, 2019-2028 (Tons)

TABLE 23 Europe Phytochemicals & Plant Extracts in bioactive ingredient MARKET, BY REGION, 2019-2028 (USD Thousand)

TABLE 24 Europe Phytochemicals & Plant Extracts in bioactive ingredient MARKET, BY REGION, 2019-2028 (Tons)

TABLE 25 Europe Fibers and Specialty Carbohydrates in bioactive ingredient MARKET, BY REGION, 2019-2028 (USD Thousand)

TABLE 26 Europe Fibers and Specialty Carbohydrates in bioactive ingredient MARKET, BY REGION, 2019-2028 (Tons)

TABLE 27 Europe Carotenoids & Antioxidants in bioactive ingredient MARKET, BY REGION, 2019-2028 (USD Thousand)

TABLE 28 Europe Carotenoids & Antioxidants in bioactive ingredient MARKET, BY REGION, 2019-2028 (Tons)

TABLE 29 Europe Others in bioactive ingredient MARKET, BY REGION, 2019-2028 (USD Thousand)

TABLE 30 Europe Others in bioactive ingredient MARKET, BY REGION, 2019-2028 (Tons)

TABLE 31 Europe bioactive ingredient market, By Applications, 2019-2028 (USD Thousand)

TABLE 32 Europe Functional Food in bioactive ingredient MARKET, BY REGION, 2019-2028 (USD Thousand)

TABLE 33 Europe Functional Food in Bioactive Ingredient Market, By Applications, 2019-2028 (USD Thousand)

TABLE 34 Europe Dairy in Bioactive Ingredient Market, By Applications, 2019-2028 (USD Thousand)

TABLE 35 Europe Dairy alternatives in Bioactive Ingredient Market, By Applications, 2019-2028 (USD Thousand)

TABLE 36 Europe Beverages in Bioactive Ingredient Market, By Applications, 2019-2028 (USD Thousand)

TABLE 37 Europe Bars in Bioactive Ingredient Market, By Applications, 2019-2028 (USD Thousand)

TABLE 38 Europe Animal Nutrition in bioactive ingredient MARKET, BY REGION, 2019-2028 (USD Thousand)

TABLE 39 Europe Animal Nutrition in Bioactive Ingredient Market, By Applications, 2019-2028 (USD Thousand)

TABLE 40 Europe Personal Care in bioactive ingredient MARKET, BY REGION, 2019-2028 (USD Thousand)

TABLE 41 Europe Personal care in Bioactive Ingredient Market, By Applications, 2019-2028 (USD Thousand)

TABLE 42 Europe Dietary Supplements in bioactive ingredient MARKET, BY REGION, 2019-2028 (USD Thousand)

TABLE 43 Europe Gummy Supplements in bioactive ingredient MARKET, BY REGION, 2019-2028 (USD Thousand)

TABLE 44 Europe Others in bioactive ingredient MARKET, BY REGION, 2019-2028 (USD Thousand)

TABLE 45 Europe bioactive ingredient market, By Source, 2019-2028 (USD Thousand)

TABLE 46 Europe Plant in bioactive ingredient MARKET, BY REGION, 2019-2028 (USD Thousand)

TABLE 47 Europe Animal in bioactive ingredient MARKET, BY REGION, 2019-2028 (USD Thousand)

TABLE 48 Europe Microbial in bioactive ingredient MARKET, BY REGION, 2019-2028 (USD Thousand)

TABLE 49 Europe bioactive ingredient Market, BY COUNtry, 2019-2028 (USD Thousand)

TABLE 50 Europe bioactive ingredient Market, BY COUNtry, 2019-2028 (tons)

TABLE 51 Europe Bioactive ingredient Market, By Ingredient Type, 2019-2028 (USD Thousand)

TABLE 52 Europe Bioactive ingredient Market, By Ingredient Type, 2019-2028 (Tons)

TABLE 53 Europe Peptides in Bioactive ingredient Market, By Ingredient Type, 2019-2028 (USD Thousand)

TABLE 54 Europe Prebiotic in Bioactive ingredient Market, By Ingredient Type, 2019-2028 (USD Thousand)

TABLE 55 Europe Probiotic in Bioactive ingredient Market, By Ingredient Type, 2019-2028 (USD Thousand)

TABLE 56 Europe Minerals in Bioactive ingredient Market, By Ingredient Type, 2019-2028 (USD Thousand)

TABLE 57 Europe Vitamins in Bioactive ingredient Market, By Ingredient Type, 2019-2028 (USD Thousand)

TABLE 58 Europe Amino Acid in Bioactive ingredient Market, By Ingredient Type, 2019-2028 (USD Thousand)

TABLE 59 Europe Bioactive ingredient Market, By Applications, 2019-2028 (USD Thousand)

TABLE 60 Europe Functional Food in Bioactive ingredient Market, By Applications, 2019-2028 (USD Thousand)

TABLE 61 Europe Dairy in Bioactive ingredient Market, By Applications, 2019-2028 (USD Thousand)

TABLE 62 Europe Dairy Alternatives in Bioactive ingredient Market, By Applications, 2019-2028 (USD Thousand)

TABLE 63 Europe Beverages in Bioactive ingredient Market, By Applications, 2019-2028 (USD Thousand)

TABLE 64 Europe Bars in Bioactive ingredient Market, By Applications, 2019-2028 (USD Thousand)

TABLE 65 Europe Animal Nutrition in Bioactive ingredient Market, By Applications, 2019-2028 (USD Thousand)

TABLE 66 Europe Personal Care in Bioactive ingredient Market, By Applications, 2019-2028 (USD Thousand)

TABLE 67 Europe Bioactive ingredient Market, By Source, 2019-2028 (USD Thousand)

TABLE 68 GERMANY Bioactive ingredient Market, By Ingredient Type, 2019-2028 (USD Thousand)

TABLE 69 GERMANY Bioactive ingredient Market, By Ingredient Type, 2019-2028 (Tons)

TABLE 70 GERMANY Peptides in Bioactive ingredient Market, By Ingredient Type, 2019-2028 (USD Thousand)

TABLE 71 GERMANY Prebiotic in Bioactive ingredient Market, By Ingredient Type, 2019-2028 (USD Thousand)

TABLE 72 GERMANY Probiotic in Bioactive ingredient Market, By Ingredient Type, 2019-2028 (USD Thousand)

TABLE 73 GERMANY Minerals in Bioactive ingredient Market, By Ingredient Type, 2019-2028 (USD Thousand)

TABLE 74 GERMANY Vitamins in Bioactive ingredient Market, By Ingredient Type, 2019-2028 (USD Thousand)

TABLE 75 GERMANY Amino Acid in Bioactive ingredient Market, By Ingredient Type, 2019-2028 (USD Thousand)

TABLE 76 GERMANY Bioactive ingredient Market, By Applications, 2019-2028 (USD Thousand)

TABLE 77 GERMANY Functional Food in Bioactive ingredient Market, By Applications, 2019-2028 (USD Thousand)

TABLE 78 GERMANY Dairy in Bioactive ingredient Market, By Applications, 2019-2028 (USD Thousand)

TABLE 79 GERMANY Dairy Alternatives in Bioactive ingredient Market, By Applications, 2019-2028 (USD Thousand)

TABLE 80 GERMANY Beverages in Bioactive ingredient Market, By Applications, 2019-2028 (USD Thousand)

TABLE 81 GERMANY Bars in Bioactive ingredient Market, By Applications, 2019-2028 (USD Thousand)

TABLE 82 GERMANY Animal Nutrition in Bioactive ingredient Market, By Applications, 2019-2028 (USD Thousand)

TABLE 83 GERMANY Personal Care in Bioactive ingredient Market, By Applications, 2019-2028 (USD Thousand)

TABLE 84 GERMANY Bioactive ingredient Market, By Source, 2019-2028 (USD Thousand)

TABLE 85 U.K. Bioactive ingredient Market, By Ingredient Type, 2019-2028 (USD Thousand)

TABLE 86 U.K. Bioactive ingredient Market, By Ingredient Type, 2019-2028 (Tons)

TABLE 87 U.K. Peptides in Bioactive ingredient Market, By Ingredient Type, 2019-2028 (USD Thousand)

TABLE 88 U.K. Prebiotic in Bioactive ingredient Market, By Ingredient Type, 2019-2028 (USD Thousand)

TABLE 89 U.K. Probiotic in Bioactive ingredient Market, By Ingredient Type, 2019-2028 (USD Thousand)

TABLE 90 U.K. Minerals in Bioactive ingredient Market, By Ingredient Type, 2019-2028 (USD Thousand)

TABLE 91 U.K. Vitamins in Bioactive ingredient Market, By Ingredient Type, 2019-2028 (USD Thousand)

TABLE 92 U.K. Amino Acid in Bioactive ingredient Market, By Ingredient Type, 2019-2028 (USD Thousand)

TABLE 93 U.K. Bioactive ingredient Market, By Applications, 2019-2028 (USD Thousand)

TABLE 94 U.K. Functional Food in Bioactive ingredient Market, By Applications, 2019-2028 (USD Thousand)

TABLE 95 U.K. Dairy in Bioactive ingredient Market, By Applications, 2019-2028 (USD Thousand)

TABLE 96 U.K. Dairy Alternatives in Bioactive ingredient Market, By Applications, 2019-2028 (USD Thousand)

TABLE 97 U.K. Beverages in Bioactive ingredient Market, By Applications, 2019-2028 (USD Thousand)

TABLE 98 U.K. Bars in Bioactive ingredient Market, By Applications, 2019-2028 (USD Thousand)

TABLE 99 U.K. Animal Nutrition in Bioactive ingredient Market, By Applications, 2019-2028 (USD Thousand)

TABLE 100 U.K. Personal Care in Bioactive ingredient Market, By Applications, 2019-2028 (USD Thousand)

TABLE 101 U.K. Bioactive ingredient Market, By Source, 2019-2028 (USD Thousand)

TABLE 102 FRANCE Bioactive ingredient Market, By Ingredient Type, 2019-2028 (USD Thousand)

TABLE 103 FRANCE Bioactive ingredient Market, By Ingredient Type, 2019-2028 (Tons)

TABLE 104 FRANCE Peptides in Bioactive ingredient Market, By Ingredient Type, 2019-2028 (USD Thousand)

TABLE 105 FRANCE Prebiotic in Bioactive ingredient Market, By Ingredient Type, 2019-2028 (USD Thousand)

TABLE 106 FRANCE Probiotic in Bioactive ingredient Market, By Ingredient Type, 2019-2028 (USD Thousand)

TABLE 107 FRANCE Minerals in Bioactive ingredient Market, By Ingredient Type, 2019-2028 (USD Thousand)

TABLE 108 FRANCE Vitamins in Bioactive ingredient Market, By Ingredient Type, 2019-2028 (USD Thousand)

TABLE 109 FRANCE Amino Acid in Bioactive ingredient Market, By Ingredient Type, 2019-2028 (USD Thousand)

TABLE 110 FRANCE Bioactive ingredient Market, By Applications, 2019-2028 (USD Thousand)

TABLE 111 FRANCE Functional Food in Bioactive ingredient Market, By Applications, 2019-2028 (USD Thousand)

TABLE 112 FRANCE Dairy in Bioactive ingredient Market, By Applications, 2019-2028 (USD Thousand)

TABLE 113 FRANCE Dairy Alternatives in Bioactive ingredient Market, By Applications, 2019-2028 (USD Thousand)

TABLE 114 FRANCE Beverages in Bioactive ingredient Market, By Applications, 2019-2028 (USD Thousand)

TABLE 115 FRANCE Bars in Bioactive ingredient Market, By Applications, 2019-2028 (USD Thousand)

TABLE 116 FRANCE Animal Nutrition in Bioactive ingredient Market, By Applications, 2019-2028 (USD Thousand)

TABLE 117 FRANCE Personal Care in Bioactive ingredient Market, By Applications, 2019-2028 (USD Thousand)

TABLE 118 FRANCE Bioactive ingredient Market, By Source, 2019-2028 (USD Thousand)

TABLE 119 ITALY Bioactive ingredient Market, By Ingredient Type, 2019-2028 (USD Thousand)

TABLE 120 ITALY Bioactive ingredient Market, By Ingredient Type, 2019-2028 (Tons)

TABLE 121 ITALY Peptides in Bioactive ingredient Market, By Ingredient Type, 2019-2028 (USD Thousand)

TABLE 122 ITALY Prebiotic in Bioactive ingredient Market, By Ingredient Type, 2019-2028 (USD Thousand)

TABLE 123 ITALY Probiotic in Bioactive ingredient Market, By Ingredient Type, 2019-2028 (USD Thousand)

TABLE 124 ITALY Minerals in Bioactive ingredient Market, By Ingredient Type, 2019-2028 (USD Thousand)

TABLE 125 ITALY Vitamins in Bioactive ingredient Market, By Ingredient Type, 2019-2028 (USD Thousand)

TABLE 126 ITALY Amino Acid in Bioactive ingredient Market, By Ingredient Type, 2019-2028 (USD Thousand)

TABLE 127 ITALY Bioactive ingredient Market, By Applications, 2019-2028 (USD Thousand)

TABLE 128 ITALY Functional Food in Bioactive ingredient Market, By Applications, 2019-2028 (USD Thousand)

TABLE 129 ITALY Dairy in Bioactive ingredient Market, By Applications, 2019-2028 (USD Thousand)

TABLE 130 ITALY Dairy Alternatives in Bioactive ingredient Market, By Applications, 2019-2028 (USD Thousand)

TABLE 131 ITALY Beverages in Bioactive ingredient Market, By Applications, 2019-2028 (USD Thousand)

TABLE 132 ITALY Bars in Bioactive ingredient Market, By Applications, 2019-2028 (USD Thousand)

TABLE 133 ITALY Animal Nutrition in Bioactive ingredient Market, By Applications, 2019-2028 (USD Thousand)

TABLE 134 ITALY Personal Care in Bioactive ingredient Market, By Applications, 2019-2028 (USD Thousand)

TABLE 135 ITALY Bioactive ingredient Market, By Source, 2019-2028 (USD Thousand)

TABLE 136 SPAIN Bioactive ingredient Market, By Ingredient Type, 2019-2028 (USD Thousand)

TABLE 137 SPAIN Bioactive ingredient Market, By Ingredient Type, 2019-2028 (Tons)

TABLE 138 SPAIN Peptides in Bioactive ingredient Market, By Ingredient Type, 2019-2028 (USD Thousand)

TABLE 139 SPAIN Prebiotic in Bioactive ingredient Market, By Ingredient Type, 2019-2028 (USD Thousand)

TABLE 140 SPAIN Probiotic in Bioactive ingredient Market, By Ingredient Type, 2019-2028 (USD Thousand)

TABLE 141 SPAIN Minerals in Bioactive ingredient Market, By Ingredient Type, 2019-2028 (USD Thousand)

TABLE 142 SPAIN Vitamins in Bioactive ingredient Market, By Ingredient Type, 2019-2028 (USD Thousand)

TABLE 143 SPAIN Amino Acid in Bioactive ingredient Market, By Ingredient Type, 2019-2028 (USD Thousand)

TABLE 144 SPAIN Bioactive ingredient Market, By Applications, 2019-2028 (USD Thousand)

TABLE 145 SPAIN Functional Food in Bioactive ingredient Market, By Applications, 2019-2028 (USD Thousand)

TABLE 146 SPAIN Dairy in Bioactive ingredient Market, By Applications, 2019-2028 (USD Thousand)

TABLE 147 SPAIN Dairy Alternatives in Bioactive ingredient Market, By Applications, 2019-2028 (USD Thousand)

TABLE 148 SPAIN Beverages in Bioactive ingredient Market, By Applications, 2019-2028 (USD Thousand)

TABLE 149 SPAIN Bars in Bioactive ingredient Market, By Applications, 2019-2028 (USD Thousand)

TABLE 150 SPAIN Animal Nutrition in Bioactive ingredient Market, By Applications, 2019-2028 (USD Thousand)

TABLE 151 SPAIN Personal Care in Bioactive ingredient Market, By Applications, 2019-2028 (USD Thousand)

TABLE 152 SPAIN Bioactive ingredient Market, By Source, 2019-2028 (USD Thousand)

TABLE 153 NETHERLANDS Bioactive ingredient Market, By Ingredient Type, 2019-2028 (USD Thousand)

TABLE 154 NETHERLANDS Bioactive ingredient Market, By Ingredient Type, 2019-2028 (Tons)

TABLE 155 NETHERLANDS Peptides in Bioactive ingredient Market, By Ingredient Type, 2019-2028 (USD Thousand)

TABLE 156 NETHERLANDS Prebiotic in Bioactive ingredient Market, By Ingredient Type, 2019-2028 (USD Thousand)

TABLE 157 NETHERLANDS Probiotic in Bioactive ingredient Market, By Ingredient Type, 2019-2028 (USD Thousand)

TABLE 158 NETHERLANDS Minerals in Bioactive ingredient Market, By Ingredient Type, 2019-2028 (USD Thousand)

TABLE 159 NETHERLANDS Vitamins in Bioactive ingredient Market, By Ingredient Type, 2019-2028 (USD Thousand)

TABLE 160 NETHERLANDS Amino Acid in Bioactive ingredient Market, By Ingredient Type, 2019-2028 (USD Thousand)

TABLE 161 NETHERLANDS Bioactive ingredient Market, By Applications, 2019-2028 (USD Thousand)

TABLE 162 NETHERLANDS Functional Food in Bioactive ingredient Market, By Applications, 2019-2028 (USD Thousand)

TABLE 163 NETHERLANDS Dairy in Bioactive ingredient Market, By Applications, 2019-2028 (USD Thousand)

TABLE 164 NETHERLANDS Dairy Alternatives in Bioactive ingredient Market, By Applications, 2019-2028 (USD Thousand)

TABLE 165 NETHERLANDS Beverages in Bioactive ingredient Market, By Applications, 2019-2028 (USD Thousand)

TABLE 166 NETHERLANDS Bars in Bioactive ingredient Market, By Applications, 2019-2028 (USD Thousand)

TABLE 167 NETHERLANDS Animal Nutrition in Bioactive ingredient Market, By Applications, 2019-2028 (USD Thousand)

TABLE 168 NETHERLANDS Personal Care in Bioactive ingredient Market, By Applications, 2019-2028 (USD Thousand)

TABLE 169 NETHERLANDS Bioactive ingredient Market, By Source, 2019-2028 (USD Thousand)

TABLE 170 BELGIUM Bioactive ingredient Market, By Ingredient Type, 2019-2028 (USD Thousand)

TABLE 171 BELGIUM Bioactive ingredient Market, By Ingredient Type, 2019-2028 (Tons)

TABLE 172 BELGIUM Peptides in Bioactive ingredient Market, By Ingredient Type, 2019-2028 (USD Thousand)

TABLE 173 BELGIUM Prebiotic in Bioactive ingredient Market, By Ingredient Type, 2019-2028 (USD Thousand)

TABLE 174 BELGIUM Probiotic in Bioactive ingredient Market, By Ingredient Type, 2019-2028 (USD Thousand)

TABLE 175 BELGIUM Minerals in Bioactive ingredient Market, By Ingredient Type, 2019-2028 (USD Thousand)

TABLE 176 BELGIUM Vitamins in Bioactive ingredient Market, By Ingredient Type, 2019-2028 (USD Thousand)

TABLE 177 BELGIUM Amino Acid in Bioactive ingredient Market, By Ingredient Type, 2019-2028 (USD Thousand)

TABLE 178 BELGIUM Bioactive ingredient Market, By Applications, 2019-2028 (USD Thousand)

TABLE 179 BELGIUM Functional Food in Bioactive ingredient Market, By Applications, 2019-2028 (USD Thousand)

TABLE 180 BELGIUM Dairy in Bioactive ingredient Market, By Applications, 2019-2028 (USD Thousand)

TABLE 181 BELGIUM Dairy Alternatives in Bioactive ingredient Market, By Applications, 2019-2028 (USD Thousand)

TABLE 182 BELGIUM Beverages in Bioactive ingredient Market, By Applications, 2019-2028 (USD Thousand)

TABLE 183 BELGIUM Bars in Bioactive ingredient Market, By Applications, 2019-2028 (USD Thousand)

TABLE 184 BELGIUM Animal Nutrition in Bioactive ingredient Market, By Applications, 2019-2028 (USD Thousand)

TABLE 185 BELGIUM Personal Care in Bioactive ingredient Market, By Applications, 2019-2028 (USD Thousand)

TABLE 186 BELGIUM Bioactive ingredient Market, By Source, 2019-2028 (USD Thousand)

TABLE 187 RUSSIA Bioactive ingredient Market, By Ingredient Type, 2019-2028 (USD Thousand)

TABLE 188 RUSSIA Bioactive ingredient Market, By Ingredient Type, 2019-2028 (Tons)

TABLE 189 RUSSIA Peptides in Bioactive ingredient Market, By Ingredient Type, 2019-2028 (USD Thousand)

TABLE 190 RUSSIA Prebiotic in Bioactive ingredient Market, By Ingredient Type, 2019-2028 (USD Thousand)

TABLE 191 RUSSIA Probiotic in Bioactive ingredient Market, By Ingredient Type, 2019-2028 (USD Thousand)

TABLE 192 RUSSIA Minerals in Bioactive ingredient Market, By Ingredient Type, 2019-2028 (USD Thousand)

TABLE 193 RUSSIA Vitamins in Bioactive ingredient Market, By Ingredient Type, 2019-2028 (USD Thousand)

TABLE 194 RUSSIA Amino Acid in Bioactive ingredient Market, By Ingredient Type, 2019-2028 (USD Thousand)

TABLE 195 RUSSIA Bioactive ingredient Market, By Applications, 2019-2028 (USD Thousand)

TABLE 196 RUSSIA Functional Food in Bioactive ingredient Market, By Applications, 2019-2028 (USD Thousand)

TABLE 197 RUSSIA Dairy in Bioactive ingredient Market, By Applications, 2019-2028 (USD Thousand)

TABLE 198 RUSSIA Dairy Alternatives in Bioactive ingredient Market, By Applications, 2019-2028 (USD Thousand)

TABLE 199 RUSSIA Beverages in Bioactive ingredient Market, By Applications, 2019-2028 (USD Thousand)

TABLE 200 RUSSIA Bars in Bioactive ingredient Market, By Applications, 2019-2028 (USD Thousand)

TABLE 201 RUSSIA Animal Nutrition in Bioactive ingredient Market, By Applications, 2019-2028 (USD Thousand)

TABLE 202 RUSSIA Personal Care in Bioactive ingredient Market, By Applications, 2019-2028 (USD Thousand)

TABLE 203 RUSSIA Bioactive ingredient Market, By Source, 2019-2028 (USD Thousand)

TABLE 204 TURKEY Bioactive ingredient Market, By Ingredient Type, 2019-2028 (USD Thousand)

TABLE 205 TURKEY Bioactive ingredient Market, By Ingredient Type, 2019-2028 (Tons)

TABLE 206 TURKEY Peptides in Bioactive ingredient Market, By Ingredient Type, 2019-2028 (USD Thousand)

TABLE 207 TURKEY Prebiotic in Bioactive ingredient Market, By Ingredient Type, 2019-2028 (USD Thousand)

TABLE 208 TURKEY Probiotic in Bioactive ingredient Market, By Ingredient Type, 2019-2028 (USD Thousand)

TABLE 209 TURKEY Minerals in Bioactive ingredient Market, By Ingredient Type, 2019-2028 (USD Thousand)

TABLE 210 TURKEY Vitamins in Bioactive ingredient Market, By Ingredient Type, 2019-2028 (USD Thousand)

TABLE 211 TURKEY Amino Acid in Bioactive ingredient Market, By Ingredient Type, 2019-2028 (USD Thousand)

TABLE 212 TURKEY Bioactive ingredient Market, By Applications, 2019-2028 (USD Thousand)

TABLE 213 TURKEY Functional Food in Bioactive ingredient Market, By Applications, 2019-2028 (USD Thousand)

TABLE 214 TURKEY Dairy in Bioactive ingredient Market, By Applications, 2019-2028 (USD Thousand)

TABLE 215 TURKEY Dairy Alternatives in Bioactive ingredient Market, By Applications, 2019-2028 (USD Thousand)

TABLE 216 TURKEY Beverages in Bioactive ingredient Market, By Applications, 2019-2028 (USD Thousand)

TABLE 217 TURKEY Bars in Bioactive ingredient Market, By Applications, 2019-2028 (USD Thousand)

TABLE 218 TURKEY Animal Nutrition in Bioactive ingredient Market, By Applications, 2019-2028 (USD Thousand)

TABLE 219 TURKEY Personal Care in Bioactive ingredient Market, By Applications, 2019-2028 (USD Thousand)

TABLE 220 TURKEY Bioactive ingredient Market, By Source, 2019-2028 (USD Thousand)

TABLE 221 SWITZERLAND Bioactive ingredient Market, By Ingredient Type, 2019-2028 (USD Thousand)

TABLE 222 SWITZERLAND Bioactive ingredient Market, By Ingredient Type, 2019-2028 (Tons)

TABLE 223 SWITZERLAND Peptides in Bioactive ingredient Market, By Ingredient Type, 2019-2028 (USD Thousand)

TABLE 224 SWITZERLAND Prebiotic in Bioactive ingredient Market, By Ingredient Type, 2019-2028 (USD Thousand)

TABLE 225 SWITZERLAND Probiotic in Bioactive ingredient Market, By Ingredient Type, 2019-2028 (USD Thousand)

TABLE 226 SWITZERLAND Minerals in Bioactive ingredient Market, By Ingredient Type, 2019-2028 (USD Thousand)

TABLE 227 SWITZERLAND Vitamins in Bioactive ingredient Market, By Ingredient Type, 2019-2028 (USD Thousand)

TABLE 228 SWITZERLAND Amino Acid in Bioactive ingredient Market, By Ingredient Type, 2019-2028 (USD Thousand)

TABLE 229 SWITZERLAND Bioactive ingredient Market, By Applications, 2019-2028 (USD Thousand)

TABLE 230 SWITZERLAND Functional Food in Bioactive ingredient Market, By Applications, 2019-2028 (USD Thousand)

TABLE 231 SWITZERLAND Dairy in Bioactive ingredient Market, By Applications, 2019-2028 (USD Thousand)

TABLE 232 SWITZERLAND Dairy Alternatives in Bioactive ingredient Market, By Applications, 2019-2028 (USD Thousand)

TABLE 233 SWITZERLAND Beverages in Bioactive ingredient Market, By Applications, 2019-2028 (USD Thousand)

TABLE 234 SWITZERLAND Bars in Bioactive ingredient Market, By Applications, 2019-2028 (USD Thousand)

TABLE 235 SWITZERLAND Animal Nutrition in Bioactive ingredient Market, By Applications, 2019-2028 (USD Thousand)

TABLE 236 SWITZERLAND Personal Care in Bioactive ingredient Market, By Applications, 2019-2028 (USD Thousand)

TABLE 237 SWITZERLAND Bioactive ingredient Market, By Source, 2019-2028 (USD Thousand)

TABLE 238 DENMARK Bioactive ingredient Market, By Ingredient Type, 2019-2028 (USD Thousand)

TABLE 239 DENMARK Bioactive ingredient Market, By Ingredient Type, 2019-2028 (Tons)

TABLE 240 DENMARK Peptides in Bioactive ingredient Market, By Ingredient Type, 2019-2028 (USD Thousand)

TABLE 241 DENMARK Prebiotic in Bioactive ingredient Market, By Ingredient Type, 2019-2028 (USD Thousand)

TABLE 242 DENMARK Probiotic in Bioactive ingredient Market, By Ingredient Type, 2019-2028 (USD Thousand)

TABLE 243 DENMARK Minerals in Bioactive ingredient Market, By Ingredient Type, 2019-2028 (USD Thousand)

TABLE 244 DENMARK Vitamins in Bioactive ingredient Market, By Ingredient Type, 2019-2028 (USD Thousand)

TABLE 245 DENMARK Amino Acid in Bioactive ingredient Market, By Ingredient Type, 2019-2028 (USD Thousand)

TABLE 246 DENMARK Bioactive ingredient Market, By Applications, 2019-2028 (USD Thousand)

TABLE 247 DENMARK Functional Food in Bioactive ingredient Market, By Applications, 2019-2028 (USD Thousand)

TABLE 248 DENMARK Dairy in Bioactive ingredient Market, By Applications, 2019-2028 (USD Thousand)

TABLE 249 DENMARK Dairy Alternatives in Bioactive ingredient Market, By Applications, 2019-2028 (USD Thousand)

TABLE 250 DENMARK Beverages in Bioactive ingredient Market, By Applications, 2019-2028 (USD Thousand)

TABLE 251 DENMARK Bars in Bioactive ingredient Market, By Applications, 2019-2028 (USD Thousand)

TABLE 252 DENMARK Animal Nutrition in Bioactive ingredient Market, By Applications, 2019-2028 (USD Thousand)

TABLE 253 DENMARK Personal Care in Bioactive ingredient Market, By Applications, 2019-2028 (USD Thousand)

TABLE 254 DENMARK Bioactive ingredient Market, By Source, 2019-2028 (USD Thousand)

TABLE 255 SWEDEN Bioactive ingredient Market, By Ingredient Type, 2019-2028 (USD Thousand)

TABLE 256 SWEDEN Bioactive ingredient Market, By Ingredient Type, 2019-2028 (Tons)

TABLE 257 SWEDEN Peptides in Bioactive ingredient Market, By Ingredient Type, 2019-2028 (USD Thousand)

TABLE 258 SWEDEN Prebiotic in Bioactive ingredient Market, By Ingredient Type, 2019-2028 (USD Thousand)

TABLE 259 SWEDEN Probiotic in Bioactive ingredient Market, By Ingredient Type, 2019-2028 (USD Thousand)

TABLE 260 SWEDEN Minerals in Bioactive ingredient Market, By Ingredient Type, 2019-2028 (USD Thousand)

TABLE 261 SWEDEN Vitamins in Bioactive ingredient Market, By Ingredient Type, 2019-2028 (USD Thousand)

TABLE 262 SWEDEN Amino Acid in Bioactive ingredient Market, By Ingredient Type, 2019-2028 (USD Thousand)

TABLE 263 SWEDEN Bioactive ingredient Market, By Applications, 2019-2028 (USD Thousand)

TABLE 264 SWEDEN Functional Food in Bioactive ingredient Market, By Applications, 2019-2028 (USD Thousand)

TABLE 265 SWEDEN Dairy in Bioactive ingredient Market, By Applications, 2019-2028 (USD Thousand)

TABLE 266 SWEDEN Dairy Alternatives in Bioactive ingredient Market, By Applications, 2019-2028 (USD Thousand)

TABLE 267 SWEDEN Beverages in Bioactive ingredient Market, By Applications, 2019-2028 (USD Thousand)

TABLE 268 SWEDEN Bars in Bioactive ingredient Market, By Applications, 2019-2028 (USD Thousand)

TABLE 269 SWEDEN Animal Nutrition in Bioactive ingredient Market, By Applications, 2019-2028 (USD Thousand)

TABLE 270 SWEDEN Personal Care in Bioactive ingredient Market, By Applications, 2019-2028 (USD Thousand)

TABLE 271 SWEDEN Bioactive ingredient Market, By Source, 2019-2028 (USD Thousand)

TABLE 272 POLAND Bioactive ingredient Market, By Ingredient Type, 2019-2028 (USD Thousand)

TABLE 273 POLAND Bioactive ingredient Market, By Ingredient Type, 2019-2028 (Tons)

TABLE 274 POLAND Peptides in Bioactive ingredient Market, By Ingredient Type, 2019-2028 (USD Thousand)

TABLE 275 POLAND Prebiotic in Bioactive ingredient Market, By Ingredient Type, 2019-2028 (USD Thousand)

TABLE 276 POLAND Probiotic in Bioactive ingredient Market, By Ingredient Type, 2019-2028 (USD Thousand)

TABLE 277 POLAND Minerals in Bioactive ingredient Market, By Ingredient Type, 2019-2028 (USD Thousand)

TABLE 278 POLAND Vitamins in Bioactive ingredient Market, By Ingredient Type, 2019-2028 (USD Thousand)

TABLE 279 POLAND Amino Acid in Bioactive ingredient Market, By Ingredient Type, 2019-2028 (USD Thousand)

TABLE 280 POLAND Bioactive ingredient Market, By Applications, 2019-2028 (USD Thousand)

TABLE 281 POLAND Functional Food in Bioactive ingredient Market, By Applications, 2019-2028 (USD Thousand)

TABLE 282 POLAND Dairy in Bioactive ingredient Market, By Applications, 2019-2028 (USD Thousand)

TABLE 283 POLAND Dairy Alternatives in Bioactive ingredient Market, By Applications, 2019-2028 (USD Thousand)

TABLE 284 POLAND Beverages in Bioactive ingredient Market, By Applications, 2019-2028 (USD Thousand)

TABLE 285 POLAND Bars in Bioactive ingredient Market, By Applications, 2019-2028 (USD Thousand)

TABLE 286 POLAND Animal Nutrition in Bioactive ingredient Market, By Applications, 2019-2028 (USD Thousand)

TABLE 287 POLAND Personal Care in Bioactive ingredient Market, By Applications, 2019-2028 (USD Thousand)

TABLE 288 POLAND Bioactive ingredient Market, By Source, 2019-2028 (USD Thousand)

TABLE 289 REST OF EUROPE Bioactive ingredient Market, By Ingredient Type, 2019-2028 (USD Thousand)

TABLE 290 REST OF EUROPE Bioactive ingredient Market, By Ingredient Type, 2019-2028 (Tons)

Lista de figuras

FIGURE 1 EUROPE BIOACTIVE INGREDIENT MARKET: segmentation

FIGURE 2 EUROPE BIOACTIVE INGREDIENT MARKET: data triangulation

FIGURE 3 EUROPE BIOACTIVE INGREDIENT MARKET: DROC ANALYSIS

FIGURE 4 EUROPE BIOACTIVE INGREDIENT MARKET: Europe VS. regional MARKET analysis

FIGURE 5 EUROPE BIOACTIVE INGREDIENT MARKET: company research analysis

FIGURE 6 EUROPE BIOACTIVE INGREDIENT MARKET: THE Ingredient Type LIFE LINE CURVE

FIGURE 7 EUROPE BIOACTIVE INGREDIENT MARKET: MULTIVARIATE MODELLING

FIGURE 8 EUROPE BIOACTIVE INGREDIENT MARKET: INTERVIEW DEMOGRAPHICS

FIGURE 9 EUROPE BIOACTIVE INGREDIENT MARKET: DBMR MARKET POSITION GRID

FIGURE 10 EUROPE BIOACTIVE INGREDIENT MARKET: MARKET application COVERAGE GRID

FIGURE 11 EUROPE BIOACTIVE INGREDIENT MARKET: THE MARKET CHALLENGE MATRIX

FIGURE 12 EUROPE BIOACTIVE INGREDIENT MARKET: vendor share analysis

FIGURE 13 EUROPE BIOACTIVE INGREDIENT MARKET: SEGMENTATION

FIGURE 14 Rising demand of bioactive ingredients in functional foodIS DRIVING the EUROPE BIOACTIVE INGREDIENT MARKET in the forecast period of 2021 to 2028

FIGURE 15 peptide SEGMENT is expected to account for the largest share of the EUROPE BIOACTIVE INGREDIENT MARKET in 2021 & 2028

FIGURE 16 Figure 1 DRIVERS, RESTRAINTS, OPPORTUNITIES AND CHALLENGEs OF Europe Bioactive Ingredient MARKET

FIGURE 17 : DRUG USED FOR DIABETES (DOSAGE PER 1,000 INHABITANTS, PER DAY)

FIGURE 1 Europe bioactive ingredient MARKET: BY Ingredient Type, 2020

FIGURE 2 Europe bioactive ingredient MARKET: BY Applications, 2020

FIGURE 3 Europe bioactive ingredient MARKET: BY source, 2020

FIGURE 4 EUROPE bioactive ingredient market: SNAPSHOT (2020)

FIGURE 5 EUROPE BIOACTIVE INGREDIENT market: by COUNTRY (2020)

FIGURE 6 EUROPE BIOACTIVE INGREDIENT market: by COUNTRY (2021 & 2028)

FIGURE 7 EUROPE BIOACTIVE INGREDIENT market: by COUNTRY (2020 & 2028)

FIGURE 8 EUROPE BIOACTIVE INGREDIENT market: by Ingredient Type (2021-2028)

FIGURE 9 EUROPE BIOACTIVE INGREDIENT MARKET: company share 2020 (%)

Ver información detallada Right Arrow

Metodología de investigación

La recopilación de datos y el análisis del año base se realizan utilizando módulos de recopilación de datos con muestras de gran tamaño. La etapa incluye la obtención de información de mercado o datos relacionados a través de varias fuentes y estrategias. Incluye el examen y la planificación de todos los datos adquiridos del pasado con antelación. Asimismo, abarca el examen de las inconsistencias de información observadas en diferentes fuentes de información. Los datos de mercado se analizan y estiman utilizando modelos estadísticos y coherentes de mercado. Además, el análisis de la participación de mercado y el análisis de tendencias clave son los principales factores de éxito en el informe de mercado. Para obtener más información, solicite una llamada de un analista o envíe su consulta.

La metodología de investigación clave utilizada por el equipo de investigación de DBMR es la triangulación de datos, que implica la extracción de datos, el análisis del impacto de las variables de datos en el mercado y la validación primaria (experto en la industria). Los modelos de datos incluyen cuadrícula de posicionamiento de proveedores, análisis de línea de tiempo de mercado, descripción general y guía del mercado, cuadrícula de posicionamiento de la empresa, análisis de patentes, análisis de precios, análisis de participación de mercado de la empresa, estándares de medición, análisis global versus regional y de participación de proveedores. Para obtener más información sobre la metodología de investigación, envíe una consulta para hablar con nuestros expertos de la industria.

Personalización disponible

Data Bridge Market Research es líder en investigación formativa avanzada. Nos enorgullecemos de brindar servicios a nuestros clientes existentes y nuevos con datos y análisis que coinciden y se adaptan a sus objetivos. El informe se puede personalizar para incluir análisis de tendencias de precios de marcas objetivo, comprensión del mercado de países adicionales (solicite la lista de países), datos de resultados de ensayos clínicos, revisión de literatura, análisis de mercado renovado y base de productos. El análisis de mercado de competidores objetivo se puede analizar desde análisis basados ​​en tecnología hasta estrategias de cartera de mercado. Podemos agregar tantos competidores sobre los que necesite datos en el formato y estilo de datos que esté buscando. Nuestro equipo de analistas también puede proporcionarle datos en archivos de Excel sin procesar, tablas dinámicas (libro de datos) o puede ayudarlo a crear presentaciones a partir de los conjuntos de datos disponibles en el informe.

Preguntas frecuentes

Europe Bioactive Ingredient Market to grow at a CAGR of 7.1% by forecast 2028.
Europe Bioactive Ingredient Market value to reach USD 12,713,978.02 thousand by 2028.
The major market players engaged in the global bioactive ingredient market are DSM, BASF SE , Kerry, DuPont, ADM, Global Bio-chem Technology Group Company Limited, Evonik Industries AG, Cargill, Incorporated, Arla Food Ingredients Group P/S (a subsidiary of Arla Foods amba), FMC Corporation, Sunrise Nutrachem Group, Adisseo (a subsidiary of Bluestar Adisseo Co., Ltd.), Chr.Hansen Holding A/S, Sabinsa, Ajinomoto Co., Inc, NOVUS INTERNATIONAL (a subsidiary of Mitsui & Co. (U.S.A.), Inc.), Ingredion, Roquette Frères, Probi and Advanced Animal Nutrition Pty Ltd.
The countries covered in the Europe Bioactive Ingredient market report are Germany, U.K., France, Italy, Spain, Netherlands, Belgium, Russia, Turkey, Switzerland, Poland, Denmark, and the Rest of Europe.