
Europe Automotive Logistics Market
Tamaño del mercado en miles de millones de dólares
Tasa de crecimiento anual compuesta (CAGR) :
% 
 USD
65.50 Billion
USD
105.60 Billion
2024
2032
USD
65.50 Billion
USD
105.60 Billion
2024
2032
| 2025 –2032 | |
| USD 65.50 Billion | |
| USD 105.60 Billion | |
| % | |
|
El mercado europeo de logística automotriz está segmentado por tipo de logística (logística de entrada, logística de salida, logística de posventa, logística inversa), tipo de servicio (almacenamiento, manipulación de materiales, transporte, servicios de gestión), etapa (etapa de materia prima, producto terminado, entrega del producto final, módulos de subconjunto), distribución (nacional, internacional), modo de transporte (carretera, ferrocarril, marítimo, aéreo) y tipo de vehículo (turismos, vehículos comerciales, vehículos eléctricos). El mercado refleja la creciente demanda de sistemas logísticos sostenibles, eficientes y conectados digitalmente para respaldar la sólida base de fabricación de vehículos de Europa, la creciente producción de vehículos eléctricos y las complejas operaciones comerciales transfronterizas.
Tamaño del mercado logístico automotriz en Europa
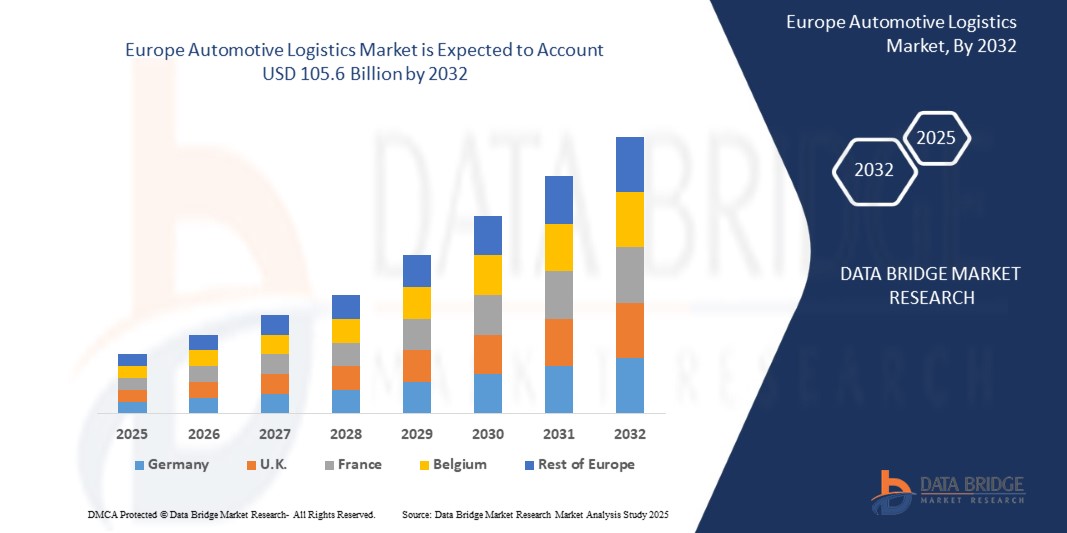
- El mercado de logística automotriz de Europa se valoró en USD 65,5 mil millones en 2025 y se proyecta que alcance los USD 105,6 mil millones para 2032, creciendo a una CAGR del 7% durante el período de pronóstico.
- El crecimiento se ve impulsado por el aumento de la producción de vehículos eléctricos (VE), el aumento de los flujos comerciales regionales, regulaciones de emisiones más estrictas y la integración de soluciones digitales para la cadena de suministro. Los fabricantes de equipos originales (OEM) y los proveedores de primer nivel están optimizando sus estrategias logísticas para satisfacer las expectativas de los consumidores, los objetivos de sostenibilidad y las demandas de fabricación justo a tiempo (JIT).
Análisis del mercado logístico de automoción en Europa
- La logística automotriz incluye la planificación, ejecución y control del transporte y almacenamiento de piezas, componentes y vehículos terminados. Es fundamental para fabricantes de equipos originales (OEM), proveedores y concesionarios mantener entregas puntuales, eficiencia de inventario y control de costos durante todo el ciclo de producción y entrega.
- La creciente adopción de vehículos eléctricos y conectados ha desplazado las prioridades de la cadena de suministro hacia componentes de alto valor como baterías y semiconductores, que requieren un manejo especializado y sistemas de transporte seguros.
- La digitalización, el seguimiento de flotas basado en IoT, la visibilidad del inventario en tiempo real y los sistemas de gestión del transporte basados en la nube están revolucionando la forma en que se gestiona la logística automotriz en Europa.
- Las regulaciones ambientales están impulsando la adopción de estrategias de logística verde, incluidas flotas de vehículos eléctricos, expansión del transporte ferroviario de mercancías y almacenamiento neutral en carbono, especialmente en Alemania, Francia y los países nórdicos.
- El Brexit ha transformado la logística transfronteriza entre el Reino Unido y Europa continental, requiriendo una mejor coordinación aduanera y estrategias de almacenamiento adaptables.
Alcance del informe y segmentación del mercado de logística automotriz en Europa
|
Atributos |
Perspectivas del mercado de logística automotriz |
|
Segmentos cubiertos |
|
|
Countries Covered |
Europe
|
|
Key Market Players |
|
|
Market Opportunities |
|
|
Value Added Data Infosets |
In addition to the insights on market scenarios such as market value, growth rate, segmentation, geographical coverage, and major players, the market reports curated by the Data Bridge Market Research also include import export analysis, production capacity overview, production consumption analysis, price trend analysis, climate change scenario, supply chain analysis, value chain analysis, raw material/consumables overview, vendor selection criteria, PESTLE Analysis, Porter Analysis, and regulatory framework. |
Automotive Logistics Market Trends
“Digital Platforms, Green Initiatives, and Supply Chain Resilience Transforming Automotive Logistics”
- A key and rapidly evolving trend in the Europe Automotive Logistics Market is the adoption of cloud-based logistics platforms that provide real-time shipment visibility, centralized transport orchestration, and AI-driven predictive analytics. These technologies enhance route optimization, reduce lead times, and enable more efficient coordination between OEMs, suppliers, and distribution centers across Europe.
- In response to EU climate regulations and carbon reduction targets, automakers and logistics providers are prioritizing green logistics practices, including the use of electric and hydrogen-powered trucks, expanded rail freight corridors, biofuel usage, and carbon-neutral warehouses. These initiatives help meet ESG goals and reduce emissions per vehicle shipped.
- ERP system integration with Transportation Management Systems (TMS) and Warehouse Management Systems (WMS) is becoming widespread, improving real-time coordination of production logistics, inventory flows, and outbound vehicle movements. This alignment supports just-in-time (JIT) and just-in-sequence (JIS) operations across Europe’s complex manufacturing ecosystem.
- IoT and telematics solutions are being deployed to monitor fleet performance, enable predictive maintenance, and provide end-to-end supply chain transparency. These tools are especially critical for the secure transport of sensitive automotive components like EV batteries and electronics.
- Existe una tendencia creciente hacia estrategias de transporte multimodal, ya que las empresas buscan combinar la logística por carretera, ferroviaria y marítima para mejorar la eficiencia, reducir los costos y cumplir con los requisitos de sostenibilidad. La mejora de la conectividad ferroviaria entre Europa Oriental y Occidental y la ampliación de la infraestructura portuaria facilitan el movimiento transfronterizo de vehículos y piezas.
Dinámica del mercado logístico automotriz en Europa
Conductor
El impulso regulatorio y las tendencias de electrificación impulsan la transformación en la logística automotriz.
La rápida electrificación de la industria automotriz en toda Europa, sumada a las estrictas políticas climáticas, obliga a los fabricantes de equipos originales (OEM) y a los proveedores de logística a modernizar sus operaciones para lograr una mayor sostenibilidad y cumplimiento normativo. Los gobiernos nacionales y las directivas de la UE están impulsando la transición hacia soluciones de transporte de bajas emisiones, transformando la estructura de las cadenas de suministro de la industria automotriz.
Iniciativas regulatorias como el Pacto Verde Europeo, la iniciativa "Fit for 55" y las normas de emisiones Euro 7 impulsan la adopción de flotas eléctricas y de hidrógeno, la integración del transporte ferroviario de mercancías y las inversiones en infraestructura logística sostenible. Estos esfuerzos influyen directamente en la modernización de las flotas y las estrategias logísticas transfronterizas.
Los fabricantes de automóviles y los proveedores de primer nivel están alineando cada vez más sus estrategias logísticas con las regulaciones de Responsabilidad Extendida del Productor (REP) y los estándares de seguridad para baterías de vehículos eléctricos. Esto incluye protocolos logísticos para el almacenamiento a temperatura controlada, la manipulación segura de baterías y la logística inversa para el reciclaje y la eliminación de materiales peligrosos.
Para gestionar la complejidad de la cadena de suministro y cumplir con los estándares de auditoría ambiental, las empresas invierten en plataformas de visibilidad en tiempo real integradas con sistemas ERP, TMS y WMS. Estas herramientas digitales facilitan una logística de precisión, mejoran la precisión de las entregas y optimizan la capacidad de respuesta a los cambios regulatorios en múltiples mercados europeos.
Los gobiernos europeos también promueven la innovación logística mediante corredores de movilidad inteligentes, sistemas automatizados de despacho de aduanas y mejoras en la infraestructura intermodal. Estas inversiones favorecen un movimiento transfronterizo más eficiente de vehículos y componentes, reducen los retrasos y mejoran la resiliencia general de la red logística automotriz.
Restricción/Desafío
La incertidumbre geopolítica y la volatilidad de la política comercial perturban la planificación logística.
- Uno de los principales desafíos del mercado europeo de logística automotriz es la continua inestabilidad geopolítica, que incluye el conflicto entre Rusia y Ucrania, la evolución de las políticas fronterizas de la UE y los reajustes comerciales posteriores al Brexit. Estas interrupciones han provocado el desvío de corredores logísticos, retrasos en los envíos y un aumento de los costes de seguridad y seguros para el transporte transfronterizo de vehículos y componentes.
- Por ejemplo, el Brexit ha generado procedimientos aduaneros más complejos, barreras no arancelarias y plazos de entrega más largos entre el Reino Unido y los estados miembros de la UE. Los proveedores de logística automotriz enfrentan mayores costos operativos debido a las mayores exigencias de cumplimiento, los retrasos en la tramitación de la documentación y los desafíos de coordinación en tiempo real.
- Los cambios impredecibles en las políticas comerciales internacionales y de la UE, como las sanciones, los ajustes arancelarios y las presiones de localización de la cadena de suministro, obligan a los OEM y a los proveedores de nivel 1 a reevaluar constantemente las estrategias de abastecimiento y distribución, lo que aumenta la presión sobre la planificación logística y la optimización del inventario.
- Estas incertidumbres también dificultan las decisiones a largo plazo sobre infraestructura e inversión. Las empresas de logística se muestran cautelosas a la hora de ampliar sus redes de almacenamiento, terminales ferroviarias u operaciones portuarias en regiones con riesgo político, inconsistencias regulatorias o inestabilidad fronteriza, lo que provoca retrasos en la ampliación de la capacidad y rutas ineficientes.
Alcance del mercado logístico de automoción en Europa
El mercado está segmentado según el tipo de servicio, modo de transporte, tipo de logística y tipo de vehículo.
• Por tipo de servicio
El mercado de logística automotriz se segmenta en transporte, almacenamiento, gestión de inventario y distribución. En 2025, el segmento de transporte tendrá la mayor cuota de mercado debido al alto volumen de movimiento de vehículos y componentes en las cadenas de suministro regionales. El almacenamiento y la gestión de inventario también están cobrando importancia, ya que los fabricantes de equipos originales (OEM) priorizan las entregas justo a tiempo (JIT) y una logística eficiente de repuestos para reducir el tiempo de inactividad y los costos.
• Modo de transporte
Los modos de transporte incluyen carretera, ferrocarril, transporte marítimo y aéreo. El transporte por carretera domina el mercado, especialmente para la distribución de vehículos terminados y piezas a corta y media distancia. Sin embargo, la logística ferroviaria y marítima está creciendo rápidamente gracias a su rentabilidad y menor impacto ambiental, especialmente para el transporte transfronterizo y de larga distancia. La logística aérea se utiliza principalmente para entregas urgentes y componentes de alto valor.
• Por tipo de logística
El mercado se clasifica en logística de entrada, de salida, inversa y posventa. La logística de entrada, que implica el transporte de piezas a las plantas de fabricación, lidera el segmento, impulsada por la complejidad de las líneas de montaje de automóviles. La logística de salida, que incluye la entrega de vehículos terminados a los concesionarios, también es significativa. La posventa y la logística inversa están en auge a medida que los fabricantes de automóviles se centran en los servicios posventa y el reciclaje sostenible de piezas.
• Por tipo de vehículo
Los tipos de vehículos incluyen turismos, vehículos comerciales y vehículos eléctricos (VE). Los turismos representan la mayor cuota de mercado debido a su volumen de producción y escala de distribución. Sin embargo, los vehículos eléctricos representan el segmento de mayor crecimiento, a medida que los proveedores de logística se adaptan a los nuevos requisitos de transporte de baterías, almacenamiento sensible a la temperatura y cumplimiento normativo de materiales peligrosos.
• Por distribución
El mercado europeo de logística automotriz se segmenta en logística nacional e internacional. La logística nacional ocupa una parte importante, respaldada por densas redes de fabricación y una sólida distribución de vehículos dentro del país, especialmente en centros de distribución automotriz como Alemania, Francia e Italia. La logística internacional también está creciendo rápidamente, impulsada por la fuerte exportación de vehículos terminados y componentes a mercados de Asia, Norteamérica y África. Los acuerdos comerciales integrados de la UE y la simplificación de los procesos aduaneros en los países Schengen siguen impulsando la eficiencia del movimiento transfronterizo de productos automotrices.
• Por etapa
Las etapas logísticas del mercado europeo de logística automotriz se clasifican en: etapa de materias primas, módulos de subensamblaje, producto terminado y entrega del producto final. La etapa de materias primas implica el transporte de insumos esenciales, como aluminio, componentes electrónicos y polímeros, a los proveedores de componentes y plantas de fabricación europeas. Los módulos de subensamblaje abarcan el transporte de sistemas preensamblados, como sistemas de propulsión, unidades de infoentretenimiento y baterías, a las líneas de ensamblaje final de los fabricantes de equipos originales (OEM). La etapa de producto terminado incluye la logística de salida desde las plantas de ensamblaje hasta los centros de distribución nacionales e internacionales o terminales portuarias. Por último, la entrega del producto final implica el transporte de última milla de los vehículos terminados a los concesionarios o compradores de flotas, lo que requiere alta precisión, especialmente para entregas justo a tiempo en zonas urbanas y con gran presencia minorista.
Mercado europeo de logística automotriz: análisis regional
- Se prevé que el mercado europeo de logística automotriz crezca de forma sostenida hasta 2032, impulsado por la creciente demanda de vehículos eléctricos (VE), el comercio transfronterizo dentro de la UE y la búsqueda de soluciones logísticas sostenibles y multimodales. Las estrictas normativas sobre emisiones y cumplimiento de la cadena de suministro, como REACH, EU MDR y Euro 7, están animando a los fabricantes de automóviles y proveedores de logística a adoptar operaciones logísticas integradas y digitalizadas en toda la región.
- La región también se beneficia de una infraestructura avanzada, una fuerte inversión en transporte ferroviario y marítimo, y la adopción generalizada de modelos de cadena de suministro justo a tiempo (JIT) y justo en secuencia (JIS). A medida que los fabricantes de equipos originales (OEM) localizan la producción y regionalizan sus redes de proveedores, el mercado europeo de logística automotriz continúa diversificándose y evolucionando.
Análisis del mercado logístico automotriz en Alemania
Alemania sigue siendo el mercado más grande y maduro de Europa gracias a su competitiva base de fabricación de automóviles a nivel mundial, su infraestructura ferroviaria y vial altamente desarrollada y su enfoque en la Industria 4.0. Los proveedores de logística del país están adoptando rápidamente soluciones de almacenamiento inteligente, rastreo de flotas en tiempo real y transporte multimodal para facilitar el movimiento eficiente de vehículos, piezas y baterías. Alemania también es líder en logística de vehículos eléctricos, gracias a programas de movilidad ecológica respaldados por el gobierno y centros de innovación automotriz.
Análisis del mercado logístico automotriz en Francia
El sector logístico automotriz francés está en expansión gracias a las inversiones en transporte de bajas emisiones, cadenas de suministro digitalizadas y distribución de componentes para vehículos eléctricos. El apoyo del gobierno francés a las zonas de transporte limpio, sumado al crecimiento de las exportaciones automotrices y al auge del comercio electrónico, impulsa la demanda de soluciones de almacenamiento, gestión de inventario y transporte multimodal. Las empresas de logística están integrando plataformas TMS y WMS en la nube para mejorar la trazabilidad y reducir los plazos de entrega.
Perspectivas del mercado logístico automotriz del Reino Unido
A pesar de los desafíos tras el Brexit, el Reino Unido sigue siendo un actor clave en el mercado logístico automotriz europeo. La fuerte demanda interna, la transición hacia la deslocalización y la expansión de la producción de vehículos eléctricos están redefiniendo las estrategias logísticas. Los proveedores de logística están invirtiendo en plataformas digitales que cumplen con las normativas aduaneras, almacenes automatizados y rutas portuarias alternativas para gestionar la complejidad transfronteriza. El Reino Unido también apoya activamente la infraestructura logística de vehículos eléctricos con políticas que favorecen los corredores de transporte de bajas emisiones.
Análisis del mercado logístico automotriz en Italia
Italia está consolidando su papel como centro logístico en el sur de Europa con una inversión continua en infraestructura portuaria e interconexión ferroviaria. Con una importante base de fabricación de autopartes y una creciente capacidad de ensamblaje de vehículos eléctricos, los proveedores de logística italianos priorizan la velocidad, la sostenibilidad y la eficiencia multimodal. El crecimiento de los servicios de posventa de automoción también está impulsando la demanda de logística inversa y centros de distribución descentralizados.
Análisis del mercado logístico de automoción en España
El sector logístico de automoción español está cobrando impulso, gracias a su ubicación estratégica para las exportaciones, especialmente a Latinoamérica y el norte de África. Los incentivos gubernamentales para apoyar la producción de vehículos eléctricos y los corredores logísticos ecológicos están ayudando a las empresas de logística a modernizar sus flotas y operaciones de almacenamiento. Las sólidas exportaciones de automóviles y el aumento de las inversiones en plataformas logísticas inteligentes están acelerando aún más el crecimiento del mercado.
Perspectiva del mercado logístico automotriz de Polonia y Europa del Este
Países como Polonia, Hungría y Eslovaquia se están consolidando como potencias de la logística automotriz, impulsados por la deslocalización de la fabricación, los costes laborales competitivos y las mejoras de infraestructura financiadas por la UE. Estos países sirven como puntos de tránsito clave tanto para Europa Oriental como Occidental, con una creciente inversión en terminales ferroviarias, centros de cross-docking automatizados y capacidades logísticas de baterías para impulsar la creciente producción y exportación de vehículos eléctricos.
Cuota de mercado de la logística automotriz en Europa
El mercado logístico automotriz europeo está liderado por una combinación de proveedores de servicios logísticos globales y regionales:
- Cadena de suministro de DHL
- DB Schenker
- CEVA Logística
- Kuehne + Nagel
- DSV Panalpina
- Logística BLG
- Gefco
- Sistema Ryder, Inc.
- Logística XPO
- Hellmann Worldwide Logistics
Últimos avances en el mercado logístico de automoción en Europa
- En marzo de 2025, DB Schenker lanzó su primer corredor de camiones eléctricos para el transporte de piezas de automoción entre Alemania y Francia, en consonancia con los objetivos del Pacto Verde Europeo. La iniciativa busca reducir las emisiones de carbono y promover soluciones de transporte transfronterizo sostenibles para proveedores de primer nivel y fabricantes de equipos originales (OEM).
- En enero de 2025, CEVA Logistics inauguró un almacén de automoción de última generación en España, con manejo de materiales habilitado con robótica, seguimiento de inventario digital y zonas dedicadas para el almacenamiento de componentes de vehículos eléctricos (VE), diseñado para respaldar las crecientes necesidades logísticas de VE en el sur de Europa.
- En octubre de 2024, DHL se asoció con BMW Group para implementar un sistema de gestión logística basado en gemelos digitales, que permite el monitoreo y la simulación en tiempo real de las operaciones de la cadena de suministro en las plantas de fabricación europeas de BMW para aumentar la transparencia, la resiliencia y la precisión de la planificación.
- En agosto de 2024, Kuehne + Nagel amplió sus servicios de transporte ferroviario de mercancías, conectando Europa del Este (Polonia, Hungría) con centros automotrices occidentales en Alemania y Francia. Esta iniciativa impulsa una logística transfronteriza rentable y de bajas emisiones para componentes y subconjuntos, acelerando la adopción del transporte multimodal en toda la UE.
SKU-
Obtenga acceso en línea al informe sobre la primera nube de inteligencia de mercado del mundo

- Panel de análisis de datos interactivo
- Panel de análisis de empresas para oportunidades con alto potencial de crecimiento
- Acceso de analista de investigación para personalización y consultas
- Análisis de la competencia con panel interactivo
- Últimas noticias, actualizaciones y análisis de tendencias
- Aproveche el poder del análisis de referencia para un seguimiento integral de la competencia
Metodología de investigación
La recopilación de datos y el análisis del año base se realizan utilizando módulos de recopilación de datos con muestras de gran tamaño. La etapa incluye la obtención de información de mercado o datos relacionados a través de varias fuentes y estrategias. Incluye el examen y la planificación de todos los datos adquiridos del pasado con antelación. Asimismo, abarca el examen de las inconsistencias de información observadas en diferentes fuentes de información. Los datos de mercado se analizan y estiman utilizando modelos estadísticos y coherentes de mercado. Además, el análisis de la participación de mercado y el análisis de tendencias clave son los principales factores de éxito en el informe de mercado. Para obtener más información, solicite una llamada de un analista o envíe su consulta.
La metodología de investigación clave utilizada por el equipo de investigación de DBMR es la triangulación de datos, que implica la extracción de datos, el análisis del impacto de las variables de datos en el mercado y la validación primaria (experto en la industria). Los modelos de datos incluyen cuadrícula de posicionamiento de proveedores, análisis de línea de tiempo de mercado, descripción general y guía del mercado, cuadrícula de posicionamiento de la empresa, análisis de patentes, análisis de precios, análisis de participación de mercado de la empresa, estándares de medición, análisis global versus regional y de participación de proveedores. Para obtener más información sobre la metodología de investigación, envíe una consulta para hablar con nuestros expertos de la industria.
Personalización disponible
Data Bridge Market Research es líder en investigación formativa avanzada. Nos enorgullecemos de brindar servicios a nuestros clientes existentes y nuevos con datos y análisis que coinciden y se adaptan a sus objetivos. El informe se puede personalizar para incluir análisis de tendencias de precios de marcas objetivo, comprensión del mercado de países adicionales (solicite la lista de países), datos de resultados de ensayos clínicos, revisión de literatura, análisis de mercado renovado y base de productos. El análisis de mercado de competidores objetivo se puede analizar desde análisis basados en tecnología hasta estrategias de cartera de mercado. Podemos agregar tantos competidores sobre los que necesite datos en el formato y estilo de datos que esté buscando. Nuestro equipo de analistas también puede proporcionarle datos en archivos de Excel sin procesar, tablas dinámicas (libro de datos) o puede ayudarlo a crear presentaciones a partir de los conjuntos de datos disponibles en el informe.

