

Mercado europeo de deposición de capas atómicas, por tipo de producto (ALD de metal, ALD de óxido de aluminio, ALD mejorado con plasma, ALD catalítico, otros), aplicación (semiconductores, dispositivos solares , electrónica , equipos médicos, instalaciones de investigación y desarrollo, pilas de combustible , dispositivos ópticos, materiales termoeléctricos, cabezales magnéticos, sensores, capas de barrera, capas de imprimación, aplicaciones que no son de circuitos integrados, otros), tendencias de la industria y pronóstico hasta 2029.
Análisis y perspectivas del mercado de deposición de capas atómicas en Europa
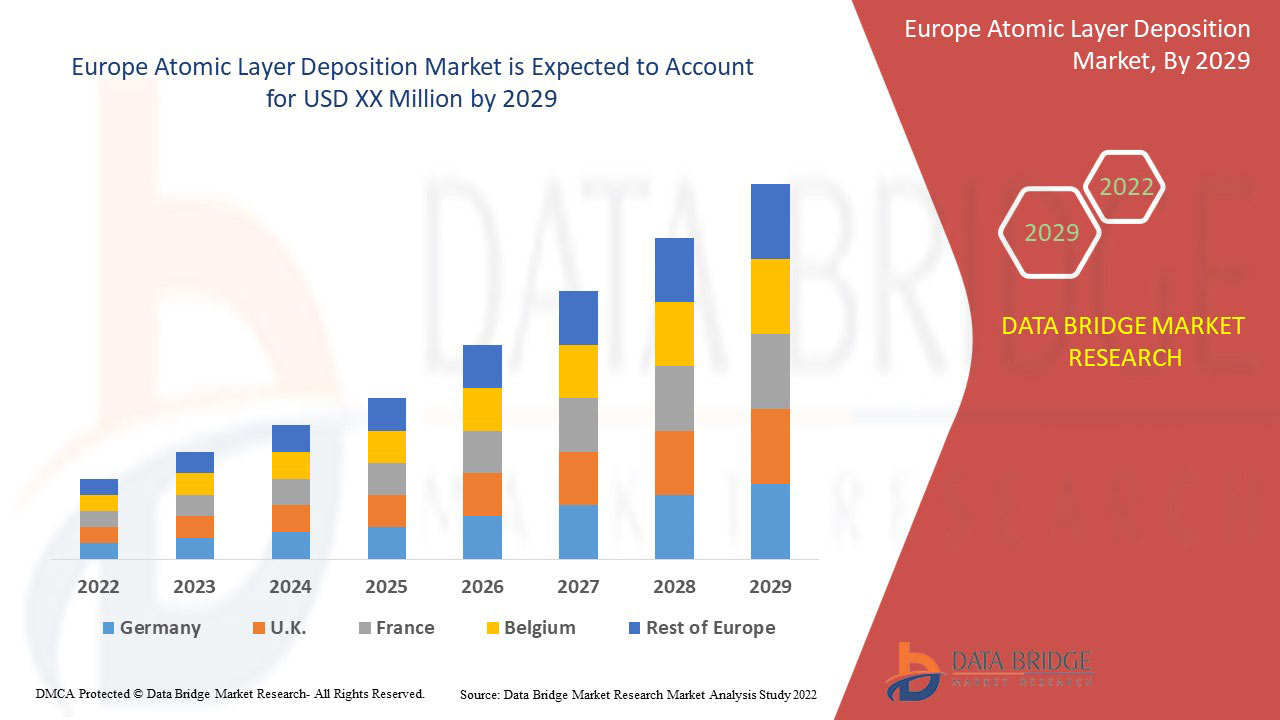
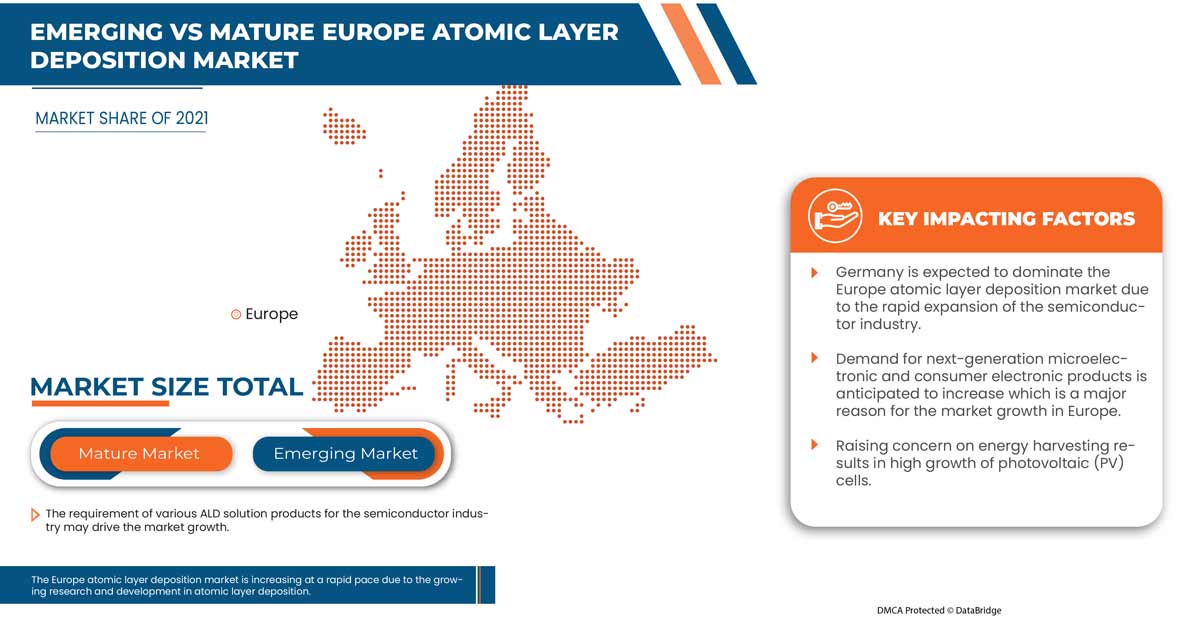
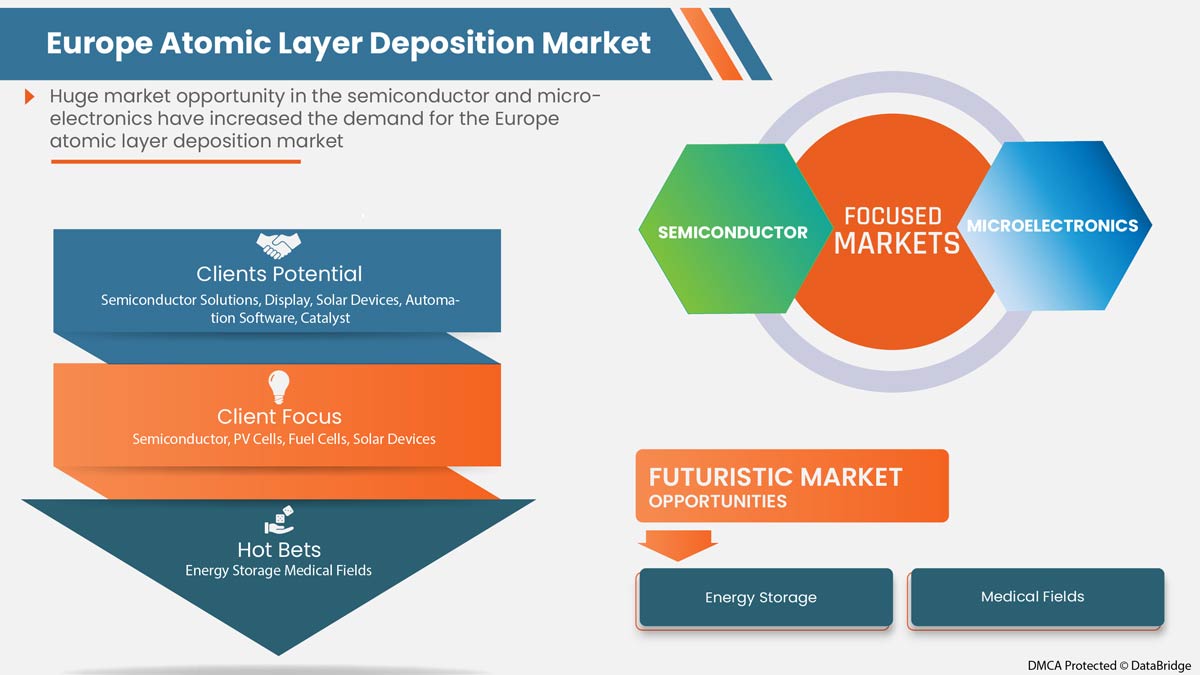
Se espera que el mercado europeo de deposición de capas atómicas se impulse debido a un aumento en la demanda de las industrias de semiconductores. Como los semiconductores son el principal componente o aplicación de la deposición de capas atómicas, el aumento en la demanda de semiconductores ayudará a aumentar la demanda de deposición de capas atómicas. Algunos otros factores que se espera que impulsen el crecimiento del mercado son las crecientes preocupaciones sobre los resultados de la recolección de energía en el alto crecimiento de las células fotovoltaicas (PV).
El factor principal que se prevé que limite el mercado es el alto costo de inversión inicial en la producción de ALD, lo que ha afectado el crecimiento del mercado.
Data Bridge Market Research analiza que el mercado de deposición de capas atómicas de Europa crecerá a una CAGR del 13,7% durante el período de pronóstico de 2022 a 2029.
|
Métrica del informe |
Detalles |
|
Período de pronóstico |
2022 a 2029 |
|
Año base |
2021 |
|
Años históricos |
2020 (Personalizable para 2019 - 2015) |
|
Unidades cuantitativas |
Ingresos en millones de USD, precios en USD |
|
Segmentos cubiertos |
Por tipo de producto (ALD de metal, ALD de óxido de aluminio, ALD mejorado con plasma, ALD catalítico, otros), aplicación (semiconductores, dispositivos solares, electrónica, equipos médicos, instalaciones de investigación y desarrollo, celdas de combustible, dispositivos ópticos, materiales termoeléctricos, cabezales magnéticos, sensores, capas de barrera, capas de imprimación, aplicaciones que no sean de circuitos integrados, otros) |
|
Países cubiertos |
Alemania, Reino Unido, Francia, Italia, España, Turquía, Rusia, Bélgica, Países Bajos, Suiza y resto de Europa. |
|
Actores del mercado cubiertos |
ADEKA CORPORATION, AIXTRON, Applied Materials Inc., ASM International, LAM RESEARCH CORPORATION, Tokyo Electron Limited, Kurt J. Lesker Company, Beneq, Veeco Instruments Inc., ANRIC TECH., Encapsulix, SENTECH Instruments GmbH, Oxford Instruments, Forge Nano Inc., Merck KGaA, HZO, Inc., Picosun Oy., entre otros. |
Definición de mercado
La deposición de capas atómicas (ALD) se refiere al proceso de deposición de materiales precursores sobre sustratos para mejorar o modificar propiedades como la resistencia química, la fuerza y la conductividad. El proceso se considera una subdivisión de la deposición química en fase de vapor (CVD) en la deposición de capas atómicas. Por lo general, se utilizan dos sustancias químicas para la reacción, generalmente denominadas precursores.
Dinámica del mercado de deposición de capas atómicas en Europa
En esta sección se aborda la comprensión de los factores impulsores, las oportunidades, las limitaciones y los desafíos del mercado. Todo esto se analiza en detalle a continuación:
Conductores:
- ALTA DEMANDA DE MICROELECTRÓNICA Y ELECTRÓNICA DE CONSUMO
La microelectrónica es un proceso de fabricación de componentes electrónicos a nivel microscópico. El mercado de la microelectrónica está creciendo rápidamente debido a la demanda de equipos económicos y livianos. Los componentes microelectrónicos incluyen transistores, capacitores, diodos, resistencias, inductores y otros. Todos estos componentes electrónicos se utilizan para fabricar teléfonos móviles, computadoras portátiles, juguetes electrónicos y otros.
- LA CRECIENTE PREOCUPACIÓN POR LA RECOLECCIÓN DE ENERGÍA RESULTA EN UN ALTO CRECIMIENTO DE CÉLULAS FOTOVOLTAICAS (PV)
La energía fotovoltaica (PV) es una tecnología que se utiliza para convertir la energía solar en energía eléctrica, es decir, electricidad. La demanda de células fotovoltaicas ha aumentado debido a su precio relativamente bajo y a su amplia gama de aplicaciones, como semáforos solares, bombas de energía solar, lámparas solares, calculadoras de energía solar y otras.
Restricción
- ALTOS COSTOS DE INVERSIÓN INICIAL
La deposición de capas atómicas (ALD) es la deposición de materiales precursores sobre sustratos para mejorar o modificar propiedades como la conductividad, la resistencia química y la fuerza. Para proporcionar servicios de ALD, el proveedor debe comprar equipos para el proceso de deposición de capas atómicas, como el sistema de deposición de capas atómicas Cambridge NanoTech Fiji F200, el sistema de ALD de carga abierta: OpAL, la serie ALD 200L de Kurt J. Lesker Company, el sistema de deposición de capas atómicas Cambridge NanoTech Savannah Series, el sistema de ALD de plasma y térmico: FlexAL, el sistema de deposición de haces de iones: IonFab IBD y el sistema de deposición de capas atómicas Cambridge NanoTech Savannah Series.
El precio de cada equipo ronda los 10.000 dólares estadounidenses, y el proveedor debe comprar todo el equipo para proporcionar todo tipo de servicios de deposición de capas atómicas. El coste del equipo sería muy elevado para proporcionar todo tipo de servicios de deposición de capas atómicas. Por ello, muchos compradores evitarán comprarlo debido al alto coste en comparación con los muebles normales.
Oportunidad
- TENDENCIA DE MINIATURIZACIÓN
La miniaturización es el proceso de fabricación de los dispositivos mecánicos, electrónicos y ópticos más pequeños. En otras palabras, es un proceso de hacer que los dispositivos electrónicos sean más pequeños. La miniaturización está de moda porque todo el mundo quiere dispositivos más pequeños, compactos y portátiles. Ahora la nanotecnología tiene el potencial de transformar el haz molecular en nanodispositivos (funcionales). Este es un gran paso hacia la miniaturización.
Desafío
- ALTERNATIVAS DE DEPÓSITO DE CAPA ATÓMICA
El proceso de deposición química en fase de vapor se utiliza ampliamente para producir películas delgadas de alta calidad y alto rendimiento. El proceso de deposición química en fase de vapor se utiliza comúnmente en la industria de semiconductores. Por otro lado, la deposición física en fase de vapor (PVD) es un método utilizado para producir películas delgadas y recubrimientos con alta temperatura, alta resistencia, excelente resistencia a la abrasión y otros. La deposición química en fase de vapor y la deposición física en fase de vapor se pueden utilizar como alternativas a la deposición de capas atómicas debido a las siguientes ventajas sobre la deposición de capas atómicas.
- La deposición química en fase de vapor tiene una tasa de deposición más alta que la deposición en capa atómica.
- En la deposición química de vapor, el material depositado es difícil de evaporar.
- El proceso de deposición física de vapor puede funcionar a bajas temperaturas en comparación con la deposición de capas atómicas.
- La deposición física de vapor puede controlar la composición química
Acontecimientos recientes
- En 2020, AIXTRON fue líder en el mercado de equipos MOCVD. AIXTRON aporta el 58% de la cuota de mercado de Europa en equipos MOCVD. AMEC (China), con el 16%, y Veeco (EE. UU.), con el 26%, aportan la cuota de mercado restante. La cuota de mercado de Europa es de unos 438 millones de dólares en equipos MOCVD en el año 2020.
- En diciembre de 2021, Tokyo Electron Limited desarrolló su producto para un sistema de grabado de plasma llamado Tactras-UDEMAE. Este nuevo desarrollo de producto ayudará a la empresa a satisfacer la alta demanda de dispositivos discretos y de potencia. La tecnología de grabado es importante en la fabricación de estos productos, y Tactras-UDEMAE aumenta el rendimiento del sistema de grabado para aumentar la productividad.
Alcance del mercado de deposición de capas atómicas en Europa
El mercado europeo de deposición de capas atómicas está segmentado en función del tipo de producto y la aplicación. El crecimiento entre estos segmentos le ayudará a analizar los principales segmentos de crecimiento en las industrias y brindará a los usuarios una valiosa descripción general del mercado y conocimientos del mercado para ayudarlos a tomar decisiones estratégicas para identificar las principales aplicaciones del mercado.
Tipo de producto
- Metal ALD
- Óxido de aluminio ALD
- ALD mejorada con plasma
- ALD catalítico
- Otros
Según el tipo de producto, el mercado europeo de deposición de capas atómicas se clasifica en ALD de metal, ALD de óxido de aluminio, ALD mejorado con plasma, ALD catalítico y otros.
Solicitud
- Semiconductores
- Electrónica
- Dispositivos solares
- Equipo médico
- Dispositivos ópticos
- Materiales termoeléctricos
- Pilas de combustible
- Instalaciones de investigación y desarrollo
- Cabezales magnéticos
- Sensores
- Capas de barrera
- Capas de imprimación
- Solicitud sin IC
- Otros
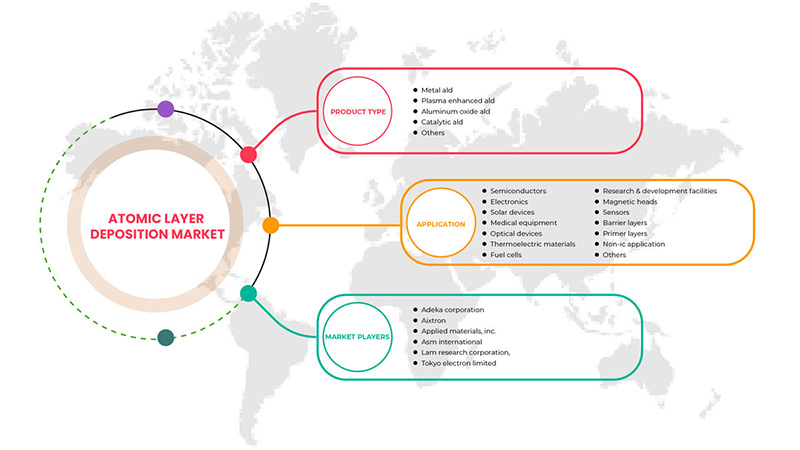
Sobre la base de la aplicación, el mercado europeo de deposición de capas atómicas se clasifica en semiconductores, dispositivos solares, electrónica, equipos médicos, instalaciones de investigación y desarrollo, celdas de combustible, dispositivos ópticos, materiales termoeléctricos, cabezales magnéticos, sensores, capas de barrera, capas de imprimación, aplicaciones que no son de circuitos integrados y otros.
Análisis y perspectivas regionales del mercado de deposición de capas atómicas en Europa
Se analiza el mercado de deposición de capas atómicas de Europa y se proporcionan información y tendencias del tamaño del mercado según el país, el tipo de producto y la aplicación, como se mencionó anteriormente.
Algunos de los países cubiertos en el informe del mercado de deposición de capas atómicas de Europa son Alemania, Reino Unido, Francia, Italia, España, Turquía, Rusia, Bélgica, Países Bajos, Suiza y el resto de Europa.
Se espera que Alemania domine el mercado europeo de deposición de capas atómicas en términos de participación de mercado e ingresos. Se estima que mantendrá su dominio durante el período de pronóstico debido a la creciente tendencia a la miniaturización.
La sección de regiones del informe también proporciona factores individuales que impactan en el mercado y cambios en las regulaciones que afectan las tendencias actuales y futuras del mercado. Los puntos de datos, como las ventas de productos nuevos y de reemplazo, la demografía del país, la epidemiología de las enfermedades y los aranceles de importación y exportación, son algunos de los principales indicadores utilizados para pronosticar el escenario del mercado para cada país. Además, se consideran la presencia y disponibilidad de marcas europeas y los desafíos que enfrentan debido a la alta competencia de las marcas locales y nacionales y el impacto de los canales de venta al proporcionar un análisis de pronóstico de los datos del país.
Análisis del panorama competitivo y de la cuota de mercado de deposición atómica en Europa
El competitivo mercado europeo de deposición de capas atómicas proporciona detalles sobre los competidores. Los detalles incluyen una descripción general de la empresa, las finanzas de la empresa, los ingresos generados, el potencial de mercado, la inversión en investigación y desarrollo, las nuevas iniciativas de mercado, la presencia en Europa, los sitios e instalaciones de producción, las capacidades de producción, las fortalezas y debilidades de la empresa, el lanzamiento de productos, la amplitud y la variedad de productos y el dominio de las aplicaciones. Los puntos de datos anteriores solo están relacionados con el enfoque de la empresa en el mercado europeo de deposición de capas atómicas.
Algunos de los principales actores que operan en el mercado europeo de deposición de capas atómicas son ADEKA CORPORATION, AIXTRON, Applied Materials Inc., ASM International, LAM RESEARCH CORPORATION, Tokyo Electron Limited, Kurt J. Lesker Company, Beneq, Veeco Instruments Inc., ANRIC TECH., Encapsulix, SENTECH Instruments GmbH, Oxford Instruments, Forge Nano Inc., Merck KGaA, HZO, Inc., Picosun Oy., entre otros.
Metodología de la investigación
La recopilación de datos y el análisis del año base se realizan utilizando módulos de recopilación de datos con tamaños de muestra grandes. Los datos del mercado se analizan y estiman utilizando modelos estadísticos y coherentes del mercado. Además, el análisis de la participación de mercado y el análisis de tendencias clave son los principales factores de éxito en el informe de mercado. La metodología de investigación clave utilizada por el equipo de investigación de DBMR es la triangulación de datos que implica la extracción de datos, el análisis del impacto de las variables de datos en el mercado y la validación primaria (experto en la industria). Aparte de esto, los modelos de datos incluyen cuadrículas de posicionamiento de proveedores, análisis de la línea de tiempo del mercado, descripción general y guía del mercado, cuadrícula de posicionamiento de la empresa, análisis de la participación de mercado de la empresa, estándares de medición, Europa frente a la región y análisis de la participación de los proveedores. Solicite una llamada de un analista en caso de tener más consultas.
SKU-
Obtenga acceso en línea al informe sobre la primera nube de inteligencia de mercado del mundo

- Panel de análisis de datos interactivo
- Panel de análisis de empresas para oportunidades con alto potencial de crecimiento
- Acceso de analista de investigación para personalización y consultas
- Análisis de la competencia con panel interactivo
- Últimas noticias, actualizaciones y análisis de tendencias
- Aproveche el poder del análisis de referencia para un seguimiento integral de la competencia
Tabla de contenido
1 INTRODUCTION
1.1 OBJECTIVES OF THE STUDY
1.2 MARKET DEFINITION
1.3 OVERVIEW OF EUROPE ATOMIC LAYER DEPOSITION MARKET
1.4 LIMITATION
1.5 MARKETS COVERED
2 MARKET SEGMENTATION
2.1 MARKETS COVERED
2.2 GEOGRAPHICAL SCOPE
2.3 YEARS CONSIDERED FOR THE STUDY
2.4 CURRENCY AND PRICING
2.5 DBMR TRIPOD DATA VALIDATION MODEL
2.6 PRODUCT TYPE LIFE LINE CURVE
2.7 MULTIVARIATE MODELING
2.8 PRIMARY INTERVIEWS WITH KEY OPINION LEADERS
2.9 DBMR MARKET POSITION GRID
2.1 MARKET APPLICATION COVERAGE GRID
2.11 DBMR MARKET CHALLENGE MATRIX
2.12 DBMR VENDOR SHARE ANALYSIS
2.13 SECONDARY SOURCES
2.14 ASSUMPTIONS
3 EXECUTIVE SUMMARY
4 PREMIUM INSIGHTS
5 MARKET OVERVIEW
5.1 DRIVERS
5.1.1 HIGH DEMAND FOR MICROELECTRONICS AND CONSUMER ELECTRONICS
5.1.2 RAISING CONCERN ON ENERGY HARVESTING RESULTS IN HIGH GROWTH OF PHOTOVOLTAIC (PV) CELLS
5.1.3 RAPID EXPANSION OF THE SEMICONDUCTOR INDUSTRY
5.2 RESTRAINT
5.2.1 HIGH INITIAL INVESTMENT COSTS
5.3 OPPORTUNITIES
5.3.1 TREND OF MINIATURIZATION
5.3.2 GROWING RESEARCH AND DEVELOPMENT IN ATOMIC LAYER DEPOSITION TECHNOLOGY
5.4 CHALLENGE
5.4.1 ALTERNATIVES OF ATOMIC LAYER DEPOSITION
6 EUROPE ATOMIC LAYER DEPOSITION MARKET, BY PRODUCT TYPE
6.1 OVERVIEW
6.2 METAL ALD
6.3 ALUMINUM OXIDE ALD
6.4 PLASMA ENHANCED ALD
6.5 CATALYTIC ALD
6.6 OTHERS
7 EUROPE ATOMIC LAYER DEPOSITION MARKET, BY APPLICATION
7.1 OVERVIEW
7.2 SEMICONDUCTORS
7.2.1 METAL ALD
7.2.2 ALUMINUM OXIDE ALD
7.2.3 CATALYTIC ALD
7.2.4 PLASMA ENHANCED ALD
7.2.5 OTHERS
7.3 ELECTRONICS
7.3.1 METAL ALD
7.3.2 ALUMINUM OXIDE ALD
7.3.3 CATALYTIC ALD
7.3.4 PLASMA ENHANCED ALD
7.3.5 OTHERS
7.4 SOLAR DEVICES
7.4.1 ALUMINUM OXIDE ALD
7.4.2 PLASMA ENHANCED ALD
7.4.3 METAL ALD
7.4.4 CATALYTIC ALD
7.4.5 OTHERS
7.5 MEDICAL EQUIPMENT
7.5.1 METAL ALD
7.5.2 ALUMINUM OXIDE ALD
7.5.3 CATALYTIC ALD
7.5.4 PLASMA ENHANCED ALD
7.5.5 OTHERS
7.6 OPTICAL DEVICES
7.6.1 METAL ALD
7.6.2 ALUMINUM OXIDE ALD
7.6.3 CATALYTIC ALD
7.6.4 PLASMA ENHANCED ALD
7.6.5 OTHERS
7.7 THERMOELECTRIC MATERIALS
7.7.1 METAL ALD
7.7.2 ALUMINUM OXIDE ALD
7.7.3 CATALYTIC ALD
7.7.4 PLASMA ENHANCED ALD
7.7.5 OTHERS
7.8 MAGNETIC HEADS
7.8.1 METAL ALD
7.8.2 ALUMINUM OXIDE ALD
7.8.3 CATALYTIC ALD
7.8.4 PLASMA ENHANCED ALD
7.8.5 OTHERS
7.9 RESEARCH & DEVELOPMENT FACILITIES
7.9.1 METAL ALD
7.9.2 ALUMINUM OXIDE ALD
7.9.3 CATALYTIC ALD
7.9.4 PLASMA ENHANCED ALD
7.9.5 OTHERS
7.1 FUEL CELLS
7.10.1 METAL ALD
7.10.2 ALUMINUM OXIDE ALD
7.10.3 CATALYTIC ALD
7.10.4 PLASMA ENHANCED ALD
7.10.5 OTHERS
7.11 SENSORS
7.11.1 METAL ALD
7.11.2 ALUMINUM OXIDE ALD
7.11.3 CATALYTIC ALD
7.11.4 PLASMA ENHANCED ALD
7.11.5 OTHERS
7.12 BARRIER LAYERS
7.12.1 METAL ALD
7.12.2 ALUMINUM OXIDE ALD
7.12.3 CATALYTIC ALD
7.12.4 PLASMA ENHANCED ALD
7.12.5 OTHERS
7.13 PRIMER LAYERS
7.13.1 METAL ALD
7.13.2 ALUMINUM ALD
7.13.3 CATALYTIC ALD
7.13.4 PLASMA ENHANCED ALD
7.13.5 OTHERS
7.14 NON-IC APPLICATION
7.14.1 METAL ALD
7.14.2 ALUMINUM ALD
7.14.3 CATALYTIC ALD
7.14.4 PLASMA ENHANCED ALD
7.14.5 OTHERS
7.15 OTHERS
7.15.1 METAL ALD
7.15.2 ALUMINUM ALD
7.15.3 CATALYTIC ALD
7.15.4 PLASMA ENHANCED ALD
7.15.5 OTHERS
8 EUROPE ATOMIC LAYER DEPOSITION MARKET, BY REGION
8.1 EUROPE
8.1.1 GERMANY
8.1.2 U.K
8.1.3 FRANCE
8.1.4 ITALY
8.1.5 SPAIN
8.1.6 TURKEY
8.1.7 RUSSIA
8.1.8 BELGIUM
8.1.9 NETHERLANDS
8.1.10 SWITZERLAND
8.1.11 REST OF EUROPE
9 COMPANY LANDSCAPE: EUROPE ATOMIC LAYER DEPOSITION MARKET
9.1 COMPANY SHARE ANALYSIS: EUROPE
9.2 NEW PRODUCT LAUNCH
9.3 MERGERS,AWARDS AND ACQUISITIONS
10 SWOT ANALYSIS
11 COMPANY PROFILE
11.1 LAM RESEARCH CORPORATION.
11.1.1 COMPANY SNAPSHOT
11.1.2 RECENT FINANCIALS
11.1.3 COMPANY SHARE ANALYSIS
11.1.4 PRODUCT PORTFOLIO
11.1.5 RECENT UPDATE
11.2 APPLIED MATERIALS, INC.
11.2.1 COMPANY SNAPSHOT
11.2.2 RECENT FINANCIALS
11.2.3 COMPANY SHARE ANALYSIS
11.2.4 PRODUCT PORTFOLIO
11.2.5 RECENT UPDATES
11.3 TOKYO ELECTRON LIMITED
11.3.1 COMPANY SNAPSHOT
11.3.2 REVENUE ANALYSIS
11.3.3 COMPANY SHARE ANALYSIS
11.3.4 PRODUCT PORTFOLIO
11.3.5 RECENT UPDATES
11.4 ASM INTERNATIONAL
11.4.1 COMPANY SNAPSHOT
11.4.2 RECENT FINANCIALS
11.4.3 COMPANY SHARE ANALYSIS
11.4.4 PRODUCT PORTFOLIO
11.4.5 RECENT UPDATE
11.5 AIXTRON
11.5.1 COMPANY SNAPSHOT
11.5.2 RECENT FINANCIALS
11.5.3 COMPANY SHARE ANALYSIS
11.5.4 PRODUCT PORTFOLIO
11.5.5 RECENT UPDATE
11.6 ADEKA CORPORATION
11.6.1 COMPANY SNAPSHOT
11.6.2 RECENT FINANCIALS
11.6.3 PRODUCT PORTFOLIO
11.6.4 RECENT UPDATE
11.7 ANRIC TECH.
11.7.1 COMPANY SNAPSHOT
11.7.2 PRODUCT PORTFOLIO
11.7.3 RECENT UPDATES
11.8 BENEQ
11.8.1 COMPANY SNAPSHOT
11.8.2 PRODUCT PORTFOLIO
11.8.3 RECENT UPDATES
11.9 ENCAPSULIX
11.9.1 COMPANY SNAPSHOT
11.9.2 PRODUCT PORTFOLIO
11.9.3 RECENT UPDATE
11.1 FORGE NANO INC.
11.10.1 COMPANY SNAPSHOT
11.10.2 PRODUCT PORTFOLIO
11.10.3 RECENT UPDATES
11.11 HZO INC.
11.11.1 COMPANY SNAPSHOT
11.11.2 PRODUCT PORTFOLIO
11.11.3 RECENT UPDATE
11.12 KURT J. LESKER COMPANY
11.12.1 COMPANY SNAPSHOT
11.12.2 PRODUCT PORTFOLIO
11.12.3 RECENT UPDATE
11.13 MERCK KGAA
11.13.1 COMPANY SNAPSHOT
11.13.2 RECENT FINANCIALS
11.13.3 PRODUCT PORTFOLIO
11.13.4 RECENT UPDATES
11.14 OXFORD INSTRUMENTS
11.14.1 COMPANY SNAPSHOT
11.14.2 RECENT FINANCIALS
11.14.3 PRODUCT PORTFOLIO
11.14.4 RECENT UPDATE
11.15 PICOSUN OY.
11.15.1 COMPANY SNAPSHOT
11.15.2 PRODUCT PORTFOLIO
11.15.3 RECENT UPDATES
11.16 SENTECH INSTRUMENTS GMBH
11.16.1 COMPANY SNAPSHOT
11.16.2 PRODUCT PORTFOLIO
11.16.3 RECENT UPDATE
11.17 VEECO INSTRUMENTS INC.
11.17.1 COMPANY SNAPSHOT
11.17.2 RECENT FINANCIALS
11.17.3 PRODUCT PORTFOLIO
11.17.4 RECENT UPDATES
12 QUESTIONNAIRE
13 RELATED REPORT
Lista de Tablas
TABLE 1 EUROPE ATOMIC LAYER DEPOSITION MARKET, BY PRODUCT TYPE, 2020-2029 (USD MILLION)
TABLE 2 EUROPE METAL ALD IN ATOMIC LAYER DEPOSITION MARKET, BY REGION, 2020-2029 (USD MILLION)
TABLE 3 EUROPE ALUMINUM OXIDE ALD IN ATOMIC LAYER DEPOSITION MARKET, BY REGION, 2020-2029 (USD MILLION)
TABLE 4 EUROPE PLASMA ENHANCED ALD IN ATOMIC LAYER DEPOSITION MARKET, BY REGION, 2020-2029 (USD MILLION)
TABLE 5 EUROPE CATALYTIC ALD IN ATOMIC LAYER DEPOSITION MARKET, BY REGION, 2020-2029 (USD MILLION)
TABLE 6 EUROPE OTHERS IN ATOMIC LAYER DEPOSITION MARKET, BY REGION, 2020-2029 (USD MILLION)
TABLE 7 EUROPE ATOMIC LAYER DEPOSITION MARKET, BY APPLICATION, 2020-2029 (USD MILLION)
TABLE 8 EUROPE SEMICONDUCTORS IN ATOMIC LAYER DEPOSITION MARKET, BY REGION, 2020-2029 (USD MILLION)
TABLE 9 EUROPE SEMICONDUCTORS IN ATOMIC LAYER DEPOSITION MARKET, BY PRODUCT TYPE, 2020-2029 (USD MILLION)
TABLE 10 EUROPE ELECTRONICS IN ATOMIC LAYER DEPOSITION MARKET, BY REGION, 2020-2029 (USD MILLION)
TABLE 11 EUROPE ELECTRONICS IN ATOMIC LAYER DEPOSITION MARKET, BY PRODUCT TYPE, 2020-2029 (USD MILLION)
TABLE 12 EUROPE SOLAR DEVICES IN ATOMIC LAYER DEPOSITION MARKET, BY REGION, 2020-2029 (USD MILLION)
TABLE 13 EUROPE SOLAR DEVICES IN ATOMIC LAYER DEPOSITION MARKET, BY PRODUCT TYPE, 2020-2029 (USD MILLION)
TABLE 14 EUROPE MEDICAL EQUIPMENT IN ATOMIC LAYER DEPOSITION MARKET, BY REGION, 2020-2029 (USD MILLION)
TABLE 15 EUROPE MEDICAL EQUIPMENT IN ATOMIC LAYER DEPOSITION MARKET, BY PRODUCT TYPE, 2020-2029 (USD MILLION)
TABLE 16 EUROPE OPTICAL DEVICES IN ATOMIC LAYER DEPOSITION MARKET, BY REGION, 2020-2029 (USD MILLION)
TABLE 17 EUROPE OPTICAL DEVICES IN ATOMIC LAYER DEPOSITION MARKET, BY PRODUCT TYPE, 2020-2029 (USD MILLION)
TABLE 18 EUROPE THERMOELECTRIC MATERIALS IN ATOMIC LAYER DEPOSITION MARKET, BY REGION, 2020-2029 (USD MILLION)
TABLE 19 EUROPE THERMOELECTRIC MATERIALS IN ATOMIC LAYER DEPOSITION MARKET, BY PRODUCT TYPE, 2020-2029 (USD MILLION)
TABLE 20 EUROPE MAGNETIC HEADS IN ATOMIC LAYER DEPOSITION MARKET, BY REGION, 2020-2029 (USD MILLION)
TABLE 21 EUROPE MAGNETIC HEADS ATOMIC LAYER DEPOSITION MARKET, BY PRODUCT TYPE, 2020-2029 (USD MILLION)
TABLE 22 EUROPE RESEARCH & DEVELOPMENT FACILITIES IN ATOMIC LAYER DEPOSITION MARKET, BY REGION, 2020-2029 (USD MILLION)
TABLE 23 EUROPE RESEARCH & DEVELOPMENT FACILITIES IN ATOMIC LAYER DEPOSITION MARKET, BY PRODUCT TYPE, 2020-2029 (USD MILLION)
TABLE 24 EUROPE FUEL CELLS IN ATOMIC LAYER DEPOSITION MARKET, BY REGION, 2020-2029 (USD MILLION)
TABLE 25 EUROPE FUEL CELLS IN ATOMIC LAYER DEPOSITION MARKET, BY PRODUCT TYPE, 2020-2029 (USD MILLION)
TABLE 26 EUROPE SENSORS IN ATOMIC LAYER DEPOSITION MARKET, BY REGION, 2020-2029 (USD MILLION)
TABLE 27 EUROPE SENSORS IN ATOMIC LAYER DEPOSITION MARKET, BY PRODUCT TYPE, 2020-2029 (USD MILLION)
TABLE 28 EUROPE BARRIER LAYERS IN ATOMIC LAYER DEPOSITION MARKET, BY REGION, 2020-2029 (USD MILLION)
TABLE 29 EUROPE BARRIER LAYERS IN ATOMIC LAYER DEPOSITION MARKET, BY PRODUCT TYPE, 2020-2029 (USD MILLION)
TABLE 30 EUROPE PRIMER LAYERS IN ATOMIC LAYER DEPOSITION MARKET, BY REGION, 2020-2029 (USD MILLION)
TABLE 31 EUROPE PRIMER LAYERS IN ATOMIC LAYER DEPOSITION MARKET, BY PRODUCT TYPE, 2020-2029 (USD MILLION)
TABLE 32 EUROPE NON-IC APPLICATION IN ATOMIC LAYER DEPOSITION MARKET, BY REGION, 2020-2029 (USD MILLION)
TABLE 33 EUROPE NON-IC APPLICATION IN ATOMIC LAYER DEPOSITION MARKET, BY PRODUCT TYPE, 2020-2029 (USD MILLION)
TABLE 34 EUROPE OTHERS IN ATOMIC LAYER DEPOSITION MARKET, BY REGION, 2020-2029 (USD MILLION)
TABLE 35 EUROPE OTHERS IN ATOMIC LAYER DEPOSITION MARKET, BY PRODUCT TYPE, 2020-2029 (USD MILLION)
TABLE 36 EUROPE ATOMIC LAYER DEPOSITION MARKET, BY COUNTRY, 2020-2029 (USD MILLION)
TABLE 37 EUROPE ATOMIC LAYER DEPOSITION MARKET, BY PRODUCT TYPE, 2020-2029 (USD MILLION)
TABLE 38 EUROPE ATOMIC LAYER DEPOSITION MARKET, BY APPLICATION, 2020-2029 (USD MILLION)
TABLE 39 EUROPE SEMICONDUCTORS IN ATOMIC LAYER DEPOSITION MARKET, BY PRODUCT TYPE, 2020-2029 (USD MILLION)
TABLE 40 EUROPE ELECTRONICS IN ATOMIC LAYER DEPOSITION MARKET, BY PRODUCT TYPE, 2020-2029 (USD MILLION)
TABLE 41 EUROPE SOLAR DEVICES IN ATOMIC LAYER DEPOSITION MARKET, BY PRODUCT TYPE, 2020-2029 (USD MILLION)
TABLE 42 EUROPE MEDICAL EQUIPMENT IN ATOMIC LAYER DEPOSITION MARKET, BY PRODUCT TYPE, 2020-2029 (USD MILLION)
TABLE 43 EUROPE OPTICAL DEVICES IN ATOMIC LAYER DEPOSITION MARKET, BY PRODUCT TYPE, 2020-2029 (USD MILLION)
TABLE 44 EUROPE THERMOELECTRIC MATERIALS IN ATOMIC LAYER DEPOSITION MARKET, BY PRODUCT TYPE, 2020-2029 (USD MILLION)
TABLE 45 EUROPE FUEL CELLS IN ATOMIC LAYER DEPOSITION MARKET, BY PRODUCT TYPE, 2020-2029 (USD MILLION)
TABLE 46 EUROPE RESEARCH AND DEVELOPMENT FACILITIES IN ATOMIC LAYER DEPOSITION MARKET, BY PRODUCT TYPE, 2020-2029 (USD MILLION)
TABLE 47 EUROPE MAGNETIC HEADS IN ATOMIC LAYER DEPOSITION MARKET, BY PRODUCT TYPE, 2020-2029 (USD MILLION)
TABLE 48 EUROPE SENSORS IN ATOMIC LAYER DEPOSITION MARKET, BY PRODUCT TYPE, 2020-2029 (USD MILLION)
TABLE 49 EUROPE BARRIER LAYERS IN ATOMIC LAYER DEPOSITION MARKET, BY PRODUCT TYPE, 2020-2029 (USD MILLION)
TABLE 50 EUROPE PRIMER LAYERS IN ATOMIC LAYER DEPOSITION MARKET, BY PRODUCT TYPE, 2020-2029 (USD MILLION)
TABLE 51 EUROPE NON-IC APPLICATION IN ATOMIC LAYER DEPOSITION MARKET, BY PRODUCT TYPE, 2020-2029 (USD MILLION)
TABLE 52 EUROPE OTHERS IN ATOMIC LAYER DEPOSITION MARKET, BY PRODUCT TYPE, 2020-2029 (USD MILLION)
TABLE 53 GERMANY ATOMIC LAYER DEPOSITION MARKET, BY PRODUCT TYPE, 2020-2029 (USD MILLION)
TABLE 54 GERMANY ATOMIC LAYER DEPOSITION MARKET, BY APPLICATION, 2020-2029 (USD MILLION)
TABLE 55 GERMANY SEMICONDUCTORS IN ATOMIC LAYER DEPOSITION MARKET, BY PRODUCT TYPE, 2020-2029 (USD MILLION)
TABLE 56 GERMANY ELECTRONICS IN ATOMIC LAYER DEPOSITION MARKET, BY PRODUCT TYPE, 2020-2029 (USD MILLION)
TABLE 57 GERMANY SOLAR DEVICES IN ATOMIC LAYER DEPOSITION MARKET, BY PRODUCT TYPE, 2020-2029 (USD MILLION)
TABLE 58 GERMANY MEDICAL EQUIPMENT IN ATOMIC LAYER DEPOSITION MARKET, BY PRODUCT TYPE, 2020-2029 (USD MILLION)
TABLE 59 GERMANY OPTICAL DEVICES IN ATOMIC LAYER DEPOSITION MARKET, BY PRODUCT TYPE, 2020-2029 (USD MILLION)
TABLE 60 GERMANY THERMOELECTRIC MATERIALS IN ATOMIC LAYER DEPOSITION MARKET, BY PRODUCT TYPE, 2020-2029 (USD MILLION)
TABLE 61 GERMANY FUEL CELLS IN ATOMIC LAYER DEPOSITION MARKET, BY PRODUCT TYPE, 2020-2029 (USD MILLION)
TABLE 62 GERMANY RESEARCH AND DEVELOPMENT FACILITIES IN ATOMIC LAYER DEPOSITION MARKET, BY PRODUCT TYPE, 2020-2029 (USD MILLION)
TABLE 63 GERMANY MAGNETIC HEADS IN ATOMIC LAYER DEPOSITION MARKET, BY PRODUCT TYPE, 2020-2029 (USD MILLION)
TABLE 64 GERMANY SENSORS IN ATOMIC LAYER DEPOSITION MARKET, BY PRODUCT TYPE, 2020-2029 (USD MILLION)
TABLE 65 GERMANY BARRIER LAYERS IN ATOMIC LAYER DEPOSITION MARKET, BY PRODUCT TYPE, 2020-2029 (USD MILLION)
TABLE 66 GERMANY PRIMER LAYERS IN ATOMIC LAYER DEPOSITION MARKET, BY PRODUCT TYPE, 2020-2029 (USD MILLION)
TABLE 67 GERMANY NON-IC APPLICATION IN ATOMIC LAYER DEPOSITION MARKET, BY PRODUCT TYPE, 2020-2029 (USD MILLION)
TABLE 68 GERMANY OTHERS IN ATOMIC LAYER DEPOSITION MARKET, BY PRODUCT TYPE, 2020-2029 (USD MILLION)
TABLE 69 U.K ATOMIC LAYER DEPOSITION MARKET, BY PRODUCT TYPE, 2020-2029 (USD MILLION)
TABLE 70 U.K ATOMIC LAYER DEPOSITION MARKET, BY APPLICATION, 2020-2029 (USD MILLION)
TABLE 71 U.K SEMICONDUCTORS IN ATOMIC LAYER DEPOSITION MARKET, BY PRODUCT TYPE, 2020-2029 (USD MILLION)
TABLE 72 U.K ELECTRONICS IN ATOMIC LAYER DEPOSITION MARKET, BY PRODUCT TYPE, 2020-2029 (USD MILLION)
TABLE 73 U.K SOLAR DEVICES IN ATOMIC LAYER DEPOSITION MARKET, BY PRODUCT TYPE, 2020-2029 (USD MILLION)
TABLE 74 U.K MEDICAL EQUIPMENT IN ATOMIC LAYER DEPOSITION MARKET, BY PRODUCT TYPE, 2020-2029 (USD MILLION)
TABLE 75 U.K OPTICAL DEVICES IN ATOMIC LAYER DEPOSITION MARKET, BY PRODUCT TYPE, 2020-2029 (USD MILLION)
TABLE 76 U.K THERMOELECTRIC MATERIALS IN ATOMIC LAYER DEPOSITION MARKET, BY PRODUCT TYPE, 2020-2029 (USD MILLION)
TABLE 77 U.K FUEL CELLS IN ATOMIC LAYER DEPOSITION MARKET, BY PRODUCT TYPE, 2020-2029 (USD MILLION)
TABLE 78 U.K RESEARCH AND DEVELOPMENT FACILITIES IN ATOMIC LAYER DEPOSITION MARKET, BY PRODUCT TYPE, 2020-2029 (USD MILLION)
TABLE 79 U.K MAGNETIC HEADS IN ATOMIC LAYER DEPOSITION MARKET, BY PRODUCT TYPE, 2020-2029 (USD MILLION)
TABLE 80 U.K SENSORS IN ATOMIC LAYER DEPOSITION MARKET, BY PRODUCT TYPE, 2020-2029 (USD MILLION)
TABLE 81 U.K BARRIER LAYERS IN ATOMIC LAYER DEPOSITION MARKET, BY PRODUCT TYPE, 2020-2029 (USD MILLION)
TABLE 82 U.K PRIMER LAYERS IN ATOMIC LAYER DEPOSITION MARKET, BY PRODUCT TYPE, 2020-2029 (USD MILLION)
TABLE 83 U.K NON-IC APPLICATION IN ATOMIC LAYER DEPOSITION MARKET, BY PRODUCT TYPE, 2020-2029 (USD MILLION)
TABLE 84 U.K OTHERS IN ATOMIC LAYER DEPOSITION MARKET, BY PRODUCT TYPE, 2020-2029 (USD MILLION)
TABLE 85 FRANCE ATOMIC LAYER DEPOSITION MARKET, BY PRODUCT TYPE, 2020-2029 (USD MILLION)
TABLE 86 FRANCE ATOMIC LAYER DEPOSITION MARKET, BY APPLICATION, 2020-2029 (USD MILLION)
TABLE 87 FRANCE SEMICONDUCTORS IN ATOMIC LAYER DEPOSITION MARKET, BY TYPE, 2020-2029 (USD MILLION)
TABLE 88 FRANCE ELECTRONICS IN ATOMIC LAYER DEPOSITION MARKET, BY PRODUCT TYPE, 2020-2029 (USD MILLION)
TABLE 89 FRANCE SOLAR DEVICES IN ATOMIC LAYER DEPOSITION MARKET, BY PRODUCT TYPE, 2020-2029 (USD MILLION)
TABLE 90 FRANCE MEDICAL EQUIPMENT IN ATOMIC LAYER DEPOSITION MARKET, BY PRODUCT TYPE, 2020-2029 (USD MILLION)
TABLE 91 FRANCE OPTICAL DEVICES IN ATOMIC LAYER DEPOSITION MARKET, BY PRODUCT TYPE, 2020-2029 (USD MILLION)
TABLE 92 FRANCE THERMOELECTRIC MATERIALS IN ATOMIC LAYER DEPOSITION MARKET, BY PRODUCT TYPE, 2020-2029 (USD MILLION)
TABLE 93 FRANCE FUEL CELLS IN ATOMIC LAYER DEPOSITION MARKET, BY PRODUCT TYPE, 2020-2029 (USD MILLION)
TABLE 94 FRANCE RESEARCH AND DEVELOPMENT FACILITIES IN ATOMIC LAYER DEPOSITION MARKET, BY PRODUCT TYPE, 2020-2029 (USD MILLION)
TABLE 95 FRANCE MAGNETIC HEADS IN ATOMIC LAYER DEPOSITION MARKET, BY PRODUCT TYPE, 2020-2029 (USD MILLION)
TABLE 96 FRANCE SENSORS IN ATOMIC LAYER DEPOSITION MARKET, BY PRODUCT TYPE, 2020-2029 (USD MILLION)
TABLE 97 FRANCE BARRIER LAYERS IN ATOMIC LAYER DEPOSITION MARKET, BY PRODUCT TYPE, 2020-2029 (USD MILLION)
TABLE 98 FRANCE PRIMER LAYERS IN ATOMIC LAYER DEPOSITION MARKET, BY PRODUCT TYPE, 2020-2029 (USD MILLION)
TABLE 99 FRANCE NON-IC APPLICATION IN ATOMIC LAYER DEPOSITION MARKET, BY PRODUCT TYPE, 2020-2029 (USD MILLION)
TABLE 100 FRANCE OTHERS IN ATOMIC LAYER DEPOSITION MARKET, BY PRODUCT TYPE, 2020-2029 (USD MILLION)
TABLE 101 ITALY ATOMIC LAYER DEPOSITION MARKET, BY PRODUCT TYPE, 2020-2029 (USD MILLION)
TABLE 102 ITALY ATOMIC LAYER DEPOSITION MARKET, BY APPLICATION, 2020-2029 (USD MILLION)
TABLE 103 ITALY SEMICONDUCTORS IN ATOMIC LAYER DEPOSITION MARKET, BY PRODUCT TYPE, 2020-2029 (USD MILLION)
TABLE 104 ITALY ELECTRONICS IN ATOMIC LAYER DEPOSITION MARKET, BY PRODUCT TYPE, 2020-2029 (USD MILLION)
TABLE 105 ITALY SOLAR DEVICES IN ATOMIC LAYER DEPOSITION MARKET, BY PRODUCT TYPE, 2020-2029 (USD MILLION)
TABLE 106 ITALY MEDICAL EQUIPMENT IN ATOMIC LAYER DEPOSITION MARKET, BY PRODUCT TYPE, 2020-2029 (USD MILLION)
TABLE 107 ITALY OPTICAL DEVICES IN ATOMIC LAYER DEPOSITION MARKET, BY PRODUCT TYPE, 2020-2029 (USD MILLION)
TABLE 108 ITALY THERMOELECTRIC MATERIALS IN ATOMIC LAYER DEPOSITION MARKET, BY PRODUCT TYPE, 2020-2029 (USD MILLION)
TABLE 109 ITALY FUEL CELLS IN ATOMIC LAYER DEPOSITION MARKET, BY PRODUCT TYPE, 2020-2029 (USD MILLION)
TABLE 110 ITALY RESEARCH AND DEVELOPMENT FACILITIES IN ATOMIC LAYER DEPOSITION MARKET, BY PRODUCT TYPE, 2020-2029 (USD MILLION)
TABLE 111 ITALY MAGNETIC HEADS IN ATOMIC LAYER DEPOSITION MARKET, BY PRODUCT TYPE, 2020-2029 (USD MILLION)
TABLE 112 ITALY SENSORS IN ATOMIC LAYER DEPOSITION MARKET, BY PRODUCT TYPE, 2020-2029 (USD MILLION)
TABLE 113 ITALY BARRIER LAYERS IN ATOMIC LAYER DEPOSITION MARKET, BY PRODUCT TYPE, 2020-2029 (USD MILLION)
TABLE 114 ITALY PRIMER LAYERS IN ATOMIC LAYER DEPOSITION MARKET, BY PRODUCT TYPE, 2020-2029 (USD MILLION)
TABLE 115 ITALY NON-IC APPLICATION IN ATOMIC LAYER DEPOSITION MARKET, BY PRODUCT TYPE, 2020-2029 (USD MILLION)
TABLE 116 ITALY OTHERS IN ATOMIC LAYER DEPOSITION MARKET, BY PRODUCT TYPE, 2020-2029 (USD MILLION)
TABLE 117 SPAIN ATOMIC LAYER DEPOSITION MARKET, BY PRODUCT TYPE, 2020-2029 (USD MILLION)
TABLE 118 SPAIN ATOMIC LAYER DEPOSITION MARKET, BY APPLICATION, 2020-2029 (USD MILLION)
TABLE 119 SPAIN SEMICONDUCTORS IN ATOMIC LAYER DEPOSITION MARKET, BY PRODUCT TYPE, 2020-2029 (USD MILLION)
TABLE 120 SPAIN ELECTRONICS IN ATOMIC LAYER DEPOSITION MARKET, BY PRODUCT TYPE, 2020-2029 (USD MILLION)
TABLE 121 SPAIN SOLAR DEVICES IN ATOMIC LAYER DEPOSITION MARKET, BY PRODUCT TYPE, 2020-2029 (USD MILLION)
TABLE 122 SPAIN MEDICAL EQUIPMENT IN ATOMIC LAYER DEPOSITION MARKET, BY PRODUCT TYPE, 2020-2029 (USD MILLION)
TABLE 123 SPAIN OPTICAL DEVICES IN ATOMIC LAYER DEPOSITION MARKET, BY PRODUCT TYPE, 2020-2029 (USD MILLION)
TABLE 124 SPAIN THERMOELECTRIC MATERIALS IN ATOMIC LAYER DEPOSITION MARKET, BY PRODUCT TYPE, 2020-2029 (USD MILLION)
TABLE 125 SPAIN FUEL CELLS IN ATOMIC LAYER DEPOSITION MARKET, BY PRODUCT TYPE, 2020-2029 (USD MILLION)
TABLE 126 SPAIN RESEARCH AND DEVELOPMENT FACILITIES IN ATOMIC LAYER DEPOSITION MARKET, BY PRODUCT TYPE, 2020-2029 (USD MILLION)
TABLE 127 SPAIN MAGNETIC HEADS IN ATOMIC LAYER DEPOSITION MARKET, BY PRODUCT TYPE, 2020-2029 (USD MILLION)
TABLE 128 SPAIN SENSORS IN ATOMIC LAYER DEPOSITION MARKET, BY PRODUCT TYPE, 2020-2029 (USD MILLION)
TABLE 129 SPAIN BARRIER LAYERS IN ATOMIC LAYER DEPOSITION MARKET, BY PRODUCT TYPE, 2020-2029 (USD MILLION)
TABLE 130 SPAIN PRIMER LAYERS IN ATOMIC LAYER DEPOSITION MARKET, BY PRODUCT TYPE, 2020-2029 (USD MILLION)
TABLE 131 SPAIN NON-IC APPLICATION IN ATOMIC LAYER DEPOSITION MARKET, BY PRODUCT TYPE, 2020-2029 (USD MILLION)
TABLE 132 SPAIN OTHERS IN ATOMIC LAYER DEPOSITION MARKET, BY PRODUCT TYPE, 2020-2029 (USD MILLION)
TABLE 133 TURKEY ATOMIC LAYER DEPOSITION MARKET, BY PRODUCT TYPE, 2020-2029 (USD MILLION)
TABLE 134 TURKEY ATOMIC LAYER DEPOSITION MARKET, BY APPLICATION, 2020-2029 (USD MILLION)
TABLE 135 TURKEY SEMICONDUCTORS IN ATOMIC LAYER DEPOSITION MARKET, BY PRODUCT TYPE, 2020-2029 (USD MILLION)
TABLE 136 TURKEY ELECTRONICS IN ATOMIC LAYER DEPOSITION MARKET, BY PRODUCT TYPE, 2020-2029 (USD MILLION)
TABLE 137 TURKEY SOLAR DEVICES IN ATOMIC LAYER DEPOSITION MARKET, BY PRODUCT TYPE, 2020-2029 (USD MILLION)
TABLE 138 TURKEY MEDICAL EQUIPMENT IN ATOMIC LAYER DEPOSITION MARKET, BY PRODUCT TYPE, 2020-2029 (USD MILLION)
TABLE 139 TURKEY OPTICAL DEVICES IN ATOMIC LAYER DEPOSITION MARKET, BY PRODUCT TYPE, 2020-2029 (USD MILLION)
TABLE 140 TURKEY THERMOELECTRIC MATERIALS IN ATOMIC LAYER DEPOSITION MARKET, BY PRODUCT TYPE, 2020-2029 (USD MILLION)
TABLE 141 TURKEY FUEL CELLS IN ATOMIC LAYER DEPOSITION MARKET, BY PRODUCT TYPE, 2020-2029 (USD MILLION)
TABLE 142 TURKEY RESEARCH AND DEVELOPMENT FACILITIES IN ATOMIC LAYER DEPOSITION MARKET, BY PRODUCT TYPE, 2020-2029 (USD MILLION)
TABLE 143 TURKEY MAGNETIC HEADS IN ATOMIC LAYER DEPOSITION MARKET, BY PRODUCT TYPE, 2020-2029 (USD MILLION)
TABLE 144 TURKEY SENSORS IN ATOMIC LAYER DEPOSITION MARKET, BY PRODUCT TYPE, 2020-2029 (USD MILLION)
TABLE 145 TURKEY BARRIER LAYERS IN ATOMIC LAYER DEPOSITION MARKET, BY PRODUCT TYPE, 2020-2029 (USD MILLION)
TABLE 146 TURKEY PRIMER LAYERS IN ATOMIC LAYER DEPOSITION MARKET, BY PRODUCT TYPE, 2020-2029 (USD MILLION)
TABLE 147 TURKEY NON-IC APPLICATION IN ATOMIC LAYER DEPOSITION MARKET, BY PRODUCT TYPE, 2020-2029 (USD MILLION)
TABLE 148 TURKEY OTHERS IN ATOMIC LAYER DEPOSITION MARKET, BY PRODUCT TYPE, 2020-2029 (USD MILLION)
TABLE 149 RUSSIA ATOMIC LAYER DEPOSITION MARKET, BY PRODUCT TYPE, 2020-2029 (USD MILLION)
TABLE 150 RUSSIA ATOMIC LAYER DEPOSITION MARKET, BY APPLICATION, 2020-2029 (USD MILLION)
TABLE 151 RUSSIA SEMICONDUCTORS IN ATOMIC LAYER DEPOSITION MARKET, BY PRODUCT TYPE, 2020-2029 (USD MILLION)
TABLE 152 RUSSIA ELECTRONICS IN ATOMIC LAYER DEPOSITION MARKET, BY PRODUCT TYPE, 2020-2029 (USD MILLION)
TABLE 153 RUSSIA SOLAR DEVICES IN ATOMIC LAYER DEPOSITION MARKET, BY PRODUCT TYPE, 2020-2029 (USD MILLION)
TABLE 154 RUSSIA MEDICAL EQUIPMENT IN ATOMIC LAYER DEPOSITION MARKET, BY PRODUCT TYPE, 2020-2029 (USD MILLION)
TABLE 155 RUSSIA OPTICAL DEVICES IN ATOMIC LAYER DEPOSITION MARKET, BY PRODUCT TYPE, 2020-2029 (USD MILLION)
TABLE 156 RUSSIA THERMOELECTRIC MATERIALS IN ATOMIC LAYER DEPOSITION MARKET, BY PRODUCT TYPE, 2020-2029 (USD MILLION)
TABLE 157 RUSSIA FUEL CELLS IN ATOMIC LAYER DEPOSITION MARKET, BY PRODUCT TYPE, 2020-2029 (USD MILLION)
TABLE 158 RUSSIA RESEARCH AND DEVELOPMENT FACILITIES IN ATOMIC LAYER DEPOSITION MARKET, BY PRODUCT TYPE, 2020-2029 (USD MILLION)
TABLE 159 RUSSIA MAGNETIC HEADS IN ATOMIC LAYER DEPOSITION MARKET, BY PRODUCT TYPE, 2020-2029 (USD MILLION)
TABLE 160 RUSSIA SENSORS IN ATOMIC LAYER DEPOSITION MARKET, BY PRODUCT TYPE, 2020-2029 (USD MILLION)
TABLE 161 RUSSIA BARRIER LAYERS IN ATOMIC LAYER DEPOSITION MARKET, BY PRODUCT TYPE, 2020-2029 (USD MILLION)
TABLE 162 RUSSIA PRIMER LAYERS IN ATOMIC LAYER DEPOSITION MARKET, BY PRODUCT TYPE, 2020-2029 (USD MILLION)
TABLE 163 RUSSIA NON-IC APPLICATION IN ATOMIC LAYER DEPOSITION MARKET, BY PRODUCT TYPE, 2020-2029 (USD MILLION)
TABLE 164 RUSSIA OTHERS IN ATOMIC LAYER DEPOSITION MARKET, BY PRODUCT TYPE, 2020-2029 (USD MILLION)
TABLE 165 BELGIUM ATOMIC LAYER DEPOSITION MARKET, BY PRODUCT TYPE, 2020-2029 (USD MILLION)
TABLE 166 BELGIUM ATOMIC LAYER DEPOSITION MARKET, BY APPLICATION, 2020-2029 (USD MILLION)
TABLE 167 BELGIUM SEMICONDUCTORS IN ATOMIC LAYER DEPOSITION MARKET, BY PRODUCT TYPE, 2020-2029 (USD MILLION)
TABLE 168 BELGIUM ELECTRONICS IN ATOMIC LAYER DEPOSITION MARKET, BY PRODUCT TYPE, 2020-2029 (USD MILLION)
TABLE 169 BELGIUM SOLAR DEVICES IN ATOMIC LAYER DEPOSITION MARKET, BY PRODUCT TYPE, 2020-2029 (USD MILLION)
TABLE 170 BELGIUM MEDICAL EQUIPMENT IN ATOMIC LAYER DEPOSITION MARKET, BY PRODUCT TYPE, 2020-2029 (USD MILLION)
TABLE 171 BELGIUM OPTICAL DEVICES IN ATOMIC LAYER DEPOSITION MARKET, BY PRODUCT TYPE, 2020-2029 (USD MILLION)
TABLE 172 BELGIUM THERMOELECTRIC MATERIALS IN ATOMIC LAYER DEPOSITION MARKET, BY PRODUCT TYPE, 2020-2029 (USD MILLION)
TABLE 173 BELGIUM FUEL CELLS IN ATOMIC LAYER DEPOSITION MARKET, BY PRODUCT TYPE, 2020-2029 (USD MILLION)
TABLE 174 BELGIUM RESEARCH AND DEVELOPMENT FACILITIES IN ATOMIC LAYER DEPOSITION MARKET, BY PRODUCT TYPE, 2020-2029 (USD MILLION)
TABLE 175 BELGIUM MAGNETIC HEADS IN ATOMIC LAYER DEPOSITION MARKET, BY PRODUCT TYPE, 2020-2029 (USD MILLION)
TABLE 176 BELGIUM SENSORS IN ATOMIC LAYER DEPOSITION MARKET, BY PRODUCT TYPE, 2020-2029 (USD MILLION)
TABLE 177 BELGIUM BARRIER LAYERS IN ATOMIC LAYER DEPOSITION MARKET, BY PRODUCT TYPE, 2020-2029 (USD MILLION)
TABLE 178 BELGIUM PRIMER LAYERS IN ATOMIC LAYER DEPOSITION MARKET, BY PRODUCT TYPE, 2020-2029 (USD MILLION)
TABLE 179 BELGIUM NON-IC APPLICATION IN ATOMIC LAYER DEPOSITION MARKET, BY PRODUCT TYPE, 2020-2029 (USD MILLION)
TABLE 180 BELGIUM OTHERS IN ATOMIC LAYER DEPOSITION MARKET, BY PRODUCT TYPE, 2020-2029 (USD MILLION)
TABLE 181 NETHERLANDS ATOMIC LAYER DEPOSITION MARKET, BY PRODUCT TYPE, 2020-2029 (USD MILLION)
TABLE 182 NETHERLANDS ATOMIC LAYER DEPOSITION MARKET, BY APPLICATION, 2020-2029 (USD MILLION)
TABLE 183 NETHERLANDS SEMICONDUCTORS IN ATOMIC LAYER DEPOSITION MARKET, BY PRODUCT TYPE, 2020-2029 (USD MILLION)
TABLE 184 NETHERLANDS ELECTRONICS IN ATOMIC LAYER DEPOSITION MARKET, BY PRODUCT TYPE, 2020-2029 (USD MILLION)
TABLE 185 NETHERLANDS SOLAR DEVICES IN ATOMIC LAYER DEPOSITION MARKET, BY PRODUCT TYPE, 2020-2029 (USD MILLION)
TABLE 186 NETHERLANDS MEDICAL EQUIPMENT IN ATOMIC LAYER DEPOSITION MARKET, BY PRODUCT TYPE, 2020-2029 (USD MILLION)
TABLE 187 NETHERLANDS OPTICAL DEVICES IN ATOMIC LAYER DEPOSITION MARKET, BY PRODUCT TYPE, 2020-2029 (USD MILLION)
TABLE 188 NETHERLANDS THERMOELECTRIC MATERIALS IN ATOMIC LAYER DEPOSITION MARKET, BY PRODUCT TYPE, 2020-2029 (USD MILLION)
TABLE 189 NETHERLANDS FUEL CELLS IN ATOMIC LAYER DEPOSITION MARKET, BY PRODUCT TYPE, 2020-2029 (USD MILLION)
TABLE 190 NETHERLANDS RESEARCH AND DEVELOPMENT FACILITIES IN ATOMIC LAYER DEPOSITION MARKET, BY PRODUCT TYPE, 2020-2029 (USD MILLION)
TABLE 191 NETHERLANDS MAGNETIC HEADS IN ATOMIC LAYER DEPOSITION MARKET, BY PRODUCT TYPE, 2020-2029 (USD MILLION)
TABLE 192 NETHERLANDS SENSORS IN ATOMIC LAYER DEPOSITION MARKET, BY PRODUCT TYPE, 2020-2029 (USD MILLION)
TABLE 193 NETHERLANDS BARRIER LAYERS IN ATOMIC LAYER DEPOSITION MARKET, BY PRODUCT TYPE, 2020-2029 (USD MILLION)
TABLE 194 NETHERLANDS PRIMER LAYERS IN ATOMIC LAYER DEPOSITION MARKET, BY PRODUCT TYPE, 2020-2029 (USD MILLION)
TABLE 195 NETHERLANDS NON-IC APPLICATION IN ATOMIC LAYER DEPOSITION MARKET, BY PRODUCT TYPE, 2020-2029 (USD MILLION)
TABLE 196 NETHERLANDS OTHERS IN ATOMIC LAYER DEPOSITION MARKET, BY PRODUCT TYPE, 2020-2029 (USD MILLION)
TABLE 197 SWITZERLAND ATOMIC LAYER DEPOSITION MARKET, BY PRODUCT TYPE, 2020-2029 (USD MILLION)
TABLE 198 SWITZERLAND ATOMIC LAYER DEPOSITION MARKET, BY APPLICATION, 2020-2029 (USD MILLION)
TABLE 199 SWITZERLAND SEMICONDUCTORS IN ATOMIC LAYER DEPOSITION MARKET, BY PRODUCT TYPE, 2020-2029 (USD MILLION)
TABLE 200 SWITZERLAND ELECTRONICS IN ATOMIC LAYER DEPOSITION MARKET, BY PRODUCT TYPE, 2020-2029 (USD MILLION)
TABLE 201 SWITZERLAND SOLAR DEVICES IN ATOMIC LAYER DEPOSITION MARKET, BY PRODUCT TYPE, 2020-2029 (USD MILLION)
TABLE 202 SWITZERLAND MEDICAL EQUIPMENT IN ATOMIC LAYER DEPOSITION MARKET, BY PRODUCT TYPE, 2020-2029 (USD MILLION)
TABLE 203 SWITZERLAND OPTICAL DEVICES IN ATOMIC LAYER DEPOSITION MARKET, BY PRODUCT TYPE, 2020-2029 (USD MILLION)
TABLE 204 SWITZERLAND THERMOELECTRIC MATERIALS IN ATOMIC LAYER DEPOSITION MARKET, BY PRODUCT TYPE, 2020-2029 (USD MILLION)
TABLE 205 SWITZERLAND FUEL CELLS IN ATOMIC LAYER DEPOSITION MARKET, BY PRODUCT TYPE, 2020-2029 (USD MILLION)
TABLE 206 SWITZERLAND RESEARCH AND DEVELOPMENT FACILITIES IN ATOMIC LAYER DEPOSITION MARKET, BY PRODUCT TYPE, 2020-2029 (USD MILLION)
TABLE 207 SWITZERLAND MAGNETIC HEADS IN ATOMIC LAYER DEPOSITION MARKET, BY PRODUCT TYPE, 2020-2029 (USD MILLION)
TABLE 208 SWITZERLAND SENSORS IN ATOMIC LAYER DEPOSITION MARKET, BY PRODUCT TYPE, 2020-2029 (USD MILLION)
TABLE 209 SWITZERLAND BARRIER LAYERS IN ATOMIC LAYER DEPOSITION MARKET, BY PRODUCT TYPE, 2020-2029 (USD MILLION)
TABLE 210 SWITZERLAND PRIMER LAYERS IN ATOMIC LAYER DEPOSITION MARKET, BY PRODUCT TYPE, 2020-2029 (USD MILLION)
TABLE 211 SWITZERLAND NON-IC APPLICATION IN ATOMIC LAYER DEPOSITION MARKET, BY PRODUCT TYPE, 2020-2029 (USD MILLION)
TABLE 212 SWITZERLAND OTHERS IN ATOMIC LAYER DEPOSITION MARKET, BY PRODUCT TYPE, 2020-2029 (USD MILLION)
TABLE 213 REST OF EUROPE ATOMIC LAYER DEPOSITION MARKET, BY PRODUCT TYPE, 2020-2029 (USD MILLION)
Lista de figuras
FIGURE 1 EUROPE ATOMIC LAYER DEPOSITION MARKET: SEGMENTATION
FIGURE 2 EUROPE ATOMIC LAYER DEPOSITION MARKET: DATA TRIANGULATION
FIGURE 3 EUROPE ATOMIC LAYER DEPOSITION MARKET: DROC ANALYSIS
FIGURE 4 EUROPE ATOMIC LAYER DEPOSITION MARKET: EUROPE VS REGIONAL MARKET ANALYSIS
FIGURE 5 EUROPE ATOMIC LAYER DEPOSITION MARKET: COMPANY RESEARCH ANALYSIS
FIGURE 6 EUROPE ATOMIC LAYER DEPOSITION MARKET: THE PRODUCT TYPE LIFE LINE CURVE
FIGURE 7 EUROPE ATOMIC LAYER DEPOSITION MARKET: MULTIVARIATE MODELLING
FIGURE 8 EUROPE ATOMIC LAYER DEPOSITION MARKET: INTERVIEW DEMOGRAPHICS
FIGURE 9 EUROPE ATOMIC LAYER DEPOSITION MARKET: DBMR MARKET POSITION GRID
FIGURE 10 EUROPE ATOMIC LAYER DEPOSITION MARKET: MARKET APPLICATION COVERAGE GRID
FIGURE 11 EUROPE ATOMIC LAYER DEPOSITION MARKET: THE MARKET CHALLENGE MATRIX
FIGURE 12 EUROPE ATOMIC LAYER DEPOSITION MARKET: VENDOR SHARE ANALYSIS
FIGURE 13 EUROPE ATOMIC LAYER DEPOSITION MARKET: SEGMENTATION
FIGURE 14 HIGH DEMAND FOR MICROELECTRONICS AND CONSUMER ELECTRONICS IS EXPECTED TO DRIVE THE EUROPE ATOMIC LAYER DEPOSITION MARKET IN THE FORECAST PERIOD
FIGURE 15 METAL ALD SEGMENT IS EXPECTED TO ACCOUNT FOR THE LARGEST SHARE OF THE EUROPE ATOMIC LAYER DEPOSITION MARKET IN 2022 & 2029
FIGURE 16 DRIVERS, RESTRAINTS, OPPORTUNITIES, AND CHALLENGES OF THE EUROPE ATOMIC LAYER DEPOSITION MARKET
FIGURE 17 EUROPE ATOMIC LAYER DEPOSITION MARKET: BY PRODUCT TYPE, 2021
FIGURE 18 EUROPE ATOMIC LAYER DEPOSITION MARKET: BY APPLICATION, 2021
FIGURE 19 EUROPE ATOMIC LAYER DEPOSITION MARKET: SNAPSHOT (2021)
FIGURE 20 EUROPE ATOMIC LAYER DEPOSITION MARKET: BY COUNTRY (2021)
FIGURE 21 EUROPE ATOMIC LAYER DEPOSITION MARKET: BY COUNTRY (2022 & 2029)
FIGURE 22 EUROPE ATOMIC LAYER DEPOSITION MARKET: BY COUNTRY (2021 & 2029)
FIGURE 23 EUROPE ATOMIC LAYER DEPOSITION MARKET: BY PRODUCT TYPE (2022-2029)
FIGURE 24 EUROPE ATOMIC LAYER DEPOSITION MARKET: COMPANY SHARE 2021 (%)
Metodología de investigación
La recopilación de datos y el análisis del año base se realizan utilizando módulos de recopilación de datos con muestras de gran tamaño. La etapa incluye la obtención de información de mercado o datos relacionados a través de varias fuentes y estrategias. Incluye el examen y la planificación de todos los datos adquiridos del pasado con antelación. Asimismo, abarca el examen de las inconsistencias de información observadas en diferentes fuentes de información. Los datos de mercado se analizan y estiman utilizando modelos estadísticos y coherentes de mercado. Además, el análisis de la participación de mercado y el análisis de tendencias clave son los principales factores de éxito en el informe de mercado. Para obtener más información, solicite una llamada de un analista o envíe su consulta.
La metodología de investigación clave utilizada por el equipo de investigación de DBMR es la triangulación de datos, que implica la extracción de datos, el análisis del impacto de las variables de datos en el mercado y la validación primaria (experto en la industria). Los modelos de datos incluyen cuadrícula de posicionamiento de proveedores, análisis de línea de tiempo de mercado, descripción general y guía del mercado, cuadrícula de posicionamiento de la empresa, análisis de patentes, análisis de precios, análisis de participación de mercado de la empresa, estándares de medición, análisis global versus regional y de participación de proveedores. Para obtener más información sobre la metodología de investigación, envíe una consulta para hablar con nuestros expertos de la industria.
Personalización disponible
Data Bridge Market Research es líder en investigación formativa avanzada. Nos enorgullecemos de brindar servicios a nuestros clientes existentes y nuevos con datos y análisis que coinciden y se adaptan a sus objetivos. El informe se puede personalizar para incluir análisis de tendencias de precios de marcas objetivo, comprensión del mercado de países adicionales (solicite la lista de países), datos de resultados de ensayos clínicos, revisión de literatura, análisis de mercado renovado y base de productos. El análisis de mercado de competidores objetivo se puede analizar desde análisis basados en tecnología hasta estrategias de cartera de mercado. Podemos agregar tantos competidores sobre los que necesite datos en el formato y estilo de datos que esté buscando. Nuestro equipo de analistas también puede proporcionarle datos en archivos de Excel sin procesar, tablas dinámicas (libro de datos) o puede ayudarlo a crear presentaciones a partir de los conjuntos de datos disponibles en el informe.

