
Europe Active Smart And Intelligent Packaging Market
Tamaño del mercado en miles de millones de dólares
Tasa de crecimiento anual compuesta (CAGR) :
% 
 USD
23.61 Billion
USD
38.49 Billion
2024
2032
USD
23.61 Billion
USD
38.49 Billion
2024
2032
| 2025 –2032 | |
| USD 23.61 Billion | |
| USD 38.49 Billion | |
| % | |
Europe Active, Smart and Intelligent Packaging Market Segmentation, By Type (Active Packaging, Smart Packaging, and Intelligent Packaging), Function (Moisture Control, Temperature Indicators, Shelf Life Sensing, Product Tracking, and Others), Technology (RFID Tags, QR Codes, NFC Tags, Coding and Markings, Sensors and Output Devices, and Others), Material (Plastic, Paper, Glass, Corrugated Board, Metal, and Others), Level (Primary, Secondary, and Tertiary), Application(Food, Beverages, Personal Care, Healthcare, Automotive, Consumer Electronics, and Others) – Industry Trends and Forecast to 2032
Europe Active, Smart and Intelligent Packaging Market Analysis
The active, smart, and intelligent packaging market has seen remarkable technological advancements aimed at enhancing product safety, quality, and sustainability. Active packaging technologies, such as oxygen scavengers and moisture absorbers, are increasingly utilized to extend shelf life. Smart packaging innovations include the use of RFID tags and QR codes for real-time tracking, enabling improved supply chain management and customer engagement. Intelligent packaging leverages nanotechnology and biosensors to monitor product freshness and detect contaminants, offering precise quality assurance.
Usage of these technologies is growing across industries such as food and beverages, pharmaceuticals, and cosmetics, driven by rising demand for transparency, safety, and sustainability. Smart packaging aids in reducing food waste by ensuring product freshness, while intelligent packaging supports the healthcare sector with tamper-evident and condition-monitoring solutions.
The growth of the market is fueled by advancements in IoT, AI, and big data analytics, which enable real-time insights and automation. Increasing consumer awareness and regulatory compliance are also key drivers, positioning the market for sustained growth globally.
Active, Smart and Intelligent Packaging Market Size
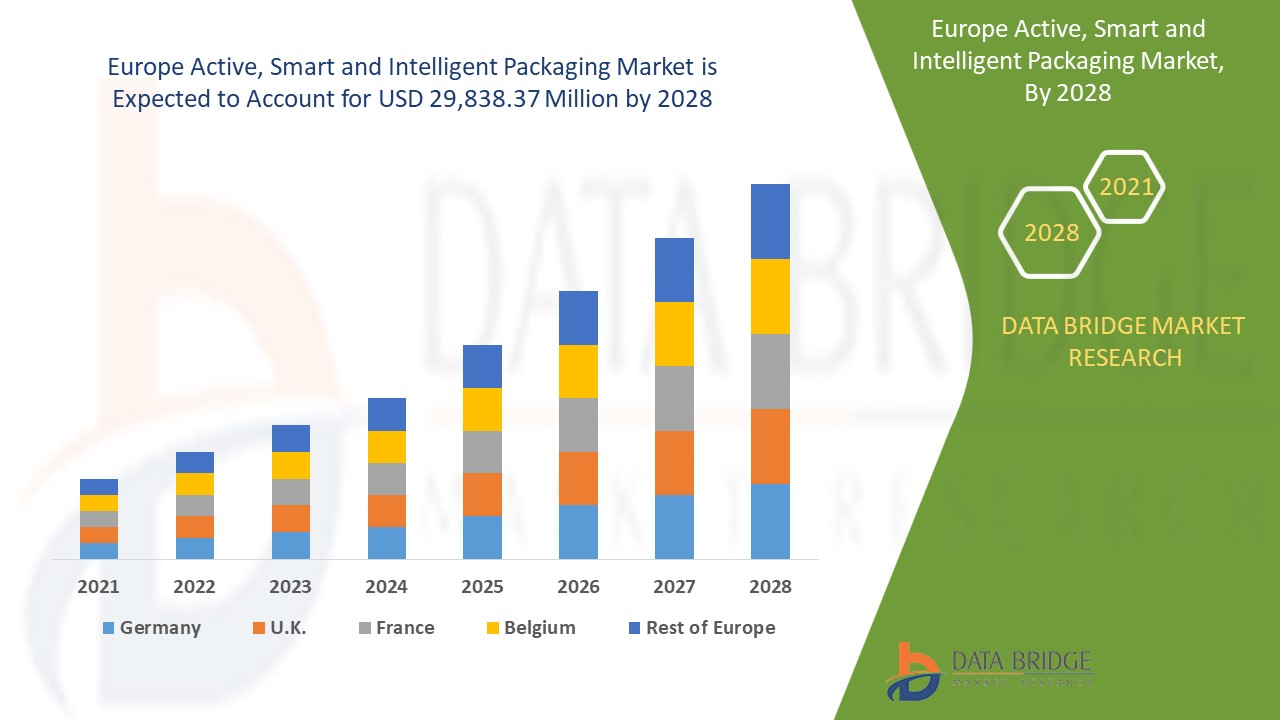
The Europe active, smart and intelligent packaging market size was valued at USD 23.61 billion in 2024 and is projected to reach USD 38.49 billion by 2032, with a CAGR of 6.3% during the forecast period of 2025 to 2032. In addition to the insights on market scenarios such as market value, growth rate, segmentation, geographical coverage, and major players, the market reports curated by the Data Bridge Market Research also include import export analysis, production capacity overview, production consumption analysis, price trend analysis, climate change scenario, supply chain analysis, value chain analysis, raw material/consumables overview, vendor selection criteria, PESTLE Analysis, Porter Analysis, and regulatory framework.
Active, Smart and Intelligent Packaging Market Trends
“Rising Demand for Sustainability in Smart Packaging”
A key trend driving growth in the active, smart, and intelligent packaging market is the increasing demand for sustainable solutions. Consumers and industries are gravitating toward eco-friendly packaging options that integrate advanced technologies, such as time-temperature indicators (TTIs), freshness sensors, and QR codes. These features not only enhance product quality and safety but also reduce waste by extending shelf life. For instance, companies such as Sealed Air are developing recyclable active packaging that incorporates barrier technologies for food preservation. The emphasis on sustainability aligns with global regulatory frameworks and corporate social responsibility goals, propelling innovation and adoption in the market.
Report Scope and Active, Smart and Intelligent Packaging Market Segmentation
|
Attributes |
Active, Smart and Intelligent Packaging Key Market Insights |
|
Segments Covered |
|
|
Countries Covered |
Germany, France, U.K., Netherlands, Switzerland, Belgium, Russia, Italy, Spain, Turkey, Rest of Europe in Europe |
|
Key Market Players |
LCR Hallcrest Ltd (U.K.), Ampacet Corporation (U.S.), WestRock Company (U.S.), Tetra Pak – Switzerland, R.R. Donnelley & Sons Company (U.S.), Sonoco Products Company (U.S.), Amcor Plc (Australia), CONSTANTIA FLEXIBLES (Austria), Klöckner Pentaplast (Germany), Graham Packaging Company (U.S.), Avery Dennison Corporation (U.S.), and DS Smith (U.K.) |
|
Market Opportunities |
|
|
Value Added Data Infosets |
In addition to the insights on market scenarios such as market value, growth rate, segmentation, geographical coverage, and major players, the market reports curated by the Data Bridge Market Research also include import export analysis, production capacity overview, production consumption analysis, price trend analysis, climate change scenario, supply chain analysis, value chain analysis, raw material/consumables overview, vendor selection criteria, PESTLE Analysis, Porter Analysis, and regulatory framework. |
Active, Smart and Intelligent Packaging Market Definition
Los envases activos, inteligentes e inteligentes integran tecnologías avanzadas para mejorar la seguridad, la calidad y la funcionalidad del producto. Los envases activos interactúan con el producto o el entorno, ofreciendo funciones como la absorción de humedad o la eliminación de oxígeno para prolongar la vida útil. Los envases inteligentes proporcionan información en tiempo real sobre el producto a través de sensores o indicadores, como detectores de frescura o seguimiento de la temperatura. Los envases inteligentes aprovechan la tecnología de comunicación, como las etiquetas RFID o los códigos QR, para el seguimiento del producto, la gestión del inventario o la interacción con el consumidor. Estas innovaciones en materia de envases se utilizan ampliamente en los sectores de la alimentación, los productos farmacéuticos y los productos electrónicos, y abordan las cambiantes demandas de los consumidores en cuanto a comodidad, seguridad y sostenibilidad, al tiempo que reducen los residuos y mejoran la eficiencia.
Dinámica del mercado de envases activos, inteligentes e inteligentes
Conductores
- Demanda de frescura por parte de los consumidores
La creciente preferencia de los consumidores por alimentos más frescos y duraderos está impulsando significativamente el mercado de los envases activos, inteligentes e inteligentes. Las tecnologías de envasado activo, como los captadores de oxígeno y los absorbentes de humedad, desempeñan un papel fundamental a la hora de mantener la frescura del producto y prolongar su vida útil. Por ejemplo, el envasado en atmósfera modificada (MAP) se utiliza ampliamente en las industrias de productos frescos y cárnicos para retrasar el deterioro y preservar el valor nutricional. Marcas como Freshworks han introducido envases inteligentes con indicadores de frescura, que permiten a los consumidores evaluar la calidad del producto visualmente. Esta demanda de frescura, sumada a la creciente concienciación sobre la seguridad alimentaria, está animando a los fabricantes a innovar y adoptar soluciones de envasado avanzadas, impulsando el crecimiento del mercado.
- Preocupaciones crecientes por la seguridad alimentaria
El creciente interés por la seguridad alimentaria ha impulsado significativamente la demanda de envases inteligentes, ya que abordan necesidades críticas de los consumidores y de las autoridades regulatorias. Soluciones como los sellos a prueba de manipulaciones garantizan la integridad del producto, mientras que los indicadores de deterioro brindan alertas en tiempo real sobre la calidad de los alimentos, lo que aumenta la confianza. Por ejemplo, las etiquetas indicadoras de tiempo y temperatura de FreshCode se adoptan ampliamente en productos perecederos para monitorear las fluctuaciones de temperatura y evitar el deterioro. El cumplimiento normativo, como las estrictas normas de seguridad alimentaria de la FDA, impulsa aún más el mercado. Con los consumidores exigiendo transparencia y las marcas esforzándose por mitigar los riesgos de transmisión alimentaria, las tecnologías de envasado inteligente se han vuelto indispensables para ofrecer productos seguros y de alta calidad e impulsar el crecimiento del mercado.
Oportunidades
- Crecimiento del sector farmacéutico
El creciente sector farmacéutico está creando oportunidades significativas para las soluciones de envasado inteligente. Estos sistemas de envasado avanzados controlan el uso de los medicamentos, garantizan la adherencia del paciente y reducen el riesgo de sobredosificación o subdosificación. Con funciones como recordatorios, seguimiento de dosis y medidas contra la falsificación, los envases inteligentes abordan necesidades críticas de atención médica. El aumento de las enfermedades crónicas, el envejecimiento de la población y la creciente conciencia de la salud están impulsando la demanda de este tipo de soluciones. Además, los organismos reguladores enfatizan la seguridad y trazabilidad de los medicamentos, lo que fomenta la adopción de tecnologías inteligentes. Este cambio abre vías para la innovación en etiquetas RFID, códigos QR y envases habilitados para IoT, lo que impulsa el crecimiento del mercado y mejora la experiencia general de atención médica.
- Expansión en el comercio electrónico
La rápida expansión del comercio electrónico está creando oportunidades significativas en el mercado de los envases inteligentes. Como el comercio minorista en línea depende en gran medida de cadenas de suministro eficientes, la demanda de envases resistentes y sensibles a la temperatura ha aumentado. Las innovaciones en materia de envases inteligentes, como los rastreadores de temperatura y las etiquetas con RFID, garantizan la calidad del producto durante el transporte, especialmente en el caso de productos perecederos como alimentos y productos farmacéuticos. Estas tecnologías permiten el seguimiento en tiempo real, lo que mejora la confianza y la satisfacción del cliente. Además, los envases inteligentes ayudan a reducir las pérdidas por deterioro, lo que mejora la rentabilidad para los minoristas y los proveedores. La creciente necesidad de envases seguros y a prueba de manipulaciones en el comercio electrónico impulsa aún más el crecimiento de las soluciones inteligentes, lo que las convierte en un factor fundamental para la expansión del mercado.
Restricciones/Desafíos
- Altos costos de desarrollo
El alto costo de desarrollo en el mercado de envases inteligentes, activos e inteligentes obstaculiza considerablemente el crecimiento. La integración de tecnologías avanzadas como sensores, etiquetas RFID y materiales inteligentes en los sistemas de envases requiere una inversión sustancial en investigación, desarrollo y procesos de producción. Estas tecnologías a menudo implican componentes complejos y especializados que contribuyen a aumentar los costos de fabricación. Como resultado, las empresas más pequeñas, que pueden enfrentar limitaciones financieras, tienen dificultades para adoptar tales innovaciones. Los altos costos iniciales crean una barrera de entrada, limitan la participación en el mercado y frenan la adopción generalizada de soluciones de envases inteligentes. Este desafío financiero es particularmente evidente en industrias con márgenes ajustados, donde la inversión en nuevas tecnologías se considera riesgosa.
- Complejidad en la fabricación
La complejidad de la fabricación de envases inteligentes, activos e inteligentes dificulta considerablemente el crecimiento del mercado. Producir envases que combinen funcionalidad e interactividad requiere técnicas de fabricación avanzadas, que pueden requerir muchos recursos y mucho tiempo. La integración de sensores, etiquetas RFID y otras tecnologías en los materiales de envasado implica múltiples etapas de producción, lo que aumenta tanto el tiempo como el coste. Además, la necesidad de alta precisión y equipos especializados para estas innovaciones puede abrumar a los fabricantes, en particular a las empresas más pequeñas. Esta complejidad en el proceso de producción a menudo conduce a plazos de entrega más largos y mayores gastos, lo que la convierte en una barrera importante para la adopción generalizada. Como resultado, muchas empresas dudan en invertir en soluciones de envases inteligentes, lo que frena el progreso del mercado.
Este informe de mercado proporciona detalles de los nuevos desarrollos recientes, regulaciones comerciales, análisis de importación y exportación, análisis de producción, optimización de la cadena de valor, participación de mercado, impacto de los actores del mercado nacional y localizado, analiza las oportunidades en términos de bolsillos de ingresos emergentes, cambios en las regulaciones del mercado, análisis estratégico del crecimiento del mercado, tamaño del mercado, crecimientos del mercado de categorías, nichos de aplicación y dominio, aprobaciones de productos, lanzamientos de productos, expansiones geográficas, innovaciones tecnológicas en el mercado. Para obtener más información sobre el mercado, comuníquese con Data Bridge Market Research para obtener un informe de analistas, nuestro equipo lo ayudará a tomar una decisión de mercado informada para lograr el crecimiento del mercado.
Impacto y situación actual del mercado ante la escasez de materias primas y retrasos en los envíos
Data Bridge Market Research ofrece un análisis de alto nivel del mercado y brinda información teniendo en cuenta el impacto y el entorno actual del mercado en relación con la escasez de materias primas y los retrasos en los envíos. Esto se traduce en la evaluación de posibilidades estratégicas, la creación de planes de acción efectivos y la asistencia a las empresas para tomar decisiones importantes.
Además del informe estándar, también ofrecemos un análisis en profundidad del nivel de adquisiciones a partir de retrasos de envío previstos, mapeo de distribuidores por región, análisis de productos básicos, análisis de producción, tendencias de mapeo de precios, abastecimiento, análisis del desempeño de categorías, soluciones de gestión de riesgos de la cadena de suministro, evaluación comparativa avanzada y otros servicios para adquisiciones y soporte estratégico.
Impacto esperado de la desaceleración económica en los precios y la disponibilidad de los productos
Cuando la actividad económica se desacelera, las industrias comienzan a sufrir. Los efectos previstos de la crisis económica sobre los precios y la accesibilidad de los productos se tienen en cuenta en los informes de conocimiento del mercado y los servicios de inteligencia que ofrece DBMR. Con esto, nuestros clientes pueden normalmente mantenerse un paso por delante de sus competidores, proyectar sus ventas e ingresos y estimar sus gastos de ganancias y pérdidas.
Mercado de envases activos, inteligentes e inteligentes
El mercado está segmentado en función del tipo, la función, la tecnología, el material, el nivel y la aplicación. El crecimiento entre estos segmentos le ayudará a analizar los segmentos de crecimiento reducido de las industrias y brindará a los usuarios una valiosa descripción general del mercado y conocimientos del mercado para ayudarlos a tomar decisiones estratégicas para identificar las principales aplicaciones del mercado.
Tipo
- Embalaje activo
- Embalaje inteligente
- Embalaje inteligente
Función
- Control de humedad
- Indicadores de temperatura
- Detección de vida útil
- Seguimiento de productos
- Otro
Tecnología
- Etiquetas RFID
- Códigos QR
- Etiquetas NFC
- Codificación y Marcas
- Sensores y dispositivos de salida
- Otros
Material
- Plástico
- Papel
- Vaso
- Cartón corrugado
- Metal
- Otro
Nivel
- Primario
- Secundario
- Terciario
Solicitud
- Alimento
- Bebidas
- Cuidado personal
- Cuidado de la salud
- Automotor
- Electrónica de consumo
- Otros
Análisis regional del mercado de envases activos, inteligentes e inteligentes
Se analiza el mercado y se proporcionan información y tendencias del tamaño del mercado por país, tipo, función, tecnología, material, nivel y aplicación como se menciona anteriormente.
Los países cubiertos en el informe de mercado son Alemania, Francia, Italia, Reino Unido, Bélgica, España, Rusia, Turquía, Países Bajos, Suiza y el resto de Europa.
Se espera que Alemania domine el mercado europeo de envases activos, inteligentes e inteligentes debido a su creciente adopción en todas las industrias, especialmente en alimentos y bebidas. La sólida base de fabricación del país, los avances tecnológicos y el énfasis en la sostenibilidad contribuyen a su liderazgo en este mercado. Con la creciente demanda de conveniencia y mayor vida útil, las innovadoras soluciones de envasado de Alemania satisfacen las preferencias de los consumidores, lo que impulsa el crecimiento del mercado. Esta tendencia se ve reforzada aún más por importantes inversiones en tecnologías de envasado inteligente.
La sección de países del informe también proporciona factores de impacto de mercado individuales y cambios en la regulación en el mercado a nivel nacional que afectan las tendencias actuales y futuras del mercado. Los puntos de datos como el análisis de la cadena de valor aguas abajo y aguas arriba, las tendencias técnicas y el análisis de las cinco fuerzas de Porter, los estudios de casos son algunos de los indicadores utilizados para pronosticar el escenario del mercado para países individuales. Además, la presencia y disponibilidad de marcas globales y sus desafíos enfrentados debido a la competencia grande o escasa de las marcas locales y nacionales, el impacto de los aranceles nacionales y las rutas comerciales se consideran al proporcionar un análisis de pronóstico de los datos del país.
Cuota de mercado de envases activos, inteligentes e inteligentes
El panorama competitivo del mercado proporciona detalles por competidor. Los detalles incluidos son una descripción general de la empresa, las finanzas de la empresa, los ingresos generados, el potencial de mercado, la inversión en investigación y desarrollo, las nuevas iniciativas de mercado, la presencia global, los sitios e instalaciones de producción, las capacidades de producción, las fortalezas y debilidades de la empresa, el lanzamiento de productos, la amplitud y variedad de productos, y el dominio de las aplicaciones. Los puntos de datos anteriores proporcionados solo están relacionados con el enfoque de las empresas en relación con el mercado.
Los líderes del mercado de envases activos, inteligentes e inteligentes que operan en el mercado son:
- LCR Hallcrest Ltd (Reino Unido)
- Corporación Ampacet (Estados Unidos)
- Compañía WestRock (Estados Unidos)
- Tetra Pak – Suiza
- Compañía RR Donnelley & Sons (Estados Unidos)
- Compañía de productos Sonoco (Estados Unidos)
- Amcor Plc (Australia)
- CONSTANTIA FLEXIBLES (Austria)
- Klöckner Pentaplast (Alemania)
- Compañía de embalaje Graham (Estados Unidos)
- Avery Dennison Corporation (Estados Unidos)
- DS Smith (Reino Unido)
Últimos avances en el mercado de envases activos, inteligentes e inteligentes
- En junio de 2023, Sealed Air Corporation lanzó una nueva línea de soluciones de envasado inteligente equipadas con sensores habilitados para IoT para monitoreo en tiempo real y análisis de datos. Esta tecnología innovadora mejora la trazabilidad del producto, el control de calidad y la participación del consumidor. Al optimizar la gestión del inventario y reducir el desperdicio de alimentos, Sealed Air tiene como objetivo mejorar la seguridad del producto y satisfacer las cambiantes demandas del mercado en materia de transparencia y sostenibilidad.
- En marzo de 2023, Amcor Limited formó una asociación estratégica con un productor de alimentos líder para promover soluciones de embalaje reciclables. Esta colaboración se centra en reducir los residuos plásticos y promover prácticas de economía circular en toda la cadena de suministro de alimentos. Los diseños ecológicos de Amcor, que utilizan materiales reciclados, se alinean con los objetivos globales de sostenibilidad y respaldan el cumplimiento normativo al tiempo que mejoran la eficiencia operativa en el envasado de alimentos.
- En marzo de 2022, Varcode Ltd. se asoció con General Data Company, Inc. para mejorar sus soluciones de identificación, etiquetado y gestión de datos de códigos de barras. Esta colaboración estratégica combina la tecnología de Varcode con la experiencia industrial de General Data para ofrecer un mejor embalaje, seguimiento de datos y servicio técnico de los equipos. Se espera que esta asociación fortalezca las capacidades operativas en los sectores del embalaje y la logística.
- En mayo de 2021, Varcode Ltd. se asoció con Media Sourcery, Inc. para integrar su tecnología Smart Tag™ en soluciones de cadena de frío. Esta asociación tiene como objetivo mejorar el control de la temperatura y el seguimiento de datos, garantizando la seguridad alimentaria durante el transporte. La colaboración favorece una mayor eficiencia y precisión en la cadena de frío, proporcionando datos en tiempo real para reducir el desperdicio y mejorar las operaciones logísticas.
- En abril de 2021, DuPont adquirió con éxito Laird Performance Materials, líder mundial en soluciones de gestión térmica y protección electromagnética de alto rendimiento. Esta adquisición fortalece la posición de DuPont en el mercado de la ciencia de los materiales, proporcionando tecnologías avanzadas para los sectores de la electrónica y la automoción. DuPont pretende aprovechar la experiencia de Laird para impulsar la innovación en materiales de alto rendimiento y ampliar su oferta de productos.
- En marzo de 2021, Amcor anunció una colaboración con JD Farm para lanzar envases con tecnología NFC para una mejor interacción con el consumidor. Esta innovadora solución de envasado permite a los consumidores interactuar con los productos a través de teléfonos inteligentes, mejorando su experiencia con información y promociones personalizadas. La colaboración se centra en la creación de envases más efectivos e interactivos, en línea con las tendencias en innovación digital e impulsada por el consumidor.
SKU-
Obtenga acceso en línea al informe sobre la primera nube de inteligencia de mercado del mundo

- Panel de análisis de datos interactivo
- Panel de análisis de empresas para oportunidades con alto potencial de crecimiento
- Acceso de analista de investigación para personalización y consultas
- Análisis de la competencia con panel interactivo
- Últimas noticias, actualizaciones y análisis de tendencias
- Aproveche el poder del análisis de referencia para un seguimiento integral de la competencia
Metodología de investigación
La recopilación de datos y el análisis del año base se realizan utilizando módulos de recopilación de datos con muestras de gran tamaño. La etapa incluye la obtención de información de mercado o datos relacionados a través de varias fuentes y estrategias. Incluye el examen y la planificación de todos los datos adquiridos del pasado con antelación. Asimismo, abarca el examen de las inconsistencias de información observadas en diferentes fuentes de información. Los datos de mercado se analizan y estiman utilizando modelos estadísticos y coherentes de mercado. Además, el análisis de la participación de mercado y el análisis de tendencias clave son los principales factores de éxito en el informe de mercado. Para obtener más información, solicite una llamada de un analista o envíe su consulta.
La metodología de investigación clave utilizada por el equipo de investigación de DBMR es la triangulación de datos, que implica la extracción de datos, el análisis del impacto de las variables de datos en el mercado y la validación primaria (experto en la industria). Los modelos de datos incluyen cuadrícula de posicionamiento de proveedores, análisis de línea de tiempo de mercado, descripción general y guía del mercado, cuadrícula de posicionamiento de la empresa, análisis de patentes, análisis de precios, análisis de participación de mercado de la empresa, estándares de medición, análisis global versus regional y de participación de proveedores. Para obtener más información sobre la metodología de investigación, envíe una consulta para hablar con nuestros expertos de la industria.
Personalización disponible
Data Bridge Market Research es líder en investigación formativa avanzada. Nos enorgullecemos de brindar servicios a nuestros clientes existentes y nuevos con datos y análisis que coinciden y se adaptan a sus objetivos. El informe se puede personalizar para incluir análisis de tendencias de precios de marcas objetivo, comprensión del mercado de países adicionales (solicite la lista de países), datos de resultados de ensayos clínicos, revisión de literatura, análisis de mercado renovado y base de productos. El análisis de mercado de competidores objetivo se puede analizar desde análisis basados en tecnología hasta estrategias de cartera de mercado. Podemos agregar tantos competidores sobre los que necesite datos en el formato y estilo de datos que esté buscando. Nuestro equipo de analistas también puede proporcionarle datos en archivos de Excel sin procesar, tablas dinámicas (libro de datos) o puede ayudarlo a crear presentaciones a partir de los conjuntos de datos disponibles en el informe.

