

Europe Abrasive Market
Tamaño del mercado en miles de millones de dólares
Tasa de crecimiento anual compuesta (CAGR) :
% 
 USD
8.51 Billion
USD
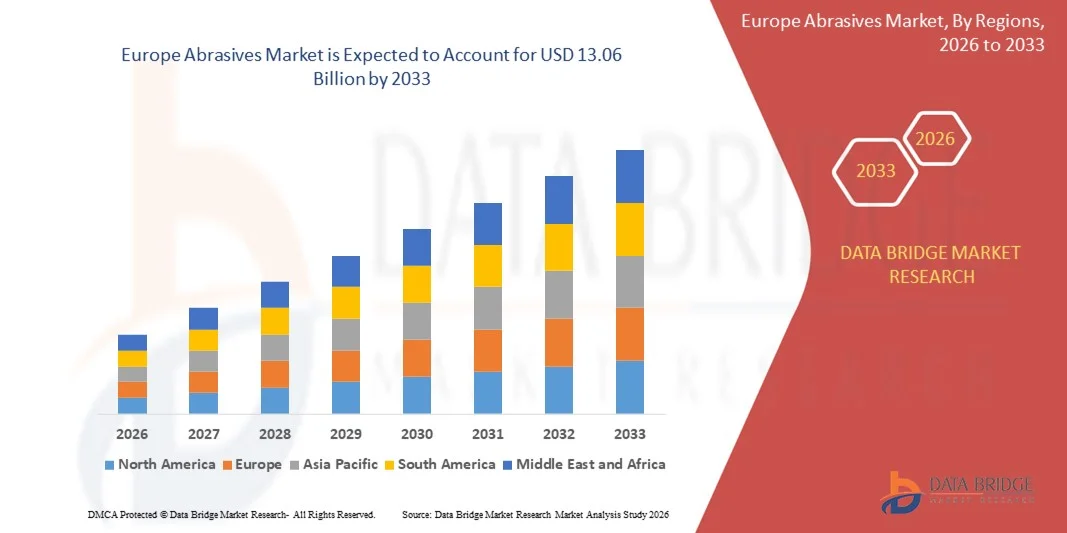
13.06 Billion
2025
2033
USD
8.51 Billion
USD
13.06 Billion
2025
2033
| 2026 –2033 | |
| USD 8.51 Billion | |
| USD 13.06 Billion | |
| % | |
|
Segmentación del mercado europeo de abrasivos por materias primas (naturales y sintéticas), tipo (abrasivo revestido, abrasivo aglomerado, superabrasivo y otros), producto (disco, copa, cilindro y otros), forma (bloque y polvo), aplicación (rectificado, corte, pulido, taladrado, acabado y otros), usuario final (automoción, maquinaria, aeroespacial y defensa, fabricación de metales, construcción, dispositivos médicos, petróleo y gas, electricidad y electrónica, entre otros): tendencias y pronóstico del sector hasta 2033.
Tamaño del mercado de abrasivos en Europa
- El tamaño del mercado de abrasivos de Europa se valoró en USD 8,51 mil millones en 2025 y se espera que alcance los USD 13,06 mil millones para 2033 , con una CAGR del 5,50% durante el período de pronóstico.
- El crecimiento del mercado está impulsado en gran medida por la creciente demanda de industrias como la automotriz, la fabricación de metales, la maquinaria, la construcción y la electrónica.
- Los avances tecnológicos en materiales abrasivos, como los superabrasivos y los abrasivos revestidos, están contribuyendo a mejorar la eficiencia y la productividad.
Análisis del mercado europeo de abrasivos
- El mercado está experimentando un fuerte impulso impulsado por la rápida industrialización, la expansión de las capacidades de producción y la creciente adopción de tecnologías avanzadas de acabado de superficies y mecanizado de precisión.
- Las crecientes inversiones en el desarrollo de infraestructura y actividades de construcción están impulsando la demanda de abrasivos en diversas aplicaciones.
- Alemania dominó el mercado europeo de abrasivos en 2025 gracias a su avanzada experiencia en ingeniería y a la sólida presencia de las industrias automotriz, de maquinaria y de fabricación de metales. El fuerte énfasis del país en la fabricación de precisión y el mecanizado de alto rendimiento impulsa la adopción generalizada de abrasivos recubiertos y aglomerados.
- Se espera que el Reino Unido sea testigo de la mayor tasa de crecimiento anual compuesta (CAGR) en el mercado de abrasivos de Europa debido a la creciente adopción de soluciones de mecanizado avanzadas, la creciente demanda de herramientas de acabado de superficies de alto rendimiento y la expansión de aplicaciones en la fabricación aeroespacial, automotriz e industrial.
- El segmento sintético obtuvo la mayor cuota de mercado en 2025 gracias a su mayor durabilidad, estructura de grano uniforme y rendimiento consistente en aplicaciones industriales de alta resistencia. Los abrasivos sintéticos son ampliamente preferidos en los entornos de mecanizado modernos debido a su superior eficiencia de corte y su idoneidad para procesos de precisión.
Alcance del informe y segmentación del mercado de abrasivos en Europa
|
Atributos |
Información clave del mercado de abrasivos europeos |
|
Segmentos cubiertos |
|
|
Países cubiertos |
Europa
|
|
Actores clave del mercado |
|
|
Oportunidades de mercado |
|
|
Conjuntos de información de datos de valor añadido |
Además de los conocimientos sobre escenarios de mercado como valor de mercado, tasa de crecimiento, segmentación, cobertura geográfica y actores principales, los informes de mercado seleccionados por Data Bridge Market Research también incluyen análisis de importación y exportación, descripción general de la capacidad de producción, análisis del consumo de producción, análisis de tendencias de precios, escenario de cambio climático, análisis de la cadena de suministro, análisis de la cadena de valor, descripción general de materias primas/consumibles, criterios de selección de proveedores, análisis PESTLE, análisis de Porter y marco regulatorio. |
Tendencias del mercado de abrasivos en Europa
Cambio hacia soluciones abrasivas de precisión y alto rendimiento
- La creciente demanda de acabados de precisión en sectores como la automoción, la aeroespacial y la fabricación en general está acelerando la adopción de productos abrasivos avanzados. Los abrasivos de alto rendimiento permiten una mayor eliminación de material, tolerancias más estrictas y una mejor calidad superficial, lo que los hace esenciales para los procesos de producción modernos. Este cambio también se debe a la necesidad de herramientas altamente fiables que mantengan la consistencia en operaciones complejas y a gran escala.
- El creciente uso de maquinaria automatizada de rectificado y pulido impulsa la necesidad de abrasivos de ingeniería que ofrezcan consistencia, durabilidad y una mayor eficiencia operativa. Estas soluciones ayudan a reducir el tiempo de inactividad y a mantener la calidad de la producción en entornos altamente automatizados, garantizando mínimas interrupciones del proceso. También mejoran el rendimiento de los sistemas robóticos y CNC modernos que exigen un comportamiento abrasivo uniforme.
- La creciente preferencia por los abrasivos recubiertos y superabrasivos está transformando los flujos de trabajo de fabricación, especialmente en tareas que requieren baja generación de calor y mínimo daño superficial. Su mayor vida útil y su mayor eficiencia de corte los hacen adecuados para aplicaciones de alta precisión que requieren un rendimiento estable durante ciclos prolongados. Estas propiedades ayudan a los fabricantes a reducir la frecuencia de cambio de herramientas y a mejorar el rendimiento de la producción.
- Por ejemplo, en 2023, varias plantas de fabricación informaron una mayor rentabilidad y precisión de mecanizado tras la adopción de bandas abrasivas con revestimiento cerámico para el acabado de precisión de componentes. Estas bandas proporcionaron mayor durabilidad y un acabado más uniforme en grandes ciclos de producción, lo que redujo las tasas de retrabajo. Su mayor resistencia al desgaste también minimizó los retrasos operativos y los costes de sustitución de herramientas.
- Si bien los abrasivos de alto rendimiento están transformando la producción, el progreso sostenido depende de la innovación continua de productos, la capacitación de los operadores y la optimización de costos. Los fabricantes deben priorizar soluciones específicas para cada aplicación a fin de satisfacer las cambiantes necesidades de la industria y garantizar la mejor adaptación a diversos entornos de mecanizado. La colaboración entre los fabricantes de abrasivos y los usuarios finales es cada vez más importante para el desarrollo de soluciones a medida.
Dinámica del mercado europeo de abrasivos
Impulsor
Creciente industrialización y expansión de las actividades de fabricación
- La expansión de las actividades de manufactura, metalmecánica y construcción está incrementando la demanda de abrasivos para operaciones de esmerilado, corte, pulido y acabado. A medida que aumenta la producción, las herramientas abrasivas se vuelven esenciales para mejorar la eficiencia y mantener la calidad del producto en diversos materiales. Esta tendencia se ve impulsada por la creciente adopción de técnicas avanzadas de mecanizado.
- Las industrias reconocen cada vez más los beneficios de los abrasivos avanzados para reducir el tiempo de mecanizado, prolongar la vida útil de los equipos y garantizar resultados de acabado consistentes. Esta concienciación impulsa una mayor adopción en unidades de producción pequeñas, medianas y grandes que buscan una mayor eficiencia operativa. La fiabilidad de los abrasivos premium también reduce el riesgo de variabilidad en la producción.
- El desarrollo industrial favorable, las mejoras tecnológicas y las inversiones en procesos de fabricación modernos impulsan aún más la necesidad de productos abrasivos fiables. El creciente uso de máquinas CNC y herramientas de mecanizado de precisión refuerza la demanda de abrasivos compatibles con operaciones de alta velocidad. La integración de sistemas de fabricación digital también contribuye a un uso más preciso de los abrasivos.
- Por ejemplo, en 2022, varias plantas de fabricación informaron una mayor productividad tras integrar abrasivos aglomerados y recubiertos de alto rendimiento en sus procesos de mecanizado, lo que mejoró la producción sin necesidad de realizar modificaciones importantes en los equipos. Estas mejoras ayudaron a optimizar las operaciones y a reducir los costes totales de mecanizado. Las plantas también observaron un mejor rendimiento de las herramientas y una reducción de los requisitos de mantenimiento.
- Si bien el crecimiento industrial impulsa el mercado, la consistencia en los estándares de calidad, el soporte técnico y una mayor disponibilidad de abrasivos avanzados siguen siendo esenciales para su adopción a largo plazo. Los fabricantes también deben abordar las crecientes expectativas en torno a la eficiencia operativa y la sostenibilidad. Garantizar la fiabilidad del producto es clave para generar confianza entre los usuarios finales.
Restricción/Desafío
Precios fluctuantes de las materias primas y costos de cumplimiento ambiental
- Los productores de abrasivos se enfrentan a desafíos debido a las fluctuaciones en los precios de materias primas como el óxido de aluminio, el carburo de silicio, la alúmina de zirconio y los diamantes sintéticos. Estas variaciones afectan los costos generales de fabricación e influyen en el precio de los productos para los usuarios finales, especialmente en sectores sensibles a los costos. Gestionar estas fluctuaciones requiere un abastecimiento estratégico y una planificación eficiente de la producción.
- El cumplimiento de estrictas normativas ambientales, de seguridad laboral y de gestión de residuos incrementa los gastos operativos de los fabricantes de abrasivos. Los pequeños productores suelen tener dificultades para cumplir estas normas, lo que limita su competitividad y su capacidad de escalar operaciones. Estos requisitos también impulsan a las empresas a adoptar tecnologías de producción más limpias y sostenibles.
- Las inconsistencias en la cadena de suministro y el acceso variable a materias primas clave contribuyen a retrasos en la producción, lo que afecta la disponibilidad y la fiabilidad del producto. Estas interrupciones pueden dificultar la penetración en el mercado, especialmente para productos abrasivos especializados que requieren una calidad constante del material. Garantizar la estabilidad de las materias primas se está convirtiendo en una prioridad para los fabricantes.
- Por ejemplo, en 2023, varios productores de abrasivos informaron un aumento en los gastos de producción debido al aumento de los costos energéticos y a requisitos de cumplimiento más estrictos, lo que afectó la asequibilidad de las soluciones abrasivas premium. Este aumento de costos también influyó en los plazos de desarrollo de productos y las estrategias de precios del mercado. Muchas empresas expresaron su preocupación por la sostenibilidad de los costos a largo plazo.
- Si bien persisten los desafíos regulatorios y de costos, mejorar la resiliencia de la cadena de suministro, promover prácticas de producción sostenibles y optimizar el uso de materias primas son fundamentales para impulsar el potencial de crecimiento a largo plazo. Las empresas también deben invertir en innovación para desarrollar alternativas rentables sin comprometer el rendimiento. La planificación estratégica será esencial para mantener la competitividad en un entorno de mercado desafiante.
Panorama del mercado europeo de abrasivos
El mercado está segmentado en función de las materias primas, el tipo, el producto, la forma, la aplicación y el usuario final.
- Por materias primas
En función de las materias primas, el mercado europeo de abrasivos se segmenta en naturales y sintéticos. El segmento sintético tuvo la mayor cuota de mercado en 2025, impulsado por su mayor durabilidad, estructura de grano uniforme y rendimiento constante en aplicaciones industriales de alta resistencia. Los abrasivos sintéticos son ampliamente preferidos en los entornos de mecanizado modernos debido a su superior eficiencia de corte e idoneidad para procesos de precisión
Se prevé que el segmento natural experimente un crecimiento sostenido entre 2026 y 2033, impulsado por el creciente uso de materiales abrasivos ecológicos y rentables para tareas de acabado de ligeras a medias. Los abrasivos naturales están ganando terreno entre las industrias que buscan alternativas sostenibles que ofrezcan un rendimiento adecuado para aplicaciones no críticas.
- Por tipo
Según el tipo, el mercado europeo de abrasivos se segmenta en abrasivos revestidos, abrasivos aglomerados, superabrasivos, entre otros. El segmento de abrasivos aglomerados registró la mayor cuota de mercado en 2025 debido a su amplio uso en rectificado, corte y eliminación de material pesado en operaciones de fabricación y metalurgia. Su resistencia estructural y larga vida útil lo convierten en la opción preferida para aplicaciones de alta carga.
Se prevé que el segmento de superabrasivos experimente el mayor crecimiento entre 2026 y 2033, impulsado por la creciente demanda de mecanizado de precisión en sectores como el aeroespacial, el automotriz y el electrónico. Los superabrasivos como el diamante y el CBN ofrecen dureza, estabilidad térmica y precisión superiores, lo que los hace ideales para procesos de alta tolerancia.
- Por producto
Según el producto, el mercado europeo de abrasivos se segmenta en discos, copas, cilindros y otros. El segmento de discos dominó el mercado en 2025 debido a su uso generalizado en la fabricación de metales, la carpintería y las tareas de preparación de superficies. Los abrasivos de disco ofrecen versatilidad, facilidad de instalación y compatibilidad con diversas herramientas portátiles y automatizadas
Se prevé que el segmento de cilindros experimente el mayor crecimiento entre 2026 y 2033, impulsado por una creciente adopción en aplicaciones que requieren una eliminación uniforme de material y el acabado de superficies internas. Su forma cilíndrica proporciona un control y una estabilidad superiores, lo que los hace adecuados para operaciones industriales de rectificado y desbarbado.
- Por forma
En función de la forma, el mercado europeo de abrasivos se segmenta en forma de bloque y en forma de polvo. El segmento de forma de bloque tuvo la mayor participación en los ingresos del mercado en 2025, impulsado por su alta demanda en aplicaciones de pulido, afilado y acabado manual. Los abrasivos en bloque son valorados por su longevidad, facilidad de manejo e idoneidad tanto para entornos industriales como de taller
Se prevé un crecimiento sustancial del segmento de abrasivos en polvo entre 2026 y 2033, impulsado por su creciente uso en procesos de lapeado, microacabado y pulido de precisión. Los abrasivos en polvo ofrecen un control excepcional sobre la distribución del tamaño del grano, lo que permite el acabado fino necesario en electrónica, óptica y fabricación avanzada.
- Por aplicación
Según la aplicación, el mercado europeo de abrasivos se segmenta en rectificado, corte, pulido, taladrado, acabado y otros. El segmento de rectificado tuvo la mayor cuota de mercado en 2025 debido a su papel central en el modelado de materiales, la preparación de superficies y la eliminación de material pesado en las industrias manufactureras. Los abrasivos de rectificado son esenciales para lograr precisión dimensional y superficies lisas
Se prevé un fuerte crecimiento del segmento de pulido entre 2026 y 2033, impulsado por la creciente demanda de acabados superficiales de alta calidad en la industria automotriz, electrónica y bienes de consumo. Los abrasivos de pulido mejoran el atractivo estético y el rendimiento funcional, lo que los hace cruciales en los procesos de fabricación de la etapa final.
- Por el usuario final
En cuanto al usuario final, el mercado europeo de abrasivos se segmenta en los sectores de automoción, maquinaria, aeroespacial y defensa, fabricación de metales, construcción, dispositivos médicos, petróleo y gas, electricidad y electrónica, entre otros. El segmento de fabricación de metales captó la mayor cuota de mercado en 2025, impulsado por el amplio uso de abrasivos en soldadura, corte, rectificado y preparación de superficies. Los abrasivos desempeñan un papel fundamental en la mejora de la eficiencia de la producción y el mantenimiento de la calidad estructural.
Se prevé un crecimiento significativo del segmento automotriz entre 2026 y 2033, impulsado por la creciente demanda de componentes de precisión, materiales ligeros y estándares de acabado superiores en la fabricación de vehículos. Los abrasivos avanzados facilitan el mecanizado de alta precisión, la preparación de pintura y la corrección de superficies, lo que los hace indispensables en la producción automotriz.
Análisis regional del mercado europeo de abrasivos
- Alemania dominó el mercado europeo de abrasivos en 2025 gracias a su avanzada experiencia en ingeniería y a la sólida presencia de las industrias automotriz, de maquinaria y de fabricación de metales. El fuerte énfasis del país en la fabricación de precisión y el mecanizado de alto rendimiento impulsa la adopción generalizada de abrasivos recubiertos y aglomerados.
- La demanda de herramientas de rectificado, pulido y corte de alta calidad se ve impulsada por el ecosistema alemán de producción automotriz y construcción de maquinaria de primer nivel. Los usuarios industriales recurren cada vez más a soluciones abrasivas duraderas y de alta tolerancia para respaldar operaciones de fabricación complejas.
- La sólida capacidad de I+D de Alemania y su fuerte énfasis en la innovación tecnológica permiten el desarrollo de materiales abrasivos avanzados. La presencia de fabricantes líderes mundiales de abrasivos impulsa la innovación continua de productos y la optimización del rendimiento.
Perspectivas del mercado de abrasivos del Reino Unido
Se prevé que el mercado británico de abrasivos experimente el mayor crecimiento en toda Europa entre 2026 y 2033, impulsado por el aumento de las inversiones en los sectores aeroespacial, de dispositivos médicos y de mecanizado de precisión. Las empresas priorizan las soluciones abrasivas de alta eficiencia para mejorar la productividad y satisfacer los requisitos avanzados de acabado de superficies. El crecimiento de las actividades de renovación y desarrollo de infraestructuras impulsa aún más el uso de abrasivos recubiertos y aglomerados. Además, la creciente adopción de tecnologías de fabricación modernas y prácticas de fabricación sostenibles contribuye significativamente a la rápida expansión del mercado de abrasivos en el Reino Unido.
Cuota de mercado de abrasivos en Europa
La industria europea de abrasivos está liderada principalmente por empresas bien establecidas, entre las que se incluyen:
• Saint-Gobain Abrasives / Norton (Francia)
• Tyrolit Schleifmittelwerke Swarovski (Austria)
• Klingspor AG (Alemania)
• Hermes Schleifmittel GmbH (Alemania)
• VSM AG (Alemania)
• Winoa (Francia)
• PFERD-Werkzeuge / August Rüggeberg GmbH & Co. KG (Alemania)
• Imerys Fused Minerals (Francia)
• RHODIUS Abrasives (Alemania)
• SAIT Abrasivi SpA (Italia)
SKU-
Obtenga acceso en línea al informe sobre la primera nube de inteligencia de mercado del mundo

- Panel de análisis de datos interactivo
- Panel de análisis de empresas para oportunidades con alto potencial de crecimiento
- Acceso de analista de investigación para personalización y consultas
- Análisis de la competencia con panel interactivo
- Últimas noticias, actualizaciones y análisis de tendencias
- Aproveche el poder del análisis de referencia para un seguimiento integral de la competencia
Metodología de investigación
La recopilación de datos y el análisis del año base se realizan utilizando módulos de recopilación de datos con muestras de gran tamaño. La etapa incluye la obtención de información de mercado o datos relacionados a través de varias fuentes y estrategias. Incluye el examen y la planificación de todos los datos adquiridos del pasado con antelación. Asimismo, abarca el examen de las inconsistencias de información observadas en diferentes fuentes de información. Los datos de mercado se analizan y estiman utilizando modelos estadísticos y coherentes de mercado. Además, el análisis de la participación de mercado y el análisis de tendencias clave son los principales factores de éxito en el informe de mercado. Para obtener más información, solicite una llamada de un analista o envíe su consulta.
La metodología de investigación clave utilizada por el equipo de investigación de DBMR es la triangulación de datos, que implica la extracción de datos, el análisis del impacto de las variables de datos en el mercado y la validación primaria (experto en la industria). Los modelos de datos incluyen cuadrícula de posicionamiento de proveedores, análisis de línea de tiempo de mercado, descripción general y guía del mercado, cuadrícula de posicionamiento de la empresa, análisis de patentes, análisis de precios, análisis de participación de mercado de la empresa, estándares de medición, análisis global versus regional y de participación de proveedores. Para obtener más información sobre la metodología de investigación, envíe una consulta para hablar con nuestros expertos de la industria.
Personalización disponible
Data Bridge Market Research es líder en investigación formativa avanzada. Nos enorgullecemos de brindar servicios a nuestros clientes existentes y nuevos con datos y análisis que coinciden y se adaptan a sus objetivos. El informe se puede personalizar para incluir análisis de tendencias de precios de marcas objetivo, comprensión del mercado de países adicionales (solicite la lista de países), datos de resultados de ensayos clínicos, revisión de literatura, análisis de mercado renovado y base de productos. El análisis de mercado de competidores objetivo se puede analizar desde análisis basados en tecnología hasta estrategias de cartera de mercado. Podemos agregar tantos competidores sobre los que necesite datos en el formato y estilo de datos que esté buscando. Nuestro equipo de analistas también puede proporcionarle datos en archivos de Excel sin procesar, tablas dinámicas (libro de datos) o puede ayudarlo a crear presentaciones a partir de los conjuntos de datos disponibles en el informe.

