

Mercado de pellets de madera de Asia y el Pacífico, por grado (pellet de madera estándar, pellet de madera para uso general y pellet de madera premium), sabores (pellets de madera Traeger Signature, pellets de madera de nogal, pellets de madera de pecán, pellets de madera de manzano, pellets de madera de cerezo y pellets de madera de mezquite), aplicación (calefacción residencial, centrales eléctricas, calefacción comercial, cogeneración y lecho para animales): tendencias de la industria y pronóstico hasta 2030.
Análisis y perspectivas del mercado de pellets de madera en Asia y el Pacífico
Los pellets de madera son partículas de madera comprimidas fabricadas principalmente a partir de desechos de madera y residuos agrícolas como la paja. En comparación con la biomasa sin procesar, son densos, tienen un bajo contenido de humedad y cenizas y un alto contenido energético. Además, los palets de madera se utilizan ampliamente en los sectores residencial y comercial para cocinar, asar a la parrilla y suministrar calor debido a su bajo costo y bajo mantenimiento. También se utilizan en cadenas de suministro de biomasa a gran escala para ayudar a reducir los costos de almacenamiento, manipulación y transporte de biomasa.
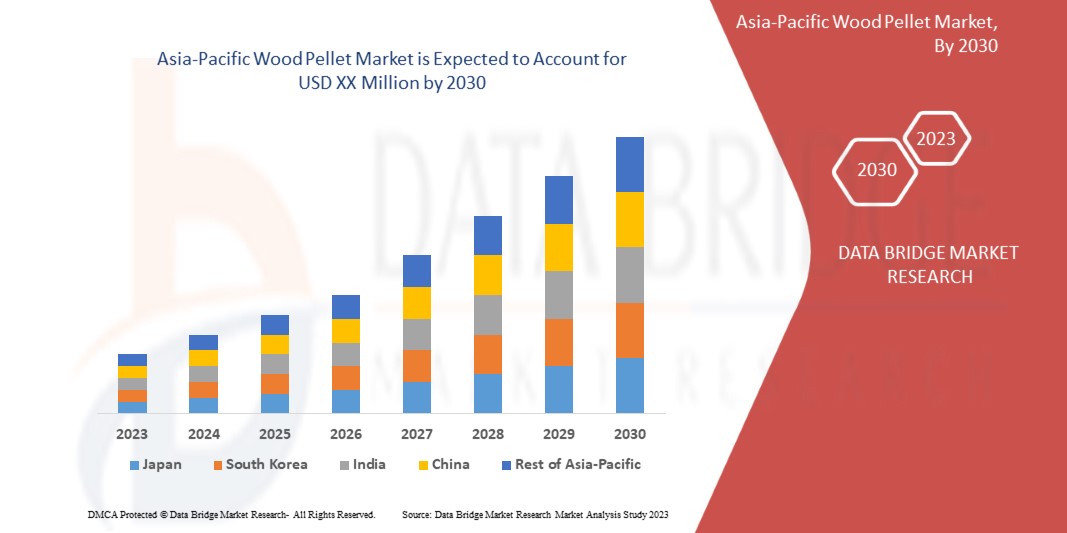
El aumento de la popularidad de los pellets de madera como portador de energía tiene un impacto proposicional en el crecimiento y la adopción de pellets de madera. Además, se espera que el aumento de la demanda de combustible sostenible en todo el mundo impulse el crecimiento del mercado. Data Bridge Market Research analiza que el mercado de pellets de madera de Asia-Pacífico crecerá a una CAGR del 6,7 % durante el período de pronóstico de 2023 a 2030.
|
Métrica del informe |
Detalles |
|
Período de pronóstico |
2023 a 2030 |
|
Año base |
2022 |
|
Año histórico |
2021 (Personalizable para 2020-2015) |
|
Unidades cuantitativas |
Ingresos en millones de USD, volúmenes en toneladas |
|
Segmentos cubiertos |
Por grado (pellets de madera estándar, pellets de madera para uso general y pellets de madera de primera calidad), sabores (pellets de madera Traeger Signature, pellets de madera de nogal, pellets de madera de pecán, pellets de madera de manzano, pellets de madera de cerezo y pellets de madera de mezquite), aplicación (calefacción residencial, centrales eléctricas, calefacción comercial, cogeneración y lecho para animales) |
|
Países cubiertos |
China, Japón, Corea del Sur, India, Australia y Nueva Zelanda, Tailandia, Indonesia, Malasia, Filipinas, Singapur y el resto de Asia-Pacífico. |
|
Actores del mercado cubiertos |
Entre otros, se encuentran AVPGroup, Drax Group plc, Energex, Enviva Inc., Erdenwerk Gregor Ziegler GmbH, German Pellets, Graanul Invest, Holzwerke Weinzierl GmbH, Land Energy, Lignetics, Mallard Creek Inc, Midland Bio Energy, Nugreen Energy, Royal Wood Shavings, RZ Pellets GmbH, Schwaiger Holzindustrie GmbH & Co. KG, Sinclar Group Forest Products, TANAC, Valfei Products Inc. y Wilhelm Hoyer GmbH & Co. KG. |
Definición de mercado
Los pellets de madera son partículas de madera comprimidas fabricadas principalmente a partir de desechos de madera y residuos agrícolas como la paja. En comparación con la biomasa sin procesar, son densos, tienen un bajo contenido de humedad y cenizas y un alto contenido energético. Además, los palets de madera se utilizan ampliamente en los sectores residencial y comercial para cocinar, asar a la parrilla y suministrar calor debido a su bajo costo y bajo mantenimiento. También se utilizan en cadenas de suministro de biomasa a gran escala para ayudar a reducir los costos de almacenamiento, manipulación y transporte de biomasa.
Dinámica del mercado de pellets de madera en Asia y el Pacífico
En esta sección se aborda la comprensión de los factores impulsores, las ventajas, las oportunidades, las limitaciones y los desafíos del mercado. Todo esto se analiza en detalle a continuación:
CONDUCTORES
-
El aumento de la demanda de combustible sostenible en todo el mundo
Los combustibles sostenibles se producen a partir de materias primas renovables o alternativas, como plantas, vegetales o desechos industriales. Incluyen biocombustibles como el aceite vegetal hidrotratado (HVO), el bioetanol y los combustibles sintéticos (synfuels) como el amoníaco o el metanol . Estos combustibles ayudarán a alcanzar los ambiciosos objetivos de descarbonización y se proyecta que sean más costosos que las alternativas en el largo plazo, utilizando diésel 100% renovable.
-
Aumento de la popularidad de los pellets de madera como portador de energía
Los pellets de madera son un combustible de biomasa sólida producido a partir de residuos de madera y subproductos agrícolas. Sin embargo, los combustibles bioenergéticos son una de las energías renovables más importantes y están ganando una enorme demanda en Asia-Pacífico. Estos combustibles incluyen biogás, desechos sólidos, madera, productos agrícolas, etanol y biodiésel.
OPORTUNIDAD
-
La necesidad de sustituir los combustibles fósiles
A nivel mundial, la demanda de combustibles fósiles está aumentando debido al aumento de las necesidades energéticas. Los combustibles fósiles son recursos no renovables en los que la energía almacenada se libera mediante la combustión, como el carbón, el gas natural y el petróleo, y representan casi el 80% de la energía utilizada en todo el mundo. Por lo tanto, la sustitución de los combustibles fósiles puede actuar como una oportunidad para el crecimiento del mercado.
RESTRICCIÓN/DESAFÍO
- Disponibilidad de fuentes de energía y combustibles alternativos en el mercado
Los pellets de madera son un producto renovable que comprime desechos de madera, hierbas, paja, tallos de maíz e incluso papel y cartón en formas densas similares a pellets. Sin embargo, se ha comprobado que estos pellets son sostenibles y emiten bajas emisiones en comparación con sus combustibles, pero existen otras alternativas a estos pellets de madera, que pueden denominarse energía renovable. Esto puede actuar como un factor restrictivo para el crecimiento del mercado.
Impacto post-Covid-19 en el mercado de pellets de madera de Asia-Pacífico
La COVID-19 ha afectado negativamente al mercado, ya que los pellets de madera tenían una gran demanda antes de la pandemia. Empresas como Drax Group plc, Enviva Inc., Energex, Sinclar Group Forest Products y otras se enfrentaron a dificultades absolutas para proporcionar pellets de madera a nuevos y antiguos clientes debido a la escasez de materias primas. Esto se debió a las estrictas regulaciones impuestas por el gobierno. Además, la oferta limitada de materias primas afectó significativamente la oferta de pellets de madera en el mercado.
Acontecimientos recientes
- En enero de 2023, Graanul Invest anunció que la empresa había exportado el mayor envío de pellets de madera de 50.042 toneladas en EE. UU.
- En agosto de 2022, Drax Group plc anunció la adquisición de una planta de pellets en Princeton, Columbia Británica, Canadá. Esta adquisición ayudará a la empresa a producir 90.000 toneladas de pellets de madera al año.
Panorama del mercado de pellets de madera en Asia y el Pacífico
El mercado de pellets de madera de Asia-Pacífico se divide en tres segmentos importantes según el grado, los sabores y la aplicación. El crecimiento entre estos segmentos le ayudará a analizar los segmentos de crecimiento reducido de las industrias y brindará a los usuarios una valiosa descripción general del mercado y conocimientos del mercado para ayudarlos a tomar decisiones estratégicas para identificar las principales aplicaciones del mercado.
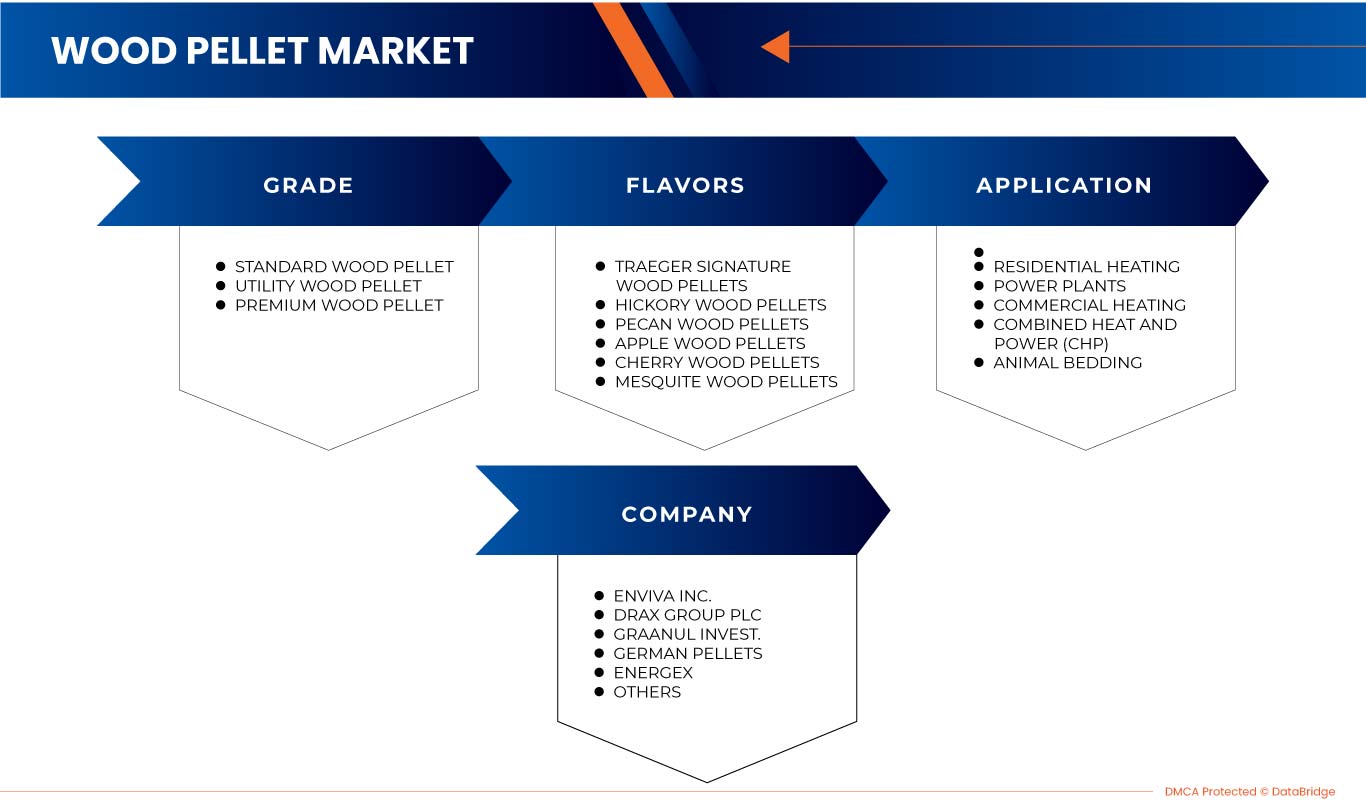
Calificación
- Pellets de madera estándar
- Pellets de madera para uso general
- Pellets de madera de primera calidad
Según el producto, el mercado está segmentado en pellets de madera estándar, pellets de madera para uso general y pellets de madera de primera calidad.
Sabores
- Pellets de madera Traeger Signature
- Pellets de madera de nogal
- Pellets de madera de pecán
- Pellets de madera de manzano
- Pellets de madera de cerezo
- Pellets de madera de mezquite
Según los sabores, el mercado está segmentado en pellets de madera exclusivos de Traeger, pellets de madera de nogal, pellets de madera de pecán, pellets de madera de manzano, pellets de madera de cerezo y pellets de madera de mezquite.
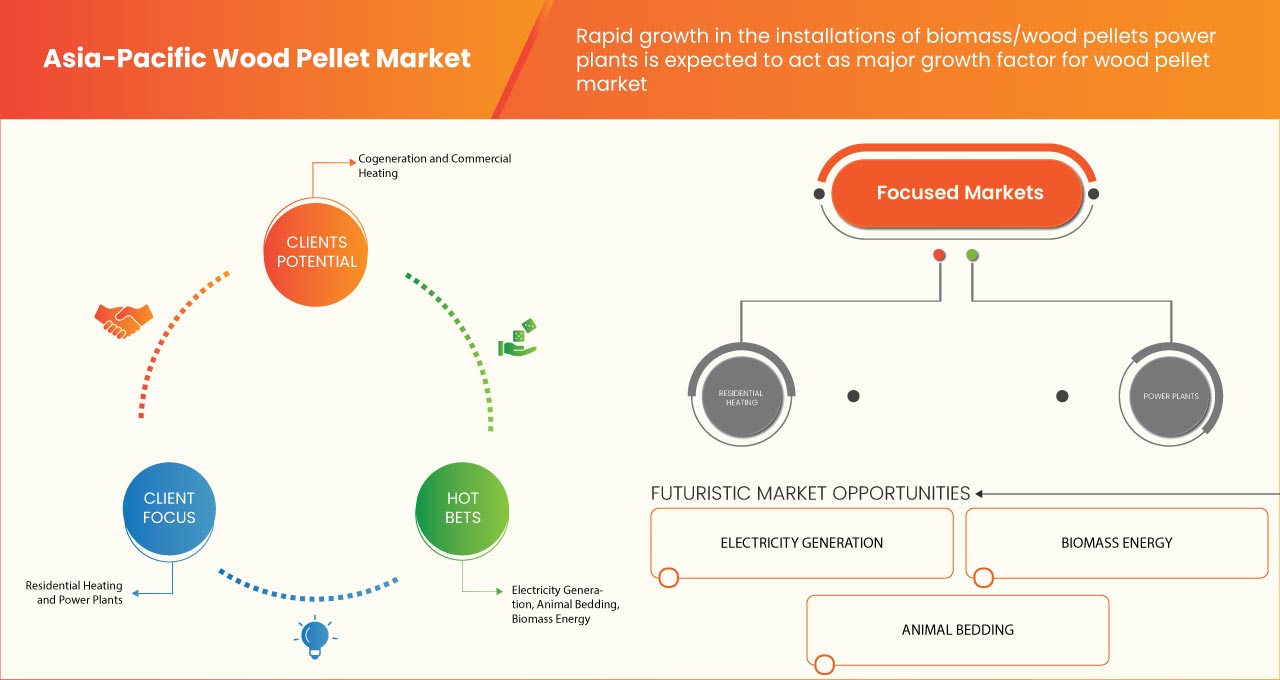
Solicitud
- Calefacción residencial
- Centrales eléctricas
- Calefacción comercial
- Producción combinada de calor y electricidad (CHP)
- Ropa de cama para animales
Según la aplicación, el mercado está segmentado en calefacción residencial, plantas de energía, calefacción comercial, calor y energía combinados (CHP) y camas para animales.
Análisis y perspectivas regionales del mercado de pellets de madera en Asia y el Pacífico
Se analiza el mercado de pellets de madera de Asia-Pacífico y se proporcionan información y tendencias del tamaño del mercado por grado, sabores y aplicación.
Los países cubiertos en este informe de mercado son China, Japón, Corea del Sur, India, Australia y Nueva Zelanda, Tailandia, Indonesia, Malasia, Filipinas, Singapur y el resto de Asia-Pacífico.
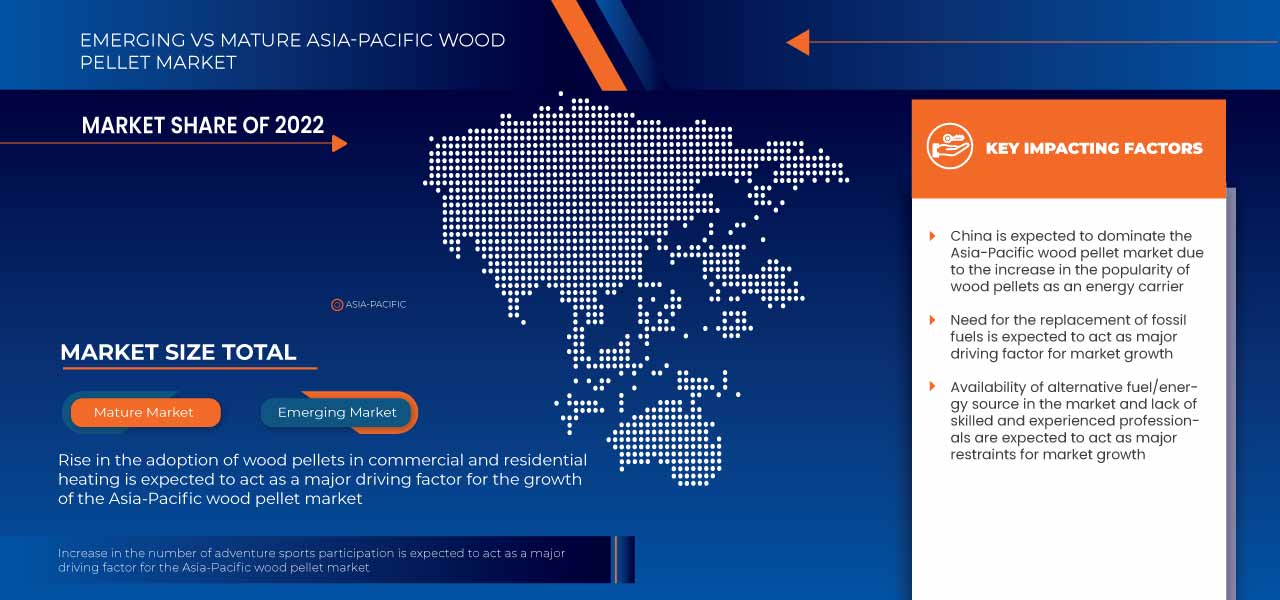
China está dominando el mercado de pellets de madera de Asia y el Pacífico debido al aumento de la popularidad de los pellets de madera como portador de energía.
La sección de países del informe también proporciona factores individuales que impactan en el mercado y cambios en las regulaciones en el mercado a nivel nacional que afectan las tendencias actuales y futuras del mercado. Los puntos de datos como nuevas ventas, ventas de reemplazo, demografía del país, epidemiología de enfermedades y aranceles de importación y exportación son algunos de los principales indicadores utilizados para pronosticar el escenario del mercado para países individuales. Además, la presencia y disponibilidad de marcas de Asia-Pacífico y sus desafíos enfrentados debido a la competencia grande o escasa de las marcas locales y nacionales, y el impacto de los canales de venta se consideran al proporcionar un análisis de pronóstico de los datos del país.
Análisis del panorama competitivo y de la cuota de mercado de pellets de madera en Asia-Pacífico
El panorama competitivo del mercado de pellets de madera de Asia-Pacífico proporciona detalles de los competidores. Los detalles incluidos son una descripción general de la empresa, las finanzas de la empresa, los ingresos generados, el potencial de mercado, la inversión en I+D, las nuevas iniciativas de mercado, la presencia en Asia-Pacífico, los sitios e instalaciones de producción, las capacidades de producción, las fortalezas y debilidades de la empresa, el lanzamiento de soluciones, la amplitud y variedad de productos y el dominio de las aplicaciones. Los puntos de datos anteriores proporcionados solo están relacionados con el enfoque de las empresas en relación con el mercado.
Algunos de los principales actores que operan en el mercado de pellets de madera de Asia y el Pacífico son AVPGroup, Drax Group plc, Energex, Enviva Inc., Erdenwerk Gregor Ziegler GmbH, German Pellets, Graanul Invest, Holzwerke Weinzierl GmbH, Land Energy, Lignetics, Mallard Creek Inc, Midland Bio Energy, Nugreen Energy, Royal Wood Shavings, RZ Pellets GmbH, Schwaiger Holzindustrie GmbH & Co. KG, Sinclar Group Forest Products, TANAC, Valfei Products Inc. y Wilhelm Hoyer GmbH & Co. KG, entre otros.
SKU-
Obtenga acceso en línea al informe sobre la primera nube de inteligencia de mercado del mundo

- Panel de análisis de datos interactivo
- Panel de análisis de empresas para oportunidades con alto potencial de crecimiento
- Acceso de analista de investigación para personalización y consultas
- Análisis de la competencia con panel interactivo
- Últimas noticias, actualizaciones y análisis de tendencias
- Aproveche el poder del análisis de referencia para un seguimiento integral de la competencia
Tabla de contenido
1 INTRODUCTION
1.1 OBJECTIVES OF THE STUDY
1.2 MARKET DEFINITION
1.3 OVERVIEW OF ASIA PACIFIC WOOD PELLET MARKET
1.4 CURRENCY AND PRICING
1.5 LIMITATIONS
1.6 MARKETS COVERED
2 MARKET SEGMENTATION
2.1 MARKETS COVERED
2.2 GEOGRAPHICAL SCOPE
2.3 YEARS CONSIDERED FOR THE STUDY
2.4 DBMR TRIPOD DATA VALIDATION MODEL
2.5 PRIMARY INTERVIEWS WITH KEY OPINION LEADERS
2.6 DBMR MARKET POSITION GRID
2.7 VENDOR SHARE ANALYSIS
2.8 MULTIVARIATE MODELING
2.9 MARKET APPLICATION COVERAGE GRID
2.1 GRADE TIMELINE CURVE
2.11 SECONDARY SOURCES
2.12 ASSUMPTIONS
3 EXECUTIVE SUMMARY
4 PREMIUM INSIGHTS
4.1 PORTER’S FIVE FORCES
4.2 PESTEL ANALYSIS
4.2.1 POLITICAL FACTORS
4.2.2 ECONOMIC FACTORS
4.2.3 SOCIAL FACTORS
4.2.4 LEGAL FACTORS
4.2.5 TECHNOLOGICAL FACTORS
4.2.6 ENVIRONMENTAL FACTORS
4.3 CLIMATE CHANGE SCENARIO
4.4 VENDOR SELECTION CRITERIA
4.5 TECHNOLOGICAL ADVANCEMENTS FOR WOOD PELLET
4.6 IMPORT-EXPORT SCENARIO
4.7 SUPPLY CHAIN ANALYSIS
4.8 RAW MATERIAL COVERAGE
4.9 REGULATION COVERAGE
5 MARKET OVERVIEW
5.1 DRIVERS
5.1.1 RISE IN DEMAND FOR SUSTAINABLE FUEL ACROSS THE GLOBE
5.1.2 INCREASE IN THE POPULARITY OF WOOD PELLETS AS AN ENERGY CARRIER
5.1.3 RISE IN THE ADOPTION OF WOOD PELLETS IN COMMERCIAL AND RESIDENTIAL HEATING
5.1.4 RAPID GROWTH IN THE INSTALLATIONS OF BIOMASS/WOOD PELLETS POWER PLANTS
5.2 RESTRAINTS
5.2.1 AVAILABILITY OF ALTERNATIVE FUEL/ENERGY SOURCES IN THE MARKET
5.2.2 THE MANUFACTURING PROCESS IS PRONE TO CAUSE SEVERE HEALTH ISSUES
5.3 OPPORTUNITIES
5.3.1 NEED FOR THE REPLACEMENT OF FOSSIL FUELS
5.3.2 GOVERNMENT INITIATIVES SUPPORTING SUSTAINABLE ENERGY
5.4 CHALLENGES
5.4.1 LACK OF AWARENESS AMONG THE PROFESSIONALS
5.4.2 REQUIREMENT OF SOPHISTICATED PROCESS FOR USAGE COMPARED TO FIREWOOD
6 ASIA PACIFIC WOOD PELLET MARKET, BY APPLICATION
6.1 OVERVIEW
6.2 RESIDENTIAL HEATING
6.2.1 RESIDENTIAL HEATING, BY GRADE
6.2.1.1 STANDARD WOOD PELLET
6.2.1.2 UTILITY WOOD PELLET
6.2.1.3 PREMIUM WOOD PELLET
6.3 POWER PLANTS
6.3.1 POWER PLANTS, BY GRADE
6.3.1.1 STANDARD WOOD PELLET
6.3.1.2 UTILITY WOOD PELLET
6.3.1.3 PREMIUM WOOD PELLET
6.4 COMMERCIAL HEATING
6.4.1 COMMERCIAL HEATING, BY GRADE
6.4.1.1 STANDARD WOOD PELLET
6.4.1.2 UTILITY WOOD PELLET
6.4.1.3 PREMIUM WOOD PELLET
6.5 COMBINED HEAT AND POWER (CHP)
6.5.1 COMBINED HEAT AND POWER (CHP), BY GRADE
6.5.1.1 STANDARD WOOD PELLET
6.5.1.2 UTILITY WOOD PELLET
6.5.1.3 PREMIUM WOOD PELLET
6.6 ANIMAL BEDDING
6.6.1 ANIMAL BEDDING, BY GRADE
6.6.1.1 STANDARD WOOD PELLET
6.6.1.2 UTILITY WOOD PELLET
6.6.1.3 PREMIUM WOOD PELLET
7 ASIA PACIFIC WOOD PELLET MARKET, BY GRADE
7.1 OVERVIEW
7.2 STANDARD WOOD PELLET
7.3 UTILITY WOOD PELLET
7.4 PREMIUM WOOD PELLET
8 ASIA PACIFIC WOOD PELLET MARKET, BY FLAVORS
8.1 OVERVIEW
8.2 TRAEGER SIGNATURE WOOD PELLETS
8.3 HICKORY WOOD PELLETS
8.4 PECAN WOOD PELLETS
8.5 APPLE WOOD PELLETS
8.6 CHERRY WOOD PELLETS
8.7 MESQUITE WOOD PELLETS
9 ASIA PACIFIC WOOD PELLET MARKET, BY REGION
9.1 ASIA-PACIFIC
9.1.1 CHINA
9.1.2 JAPAN
9.1.3 SOUTH KOREA
9.1.4 INDIA
9.1.5 INDONESIA
9.1.6 AUSTRALIA & NEW ZEALAND
9.1.7 THAILAND
9.1.8 MALAYSIA
9.1.9 SINGAPORE
9.1.10 PHILIPPINES
9.1.11 REST OF ASIA-PACIFIC
10 ASIA PACIFIC WOOD PELLET MARKET, COMPANY LANDSCAPE
10.1 COMPANY SHARE ANALYSIS: ASIA PACIFIC
11 SWOT ANALYSIS
12 COMPANY PROFILE
12.1 ENVIVA INC. INC.
12.1.1 COMPANY SNAPSHOT
12.1.2 REVENUE ANALYSIS
12.1.3 COMPANY SHARE ANALYSIS
12.1.4 PRODUCT PORTFOLIO
12.1.5 RECENT DEVELOPMENTS
12.2 DRAX GROUP PLC GROUP PLC
12.2.1 COMPANY SNAPSHOT
12.2.2 REVENUE ANALYSIS
12.2.3 COMPANY SHARE ANALYSIS
12.2.4 PRODUCT PORTFOLIO
12.2.5 RECENT DEVELOPMENTS
12.3 GRAANUL INVEST
12.3.1 COMPANY SNAPSHOT
12.3.2 COMPANY SHARE ANALYSIS
12.3.3 PRODUCT PORTFOLIO
12.3.4 RECENT DEVELOPMENTS
12.4 GERMAN PELLETS
12.4.1 COMPANY SNAPSHOT
12.4.2 COMPANY SHARE ANALYSIS
12.4.3 PRODUCT PORTFOLIO
12.4.4 RECENT DEVELOPMENT
12.5 ENERGEX
12.5.1 COMPANY SNAPSHOT
12.5.2 COMPANY SHARE ANALYSIS
12.5.3 PRODUCT PORTFOLIO
12.5.4 RECENT DEVELOPMENT
12.6 AVPGROUP
12.6.1 COMPANY SNAPSHOT
12.6.2 PRODUCT PORTFOLIO
12.6.3 RECENT DEVELOPMENT
12.7 ERDENWERK GREGOR ZIEGLER GMBH
12.7.1 COMPANY SNAPSHOT
12.7.2 PRODUCT PORTFOLIO
12.7.3 RECENT DEVELOPMENTS
12.8 HOLZWERKE WEINZIERL GMBH
12.8.1 COMPANY SNAPSHOT
12.8.2 PRODUCT PORTFOLIO
12.8.3 RECENT DEVELOPMENT
12.9 LAND ENERGY
12.9.1 COMPANY SNAPSHOT
12.9.2 PRODUCT PORTFOLIO
12.9.3 RECENT DEVELOPMENT
12.1 LIGNETICS
12.10.1 COMPANY SNAPSHOT
12.10.2 PRODUCT PORTFOLIO
12.10.3 RECENT DEVELOPMENT
12.11 MALLARD CREEK INC
12.11.1 COMPANY SNAPSHOT
12.11.2 PRODUCT PORTFOLIO
12.11.3 RECENT DEVELOPMENT
12.12 MIDLAND BIO ENERGY
12.12.1 COMPANY SNAPSHOT
12.12.2 PRODUCT PORTFOLIO
12.12.3 RECENT DEVELOPMENTS
12.13 NUGREEN ENERGY
12.13.1 COMPANY SNAPSHOT
12.13.2 PRODUCT PORTFOLIO
12.13.3 RECENT DEVELOPMENT
12.14 ROYAL WOOD SHAVINGS
12.14.1 COMPANY SNAPSHOT
12.14.2 PRODUCT PORTFOLIO
12.14.3 RECENT DEVELOPMENT
12.15 RZ PELLETS GMBH
12.15.1 COMPANY SNAPSHOT
12.15.2 PRODUCT PORTFOLIO
12.15.3 RECENT DEVELOPMENT
12.16 SCHWAIGER HOLZINDUSTRIE GMBH & CO. KG
12.16.1 COMPANY SNAPSHOT
12.16.2 PRODUCT PORTFOLIO
12.16.3 RECENT DEVELOPMENT
12.17 SINCLAR GROUP FOREST PRODUCTS
12.17.1 COMPANY SNAPSHOT
12.17.2 PRODUCT PORTFOLIO
12.17.3 RECENT DEVELOPMENT
12.18 TANAC
12.18.1 COMPANY SNAPSHOT
12.18.2 PRODUCT PORTFOLIO
12.18.3 RECENT DEVELOPMENTS
12.19 VALFEI PRODUCTS INC.
12.19.1 COMPANY SNAPSHOT
12.19.2 PRODUCT PORTFOLIO
12.19.3 RECENT DEVELOPMENTS
12.2 WILHELM HOYER GMBH & CO. KG
12.20.1 COMPANY SNAPSHOT
12.20.2 PRODUCT PORTFOLIO
12.20.3 RECENT DEVELOPMENT
13 QUESTIONNAIRE
14 RELATED REPORTS
Lista de Tablas
TABLE 1 ASIA PACIFIC WOOD PELLET MARKET, BY APPLICATION, 2021-2030 (USD MILLION)
TABLE 2 ASIA PACIFIC WOOD PELLET MARKET, BY APPLICATION, 2021-2030 (THOUSAND TONNES)
TABLE 3 ASIA PACIFIC WOOD PELLET MARKET, BY APPLICATION, 2021-2030 (AVERAGE SELLING PRICE)
TABLE 4 ASIA PACIFIC RESIDENTIAL HEATING IN WOOD PELLET MARKET, BY REGION, 2021-2030 (USD MILLION)
TABLE 5 ASIA PACIFIC RESIDENTIAL HEATING IN WOOD PELLET MARKET, BY REGION, 2021-2030 (THOUSAND TONNES)
TABLE 6 ASIA PACIFIC RESIDENTIAL HEATING IN WOOD PELLET MARKET, BY GRADE, 2021-2030 (USD MILLION)
TABLE 7 ASIA PACIFIC POWER PLANTS IN WOOD PELLET MARKET, BY REGION, 2021-2030 (USD MILLION)
TABLE 8 ASIA PACIFIC POWER PLANTS IN WOOD PELLET MARKET, BY REGION, 2021-2030 (THOUSAND TONNES)
TABLE 9 ASIA PACIFIC POWER PLANTS IN WOOD PELLET MARKET, BY GRADE, 2021-2030 (USD MILLION)
TABLE 10 ASIA PACIFIC COMMERCIAL HEATING IN WOOD PELLET MARKET, BY REGION, 2021-2030 (USD MILLION)
TABLE 11 ASIA PACIFIC COMMERCIAL HEATING IN WOOD PELLET MARKET, BY REGION, 2021-2030 (THOUSAND TONNES)
TABLE 12 ASIA PACIFIC COMMERCIAL HEATING IN WOOD PELLET MARKET, BY GRADE, 2021-2030 (USD MILLION)
TABLE 13 ASIA PACIFIC COMBINED HEAT AND POWER (CHP) IN WOOD PELLET MARKET, BY REGION, 2021-2030 (USD MILLION)
TABLE 14 ASIA PACIFIC COMBINED HEAT AND POWER (CHP) IN WOOD PELLET MARKET, BY REGION, 2021-2030 (THOUSAND TONNES)
TABLE 15 ASIA PACIFIC COMBINED HEAT AND POWER (CHP) IN WOOD PELLET MARKET, BY GRADE, 2021-2030 (USD MILLION)
TABLE 16 ASIA PACIFIC ANIMAL BEDDING IN WOOD PELLET MARKET, BY REGION, 2021-2030 (USD MILLION)
TABLE 17 ASIA PACIFIC ANIMAL BEDDING IN WOOD PELLET MARKET, BY REGION, 2021-2030 (THOUSAND TONNES)
TABLE 18 ASIA PACIFIC ANIMAL BEDDING IN WOOD PELLET MARKET, BY GRADE, 2021-2030 (USD MILLION)
TABLE 19 ASIA PACIFIC WOOD PELLET MARKET, BY GRADE, 2021-2030 (USD MILLION)
TABLE 20 ASIA PACIFIC WOOD PELLET MARKET, BY GRADE, 2021-2030 (THOUSAND TONNES)
TABLE 21 ASIA PACIFIC WOOD PELLET MARKET, BY GRADE, 2021-2030 (AVERAGE SELLING PRICE)
TABLE 22 ASIA PACIFIC STANDARD WOOD PELLET IN WOOD PELLET MARKET, BY REGION, 2021-2030 (USD MILLION)
TABLE 23 ASIA PACIFIC STANDARD WOOD PELLET IN WOOD PELLET MARKET, BY REGION, 2021-2030 (THOUSAND TONNES)
TABLE 24 ASIA PACIFIC UTILITY WOOD PELLET IN WOOD PELLET MARKET, BY REGION, 2021-2030 (USD MILLION)
TABLE 25 ASIA PACIFIC UTILITY WOOD PELLET IN WOOD PELLET MARKET, BY REGION, 2021-2030 (THOUSAND TONNES)
TABLE 26 ASIA PACIFIC PREMIUM WOOD PELLET IN WOOD PELLET MARKET, BY REGION, 2021-2030 (USD MILLION)
TABLE 27 ASIA PACIFIC PREMIUM WOOD PELLET IN WOOD PELLET MARKET, BY REGION, 2021-2030 (THOUSAND TONNES)
TABLE 28 ASIA PACIFIC WOOD PELLET MARKET, BY FLAVORS, 2021-2030 (USD MILLION)
TABLE 29 ASIA PACIFIC WOOD PELLET MARKET, BY FLAVORS, 2021-2030 (THOUSAND TONNES)
TABLE 30 ASIA PACIFIC WOOD PELLET MARKET, BY FLAVORS, 2021-2030 (AVERAGE SELLING PRICE)
TABLE 31 ASIA PACIFIC TRAEGER SIGNATURE WOOD PELLETS IN WOOD PELLET MARKET, BY REGION, 2021-2030 (USD MILLION)
TABLE 32 ASIA PACIFIC TRAEGER SIGNATURE WOOD PELLETS IN WOOD PELLET MARKET, BY REGION, 2021-2030 (THOUSAND TONNES)
TABLE 33 ASIA PACIFIC HICKORY WOOD PELLETS IN WOOD PELLET MARKET, BY REGION, 2021-2030 (USD MILLION)
TABLE 34 ASIA PACIFIC HICKORY WOOD PELLETS IN WOOD PELLET MARKET, BY REGION, 2021-2030 (THOUSAND TONNES)
TABLE 35 ASIA PACIFIC PECAN WOOD PELLETS IN WOOD PELLET MARKET, BY REGION, 2021-2030 (USD MILLION)
TABLE 36 ASIA PACIFIC PECAN WOOD PELLETS IN WOOD PELLET MARKET, BY REGION, 2021-2030 (THOUSAND TONNES)
TABLE 37 ASIA PACIFIC APPLE WOOD PELLETS IN WOOD PELLET MARKET, BY REGION, 2021-2030 (USD MILLION)
TABLE 38 ASIA PACIFIC APPLE WOOD PELLETS IN WOOD PELLET MARKET, BY REGION, 2021-2030 (THOUSAND TONNES)
TABLE 39 ASIA PACIFIC CHERRY WOOD PELLETS IN WOOD PELLET MARKET, BY REGION, 2021-2030 (USD MILLION)
TABLE 40 ASIA PACIFIC CHERRY WOOD PELLETS IN WOOD PELLET MARKET, BY REGION, 2021-2030 (THOUSAND TONNES)
TABLE 41 ASIA PACIFIC MESQUITE WOOD PELLETS IN WOOD PELLET MARKET, BY REGION, 2021-2030 (USD MILLION)
TABLE 42 ASIA PACIFIC MESQUITE WOOD PELLETS IN WOOD PELLET MARKET, BY REGION, 2021-2030 (THOUSAND TONNES)
TABLE 43 ASIA-PACIFIC WOOD PELLET MARKET, BY COUNTRY, 2021-2030 (USD MILLION)
TABLE 44 ASIA-PACIFIC WOOD PELLET MARKET, BY COUNTRY, 2021-2030 (THOUSAND TONNES)
TABLE 45 ASIA-PACIFIC WOOD PELLET MARKET, BY GRADE, 2021-2030 (USD MILLION)
TABLE 46 ASIA-PACIFIC WOOD PELLET MARKET, BY GRADE, 2021-2030 (THOUSAND TONNES)
TABLE 47 ASIA-PACIFIC WOOD PELLET MARKET, BY GRADE, 2021-2030 (AVERAGE SELLING PRICE)
TABLE 48 ASIA-PACIFIC WOOD PELLET MARKET, BY FLAVORS, 2021-2030 (USD MILLION)
TABLE 49 ASIA-PACIFIC WOOD PELLET MARKET, BY FLAVORS, 2021-2030 (THOUSAND TONNES)
TABLE 50 ASIA-PACIFIC WOOD PELLET MARKET, BY FLAVORS, 2021-2030 (AVERAGE SELLING PRICE)
TABLE 51 ASIA-PACIFIC WOOD PELLET MARKET, BY APPLICATION, 2021-2030 (USD MILLION)
TABLE 52 ASIA-PACIFIC WOOD PELLET MARKET, BY APPLICATION, 2021-2030 (THOUSAND TONNES)
TABLE 53 ASIA-PACIFIC WOOD PELLET MARKET, BY APPLICATION, 2021-2030 (AVERAGE SELLING PRICE)
TABLE 54 ASIA-PACIFIC RESIDENTIAL HEATING IN WOOD PELLET MARKET, BY GRADE, 2021-2030 (USD MILLION)
TABLE 55 ASIA-PACIFIC POWER PLANTS IN WOOD PELLET MARKET, BY GRADE, 2021-2030 (USD MILLION)
TABLE 56 ASIA-PACIFIC COMMERCIAL HEATING IN WOOD PELLET MARKET, BY GRADE, 2021-2030 (USD MILLION)
TABLE 57 ASIA-PACIFIC COMBINED HEAT AND POWER (CHP) IN WOOD PELLET MARKET, BY GRADE, 2021-2030 (USD MILLION)
TABLE 58 ASIA-PACIFIC ANIMAL BEDDING IN WOOD PELLET MARKET, BY GRADE, 2021-2030 (USD MILLION)
TABLE 59 CHINA WOOD PELLET MARKET, BY GRADE, 2021-2030 (USD MILLION)
TABLE 60 CHINA WOOD PELLET MARKET, BY GRADE, 2021-2030 (THOUSAND TONNES)
TABLE 61 CHINA WOOD PELLET MARKET, BY GRADE, 2021-2030 (AVERAGE SELLING PRICE)
TABLE 62 CHINA WOOD PELLET MARKET, BY FLAVORS, 2021-2030 (USD MILLION)
TABLE 63 CHINA WOOD PELLET MARKET, BY FLAVORS, 2021-2030 (THOUSAND TONNES)
TABLE 64 CHINA WOOD PELLET MARKET, BY FLAVORS, 2021-2030 (AVERAGE SELLING PRICE)
TABLE 65 CHINA WOOD PELLET MARKET, BY APPLICATION, 2021-2030 (USD MILLION)
TABLE 66 CHINA WOOD PELLET MARKET, BY APPLICATION, 2021-2030 (THOUSAND TONNES)
TABLE 67 CHINA WOOD PELLET MARKET, BY APPLICATION, 2021-2030 (AVERAGE SELLING PRICE)
TABLE 68 CHINA RESIDENTIAL HEATING IN WOOD PELLET MARKET, BY GRADE, 2021-2030 (USD MILLION)
TABLE 69 CHINA POWER PLANTS IN WOOD PELLET MARKET, BY GRADE, 2021-2030 (USD MILLION)
TABLE 70 CHINA COMMERCIAL HEATING IN WOOD PELLET MARKET, BY GRADE, 2021-2030 (USD MILLION)
TABLE 71 CHINA COMBINED HEAT AND POWER (CHP) IN WOOD PELLET MARKET, BY GRADE, 2021-2030 (USD MILLION)
TABLE 72 CHINA ANIMAL BEDDING IN WOOD PELLET MARKET, BY GRADE, 2021-2030 (USD MILLION)
TABLE 73 JAPAN WOOD PELLET MARKET, BY GRADE, 2021-2030 (USD MILLION)
TABLE 74 JAPAN WOOD PELLET MARKET, BY GRADE, 2021-2030 (THOUSAND TONNES)
TABLE 75 JAPAN WOOD PELLET MARKET, BY GRADE, 2021-2030 (AVERAGE SELLING PRICE)
TABLE 76 JAPAN WOOD PELLET MARKET, BY FLAVORS, 2021-2030 (USD MILLION)
TABLE 77 JAPAN WOOD PELLET MARKET, BY FLAVORS, 2021-2030 (THOUSAND TONNES)
TABLE 78 JAPAN WOOD PELLET MARKET, BY FLAVORS, 2021-2030 (AVERAGE SELLING PRICE)
TABLE 79 JAPAN WOOD PELLET MARKET, BY APPLICATION, 2021-2030 (USD MILLION)
TABLE 80 JAPAN WOOD PELLET MARKET, BY APPLICATION, 2021-2030 (THOUSAND TONNES)
TABLE 81 JAPAN WOOD PELLET MARKET, BY APPLICATION, 2021-2030 (AVERAGE SELLING PRICE)
TABLE 82 JAPAN RESIDENTIAL HEATING IN WOOD PELLET MARKET, BY GRADE, 2021-2030 (USD MILLION)
TABLE 83 JAPAN POWER PLANTS IN WOOD PELLET MARKET, BY GRADE, 2021-2030 (USD MILLION)
TABLE 84 JAPAN COMMERCIAL HEATING IN WOOD PELLET MARKET, BY GRADE, 2021-2030 (USD MILLION)
TABLE 85 JAPAN COMBINED HEAT AND POWER (CHP) IN WOOD PELLET MARKET, BY GRADE, 2021-2030 (USD MILLION)
TABLE 86 JAPAN ANIMAL BEDDING IN WOOD PELLET MARKET, BY GRADE, 2021-2030 (USD MILLION)
TABLE 87 SOUTH KOREA WOOD PELLET MARKET, BY GRADE, 2021-2030 (USD MILLION)
TABLE 88 SOUTH KOREA WOOD PELLET MARKET, BY GRADE, 2021-2030 (THOUSAND TONNES)
TABLE 89 SOUTH KOREA WOOD PELLET MARKET, BY GRADE, 2021-2030 (AVERAGE SELLING PRICE)
TABLE 90 SOUTH KOREA WOOD PELLET MARKET, BY FLAVORS, 2021-2030 (USD MILLION)
TABLE 91 SOUTH KOREA WOOD PELLET MARKET, BY FLAVORS, 2021-2030 (THOUSAND TONNES)
TABLE 92 SOUTH KOREA WOOD PELLET MARKET, BY FLAVORS, 2021-2030 (AVERAGE SELLING PRICE)
TABLE 93 SOUTH KOREA WOOD PELLET MARKET, BY APPLICATION, 2021-2030 (USD MILLION)
TABLE 94 SOUTH KOREA WOOD PELLET MARKET, BY APPLICATION, 2021-2030 (THOUSAND TONNES)
TABLE 95 SOUTH KOREA WOOD PELLET MARKET, BY APPLICATION, 2021-2030 (AVERAGE SELLING PRICE)
TABLE 96 SOUTH KOREA RESIDENTIAL HEATING IN WOOD PELLET MARKET, BY GRADE, 2021-2030 (USD MILLION)
TABLE 97 SOUTH KOREA POWER PLANTS IN WOOD PELLET MARKET, BY GRADE, 2021-2030 (USD MILLION)
TABLE 98 SOUTH KOREA COMMERCIAL HEATING IN WOOD PELLET MARKET, BY GRADE, 2021-2030 (USD MILLION)
TABLE 99 SOUTH KOREA COMBINED HEAT AND POWER (CHP) IN WOOD PELLET MARKET, BY GRADE, 2021-2030 (USD MILLION)
TABLE 100 SOUTH KOREA ANIMAL BEDDING IN WOOD PELLET MARKET, BY GRADE, 2021-2030 (USD MILLION)
TABLE 101 INDIA WOOD PELLET MARKET, BY GRADE, 2021-2030 (USD MILLION)
TABLE 102 INDIA WOOD PELLET MARKET, BY GRADE, 2021-2030 (THOUSAND TONNES)
TABLE 103 INDIA WOOD PELLET MARKET, BY GRADE, 2021-2030 (AVERAGE SELLING PRICE)
TABLE 104 INDIA WOOD PELLET MARKET, BY FLAVORS, 2021-2030 (USD MILLION)
TABLE 105 INDIA WOOD PELLET MARKET, BY FLAVORS, 2021-2030 (THOUSAND TONNES)
TABLE 106 INDIA WOOD PELLET MARKET, BY FLAVORS, 2021-2030 (AVERAGE SELLING PRICE)
TABLE 107 INDIA WOOD PELLET MARKET, BY APPLICATION, 2021-2030 (USD MILLION)
TABLE 108 INDIA WOOD PELLET MARKET, BY APPLICATION, 2021-2030 (THOUSAND TONNES)
TABLE 109 INDIA WOOD PELLET MARKET, BY APPLICATION, 2021-2030 (AVERAGE SELLING PRICE)
TABLE 110 INDIA RESIDENTIAL HEATING IN WOOD PELLET MARKET, BY GRADE, 2021-2030 (USD MILLION)
TABLE 111 INDIA POWER PLANTS IN WOOD PELLET MARKET, BY GRADE, 2021-2030 (USD MILLION)
TABLE 112 INDIA COMMERCIAL HEATING IN WOOD PELLET MARKET, BY GRADE, 2021-2030 (USD MILLION)
TABLE 113 INDIA COMBINED HEAT AND POWER (CHP) IN WOOD PELLET MARKET, BY GRADE, 2021-2030 (USD MILLION)
TABLE 114 INDIA ANIMAL BEDDING IN WOOD PELLET MARKET, BY GRADE, 2021-2030 (USD MILLION)
TABLE 115 INDONESIA WOOD PELLET MARKET, BY GRADE, 2021-2030 (USD MILLION)
TABLE 116 INDONESIA WOOD PELLET MARKET, BY GRADE, 2021-2030 (THOUSAND TONNES)
TABLE 117 INDONESIA WOOD PELLET MARKET, BY GRADE, 2021-2030 (AVERAGE SELLING PRICE)
TABLE 118 INDONESIA WOOD PELLET MARKET, BY FLAVORS, 2021-2030 (USD MILLION)
TABLE 119 INDONESIA WOOD PELLET MARKET, BY FLAVORS, 2021-2030 (THOUSAND TONNES)
TABLE 120 INDONESIA WOOD PELLET MARKET, BY FLAVORS, 2021-2030 (AVERAGE SELLING PRICE)
TABLE 121 INDONESIA WOOD PELLET MARKET, BY APPLICATION, 2021-2030 (USD MILLION)
TABLE 122 INDONESIA WOOD PELLET MARKET, BY APPLICATION, 2021-2030 (THOUSAND TONNES)
TABLE 123 INDONESIA WOOD PELLET MARKET, BY APPLICATION, 2021-2030 (AVERAGE SELLING PRICE)
TABLE 124 INDONESIA RESIDENTIAL HEATING IN WOOD PELLET MARKET, BY GRADE, 2021-2030 (USD MILLION)
TABLE 125 INDONESIA POWER PLANTS IN WOOD PELLET MARKET, BY GRADE, 2021-2030 (USD MILLION)
TABLE 126 INDONESIA COMMERCIAL HEATING IN WOOD PELLET MARKET, BY GRADE, 2021-2030 (USD MILLION)
TABLE 127 INDONESIA COMBINED HEAT AND POWER (CHP) IN WOOD PELLET MARKET, BY GRADE, 2021-2030 (USD MILLION)
TABLE 128 INDONESIA ANIMAL BEDDING IN WOOD PELLET MARKET, BY GRADE, 2021-2030 (USD MILLION)
TABLE 129 AUSTRALIA & NEW ZEALAND WOOD PELLET MARKET, BY GRADE, 2021-2030 (USD MILLION)
TABLE 130 AUSTRALIA & NEW ZEALAND WOOD PELLET MARKET, BY GRADE, 2021-2030 (THOUSAND TONNES)
TABLE 131 AUSTRALIA & NEW ZEALAND WOOD PELLET MARKET, BY GRADE, 2021-2030 (AVERAGE SELLING PRICE)
TABLE 132 AUSTRALIA & NEW ZEALAND WOOD PELLET MARKET, BY FLAVORS, 2021-2030 (USD MILLION)
TABLE 133 AUSTRALIA & NEW ZEALAND WOOD PELLET MARKET, BY FLAVORS, 2021-2030 (THOUSAND TONNES)
TABLE 134 AUSTRALIA & NEW ZEALAND WOOD PELLET MARKET, BY FLAVORS, 2021-2030 (AVERAGE SELLING PRICE)
TABLE 135 AUSTRALIA & NEW ZEALAND WOOD PELLET MARKET, BY APPLICATION, 2021-2030 (USD MILLION)
TABLE 136 AUSTRALIA & NEW ZEALAND WOOD PELLET MARKET, BY APPLICATION, 2021-2030 (THOUSAND TONNES)
TABLE 137 AUSTRALIA & NEW ZEALAND WOOD PELLET MARKET, BY APPLICATION, 2021-2030 (AVERAGE SELLING PRICE)
TABLE 138 AUSTRALIA & NEW ZEALAND RESIDENTIAL HEATING IN WOOD PELLET MARKET, BY GRADE, 2021-2030 (USD MILLION)
TABLE 139 AUSTRALIA & NEW ZEALAND POWER PLANTS IN WOOD PELLET MARKET, BY GRADE, 2021-2030 (USD MILLION)
TABLE 140 AUSTRALIA & NEW ZEALAND COMMERCIAL HEATING IN WOOD PELLET MARKET, BY GRADE, 2021-2030 (USD MILLION)
TABLE 141 AUSTRALIA & NEW ZEALAND COMBINED HEAT AND POWER (CHP) IN WOOD PELLET MARKET, BY GRADE, 2021-2030 (USD MILLION)
TABLE 142 AUSTRALIA & NEW ZEALAND ANIMAL BEDDING IN WOOD PELLET MARKET, BY GRADE, 2021-2030 (USD MILLION)
TABLE 143 THAILAND WOOD PELLET MARKET, BY GRADE, 2021-2030 (USD MILLION)
TABLE 144 THAILAND WOOD PELLET MARKET, BY GRADE, 2021-2030 (THOUSAND TONNES)
TABLE 145 THAILAND WOOD PELLET MARKET, BY GRADE, 2021-2030 (AVERAGE SELLING PRICE)
TABLE 146 THAILAND WOOD PELLET MARKET, BY FLAVORS, 2021-2030 (USD MILLION)
TABLE 147 THAILAND WOOD PELLET MARKET, BY FLAVORS, 2021-2030 (THOUSAND TONNES)
TABLE 148 THAILAND WOOD PELLET MARKET, BY FLAVORS, 2021-2030 (AVERAGE SELLING PRICE)
TABLE 149 THAILAND WOOD PELLET MARKET, BY APPLICATION, 2021-2030 (USD MILLION)
TABLE 150 THAILAND WOOD PELLET MARKET, BY APPLICATION, 2021-2030 (THOUSAND TONNES)
TABLE 151 THAILAND WOOD PELLET MARKET, BY APPLICATION, 2021-2030 (AVERAGE SELLING PRICE)
TABLE 152 THAILAND RESIDENTIAL HEATING IN WOOD PELLET MARKET, BY GRADE, 2021-2030 (USD MILLION)
TABLE 153 THAILAND POWER PLANTS IN WOOD PELLET MARKET, BY GRADE, 2021-2030 (USD MILLION)
TABLE 154 THAILAND COMMERCIAL HEATING IN WOOD PELLET MARKET, BY GRADE, 2021-2030 (USD MILLION)
TABLE 155 THAILAND COMBINED HEAT AND POWER (CHP) IN WOOD PELLET MARKET, BY GRADE, 2021-2030 (USD MILLION)
TABLE 156 THAILAND ANIMAL BEDDING IN WOOD PELLET MARKET, BY GRADE, 2021-2030 (USD MILLION)
TABLE 157 MALAYSIA WOOD PELLET MARKET, BY GRADE, 2021-2030 (USD MILLION)
TABLE 158 MALAYSIA WOOD PELLET MARKET, BY GRADE, 2021-2030 (THOUSAND TONNES)
TABLE 159 MALAYSIA WOOD PELLET MARKET, BY GRADE, 2021-2030 (AVERAGE SELLING PRICE)
TABLE 160 MALAYSIA WOOD PELLET MARKET, BY FLAVORS, 2021-2030 (USD MILLION)
TABLE 161 MALAYSIA WOOD PELLET MARKET, BY FLAVORS, 2021-2030 (THOUSAND TONNES)
TABLE 162 MALAYSIA WOOD PELLET MARKET, BY FLAVORS, 2021-2030 (AVERAGE SELLING PRICE)
TABLE 163 MALAYSIA WOOD PELLET MARKET, BY APPLICATION, 2021-2030 (USD MILLION)
TABLE 164 MALAYSIA WOOD PELLET MARKET, BY APPLICATION, 2021-2030 (THOUSAND TONNES)
TABLE 165 MALAYSIA WOOD PELLET MARKET, BY APPLICATION, 2021-2030 (AVERAGE SELLING PRICE)
TABLE 166 MALAYSIA RESIDENTIAL HEATING IN WOOD PELLET MARKET, BY GRADE, 2021-2030 (USD MILLION)
TABLE 167 MALAYSIA POWER PLANTS IN WOOD PELLET MARKET, BY GRADE, 2021-2030 (USD MILLION)
TABLE 168 MALAYSIA COMMERCIAL HEATING IN WOOD PELLET MARKET, BY GRADE, 2021-2030 (USD MILLION)
TABLE 169 MALAYSIA COMBINED HEAT AND POWER (CHP) IN WOOD PELLET MARKET, BY GRADE, 2021-2030 (USD MILLION)
TABLE 170 MALAYSIA ANIMAL BEDDING IN WOOD PELLET MARKET, BY GRADE, 2021-2030 (USD MILLION)
TABLE 171 SINGAPORE WOOD PELLET MARKET, BY GRADE, 2021-2030 (USD MILLION)
TABLE 172 SINGAPORE WOOD PELLET MARKET, BY GRADE, 2021-2030 (THOUSAND TONNES)
TABLE 173 SINGAPORE WOOD PELLET MARKET, BY GRADE, 2021-2030 (AVERAGE SELLING PRICE)
TABLE 174 SINGAPORE WOOD PELLET MARKET, BY FLAVORS, 2021-2030 (USD MILLION)
TABLE 175 SINGAPORE WOOD PELLET MARKET, BY FLAVORS, 2021-2030 (THOUSAND TONNES)
TABLE 176 SINGAPORE WOOD PELLET MARKET, BY FLAVORS, 2021-2030 (AVERAGE SELLING PRICE)
TABLE 177 SINGAPORE WOOD PELLET MARKET, BY APPLICATION, 2021-2030 (USD MILLION)
TABLE 178 SINGAPORE WOOD PELLET MARKET, BY APPLICATION, 2021-2030 (THOUSAND TONNES)
TABLE 179 SINGAPORE WOOD PELLET MARKET, BY APPLICATION, 2021-2030 (AVERAGE SELLING PRICE)
TABLE 180 SINGAPORE RESIDENTIAL HEATING IN WOOD PELLET MARKET, BY GRADE, 2021-2030 (USD MILLION)
TABLE 181 SINGAPORE POWER PLANTS IN WOOD PELLET MARKET, BY GRADE, 2021-2030 (USD MILLION)
TABLE 182 SINGAPORE COMMERCIAL HEATING IN WOOD PELLET MARKET, BY GRADE, 2021-2030 (USD MILLION)
TABLE 183 SINGAPORE COMBINED HEAT AND POWER (CHP) IN WOOD PELLET MARKET, BY GRADE, 2021-2030 (USD MILLION)
TABLE 184 SINGAPORE ANIMAL BEDDING IN WOOD PELLET MARKET, BY GRADE, 2021-2030 (USD MILLION)
TABLE 185 PHILIPPINES WOOD PELLET MARKET, BY GRADE, 2021-2030 (USD MILLION)
TABLE 186 PHILIPPINES WOOD PELLET MARKET, BY GRADE, 2021-2030 (THOUSAND TONNES)
TABLE 187 PHILIPPINES WOOD PELLET MARKET, BY GRADE, 2021-2030 (AVERAGE SELLING PRICE)
TABLE 188 PHILIPPINES WOOD PELLET MARKET, BY FLAVORS, 2021-2030 (USD MILLION)
TABLE 189 PHILIPPINES WOOD PELLET MARKET, BY FLAVORS, 2021-2030 (THOUSAND TONNES)
TABLE 190 PHILIPPINES WOOD PELLET MARKET, BY FLAVORS, 2021-2030 (AVERAGE SELLING PRICE)
TABLE 191 PHILIPPINES WOOD PELLET MARKET, BY APPLICATION, 2021-2030 (USD MILLION)
TABLE 192 PHILIPPINES WOOD PELLET MARKET, BY APPLICATION, 2021-2030 (THOUSAND TONNES)
TABLE 193 PHILIPPINES WOOD PELLET MARKET, BY APPLICATION, 2021-2030 (AVERAGE SELLING PRICE)
TABLE 194 PHILIPPINES RESIDENTIAL HEATING IN WOOD PELLET MARKET, BY GRADE, 2021-2030 (USD MILLION)
TABLE 195 PHILIPPINES POWER PLANTS IN WOOD PELLET MARKET, BY GRADE, 2021-2030 (USD MILLION)
TABLE 196 PHILIPPINES COMMERCIAL HEATING IN WOOD PELLET MARKET, BY GRADE, 2021-2030 (USD MILLION)
TABLE 197 PHILIPPINES COMBINED HEAT AND POWER (CHP) IN WOOD PELLET MARKET, BY GRADE, 2021-2030 (USD MILLION)
TABLE 198 PHILIPPINES ANIMAL BEDDING IN WOOD PELLET MARKET, BY GRADE, 2021-2030 (USD MILLION)
TABLE 199 REST OF ASIA-PACIFIC WOOD PELLET MARKET, BY GRADE, 2021-2030 (USD MILLION)
TABLE 200 REST OF ASIA-PACIFIC WOOD PELLET MARKET, BY GRADE, 2021-2030 (THOUSAND TONNES)
TABLE 201 REST OF ASIA-PACIFIC WOOD PELLET MARKET, BY GRADE, 2021-2030 (AVERAGE SELLING PRICE)
Lista de figuras
FIGURE 1 ASIA PACIFIC WOOD PELLET MARKET: SEGMENTATION
FIGURE 2 ASIA PACIFIC WOOD PELLET MARKET: DATA TRIANGULATION
FIGURE 3 ASIA PACIFIC WOOD PELLET MARKET: DROC ANALYSIS
FIGURE 4 ASIA PACIFIC WOOD PELLET MARKET: ASIA PACIFIC VS. REGIONAL MARKET ANALYSIS
FIGURE 5 ASIA PACIFIC WOOD PELLET MARKET: COMPANY RESEARCH ANALYSIS
FIGURE 6 ASIA PACIFIC WOOD PELLET MARKET: INTERVIEW DEMOGRAPHICS
FIGURE 7 ASIA PACIFIC WOOD PELLET MARKET: DBMR MARKET POSITION GRID
FIGURE 8 ASIA PACIFIC WOOD PELLET MARKET: VENDOR SHARE ANALYSIS
FIGURE 9 ASIA PACIFIC WOOD PELLET MARKET: MULTIVARIATE MODELING
FIGURE 10 ASIA PACIFIC WOOD PELLET MARKET: MARKET APPLICATION COVERAGE GRID
FIGURE 11 ASIA PACIFIC WOOD PELLET MARKET: TYPE TIMELINE CURVE
FIGURE 12 ASIA PACIFIC WOOD PELLET MARKET: SEGMENTATION
FIGURE 13 INCREASE IN THE POPULARITY OF WOOD PELLETS AS AN ENERGY CARRIER IS EXPECTED TO DRIVE ASIA PACIFIC WOOD PELLET MARKET IN THE FORECAST PERIOD OF 2023 TO 2030
FIGURE 14 STANDARD WOOD PELLET SEGMENT IS EXPECTED TO ACCOUNT FOR THE LARGEST SHARE OF ASIA PACIFIC WOOD PELLET MARKET IN 2023 & 2030
FIGURE 15 DRIVERS, RESTRAINTS, OPPORTUNITIES, AND CHALLENGES OF THE ASIA PACIFIC WOOD PELLET MARKET
FIGURE 16 RENEWABLE DIESEL CONSUMPTION BY WORLD (2010-2020)
FIGURE 17 CONSUMPTION IN TOP EUROPEAN COUNTRIES IN 2021
FIGURE 18 BIOENERGY POWER GENERATION
FIGURE 19 ELECTRICITY GENERATION FROM BIOMASS IN CONTINENTS IN 2018
FIGURE 20 PRICE INCREASING RATE FOR DIFFERENT ENERGY IN THE U.S (APRIL 2021 TO APRIL 2022)
FIGURE 21 ASIA PACIFIC WOOD PELLET MARKET: BY APPLICATION, 2022
FIGURE 22 ASIA PACIFIC WOOD PELLET MARKET: BY GRADE, 2022
FIGURE 23 ASIA PACIFIC WOOD PELLET MARKET: BY FLAVORS, 2022
FIGURE 24 ASIA-PACIFIC WOOD PELLET MARKET: SNAPSHOT (2022)
FIGURE 25 ASIA-PACIFIC WOOD PELLET MARKET: BY COUNTRY (2022)
FIGURE 26 ASIA-PACIFIC WOOD PELLET MARKET: BY COUNTRY (2023 & 2030)
FIGURE 27 ASIA-PACIFIC WOOD PELLET MARKET: BY COUNTRY (2022 & 2030)
FIGURE 28 ASIA-PACIFIC WOOD PELLET MARKET: BY GRADE (2023-2030)
FIGURE 29 ASIA PACIFIC WOOD PELLET MARKET: COMPANY SHARE 2022 (%)
Metodología de investigación
La recopilación de datos y el análisis del año base se realizan utilizando módulos de recopilación de datos con muestras de gran tamaño. La etapa incluye la obtención de información de mercado o datos relacionados a través de varias fuentes y estrategias. Incluye el examen y la planificación de todos los datos adquiridos del pasado con antelación. Asimismo, abarca el examen de las inconsistencias de información observadas en diferentes fuentes de información. Los datos de mercado se analizan y estiman utilizando modelos estadísticos y coherentes de mercado. Además, el análisis de la participación de mercado y el análisis de tendencias clave son los principales factores de éxito en el informe de mercado. Para obtener más información, solicite una llamada de un analista o envíe su consulta.
La metodología de investigación clave utilizada por el equipo de investigación de DBMR es la triangulación de datos, que implica la extracción de datos, el análisis del impacto de las variables de datos en el mercado y la validación primaria (experto en la industria). Los modelos de datos incluyen cuadrícula de posicionamiento de proveedores, análisis de línea de tiempo de mercado, descripción general y guía del mercado, cuadrícula de posicionamiento de la empresa, análisis de patentes, análisis de precios, análisis de participación de mercado de la empresa, estándares de medición, análisis global versus regional y de participación de proveedores. Para obtener más información sobre la metodología de investigación, envíe una consulta para hablar con nuestros expertos de la industria.
Personalización disponible
Data Bridge Market Research es líder en investigación formativa avanzada. Nos enorgullecemos de brindar servicios a nuestros clientes existentes y nuevos con datos y análisis que coinciden y se adaptan a sus objetivos. El informe se puede personalizar para incluir análisis de tendencias de precios de marcas objetivo, comprensión del mercado de países adicionales (solicite la lista de países), datos de resultados de ensayos clínicos, revisión de literatura, análisis de mercado renovado y base de productos. El análisis de mercado de competidores objetivo se puede analizar desde análisis basados en tecnología hasta estrategias de cartera de mercado. Podemos agregar tantos competidores sobre los que necesite datos en el formato y estilo de datos que esté buscando. Nuestro equipo de analistas también puede proporcionarle datos en archivos de Excel sin procesar, tablas dinámicas (libro de datos) o puede ayudarlo a crear presentaciones a partir de los conjuntos de datos disponibles en el informe.

