

Mercado de análisis deportivo de Asia-Pacífico, por componente (software/plataforma y servicios), tipo de deporte (deportes de equipo y deportes individuales), aplicación (valoración de jugadores y equipos, análisis de rendimiento, evaluación de la salud, participación de los fanáticos, gestión de transmisiones, análisis de video y otros), implementación (nube y local), modo de organización (grandes empresas y pymes), tipo de análisis (en el campo y fuera del campo), país (Japón, China, India, Corea del Sur, Australia, Singapur, Malasia, Tailandia, Indonesia, Filipinas y resto de Asia-Pacífico), tendencias de la industria y pronóstico hasta 2029
Análisis y perspectivas del mercado: mercado de análisis deportivo de Asia y el Pacífico
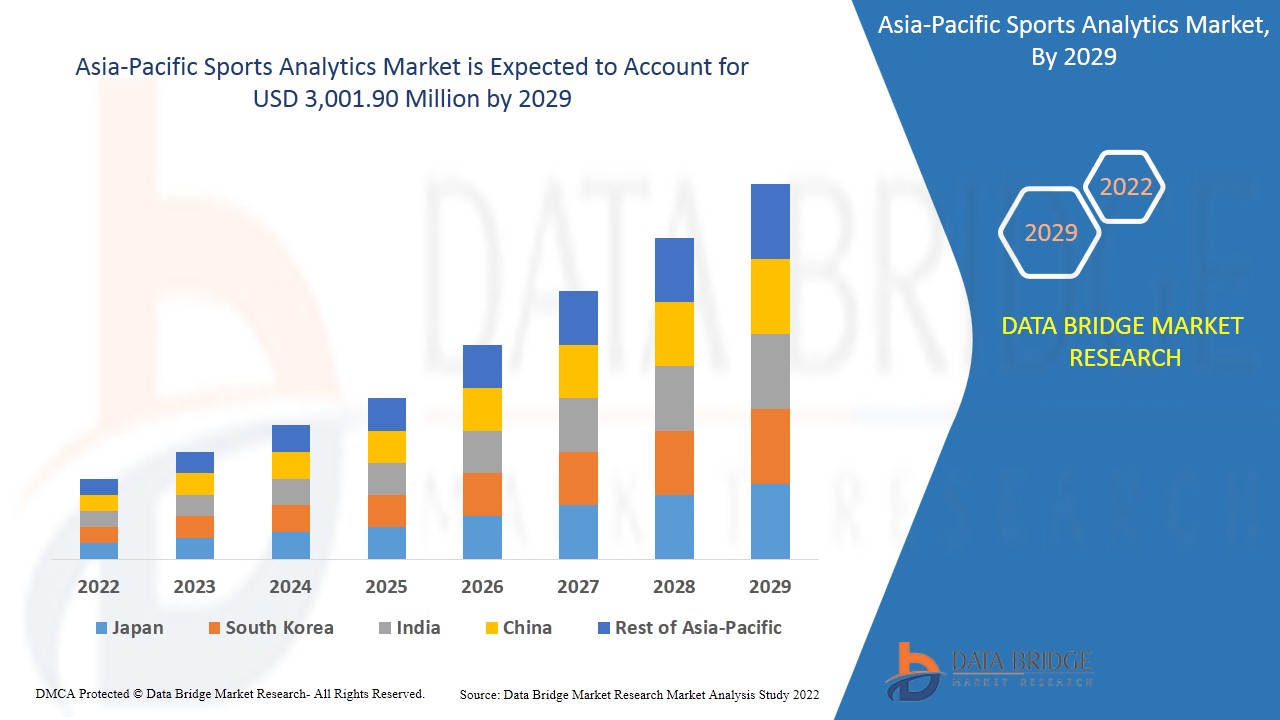
Se espera que el mercado de análisis deportivo gane crecimiento en el período de pronóstico de 2022 a 2029. Data Bridge Market Research analiza que el mercado está creciendo con la CAGR más alta del 46,7% en el período de pronóstico de 2022 a 2029 y se espera que alcance los USD 3.001,90 millones para 2029. Las crecientes tendencias de digitalización y la omnipresencia del deporte están impulsando el crecimiento del mercado. La región de Asia y el Pacífico ha sido testigo de un alto crecimiento en la adopción de análisis deportivos debido a la creciente adopción de soluciones de análisis deportivos en países como Australia, China, India, Japón y otros países.
El análisis deportivo se define como el uso de datos y estadísticas avanzadas para medir el éxito en la industria del deporte mediante la toma de decisiones competitivas y estratégicas. El análisis deportivo, cuando se implementa correctamente, puede dar a un equipo o a una persona enormes ventajas competitivas. A medida que la tecnología continúa evolucionando, la recopilación de datos se vuelve más complicada y la cantidad de información disponible aumenta, al igual que la capacidad para evaluar y mejorar su eficiencia. El desarrollo de estadísticas avanzadas y la optimización de los resultados han contribuido a la expansión de los datos deportivos.
Los factores que impulsan el mercado son la creciente aceptación de las soluciones y servicios de análisis deportivo basados en la nube en diferentes organizaciones y la creciente demanda de acceso a datos en tiempo real. La escasez de subsidios o las restricciones presupuestarias que surgen debido a la falta de apoyo gubernamental en algunos países. La aparición de tecnologías de inteligencia artificial y aprendizaje automático y la creciente adopción de teléfonos inteligentes y redes sociales es un factor que abre oportunidades lucrativas para el mercado. La falta de profesionales capacitados está actuando como un desafío importante para el crecimiento del mercado.
Este informe de mercado de análisis deportivo proporciona detalles de la participación de mercado, nuevos desarrollos y análisis de la cartera de productos, el impacto de los actores del mercado nacional y localizado, analiza las oportunidades en términos de bolsas de ingresos emergentes, cambios en las regulaciones del mercado, aprobaciones de productos, decisiones estratégicas, lanzamientos de productos, expansiones geográficas e innovaciones tecnológicas en el mercado. Para comprender el análisis y el escenario del mercado, contáctenos para obtener un resumen de analistas; nuestro equipo lo ayudará a crear una solución de impacto en los ingresos para lograr su objetivo deseado.
Alcance y tamaño del mercado de análisis deportivo en Asia-Pacífico
El mercado de análisis deportivo está segmentado en función de los componentes, el tipo de deporte, la aplicación, la implementación, el modo de organización y el tipo de análisis. El crecimiento entre segmentos le ayuda a analizar nichos de crecimiento y estrategias para abordar el mercado y determinar sus áreas de aplicación principales y la diferencia en sus mercados objetivo.
- En función de los componentes, el mercado de análisis deportivo de Asia-Pacífico se ha segmentado en software y servicios. En 2022, se espera que el segmento de software domine el mercado de análisis deportivo debido a la creciente adopción de análisis deportivo para software/plataforma, lo que se puede atribuir en gran medida a la creciente preferencia por las soluciones de software basadas en la nube.
- En función del tipo de deporte, el mercado de análisis deportivo de Asia-Pacífico se segmenta en deportes de equipo y deportes individuales. En 2022, se espera que el segmento de deportes de equipo domine el mercado de análisis deportivo, ya que las ligas son los principales usuarios de soluciones de análisis deportivo, como el cricket, el hockey y otros, que tienen la tasa de adopción más alta de estas soluciones, en particular para seleccionar y analizar el rendimiento de los jugadores.
- En función de la aplicación, el mercado de análisis deportivo de Asia-Pacífico se segmenta en valoración de jugadores y equipos, análisis de rendimiento, evaluación de la salud, participación de los aficionados, gestión de retransmisiones, análisis de vídeo y otros. En 2022, se espera que el segmento de valoración de jugadores y equipos domine el mercado de análisis deportivo debido al seguimiento y control de los datos de los jugadores, y el número de dispositivos portátiles en la industria del deporte está aumentando.
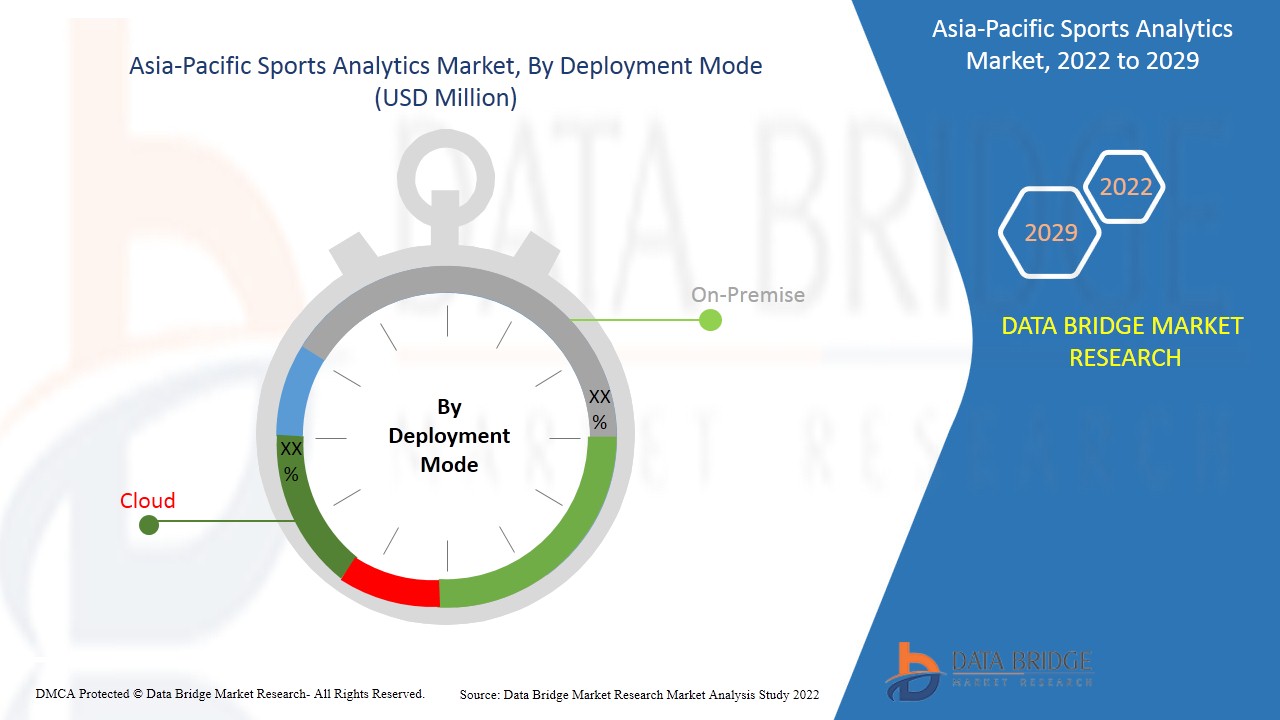
- Según el modo de implementación, el mercado de análisis deportivo de Asia-Pacífico se segmenta en local y en la nube. En 2022, se espera que el segmento de la nube domine el mercado de análisis deportivo debido a la solución informática rentable y de alta gama, y se espera que la creciente demanda de análisis de transmisiones de datos complejos impulse el crecimiento del mercado.
- Según el modelo de organización, el mercado de análisis deportivo de Asia-Pacífico se segmenta en grandes empresas y pymes. En 2022, se espera que el segmento de grandes empresas domine el mercado de análisis deportivo debido al amplio uso de análisis en las grandes empresas para mejorar el rendimiento comercial de las organizaciones y trabajar de manera eficaz. El avance de las tecnologías está aumentando aún más el crecimiento del mercado.
- Según el tipo de análisis, el mercado de análisis deportivo de Asia-Pacífico se segmenta en dentro y fuera del campo. En 2022, se espera que el segmento dentro del campo domine el mercado de análisis deportivo debido al creciente uso de soluciones analíticas en juegos al aire libre como el hockey y el cricket, entre otros, y el uso de herramientas analíticas en los deportes proporciona una gran cantidad de datos relacionados con la salud y la forma física, lo que ayuda a impulsar el crecimiento del mercado.
Análisis del mercado de análisis deportivo a nivel de país
Se analiza el mercado de análisis deportivo y se proporciona información sobre el tamaño del mercado por país, componente, tipo de deporte, aplicación, implementación, modo de organización y tipo de análisis.
Los países cubiertos en el informe del mercado de análisis deportivo son Japón, China, India, Corea del Sur, Australia, Singapur, Malasia, Tailandia, Indonesia, Filipinas y el resto de Asia-Pacífico.
Se espera que China domine el mercado en la región Asia-Pacífico debido a que el mercado emergente y la urbanización son factores que ayudan al crecimiento de este mercado.
La sección de países del informe también proporciona factores de impacto de mercado individuales y cambios en la regulación en el mercado a nivel nacional que afectan las tendencias actuales y futuras del mercado. Los puntos de datos como nuevas ventas, ventas de reemplazo, demografía del país, leyes regulatorias y aranceles de importación y exportación son algunos de los principales indicadores utilizados para pronosticar el escenario del mercado para países individuales. Además, la presencia y disponibilidad de marcas de Asia-Pacífico y sus desafíos enfrentados debido a la competencia grande o escasa de las marcas locales y nacionales, el impacto de los canales de venta se consideran al proporcionar un análisis de pronóstico de los datos del país.
Demanda creciente de análisis deportivos
El mercado de análisis deportivo también le ofrece un análisis detallado del mercado para cada país, el crecimiento de la industria con ventas, ventas de componentes, el impacto del desarrollo tecnológico en el análisis deportivo y los cambios en los escenarios regulatorios con su apoyo al mercado de análisis deportivo. Los datos están disponibles para el período histórico de 2011 a 2020.
Análisis del panorama competitivo y la cuota de mercado de la analítica deportiva
El panorama competitivo del mercado de análisis deportivo proporciona detalles por competidor. Los detalles incluidos son una descripción general de la empresa, las finanzas de la empresa, los ingresos generados, el potencial de mercado, la inversión en investigación y desarrollo, las nuevas iniciativas de mercado, la presencia en Asia-Pacífico, los sitios e instalaciones de producción, las fortalezas y debilidades de la empresa, el lanzamiento de productos, los procesos de prueba de productos, las aprobaciones de productos, las patentes, la amplitud y la extensión de los productos, el dominio de las aplicaciones y la curva de supervivencia de la tecnología. Los puntos de datos anteriores proporcionados solo están relacionados con el enfoque de las empresas en relación con el mercado de análisis deportivo de Asia-Pacífico.
Los principales actores incluidos en el informe son IBM Corporation, Sportradar AG, Synergy Sports, DataArt, SAP SE, TABLEAU SOFTWARE, LLC, A SALESFORCE COMPANY, Oracle, SAS Institute Inc., HCL Technologies Limited, GlobalStep, LLC, TruMedia Networks, Inc., ICEBERG Sports Analytics, SPORTSMECHANICS, Stats Perform, Experfy, Inc., Catapult Group International Ltd, orreco, Zebra Technologies Corp., Exasol, Qualitas Global, entre otros. Las empresas de todo el mundo también están iniciando muchos desarrollos de productos que también están acelerando el crecimiento del mercado de análisis deportivo.
Numerosas empresas de todo el mundo también están impulsando el desarrollo de productos que aceleran el crecimiento del mercado de análisis deportivo.
Por ejemplo,
- En agosto de 2021, TABLEAU SOFTWARE, LLC, A SALESFORCE COMPANY presentó un plan para Rugby Australia con el fin de mejorar la cultura de los datos. Rugby Australia utilizó Tableau por primera vez para reunir los enormes volúmenes de datos necesarios para evaluar y anticipar el rendimiento del equipo en comparación con sus competidores, teniendo en cuenta factores como la salud de los jugadores, el entrenamiento y el rendimiento anterior. Esta implementación ayuda a mejorar el reconocimiento de la empresa.
- En mayo de 2021, Oracle presentó una infraestructura en la nube para impulsar nuevos análisis avanzados de fútbol en la Premier League. Al asociarse con Oracle, la Premier League aumentará la emoción en torno a cada partido a través de nuevas estadísticas durante el partido que brindan una comprensión más profunda de la acción en vivo en el campo. Esta ejecución del producto ayuda a mejorar el reconocimiento de la empresa.
Las asociaciones, las empresas conjuntas y otras estrategias mejoran la participación de mercado de la empresa con una mayor cobertura y presencia. También beneficia a la organización mejorar su oferta de análisis deportivo a través de una gama más amplia de tamaños.
SKU-
Obtenga acceso en línea al informe sobre la primera nube de inteligencia de mercado del mundo

- Panel de análisis de datos interactivo
- Panel de análisis de empresas para oportunidades con alto potencial de crecimiento
- Acceso de analista de investigación para personalización y consultas
- Análisis de la competencia con panel interactivo
- Últimas noticias, actualizaciones y análisis de tendencias
- Aproveche el poder del análisis de referencia para un seguimiento integral de la competencia
Tabla de contenido
1 INTRODUCTION
1.1 OBJECTIVES OF THE STUDY
1.2 MARKET DEFINITION
1.3 OVERVIEW OF ASIA PACIFIC SPORTS ANALYTICS MARKET
1.4 CURRENCY AND PRICING
1.5 LIMITATIONS
1.6 MARKETS COVERED
2 MARKET SEGMENTATION
2.1 MARKETS COVERED
2.2 GEOGRAPHICAL SCOPE
2.3 YEARS CONSIDERED FOR THE STUDY
2.4 DBMR TRIPOD DATA VALIDATION MODEL
2.5 PRIMARY INTERVIEWS WITH KEY OPINION LEADERS
2.6 DBMR MARKET POSITION GRID
2.7 VENDOR SHARE ANALYSIS
2.8 MULTIVARIATE MODELING
2.9 COMPONENT TIMELINE CURVE
2.1 MARKET APPLICATION COVERAGE GRID
2.11 SECONDARY SOURCES
2.12 ASSUMPTIONS
3 EXECUTIVE SUMMARY
4 PREMIUM INSIGHTS
4.1 TECHNOLOGY & INNOVATION LANDSCAPE
4.1.1 OVERVIEW
4.1.2 BIG DATA IN RUGBY
4.1.3 BIG DATA IN TENNIS
4.1.4 BIG DATA IN BASEBALL
4.1.5 BIG DATA IN CRICKET
4.1.6 BIG DATA IN FOOTBALL
4.1.7 BIG DATA IN FORMULA 1
4.2 REGULATORY FRAMEWORK
5 MARKET OVERVIEW
5.1 DRIVERS
5.1.1 GROWING DEMAND FOR REAL TIME DATA ACCESS
5.1.2 INCREASING AVAILABILITY OF A LARGE AMOUNT OF IN-FIELD DATA
5.1.3 GROWING ADOPTION OF WEARABLE DEVICES BY SPORTSMAN
5.1.4 ACCEPTANCE OF CLOUD-BASED SPORTS ANALYTICS SOLUTIONS AND SERVICES ACROSS DIFFERENT ORGANIZATIONS
5.1.5 GROWTH IN DEMAND OF PREDICTIVE INSIGHTS FOR FAN PREFERENCES
5.2 RESTRAINTS
5.2.1 SHORTAGES IN SUBSIDIES OR BUDGET CONSTRAINTS ARISING DUE TO LACK OF GOVERNMENT SUPPORT IN SOME COUNTRIES
5.2.2 DATA AND PRIVACY ISSUES
5.3 OPPORTUNITIES
5.3.1 EMERGENCE OF AI AND ML TECHNOLOGIES
5.3.2 GROWING ADOPTION OF SMARTPHONES AND SOCIAL MEDIA
5.3.3 ENHANCES ORGANIZATION'S BUSINESS PERFORMANCE
5.3.4 COMPLEX DATA STRUCTURE ENHANCING DEMAND FOR ANALYTICS
5.3.5 INCREASE IN VARIOUS STRATEGIC DECISIONS SUCH AS MERGER AND PARTNERSHIP
5.4 CHALLENGES
5.4.1 LACK OF SKILLED KNOWLEDGE
5.4.2 HIGH COSTS INVOLVED IN SETUP
6 IMPACT OF COVID-19 ON THE ASIA PACIFIC SPORTS ANALYTICS MARKET
6.1 ANALYSIS ON IMPACT OF COVID-19 ON THE MARKET
6.2 IMPACT ON SUPPLY CHAIN
6.3 IMPACT ON DEMAND
6.4 IMPACT ON PRICE
6.5 AFTERMATH OF COVID-19 AND GOVERNMENT INITIATIVE TO BOOST THE MARKET
6.6 STRATEGIC DECISIONS OF MANUFACTURERS AFTER COVID-19 TO GAIN COMPETITIVE MARKET SHARE
6.7 CONCLUSION
7 ASIA PACIFIC SPORTS ANALYTICS MARKET, BY COMPONENT
7.1 OVERVIEW
7.2 SOFTWARE/PLATFORM
7.3 SERVICES
7.3.1 MANAGED SERVICES
7.3.2 PROFESSIONAL SERVICES
7.3.2.1 CONSULTING
7.3.2.2 IMPLEMENTATION
7.3.2.3 TRAINING SUPPORT
8 ASIA PACIFIC SPORTS ANALYTICS MARKET, BY SPORTS TYPE
8.1 OVERVIEW
8.2 TEAM SPORTS
8.2.1 FOOTBALL
8.2.2 BASEBALL
8.2.3 BASKETBALL
8.2.4 HOCKEY
8.2.5 CRICKET
8.2.6 OTHERS
8.3 INDIVIDUAL SPORTS
8.3.1 RACING
8.3.2 TENNIS
8.3.3 ATHLETICS
8.3.4 BOXING
8.3.5 OTHERS
9 ASIA PACIFIC SPORTS ANALYTICS MARKET, BY APPLICATION
9.1 OVERVIEW
9.2 PLAYER & TEAM VALUATION
9.2.1 SOFTWARE
9.2.2 SERVICES
9.3 PERFORMANCE ANALYTICS
9.3.1 SOFTWARE
9.3.2 SERVICES
9.4 HEALTH ASSESSMENT
9.4.1 SOFTWARE
9.4.2 SERVICES
9.5 FAN ENGAGEMENT
9.5.1 SOFTWARE
9.5.2 SERVICES
9.6 BROADCAST MANAGEMENT
9.6.1 SOFTWARE
9.6.2 SERVICES
9.7 VIDEO ANALYSIS
9.7.1 SOFTWARE
9.7.2 SERVICES
9.8 OTHERS
9.8.1 SOFTWARE
9.8.2 SERVICES
10 ASIA PACIFIC SPORTS ANALYTICS MARKET, BY DEPLOYMENT
10.1 OVERVIEW
10.2 CLOUD
10.3 ON-PREMISE
11 ASIA PACIFIC SPORTS ANALYTICS MARKET, BY ORGANIZATION MODE
11.1 OVERVIEW
11.2 LARGE ENTERPRISE
11.3 SME’S
12 ASIA PACIFIC SPORTS ANALYTICS MARKET, BY ANALYSIS TYPE
12.1 OVERVIEW
12.2 ON-FIELD
12.3 OFF-FIELD
13 ASIA PACIFIC SPORTS ANALYTICS MARKET, BY REGION
13.1 ASIA-PACIFIC
13.1.1 CHINA
13.1.2 AUSTRALIA
13.1.3 JAPAN
13.1.4 INDIA
13.1.5 SOUTH KOREA
13.1.6 SINGAPORE
13.1.7 THAILAND
13.1.8 MALAYSIA
13.1.9 INDONESIA
13.1.10 PHILIPPINES
13.1.11 REST OF ASIA-PACIFIC
14 ASIA PACIFIC SPORTS ANALYTICS MARKET: COMPANY LANDSCAPE
14.1 COMPANY SHARE ANALYSIS: ASIA PACIFIC
15 SWOT ANLYSIS
16 COMPANY PROFILE
16.1 SAS INSTITUTE INC.
16.1.1 COMPANY SNAPSHOT
16.1.2 REVENUE ANALYSIS
16.1.3 COMPANY SHARE ANALYSIS
16.1.4 SOLUTION PORTFOLIO
16.1.5 RECENT DEVELOPMENTS
16.2 IBM CORPORATION
16.2.1 COMPANY SNAPSHOT
16.2.2 REVENUE ANALYSIS
16.2.3 COMPANY SHARE ANALYSIS
16.2.4 TECHNOLOGY PORTFOLIO
16.2.5 RECENT DEVELOPMENTS
16.3 TABLEAU SOFTWARE, LLC, A SALESFORCE COMPANY
16.3.1 COMPANY SNAPSHOT
16.3.2 COMPANY SHARE ANALYSIS
16.3.3 SOLUTION PORTFOLIO
16.3.4 RECENT DEVELOPMENTS
16.4 SAP SE
16.4.1 COMPANY SNAPSHOT
16.4.2 COMPANY SHARE ANALYSIS
16.4.3 REVENUE ANALYSIS
16.4.4 PRODUCT PORTFOLIO
16.4.5 RECENT DEVELOPMENTS
16.5 HCL TECHNOLOGIES LIMITED
16.5.1 COMPANY SNAPSHOT
16.5.2 REVENUE ANALYSIS
16.5.3 COMPANY SHARE ANALYSIS
16.5.4 SERVICE PORTFOLIO
16.5.5 RECENT DEVELOPMENTS
16.6 CATAPULT GROUP INTERNATIONAL LTD
16.6.1 COMPANY SNAPSHOT
16.6.2 REVENUE ANALYSIS
16.6.3 PRODUCT PORTFOLIO
16.6.4 RECENT DEVELOPMENTS
16.7 DATAART
16.7.1 COMPANY SNAPSHOT
16.7.2 PRODUCT PORTFOLIO
16.7.3 RECENT DEVELOPMENT
16.8 EXASOL
16.8.1 COMPANY SNAPSHOT
16.8.2 REVENUE ANALYSIS
16.8.3 SOLUTION PORTFOLIO
16.8.4 RECENT DEVELOPMENT
16.9 EXPERFY, INC.
16.9.1 COMPANY SNAPSHOT
16.9.2 PRODUCT PORTFOLIO
16.9.3 RECENT DEVELOPMENT
16.1 ASIA PACIFICSTEP, LLC
16.10.1 COMPANY SNAPSHOT
16.10.2 SERVICE PORTFOLIO
16.10.3 RECENT DEVELOPMENTS
16.11 ICEBERG SPORTS ANALYTICS
16.11.1 COMPANY SNAPSHOT
16.11.2 SERVICE PORTFOLIO
16.11.3 RECENT DEVELOPMENTS
16.12 ORACLE
16.12.1 COMPANY SNAPSHOT
16.12.2 REVENUE ANALYSIS
16.12.3 PRODUCT PORTFOLIO
16.12.4 RECENT DEVELOPMENTS
16.13 ORRECO
16.13.1 COMPANY SNAPSHOT
16.13.2 PRODUCT PORTFOLIO
16.13.3 RECENT DEVELOPMENTS
16.14 QUALITAS ASIA PACIFIC
16.14.1 COMPANY SNAPSHOT
16.14.2 SERVICE PORTFOLIO
16.14.3 RECENT DEVELOPMENT
16.15 SPORTRADAR AG, ST. GALLEN, SWITZERLAND
16.15.1 COMPANY SNAPSHOT
16.15.2 PRODUCT PORTFOLIO
16.15.3 RECENT DEVELOPMENTS
16.16 SPORTSMECHANICS
16.16.1 COMPANY SNAPSHOT
16.16.2 SERVICE PORTFOLIO
16.16.3 RECENT DEVELOPMENT
16.17 STATS PERFORM
16.17.1 COMPANY SNAPSHOT
16.17.2 SERVICE PORTFOLIO
16.17.3 RECENT DEVELOPMENTS
16.18 SYNERGY SPORTS
16.18.1 COMPANY SNAPSHOT
16.18.2 PRODUCT PORTFOLIO
16.18.3 RECENT DEVELOPMENTS
16.19 TRUMEDIA NETWORKS, INC.
16.19.1 COMPANY SNAPSHOT
16.19.2 SERVICE PORTFOLIO
16.19.3 RECENT DEVELOPMENT
16.2 ZEBRA TECHNOLOGIES CORP.
16.20.1 COMPANY SNAPSHOT
16.20.2 REVENUE ANALYSIS
16.20.3 PRODUCT PORTFOLIO
16.20.4 RECENT DEVELOPMENT
17 QUESTIONNAIRE
18 RELATED REPORTS
Lista de Tablas
TABLE 1 ASIA PACIFIC SPORTS ANALYTICS MARKET, BY COMPONENT, 2020-2029 (USD MILLION)
TABLE 2 ASIA PACIFIC SOFTWARE/PLATFORM IN SPORTS ANALYTICS MARKET, BY REGION, 2020-2029 (USD MILLION)
TABLE 3 ASIA PACIFIC SERVICES IN SPORTS ANALYTICS MARKET, BY REGION, 2020-2029 (USD MILLION)
TABLE 4 ASIA PACIFIC SERVICES IN SPORTS ANALYTICS MARKET, BY COMPONENT, 2020-2029 (USD MILLION)
TABLE 5 ASIA PACIFIC PROFESSIONAL SERVICES IN SPORTS ANALYTICS MARKET, BY COMPONENT, 2020-2029 (USD MILLION)
TABLE 6 ASIA PACIFIC SPORTS ANALYTICS MARKET, BY SPORTS TYPE, 2020-2029 (USD MILLION)
TABLE 7 ASIA PACIFIC TEAM SPORTS IN SPORTS ANALYTICS MARKET, BY REGION, 2020-2029 (USD MILLION)
TABLE 8 ASIA PACIFIC TEAM SPORTS IN SPORTS ANALYTICS MARKET, BY SPORTS TYPE, 2020-2029 (USD MILLION)
TABLE 9 ASIA PACIFIC INDIVIDUAL SPORTS IN SPORTS ANALYTICS MARKET, BY REGION, 2020-2029 (USD MILLION)
TABLE 10 ASIA PACIFIC INDIVIDUAL SPORTS IN SPORTS ANALYTICS MARKET, BY SPORTS TYPE, 2020-2029 (USD MILLION)
TABLE 11 ASIA PACIFIC SPORTS ANALYTICS MARKET, BY APPLICATION, 2020-2029 (USD MILLION)
TABLE 12 ASIA PACIFIC PLAYER & TEAM VALUATION IN SPORTS ANALYTICS MARKET, BY REGION, 2020-2029 (USD MILLION)
TABLE 13 ASIA PACIFIC PLAYER & TEAM VALUATION IN SPORTS ANALYTICS MARKET, BY APPLICATION, 2020-2029 (USD MILLION)
TABLE 14 ASIA PACIFIC PERFORMANCE ANALYTICS IN SPORTS ANALYTICS MARKET, BY REGION, 2020-2029 (USD MILLION)
TABLE 15 ASIA PACIFIC PERFORMANCE ANALYTICS IN SPORTS ANALYTICS MARKET, BY APPLICATION, 2020-2029 (USD MILLION)
TABLE 16 ASIA PACIFIC HEALTH ASSESSMENT IN SPORTS ANALYTICS MARKET, BY REGION, 2020-2029 (USD MILLION)
TABLE 17 ASIA PACIFIC HEALTH ASSESSMENT IN SPORTS ANALYTICS MARKET, BY APPLICATION, 2020-2029 (USD MILLION)
TABLE 18 ASIA PACIFIC FAN ENGAGEMENT IN SPORTS ANALYTICS MARKET, BY REGION, 2020-2029 (USD MILLION)
TABLE 19 ASIA PACIFIC FAN ENGAGEMENT IN SPORTS ANALYTICS MARKET, BY APPLICATION, 2020-2029 (USD MILLION)
TABLE 20 ASIA PACIFIC BROADCAST MANAGEMENT IN SPORTS ANALYTICS MARKET, BY REGION, 2020-2029 (USD MILLION)
TABLE 21 ASIA PACIFIC BROADCAST MANAGEMENT IN SPORTS ANALYTICS MARKET, BY APPLICATION, 2020-2029 (USD MILLION)
TABLE 22 ASIA PACIFIC VIDEO ANALYSIS IN SPORTS ANALYTICS MARKET, BY REGION, 2020-2029 (USD MILLION)
TABLE 23 ASIA PACIFIC VIDEO ANALYSIS IN SPORTS ANALYTICS MARKET, BY APPLICATION, 2020-2029 (USD MILLION)
TABLE 24 ASIA PACIFIC OTHERS IN SPORTS ANALYTICS MARKET, BY REGION, 2020-2029 (USD MILLION)
TABLE 25 ASIA PACIFIC OTHERS IN SPORTS ANALYTICS MARKET, BY APPLICATION, 2020-2029 (USD MILLION)
TABLE 26 ASIA PACIFIC SPORTS ANALYTICS MARKET, BY DEPLOYMENT, 2020-2029 (USD MILLION)
TABLE 27 ASIA PACIFIC CLOUD IN SPORTS ANALYTICS MARKET, BY REGION, 2020-2029 (USD MILLION)
TABLE 28 ASIA PACIFIC ON-PREMISE IN SPORTS ANALYTICS MARKET, BY REGION, 2020-2029 (USD MILLION)
TABLE 29 ASIA PACIFIC SPORTS ANALYTICS MARKET, BY ORGANIZATION MODE, 2020-2029 (USD MILLION)
TABLE 30 ASIA PACIFIC LARGE ENTERPRISE IN SPORTS ANALYTICS MARKET, BY REGION, 2020-2029 (USD MILLION)
TABLE 31 ASIA PACIFIC SME’S IN SPORTS ANALYTICS MARKET, BY REGION, 2020-2029 (USD MILLION)
TABLE 32 ASIA PACIFIC SPORTS ANALYTICS MARKET, BY ANALYSIS TYPE, 2020-2029 (USD MILLION)
TABLE 33 ASIA PACIFIC ON-FIELD IN SPORTS ANALYTICS MARKET, BY REGION, 2020-2029 (USD MILLION)
TABLE 34 ASIA PACIFIC OFF-FIELD IN SPORTS ANALYTICS MARKET, BY REGION, 2020-2029 (USD MILLION)
TABLE 35 ASIA-PACIFIC SPORTS ANALYTICS MARKET, BY COUNTRY, 2020-2029 (USD MILLION)
TABLE 36 ASIA-PACIFIC SPORTS ANALYTICS MARKET, BY COMPONENT, 2020-2029 (USD MILLION)
TABLE 37 ASIA-PACIFIC SERVICES IN SPORTS ANALYTICS MARKET, BY COMPONENT, 2020-2029 (USD MILLION)
TABLE 38 ASIA-PACIFIC PROFESSIONAL SERVICES IN SPORTS ANALYTICS MARKET, BY COMPONENT, 2020-2029 (USD MILLION)
TABLE 39 ASIA-PACIFIC SPORTS ANALYTICS MARKET, BY SPORTS TYPE, 2020-2029 (USD MILLION)
TABLE 40 ASIA-PACIFIC TEAM SPORTS IN SPORTS ANALYTICS MARKET, BY SPORTS TYPE, 2020-2029 (USD MILLION)
TABLE 41 ASIA-PACIFIC INDIVIDUAL SPORTS IN SPORTS ANALYTICS MARKET, BY SPORTS TYPE, 2020-2029 (USD MILLION)
TABLE 42 ASIA-PACIFIC SPORTS ANALYTICS MARKET, BY APPLICATION, 2020-2029 (USD MILLION)
TABLE 43 ASIA-PACIFIC PLAYER & TEAM VALUATION IN SPORTS ANALYTICS MARKET, BY APPLICATION, 2020-2029 (USD MILLION)
TABLE 44 ASIA-PACIFIC PERFORMANCE ANALYTICS IN SPORTS ANALYTICS MARKET, BY APPLICATION, 2020-2029 (USD MILLION)
TABLE 45 ASIA-PACIFIC HEALTH ASSESSMENT IN SPORTS ANALYTICS MARKET, BY APPLICATION, 2020-2029 (USD MILLION)
TABLE 46 ASIA-PACIFIC FAN ENGAGEMENT IN SPORTS ANALYTICS MARKET, BY APPLICATION, 2020-2029 (USD MILLION)
TABLE 47 ASIA-PACIFIC BROADCAST MANAGEMENT IN SPORTS ANALYTICS MARKET, BY APPLICATION, 2020-2029 (USD MILLION)
TABLE 48 ASIA-PACIFIC VIDEO ANALYSIS IN SPORTS ANALYTICS MARKET, BY APPLICATION, 2020-2029 (USD MILLION)
TABLE 49 ASIA-PACIFIC OTHERS IN SPORTS ANALYTICS MARKET, BY APPLICATION, 2020-2029 (USD MILLION)
TABLE 50 ASIA-PACIFIC SPORTS ANALYTICS MARKET, BY DEPLOYMENT, 2020-2029 (USD MILLION)
TABLE 51 ASIA-PACIFIC SPORTS ANALYTICS MARKET, BY ORGANIZATION MODE, 2020-2029 (USD MILLION)
TABLE 52 ASIA-PACIFIC SPORTS ANALYTICS MARKET, BY ANALYSIS TYPE, 2020-2029 (USD MILLION)
TABLE 53 CHINA SPORTS ANALYTICS MARKET, BY COMPONENT, 2020-2029 (USD MILLION)
TABLE 54 CHINA SERVICES IN SPORTS ANALYTICS MARKET, BY COMPONENT, 2020-2029 (USD MILLION)
TABLE 55 CHINA PROFESSIONAL SERVICES IN SPORTS ANALYTICS MARKET, BY COMPONENT, 2020-2029 (USD MILLION)
TABLE 56 CHINA SPORTS ANALYTICS MARKET, BY SPORTS TYPE, 2020-2029 (USD MILLION)
TABLE 57 CHINA TEAM SPORTS IN SPORTS ANALYTICS MARKET, BY SPORTS TYPE, 2020-2029 (USD MILLION)
TABLE 58 CHINA INDIVIDUAL SPORTS IN SPORTS ANALYTICS MARKET, BY SPORTS TYPE, 2020-2029 (USD MILLION)
TABLE 59 CHINA SPORTS ANALYTICS MARKET, BY APPLICATION, 2020-2029 (USD MILLION)
TABLE 60 CHINA PLAYER & TEAM VALUATION IN SPORTS ANALYTICS MARKET, BY APPLICATION, 2020-2029 (USD MILLION)
TABLE 61 CHINA PERFORMANCE ANALYTICS IN SPORTS ANALYTICS MARKET, BY APPLICATION, 2020-2029 (USD MILLION)
TABLE 62 CHINA HEALTH ASSESSMENT IN SPORTS ANALYTICS MARKET, BY APPLICATION, 2020-2029 (USD MILLION)
TABLE 63 CHINA FAN ENGAGEMENT IN SPORTS ANALYTICS MARKET, BY APPLICATION, 2020-2029 (USD MILLION)
TABLE 64 CHINA BROADCAST MANAGEMENT IN SPORTS ANALYTICS MARKET, BY APPLICATION, 2020-2029 (USD MILLION)
TABLE 65 CHINA VIDEO ANALYSIS IN SPORTS ANALYTICS MARKET, BY APPLICATION, 2020-2029 (USD MILLION)
TABLE 66 CHINA OTHERS IN SPORTS ANALYTICS MARKET, BY APPLICATION, 2020-2029 (USD MILLION)
TABLE 67 CHINA SPORTS ANALYTICS MARKET, BY DEPLOYMENT, 2020-2029 (USD MILLION)
TABLE 68 CHINA SPORTS ANALYTICS MARKET, BY ORGANIZATION MODE, 2020-2029 (USD MILLION)
TABLE 69 CHINA SPORTS ANALYTICS MARKET, BY ANALYSIS TYPE, 2020-2029 (USD MILLION)
TABLE 70 AUSTRALIA SPORTS ANALYTICS MARKET, BY COMPONENT, 2020-2029 (USD MILLION)
TABLE 71 AUSTRALIA SERVICES IN SPORTS ANALYTICS MARKET, BY COMPONENT, 2020-2029 (USD MILLION)
TABLE 72 AUSTRALIA PROFESSIONAL SERVICES IN SPORTS ANALYTICS MARKET, BY COMPONENT, 2020-2029 (USD MILLION)
TABLE 73 AUSTRALIA SPORTS ANALYTICS MARKET, BY SPORTS TYPE, 2020-2029 (USD MILLION)
TABLE 74 AUSTRALIA TEAM SPORTS IN SPORTS ANALYTICS MARKET, BY SPORTS TYPE, 2020-2029 (USD MILLION)
TABLE 75 AUSTRALIA INDIVIDUAL SPORTS IN SPORTS ANALYTICS MARKET, BY SPORTS TYPE, 2020-2029 (USD MILLION)
TABLE 76 AUSTRALIA SPORTS ANALYTICS MARKET, BY APPLICATION, 2020-2029 (USD MILLION)
TABLE 77 AUSTRALIA PLAYER & TEAM VALUATION IN SPORTS ANALYTICS MARKET, BY APPLICATION, 2020-2029 (USD MILLION)
TABLE 78 AUSTRALIA PERFORMANCE ANALYTICS IN SPORTS ANALYTICS MARKET, BY APPLICATION, 2020-2029 (USD MILLION)
TABLE 79 AUSTRALIA HEALTH ASSESSMENT IN SPORTS ANALYTICS MARKET, BY APPLICATION, 2020-2029 (USD MILLION)
TABLE 80 AUSTRALIA FAN ENGAGEMENT IN SPORTS ANALYTICS MARKET, BY APPLICATION, 2020-2029 (USD MILLION)
TABLE 81 AUSTRALIA BROADCAST MANAGEMENT IN SPORTS ANALYTICS MARKET, BY APPLICATION, 2020-2029 (USD MILLION)
TABLE 82 AUSTRALIA VIDEO ANALYSIS IN SPORTS ANALYTICS MARKET, BY APPLICATION, 2020-2029 (USD MILLION)
TABLE 83 AUSTRALIA OTHERS IN SPORTS ANALYTICS MARKET, BY APPLICATION, 2020-2029 (USD MILLION)
TABLE 84 AUSTRALIA SPORTS ANALYTICS MARKET, BY DEPLOYMENT, 2020-2029 (USD MILLION)
TABLE 85 AUSTRALIA SPORTS ANALYTICS MARKET, BY ORGANIZATION MODE, 2020-2029 (USD MILLION)
TABLE 86 AUSTRALIA SPORTS ANALYTICS MARKET, BY ANALYSIS TYPE, 2020-2029 (USD MILLION)
TABLE 87 JAPAN SPORTS ANALYTICS MARKET, BY COMPONENT, 2020-2029 (USD MILLION)
TABLE 88 JAPAN SERVICES IN SPORTS ANALYTICS MARKET, BY COMPONENT, 2020-2029 (USD MILLION)
TABLE 89 JAPAN PROFESSIONAL SERVICES IN SPORTS ANALYTICS MARKET, BY COMPONENT, 2020-2029 (USD MILLION)
TABLE 90 JAPAN SPORTS ANALYTICS MARKET, BY SPORTS TYPE, 2020-2029 (USD MILLION)
TABLE 91 JAPAN TEAM SPORTS IN SPORTS ANALYTICS MARKET, BY SPORTS TYPE, 2020-2029 (USD MILLION)
TABLE 92 JAPAN INDIVIDUAL SPORTS IN SPORTS ANALYTICS MARKET, BY SPORTS TYPE, 2020-2029 (USD MILLION)
TABLE 93 JAPAN SPORTS ANALYTICS MARKET, BY APPLICATION, 2020-2029 (USD MILLION)
TABLE 94 JAPAN PLAYER & TEAM VALUATION IN SPORTS ANALYTICS MARKET, BY APPLICATION, 2020-2029 (USD MILLION)
TABLE 95 JAPAN PERFORMANCE ANALYTICS IN SPORTS ANALYTICS MARKET, BY APPLICATION, 2020-2029 (USD MILLION)
TABLE 96 JAPAN HEALTH ASSESSMENT IN SPORTS ANALYTICS MARKET, BY APPLICATION, 2020-2029 (USD MILLION)
TABLE 97 JAPAN FAN ENGAGEMENT IN SPORTS ANALYTICS MARKET, BY APPLICATION, 2020-2029 (USD MILLION)
TABLE 98 JAPAN BROADCAST MANAGEMENT IN SPORTS ANALYTICS MARKET, BY APPLICATION, 2020-2029 (USD MILLION)
TABLE 99 JAPAN VIDEO ANALYSIS IN SPORTS ANALYTICS MARKET, BY APPLICATION, 2020-2029 (USD MILLION)
TABLE 100 JAPAN OTHERS IN SPORTS ANALYTICS MARKET, BY APPLICATION, 2020-2029 (USD MILLION)
TABLE 101 JAPAN SPORTS ANALYTICS MARKET, BY DEPLOYMENT, 2020-2029 (USD MILLION)
TABLE 102 JAPAN SPORTS ANALYTICS MARKET, BY ORGANIZATION MODE, 2020-2029 (USD MILLION)
TABLE 103 JAPAN SPORTS ANALYTICS MARKET, BY ANALYSIS TYPE, 2020-2029 (USD MILLION)
TABLE 104 INDIA SPORTS ANALYTICS MARKET, BY COMPONENT, 2020-2029 (USD MILLION)
TABLE 105 INDIA SERVICES IN SPORTS ANALYTICS MARKET, BY COMPONENT, 2020-2029 (USD MILLION)
TABLE 106 INDIA PROFESSIONAL SERVICES IN SPORTS ANALYTICS MARKET, BY COMPONENT, 2020-2029 (USD MILLION)
TABLE 107 INDIA SPORTS ANALYTICS MARKET, BY SPORTS TYPE, 2020-2029 (USD MILLION)
TABLE 108 INDIA TEAM SPORTS IN SPORTS ANALYTICS MARKET, BY SPORTS TYPE, 2020-2029 (USD MILLION)
TABLE 109 INDIA INDIVIDUAL SPORTS IN SPORTS ANALYTICS MARKET, BY SPORTS TYPE, 2020-2029 (USD MILLION)
TABLE 110 INDIA SPORTS ANALYTICS MARKET, BY APPLICATION, 2020-2029 (USD MILLION)
TABLE 111 INDIA PLAYER & TEAM VALUATION IN SPORTS ANALYTICS MARKET, BY APPLICATION, 2020-2029 (USD MILLION)
TABLE 112 INDIA PERFORMANCE ANALYTICS IN SPORTS ANALYTICS MARKET, BY APPLICATION, 2020-2029 (USD MILLION)
TABLE 113 INDIA HEALTH ASSESSMENT IN SPORTS ANALYTICS MARKET, BY APPLICATION, 2020-2029 (USD MILLION)
TABLE 114 INDIA FAN ENGAGEMENT IN SPORTS ANALYTICS MARKET, BY APPLICATION, 2020-2029 (USD MILLION)
TABLE 115 INDIA BROADCAST MANAGEMENT IN SPORTS ANALYTICS MARKET, BY APPLICATION, 2020-2029 (USD MILLION)
TABLE 116 INDIA VIDEO ANALYSIS IN SPORTS ANALYTICS MARKET, BY APPLICATION, 2020-2029 (USD MILLION)
TABLE 117 INDIA OTHERS IN SPORTS ANALYTICS MARKET, BY APPLICATION, 2020-2029 (USD MILLION)
TABLE 118 INDIA SPORTS ANALYTICS MARKET, BY DEPLOYMENT, 2020-2029 (USD MILLION)
TABLE 119 INDIA SPORTS ANALYTICS MARKET, BY ORGANIZATION MODE, 2020-2029 (USD MILLION)
TABLE 120 INDIA SPORTS ANALYTICS MARKET, BY ANALYSIS TYPE, 2020-2029 (USD MILLION)
TABLE 121 SOUTH KOREA SPORTS ANALYTICS MARKET, BY COMPONENT, 2020-2029 (USD MILLION)
TABLE 122 SOUTH KOREA SERVICES IN SPORTS ANALYTICS MARKET, BY COMPONENT, 2020-2029 (USD MILLION)
TABLE 123 SOUTH KOREA PROFESSIONAL SERVICES IN SPORTS ANALYTICS MARKET, BY COMPONENT, 2020-2029 (USD MILLION)
TABLE 124 SOUTH KOREA SPORTS ANALYTICS MARKET, BY SPORTS TYPE, 2020-2029 (USD MILLION)
TABLE 125 SOUTH KOREA TEAM SPORTS IN SPORTS ANALYTICS MARKET, BY SPORTS TYPE, 2020-2029 (USD MILLION)
TABLE 126 SOUTH KOREA INDIVIDUAL SPORTS IN SPORTS ANALYTICS MARKET, BY SPORTS TYPE, 2020-2029 (USD MILLION)
TABLE 127 SOUTH KOREA SPORTS ANALYTICS MARKET, BY APPLICATION, 2020-2029 (USD MILLION)
TABLE 128 SOUTH KOREA PLAYER & TEAM VALUATION IN SPORTS ANALYTICS MARKET, BY APPLICATION, 2020-2029 (USD MILLION)
TABLE 129 SOUTH KOREA PERFORMANCE ANALYTICS IN SPORTS ANALYTICS MARKET, BY APPLICATION, 2020-2029 (USD MILLION)
TABLE 130 SOUTH KOREA HEALTH ASSESSMENT IN SPORTS ANALYTICS MARKET, BY APPLICATION, 2020-2029 (USD MILLION)
TABLE 131 SOUTH KOREA FAN ENGAGEMENT IN SPORTS ANALYTICS MARKET, BY APPLICATION, 2020-2029 (USD MILLION)
TABLE 132 SOUTH KOREA BROADCAST MANAGEMENT IN SPORTS ANALYTICS MARKET, BY APPLICATION, 2020-2029 (USD MILLION)
TABLE 133 SOUTH KOREA VIDEO ANALYSIS IN SPORTS ANALYTICS MARKET, BY APPLICATION, 2020-2029 (USD MILLION)
TABLE 134 SOUTH KOREA OTHERS IN SPORTS ANALYTICS MARKET, BY APPLICATION, 2020-2029 (USD MILLION)
TABLE 135 SOUTH KOREA SPORTS ANALYTICS MARKET, BY DEPLOYMENT, 2020-2029 (USD MILLION)
TABLE 136 SOUTH KOREA SPORTS ANALYTICS MARKET, BY ORGANIZATION MODE, 2020-2029 (USD MILLION)
TABLE 137 SOUTH KOREA SPORTS ANALYTICS MARKET, BY ANALYSIS TYPE, 2020-2029 (USD MILLION)
TABLE 138 SINGAPORE SPORTS ANALYTICS MARKET, BY COMPONENT, 2020-2029 (USD MILLION)
TABLE 139 SINGAPORE SERVICES IN SPORTS ANALYTICS MARKET, BY COMPONENT, 2020-2029 (USD MILLION)
TABLE 140 SINGAPORE PROFESSIONAL SERVICES IN SPORTS ANALYTICS MARKET, BY COMPONENT, 2020-2029 (USD MILLION)
TABLE 141 SINGAPORE SPORTS ANALYTICS MARKET, BY SPORTS TYPE, 2020-2029 (USD MILLION)
TABLE 142 SINGAPORE TEAM SPORTS IN SPORTS ANALYTICS MARKET, BY SPORTS TYPE, 2020-2029 (USD MILLION)
TABLE 143 SINGAPORE INDIVIDUAL SPORTS IN SPORTS ANALYTICS MARKET, BY SPORTS TYPE, 2020-2029 (USD MILLION)
TABLE 144 SINGAPORE SPORTS ANALYTICS MARKET, BY APPLICATION, 2020-2029 (USD MILLION)
TABLE 145 SINGAPORE PLAYER & TEAM VALUATION IN SPORTS ANALYTICS MARKET, BY APPLICATION, 2020-2029 (USD MILLION)
TABLE 146 SINGAPORE PERFORMANCE ANALYTICS IN SPORTS ANALYTICS MARKET, BY APPLICATION, 2020-2029 (USD MILLION)
TABLE 147 SINGAPORE HEALTH ASSESSMENT IN SPORTS ANALYTICS MARKET, BY APPLICATION, 2020-2029 (USD MILLION)
TABLE 148 SINGAPORE FAN ENGAGEMENT IN SPORTS ANALYTICS MARKET, BY APPLICATION, 2020-2029 (USD MILLION)
TABLE 149 SINGAPORE BROADCAST MANAGEMENT IN SPORTS ANALYTICS MARKET, BY APPLICATION, 2020-2029 (USD MILLION)
TABLE 150 SINGAPORE VIDEO ANALYSIS IN SPORTS ANALYTICS MARKET, BY APPLICATION, 2020-2029 (USD MILLION)
TABLE 151 SINGAPORE OTHERS IN SPORTS ANALYTICS MARKET, BY APPLICATION, 2020-2029 (USD MILLION)
TABLE 152 SINGAPORE SPORTS ANALYTICS MARKET, BY DEPLOYMENT, 2020-2029 (USD MILLION)
TABLE 153 SINGAPORE SPORTS ANALYTICS MARKET, BY ORGANIZATION MODE, 2020-2029 (USD MILLION)
TABLE 154 SINGAPORE SPORTS ANALYTICS MARKET, BY ANALYSIS TYPE, 2020-2029 (USD MILLION)
TABLE 155 THAILAND SPORTS ANALYTICS MARKET, BY COMPONENT, 2020-2029 (USD MILLION)
TABLE 156 THAILAND SERVICES IN SPORTS ANALYTICS MARKET, BY COMPONENT, 2020-2029 (USD MILLION)
TABLE 157 THAILAND PROFESSIONAL SERVICES IN SPORTS ANALYTICS MARKET, BY COMPONENT, 2020-2029 (USD MILLION)
TABLE 158 THAILAND SPORTS ANALYTICS MARKET, BY SPORTS TYPE, 2020-2029 (USD MILLION)
TABLE 159 THAILAND TEAM SPORTS IN SPORTS ANALYTICS MARKET, BY SPORTS TYPE, 2020-2029 (USD MILLION)
TABLE 160 THAILAND INDIVIDUAL SPORTS IN SPORTS ANALYTICS MARKET, BY SPORTS TYPE, 2020-2029 (USD MILLION)
TABLE 161 THAILAND SPORTS ANALYTICS MARKET, BY APPLICATION, 2020-2029 (USD MILLION)
TABLE 162 THAILAND PLAYER & TEAM VALUATION IN SPORTS ANALYTICS MARKET, BY APPLICATION, 2020-2029 (USD MILLION)
TABLE 163 THAILAND PERFORMANCE ANALYTICS IN SPORTS ANALYTICS MARKET, BY APPLICATION, 2020-2029 (USD MILLION)
TABLE 164 THAILAND HEALTH ASSESSMENT IN SPORTS ANALYTICS MARKET, BY APPLICATION, 2020-2029 (USD MILLION)
TABLE 165 THAILAND FAN ENGAGEMENT IN SPORTS ANALYTICS MARKET, BY APPLICATION, 2020-2029 (USD MILLION)
TABLE 166 THAILAND BROADCAST MANAGEMENT IN SPORTS ANALYTICS MARKET, BY APPLICATION, 2020-2029 (USD MILLION)
TABLE 167 THAILAND VIDEO ANALYSIS IN SPORTS ANALYTICS MARKET, BY APPLICATION, 2020-2029 (USD MILLION)
TABLE 168 THAILAND OTHERS IN SPORTS ANALYTICS MARKET, BY APPLICATION, 2020-2029 (USD MILLION)
TABLE 169 THAILAND SPORTS ANALYTICS MARKET, BY DEPLOYMENT, 2020-2029 (USD MILLION)
TABLE 170 THAILAND SPORTS ANALYTICS MARKET, BY ORGANIZATION MODE, 2020-2029 (USD MILLION)
TABLE 171 THAILAND SPORTS ANALYTICS MARKET, BY ANALYSIS TYPE, 2020-2029 (USD MILLION)
TABLE 172 MALAYSIA SPORTS ANALYTICS MARKET, BY COMPONENT, 2020-2029 (USD MILLION)
TABLE 173 MALAYSIA SERVICES IN SPORTS ANALYTICS MARKET, BY COMPONENT, 2020-2029 (USD MILLION)
TABLE 174 MALAYSIA PROFESSIONAL SERVICES IN SPORTS ANALYTICS MARKET, BY COMPONENT, 2020-2029 (USD MILLION)
TABLE 175 MALAYSIA SPORTS ANALYTICS MARKET, BY SPORTS TYPE, 2020-2029 (USD MILLION)
TABLE 176 MALAYSIA TEAM SPORTS IN SPORTS ANALYTICS MARKET, BY SPORTS TYPE, 2020-2029 (USD MILLION)
TABLE 177 MALAYSIA INDIVIDUAL SPORTS IN SPORTS ANALYTICS MARKET, BY SPORTS TYPE, 2020-2029 (USD MILLION)
TABLE 178 MALAYSIA SPORTS ANALYTICS MARKET, BY APPLICATION, 2020-2029 (USD MILLION)
TABLE 179 MALAYSIA PLAYER & TEAM VALUATION IN SPORTS ANALYTICS MARKET, BY APPLICATION, 2020-2029 (USD MILLION)
TABLE 180 MALAYSIA PERFORMANCE ANALYTICS IN SPORTS ANALYTICS MARKET, BY APPLICATION, 2020-2029 (USD MILLION)
TABLE 181 MALAYSIA HEALTH ASSESSMENT IN SPORTS ANALYTICS MARKET, BY APPLICATION, 2020-2029 (USD MILLION)
TABLE 182 MALAYSIA FAN ENGAGEMENT IN SPORTS ANALYTICS MARKET, BY APPLICATION, 2020-2029 (USD MILLION)
TABLE 183 MALAYSIA BROADCAST MANAGEMENT IN SPORTS ANALYTICS MARKET, BY APPLICATION, 2020-2029 (USD MILLION)
TABLE 184 MALAYSIA VIDEO ANALYSIS IN SPORTS ANALYTICS MARKET, BY APPLICATION, 2020-2029 (USD MILLION)
TABLE 185 MALAYSIA OTHERS IN SPORTS ANALYTICS MARKET, BY APPLICATION, 2020-2029 (USD MILLION)
TABLE 186 MALAYSIA SPORTS ANALYTICS MARKET, BY DEPLOYMENT, 2020-2029 (USD MILLION)
TABLE 187 MALAYSIA SPORTS ANALYTICS MARKET, BY ORGANIZATION MODE, 2020-2029 (USD MILLION)
TABLE 188 MALAYSIA SPORTS ANALYTICS MARKET, BY ANALYSIS TYPE, 2020-2029 (USD MILLION)
TABLE 189 INDONESIA SPORTS ANALYTICS MARKET, BY COMPONENT, 2020-2029 (USD MILLION)
TABLE 190 INDONESIA SERVICES IN SPORTS ANALYTICS MARKET, BY COMPONENT, 2020-2029 (USD MILLION)
TABLE 191 INDONESIA PROFESSIONAL SERVICES IN SPORTS ANALYTICS MARKET, BY COMPONENT, 2020-2029 (USD MILLION)
TABLE 192 INDONESIA SPORTS ANALYTICS MARKET, BY SPORTS TYPE, 2020-2029 (USD MILLION)
TABLE 193 INDONESIA TEAM SPORTS IN SPORTS ANALYTICS MARKET, BY SPORTS TYPE, 2020-2029 (USD MILLION)
TABLE 194 INDONESIA INDIVIDUAL SPORTS IN SPORTS ANALYTICS MARKET, BY SPORTS TYPE, 2020-2029 (USD MILLION)
TABLE 195 INDONESIA SPORTS ANALYTICS MARKET, BY APPLICATION, 2020-2029 (USD MILLION)
TABLE 196 INDONESIA PLAYER & TEAM VALUATION IN SPORTS ANALYTICS MARKET, BY APPLICATION, 2020-2029 (USD MILLION)
TABLE 197 INDONESIA PERFORMANCE ANALYTICS IN SPORTS ANALYTICS MARKET, BY APPLICATION, 2020-2029 (USD MILLION)
TABLE 198 INDONESIA HEALTH ASSESSMENT IN SPORTS ANALYTICS MARKET, BY APPLICATION, 2020-2029 (USD MILLION)
TABLE 199 INDONESIA FAN ENGAGEMENT IN SPORTS ANALYTICS MARKET, BY APPLICATION, 2020-2029 (USD MILLION)
TABLE 200 INDONESIA BROADCAST MANAGEMENT IN SPORTS ANALYTICS MARKET, BY APPLICATION, 2020-2029 (USD MILLION)
TABLE 201 INDONESIA VIDEO ANALYSIS IN SPORTS ANALYTICS MARKET, BY APPLICATION, 2020-2029 (USD MILLION)
TABLE 202 INDONESIA OTHERS IN SPORTS ANALYTICS MARKET, BY APPLICATION, 2020-2029 (USD MILLION)
TABLE 203 INDONESIA SPORTS ANALYTICS MARKET, BY DEPLOYMENT, 2020-2029 (USD MILLION)
TABLE 204 INDONESIA SPORTS ANALYTICS MARKET, BY ORGANIZATION MODE, 2020-2029 (USD MILLION)
TABLE 205 INDONESIA SPORTS ANALYTICS MARKET, BY ANALYSIS TYPE, 2020-2029 (USD MILLION)
TABLE 206 PHILIPPINES SPORTS ANALYTICS MARKET, BY COMPONENT, 2020-2029 (USD MILLION)
TABLE 207 PHILIPPINES SERVICES IN SPORTS ANALYTICS MARKET, BY COMPONENT, 2020-2029 (USD MILLION)
TABLE 208 PHILIPPINES PROFESSIONAL SERVICES IN SPORTS ANALYTICS MARKET, BY COMPONENT, 2020-2029 (USD MILLION)
TABLE 209 PHILIPPINES SPORTS ANALYTICS MARKET, BY SPORTS TYPE, 2020-2029 (USD MILLION)
TABLE 210 PHILIPPINES TEAM SPORTS IN SPORTS ANALYTICS MARKET, BY SPORTS TYPE, 2020-2029 (USD MILLION)
TABLE 211 PHILIPPINES INDIVIDUAL SPORTS IN SPORTS ANALYTICS MARKET, BY SPORTS TYPE, 2020-2029 (USD MILLION)
TABLE 212 PHILIPPINES SPORTS ANALYTICS MARKET, BY APPLICATION, 2020-2029 (USD MILLION)
TABLE 213 PHILIPPINES PLAYER & TEAM VALUATION IN SPORTS ANALYTICS MARKET, BY APPLICATION, 2020-2029 (USD MILLION)
TABLE 214 PHILIPPINES PERFORMANCE ANALYTICS IN SPORTS ANALYTICS MARKET, BY APPLICATION, 2020-2029 (USD MILLION)
TABLE 215 PHILIPPINES HEALTH ASSESSMENT IN SPORTS ANALYTICS MARKET, BY APPLICATION, 2020-2029 (USD MILLION)
TABLE 216 PHILIPPINES FAN ENGAGEMENT IN SPORTS ANALYTICS MARKET, BY APPLICATION, 2020-2029 (USD MILLION)
TABLE 217 PHILIPPINES BROADCAST MANAGEMENT IN SPORTS ANALYTICS MARKET, BY APPLICATION, 2020-2029 (USD MILLION)
TABLE 218 PHILIPPINES VIDEO ANALYSIS IN SPORTS ANALYTICS MARKET, BY APPLICATION, 2020-2029 (USD MILLION)
TABLE 219 PHILIPPINES OTHERS IN SPORTS ANALYTICS MARKET, BY APPLICATION, 2020-2029 (USD MILLION)
TABLE 220 PHILIPPINES SPORTS ANALYTICS MARKET, BY DEPLOYMENT, 2020-2029 (USD MILLION)
TABLE 221 PHILIPPINES SPORTS ANALYTICS MARKET, BY ORGANIZATION MODE, 2020-2029 (USD MILLION)
TABLE 222 PHILIPPINES SPORTS ANALYTICS MARKET, BY ANALYSIS TYPE, 2020-2029 (USD MILLION)
TABLE 223 REST OF ASIA-PACIFIC SPORTS ANALYTICS MARKET, BY COMPONENT, 2020-2029 (USD MILLION)
Lista de figuras
FIGURE 1 ASIA PACIFIC SPORTS ANALYTICS MARKET: SEGMENTATION
FIGURE 2 ASIA PACIFIC SPORTS ANALYTICS MARKET: DATA TRIANGULATION
FIGURE 3 ASIA PACIFIC SPORTS ANALYTICS MARKET: DROC ANALYSIS
FIGURE 4 ASIA PACIFIC SPORTS ANALYTICS MARKET: ASIA PACIFIC VS REGIONAL MARKET ANALYSIS
FIGURE 5 ASIA PACIFIC SPORTS ANALYTICS MARKET: COMPANY RESEARCH ANALYSIS
FIGURE 6 ASIA PACIFIC SPORTS ANALYTICS MARKET: INTERVIEW DEMOGRAPHICS
FIGURE 7 ASIA PACIFIC SPORTS ANALYTICS MARKET: DBMR MARKET POSITION GRID
FIGURE 8 ASIA PACIFIC SPORTS ANALYTICS MARKET: VENDOR SHARE ANALYSIS
FIGURE 9 ASIA PACIFIC SPORTS ANALYTICS MARKET: MARKET APPLICATION COVERAGE GRID
FIGURE 10 ASIA PACIFIC SPORTS ANALYTICS MARKET: SEGMENTATION
FIGURE 11 GROWING DEMAND FOR REAL TIME DATA ACCESS IS EXPECTED TO DRIVE THE ASIA PACIFIC SPORTS ANALYTICS MARKET IN THE FORECAST PERIOD OF 2022 TO 2029
FIGURE 12 SOFTWARE/PLATFORM SEGMENT IS EXPECTED TO ACCOUNT FOR THE LARGEST SHARE OF THE ASIA PACIFIC SPORTS ANALYTICS MARKET IN 2022 & 2029
FIGURE 13 DRIVERS, RESTRAINTS, OPPORTUNITIES, AND CHALLENGES OF ASIA PACIFIC SPORTS ANALYTICS MARKET
FIGURE 14 ASIA PACIFIC SPORTS ANALYTICS MARKET: BY COMPONENT, 2021
FIGURE 15 ASIA PACIFIC SPORTS ANALYTICS MARKET: BY SPORTS TYPE, 2021
FIGURE 16 ASIA PACIFIC SPORTS ANALYTICS MARKET: BY APPLICATION, 2021
FIGURE 17 ASIA PACIFIC SPORTS ANALYTICS MARKET: BY DEPLOYMENT, 2021
FIGURE 18 ASIA PACIFIC SPORTS ANALYTICS MARKET: BY ORGANIZATION MODE, 2021
FIGURE 19 ASIA PACIFIC SPORTS ANALYTICS MARKET: BY ANALYSIS TYPE, 2021
FIGURE 20 ASIA-PACIFIC SPORTS ANALYTICS SOFTWARE MARKET: SNAPSHOT (2021)
FIGURE 21 ASIA-PACIFIC SPORTS ANALYTICS SOFTWARE MARKET: BY COUNTRY (2021)
FIGURE 22 ASIA-PACIFIC SPORTS ANALYTICS SOFTWARE MARKET: BY COUNTRY (2022 & 2029)
FIGURE 23 ASIA-PACIFIC SPORTS ANALYTICS SOFTWARE MARKET: BY COUNTRY (2021 & 2029)
FIGURE 24 ASIA-PACIFIC SPORTS ANALYTICS SOFTWARE MARKET: BY COMPONENT (2022-2029)
FIGURE 25 ASIA PACIFIC SPORTS ANALYTICS MARKET: COMPANY SHARE 2021 (%)
Metodología de investigación
La recopilación de datos y el análisis del año base se realizan utilizando módulos de recopilación de datos con muestras de gran tamaño. La etapa incluye la obtención de información de mercado o datos relacionados a través de varias fuentes y estrategias. Incluye el examen y la planificación de todos los datos adquiridos del pasado con antelación. Asimismo, abarca el examen de las inconsistencias de información observadas en diferentes fuentes de información. Los datos de mercado se analizan y estiman utilizando modelos estadísticos y coherentes de mercado. Además, el análisis de la participación de mercado y el análisis de tendencias clave son los principales factores de éxito en el informe de mercado. Para obtener más información, solicite una llamada de un analista o envíe su consulta.
La metodología de investigación clave utilizada por el equipo de investigación de DBMR es la triangulación de datos, que implica la extracción de datos, el análisis del impacto de las variables de datos en el mercado y la validación primaria (experto en la industria). Los modelos de datos incluyen cuadrícula de posicionamiento de proveedores, análisis de línea de tiempo de mercado, descripción general y guía del mercado, cuadrícula de posicionamiento de la empresa, análisis de patentes, análisis de precios, análisis de participación de mercado de la empresa, estándares de medición, análisis global versus regional y de participación de proveedores. Para obtener más información sobre la metodología de investigación, envíe una consulta para hablar con nuestros expertos de la industria.
Personalización disponible
Data Bridge Market Research es líder en investigación formativa avanzada. Nos enorgullecemos de brindar servicios a nuestros clientes existentes y nuevos con datos y análisis que coinciden y se adaptan a sus objetivos. El informe se puede personalizar para incluir análisis de tendencias de precios de marcas objetivo, comprensión del mercado de países adicionales (solicite la lista de países), datos de resultados de ensayos clínicos, revisión de literatura, análisis de mercado renovado y base de productos. El análisis de mercado de competidores objetivo se puede analizar desde análisis basados en tecnología hasta estrategias de cartera de mercado. Podemos agregar tantos competidores sobre los que necesite datos en el formato y estilo de datos que esté buscando. Nuestro equipo de analistas también puede proporcionarle datos en archivos de Excel sin procesar, tablas dinámicas (libro de datos) o puede ayudarlo a crear presentaciones a partir de los conjuntos de datos disponibles en el informe.

