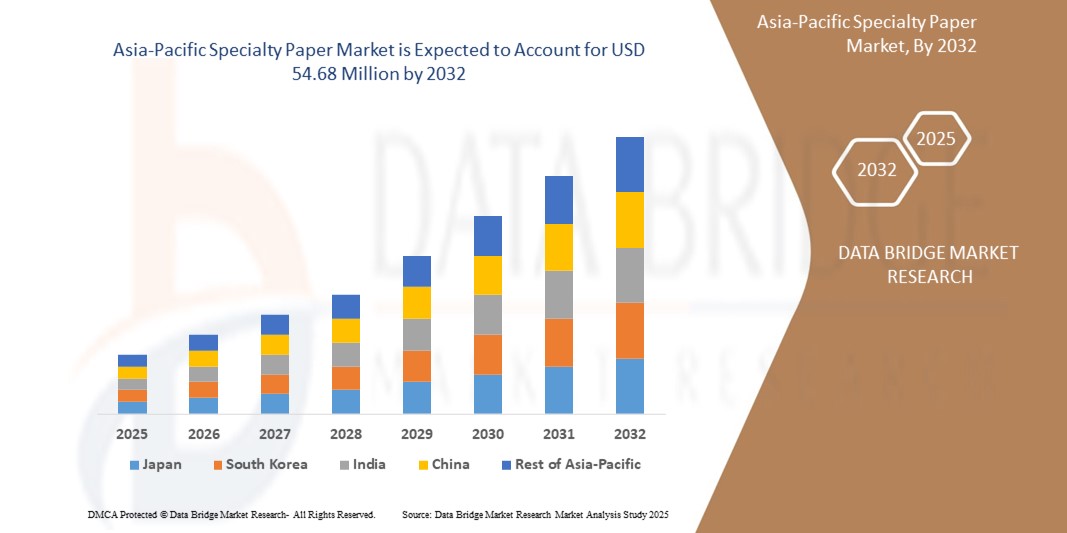
Image

Mercado de papel especial de Asia y el Pacífico: tendencias de la industria y pronóstico hasta 2027

Materiales y embalaje

Image

Mercado de papel especial de Asia y el Pacífico: tendencias de la industria y pronóstico hasta 2027

  • Materiales y embalaje
  • Informe publicado
  • junio de 2020
  • Asia-Pacífico
  • 350 páginas
  • Número de mesas: 249
  • Número de figuras: 24

Mercado de papel especial de Asia y el Pacífico, por tipo de producto (papel de embalaje, papel de liberación y etiquetas, papel de impresión, papel funcional, papel decorativo, papel kraft, papel térmico, papel de filtro, papel autocopiativo, papel para folletos farmacéuticos y otros), materia prima (pulpa) y productos químicos funcionales), aplicación (etiquetas, embalajes, servicios alimentarios, edificación y construcción, industrial, impresiones, aplicaciones médicas, electricidad, automoción y otros), país (China, India, Corea del Sur, Japón, Australia, Malasia, Singapur, Tailandia). , Indonesia, Filipinas, resto de Asia-Pacífico) Tendencias de la industria y pronóstico para 2027

Asia-Pacific Specialty Paper Market Análisis e información del mercado: mercado de papel especial de Asia y el Pacífico

Se espera que el mercado de papel especial gane crecimiento en el período previsto de 2020 a 2027. Data Bridge Market Research analiza que el mercado está creciendo a una tasa compuesta anual del 8,6% en el período previsto de 2020 a 2027 y se espera que alcance los 36.477,48 millones de dólares en 2027. El creciente uso de proteínas de papel especiales en la industria cosmética son los factores para el crecimiento del mercado.

La región de Asia y el Pacífico domina debido a que la población de países como China e India es muy grande, lo que aumenta la demanda de envases entre los consumidores. La creciente demanda del papel especial como ingrediente en diversos papeles de embalaje es otra razón del aumento de la demanda del papel especial.

Este informe de mercado de papel especial proporciona detalles de la participación de mercado, los nuevos desarrollos y el análisis de la cartera de productos, el impacto de los actores del mercado nacional y localizado, analiza las oportunidades en términos de bolsillos de ingresos emergentes, cambios en las regulaciones del mercado, aprobaciones de productos, decisiones estratégicas, lanzamientos de productos. expansiones geográficas e innovaciones tecnológicas en el mercado. Para comprender el análisis y el escenario del mercado contáctenos para una Resumen del analista, nuestro equipo lo ayudará a crear una solución de impacto en los ingresos para lograr el objetivo deseado.

Asia-Pacific Specialty Paper Market Ámbito de Mercado y Tamaño del mercado de Papel especial de Asia y el Pacífico

El mercado de papel especial de Asia y el Pacífico está segmentado según el tipo, la materia prima y la aplicación. El crecimiento entre segmentos le ayuda a analizar nichos de crecimiento y estrategias para acercarse al mercado y determinar sus áreas de aplicación principales y la diferencia en sus mercados objetivo.

  • Según el tipo de producto, el mercado se segmenta en papel de embalaje, papel de liberación y etiquetas, papel de impresión, papel funcional, papel decorativo, papel kraft papel, papel térmico, papel de filtro, papel autocopiativo, papel para folletos farmacéuticos y otros. En Asia y el Pacífico, la demanda del segmento de papel para embalaje domina debido al bajo costo de separación en comparación con el costo incurrido en otros tipos de papel especial.
  • Según la materia prima, el mercado se segmenta en pulpa y productos químicos funcionales. En la región de Asia y el Pacífico, la demanda de pulpa ha crecido muy rápidamente debido a la fácil disponibilidad de pulpa en el mercado.
  • Según la aplicación, el mercado se segmenta en etiquetas, embalajes, servicios alimentarios, edificación y construcción, industrial, imprentas, aplicaciones médicas, electricidad, automoción y otros. En la región de Asia y el Pacífico, la demanda de etiquetas en papel especial ha aumentado debido a la sencilla técnica de procesamiento con moldeo por inyección.

Papel especial Mercado Análisis a nivel de país

Se analiza el mercado de Asia y el Pacífico y se proporciona información sobre el tamaño del mercado por país, tipo de producto, materia prima y aplicación, como se menciona anteriormente.

Los países cubiertos en el informe del mercado de papel especial de Asia y el Pacífico son Japón, China, Corea del Sur, India, Singapur, Tailandia, Indonesia, Malasia, Filipinas, Australia y Nueva Zelanda, Hong Kong, Taiwán y el resto de Asia y el Pacífico.

El mercado de papel especial de Asia y el Pacífico está dominando el mercado debido a la creciente demanda de papel especial como agente suavizante en la industria de la impresión, lo que impulsa la demanda de papel especial en la región.

La sección de países del informe también proporciona factores que impactan el mercado individual y cambios en la regulación en el mercado a nivel nacional que impactan las tendencias actuales y futuras del mercado. Datos como ventas nuevas, ventas de reemplazo, demografía de los países, leyes regulatorias y aranceles de importación y exportación son algunos de los principales indicadores utilizados para pronosticar el escenario del mercado para cada país. Además, se consideran la presencia y disponibilidad de las marcas y los desafíos que enfrentan debido a la competencia grande o escasa de las marcas locales y nacionales, y el impacto de los canales de ventas, al tiempo que se proporciona un análisis de pronóstico de los datos del país.

Aplicación creciente de papel especial para mejorar los parámetros de edificación y construcción

El mercado de papel especial de Asia y el Pacífico también le proporciona un análisis de mercado detallado para cada país, el crecimiento de la base instalada de diferentes tipos de productos para el mercado de papel especial, el impacto de la tecnología que utiliza curvas de línea de vida y los cambios en los escenarios regulatorios de las fórmulas infantiles y su impacto en la especialidad. mercado del papel. Los datos están disponibles para el período histórico 2010 a 2018.

Panorama competitivo y cuota de mercado Análisis Papel especial

El panorama competitivo del mercado de papel especial de Asia y el Pacífico proporciona detalles por competidor. Los detalles incluidos son descripción general de la empresa, finanzas de la empresa, ingresos generados, potencial de mercado, inversión en investigación y desarrollo, nuevas iniciativas de mercado, presencia global, sitios e instalaciones de producción, fortalezas y debilidades de la empresa, lanzamiento de productos, proyectos de ensayos clínicos, análisis de marca, aprobaciones de productos. , patentes, amplitud y amplitud del producto, dominio de la aplicación, curva de línea de vida de la tecnología. Los puntos de datos anteriores proporcionados únicamente están relacionados con el enfoque de la empresa en el mercado de papel especial de Asia y el Pacífico.

Los principales actores cubiertos en el informe del mercado de papel especial de Asia y el Pacífico son Oji Holdings Corporation, International Paper, Domtar Corporation, NIPPON PAPER INDUSTRIES CO., LTD., WestRock Company, Asia Pulp & Paper (APP) Sinar Mas, Fedrigoni Holding Limited y Stora Enso, entre otros actores nacionales y globales. Los analistas de DBMR comprenden las fortalezas competitivas y brindan análisis competitivos para cada competidor por separado.

Por ejemplo,

  • En abril de 2014, OJI Holdings Corporation anunció que tenía el negocio de pulpa y papel de Carter Holt Harvey Limited (“CHH”) para expandir sus negocios en el extranjero. Después de esta adquisición, la empresa mejoró su cartera de productos y generó ingresos adecuados.


SKU-

LISTA DE TABLAS

TABLA 1 SUSTITUTOS DE PAPEL ESPECIALIZADO

TABLA 2 MERCADO DE PAPEL ESPECIALIZADO DE ASIA Y EL PACÍFICO, POR TIPO DE PRODUCTO, 2018-2027 (KILO TONELADAS)

TABLA 3 MERCADO DE PAPEL ESPECIALIZADO DE ASIA Y EL PACÍFICO, POR FORMATO, 2018-2027 (MILLONES DE USD)

TABLA 4 PAPEL PARA EMBALAJE DE ASIA Y EL PACÍFICO EN EL MERCADO DE PAPEL ESPECIAL, POR REGIÓN, 2018-2027 (KILO TONELADAS)

TABLA 5 PAPEL PARA EMBALAJE DE ASIA Y EL PACÍFICO EN EL MERCADO DE PAPEL ESPECIAL, POR REGIÓN, 2018-2027 (MILLONES DE USD)

TABLA 6 LIBERACIÓN Y ETIQUETAS DE ASIA Y EL PACÍFICO EN EL MERCADO DE PAPEL ESPECIAL, POR REGIÓN, 2018-2027 (KILO TONELADAS)

TABLA 7 LANZAMIENTOS Y ETIQUETAS DE ASIA Y EL PACÍFICO EN EL MERCADO DE PAPEL ESPECIAL, POR REGIÓN, 2018-2027 (MILLONES DE USD)

TABLA 8 PAPEL DE IMPRESIÓN DE ASIA Y EL PACÍFICO EN EL MERCADO DE PAPEL ESPECIAL, POR REGIÓN, 2018-2027 (KILO TONELADAS)

TABLA 9 PAPEL DE IMPRESIÓN DE ASIA Y EL PACÍFICO EN EL MERCADO DE PAPEL ESPECIALIZADO, POR REGIÓN, 2018-2027 (MILLONES DE USD)

TABLA 10 PAPEL FUNCIONAL DE ASIA Y EL PACÍFICO EN EL MERCADO DE PAPEL ESPECIAL, POR REGIÓN, 2018-2027 (KILO TONELADAS)

TABLA 11 PAPEL FUNCIONAL DE ASIA Y EL PACÍFICO EN EL MERCADO DE PAPEL ESPECIALIZADO, POR REGIÓN, 2018-2027 (MILLONES DE USD)

TABLA 12 PAPEL PARA DECORACIÓN DE ASIA Y EL PACÍFICO EN EL MERCADO DE PAPEL ESPECIALIZADO, POR REGIÓN, 2018-2027 (KILO TONELADAS)

TABLA 13 PAPEL DE DECORACIÓN DE ASIA Y EL PACÍFICO EN EL MERCADO DE PAPEL ESPECIAL, POR REGIÓN, 2018-2027 (MILLONES DE USD)

TABLA 14 PAPEL KRAFT DE ASIA Y EL PACÍFICO EN EL MERCADO DE PAPEL ESPECIAL, POR REGIÓN, 2018-2027 (KILO TONELADAS)

TABLA 15 PAPEL KRAFT DE ASIA Y EL PACÍFICO EN EL MERCADO DE PAPEL ESPECIAL, POR REGIÓN, 2018-2027 (MILLONES DE USD)

TABLA 16 PAPEL SIN CARBÓN DE ASIA Y EL PACÍFICO EN EL MERCADO DE PAPEL ESPECIAL, POR REGIÓN, 2018-2027 (KILO TONELADAS)

TABLA 17 PAPEL SIN CARBÓN DE ASIA Y EL PACÍFICO EN EL MERCADO DE PAPEL ESPECIAL, POR REGIÓN, 2018-2027 (MILLONES DE USD)

TABLA 18 PAPEL DE FILTRO DE ASIA Y EL PACÍFICO EN EL MERCADO DE PAPEL ESPECIALIZADO, POR REGIÓN, 2018-2027 (KILO TONELADAS)

TABLA 19 PAPEL DE FILTRO DE ASIA Y EL PACÍFICO EN EL MERCADO DE PAPEL ESPECIALIZADO, POR REGIÓN, 2018-2027 (MILLONES DE USD)

TABLA 20 PAPEL TÉRMICO DE ASIA Y EL PACÍFICO EN EL MERCADO DE PAPEL ESPECIALIZADO, POR REGIÓN, 2018-2027 (KILO TONELADAS)

TABLA 21 PAPEL TÉRMICO DE ASIA Y EL PACÍFICO EN EL MERCADO DE PAPEL ESPECIAL, POR REGIÓN, 2018-2027 (MILLONES DE USD)

TABLA 22 PAPEL PARA PROSPECTOS FARMACÉUTICOS DE ASIA Y EL PACÍFICO EN EL MERCADO DE PAPEL DE ESPECIALIDAD, POR REGIÓN, 2018-2027 (KILO TONELADAS)

TABLA 23 PAPEL PARA PROSPECTOS FARMACÉUTICOS DE ASIA Y EL PACÍFICO EN EL MERCADO DE PAPEL ESPECIALIZADO, POR REGIÓN, 2018-2027 (MILLONES DE USD)

TABLA 24 ASIA-PACÍFICO OTROS EN EL MERCADO DE PAPEL ESPECIALIZADO, POR REGIÓN, 2018-2027 (KILO TONELADAS)

TABLA 25 ASIA Y EL PACÍFICO OTROS EN EL MERCADO DE PAPEL ESPECIALIZADO, POR REGIÓN, 2018-2027 (MILLONES DE USD)

TABLA 26 MERCADO DE PAPEL ESPECIALIZADO DE ASIA Y EL PACÍFICO, POR MATERIA PRIMA, 2018-2027 (MILLONES DE USD)

TABLA 27 PULPA DE ASIA Y EL PACÍFICO EN EL MERCADO DE PAPEL ESPECIALIZADO, POR REGIÓN, 2018-2027 (MILLONES DE USD)

TABLA 28 PRODUCTOS QUÍMICOS FUNCIONALES EN EL MERCADO DE PAPEL ESPECIALIZADO DE ASIA Y EL PACÍFICO, POR REGIÓN, 2018-2027 (MILLONES DE USD)

TABLA 29 PRODUCTOS QUÍMICOS FUNCIONALES EN EL MERCADO DE PAPEL ESPECIALIZADO DE ASIA Y EL PACÍFICO, POR MATERIA PRIMA, 2018-2027 (MILLONES DE USD)

TABLA 30 MERCADO DE PAPEL ESPECIALIZADO DE ASIA Y EL PACÍFICO, POR APLICACIÓN, 2018-2027 (MILLONES DE USD)

TABLA 31 ETIQUETA DE ASIA Y EL PACÍFICO EN EL MERCADO DE PAPEL ESPECIALIZADO, POR REGIÓN, 2018-2027 (MILLONES DE USD)

TABLA 32 ETIQUETA DE ASIA Y EL PACÍFICO EN EL MERCADO DE PAPEL ESPECIALIZADO, POR TIPO DE PRODUCTO, 2018-2027 (MILLONES DE USD)

TABLA 33 ENVASES DE ASIA Y EL PACÍFICO EN EL MERCADO DE PAPEL ESPECIAL, POR REGIÓN, 2018-2027 (MILLONES DE USD)

TABLA 34 ENVASES DE ASIA Y EL PACÍFICO EN EL MERCADO DE PAPEL ESPECIAL, POR TIPO DE PRODUCTO, 2018-2027 (MILLONES DE USD)

CUADRO 35 SERVICIOS ALIMENTARIOS DE ASIA Y EL PACÍFICO EN EL MERCADO DE PAPEL ESPECIALIZADO, POR REGIÓN, 2018-2027 (MILLONES DE USD)

TABLA 36 SERVICIOS ALIMENTARIOS DE ASIA Y EL PACÍFICO EN EL MERCADO DE PAPEL ESPECIALIZADO, POR TIPO DE PRODUCTO, 2018-2027 (MILLONES DE USD)

TABLA 37 EDIFICACIÓN Y CONSTRUCCIÓN EN EL MERCADO DE PAPEL ESPECIALIZADO DE ASIA Y EL PACÍFICO, POR REGIÓN, 2018-2027 (MILLONES DE USD)

TABLA 38 EDIFICACIÓN Y CONSTRUCCIÓN EN EL MERCADO DE PAPEL ESPECIALIZADO DE ASIA Y EL PACÍFICO, POR TIPO DE PRODUCTO, 2018-2027 (MILLONES DE USD)

TABLA 39 MERCADO INDUSTRIAL DE PAPEL ESPECIALIZADO DE ASIA Y EL PACÍFICO, POR REGIÓN, 2018-2027 (MILLONES DE USD)

TABLA 40 MERCADO INDUSTRIAL DE PAPEL ESPECIALIZADO DE ASIA Y EL PACÍFICO, POR TIPO DE PRODUCTO, 2018-2027 (MILLONES DE USD)

CUADRO 41 IMPRESIONES EN EL MERCADO DE PAPEL ESPECIALIZADO DE ASIA Y EL PACÍFICO, POR REGIÓN, 2018-2027 (MILLONES DE USD)

TABLA 42 IMPRESIONES EN EL MERCADO DE PAPEL ESPECIALIZADO DE ASIA Y EL PACÍFICO, POR TIPO DE PRODUCTO, 2018-2027 (MILLONES DE USD)

TABLA 43 APLICACIÓN MÉDICA DE ASIA Y EL PACÍFICO EN EL MERCADO DE PAPEL ESPECIALIZADO, POR REGIÓN, 2018-2027 (MILLONES DE USD)

TABLA 44 APLICACIÓN MÉDICA DE ASIA Y EL PACÍFICO EN EL MERCADO DE PAPEL ESPECIALIZADO, POR TIPO DE PRODUCTO, 2018-2027 (MILLONES DE USD)

CUADRO 45 ELÉCTRICOS DE ASIA Y EL PACÍFICO EN EL MERCADO DE PAPEL ESPECIALIZADO, POR REGIÓN, 2018-2027 (MILLONES DE USD)

TABLA 46 ELÉCTRICOS DE ASIA Y EL PACÍFICO EN EL MERCADO DE PAPEL ESPECIAL, POR TIPO DE PRODUCTO, 2018-2027 (MILLONES DE USD)

TABLA 47 ASIA-PACÍFICO AUTOMOTRIZ EN EL MERCADO DE PAPEL ESPECIAL, POR REGIÓN, 2018-2027 (MILLONES DE USD)

TABLA 48 ASIA-PACÍFICO AUTOMOTRIZ EN EL MERCADO DE PAPEL ESPECIAL, POR TIPO DE PRODUCTO, 2018-2027 (MILLONES DE USD)

CUADRO 49 OTROS DE ASIA Y EL PACÍFICO EN EL MERCADO DE PAPEL ESPECIALIZADO, POR REGIÓN, 2018-2027 (MILLONES DE USD)

TABLA 50 OTROS DE ASIA Y EL PACÍFICO EN EL MERCADO DE PAPEL ESPECIALIZADO, POR TIPO DE PRODUCTO, 2018-2027 (MILLONES DE USD)

TABLA 51 MERCADO DE PAPEL ESPECIALIZADO DE ASIA Y EL PACÍFICO, POR REGIÓN, 2018-2027 (KILO TONELADAS)

CUADRO 52 MERCADO DE PAPEL ESPECIALIZADO DE ASIA Y EL PACÍFICO, POR REGIÓN, 2018-2027 (MILLONES DE USD)

TABLA 53 MERCADO DE PAPEL ESPECIALIZADO DE ASIA Y EL PACÍFICO, POR TIPO DE PRODUCTO, 2018-2027 (KILO TONELADAS)

TABLA 54 MERCADO DE PAPEL ESPECIALIZADO DE ASIA Y EL PACÍFICO, POR TIPO DE PRODUCTO, 2018-2027 (MILLONES DE USD)

CUADRO 55 MERCADO DE PAPEL ESPECIALIZADO DE ASIA Y EL PACÍFICO, POR MATERIA PRIMA, 2018-2027 (MILLONES DE USD)

TABLA 56 PRODUCTOS QUÍMICOS FUNCIONALES EN EL MERCADO DE PAPEL ESPECIALIZADO DE ASIA Y EL PACÍFICO, POR MATERIA PRIMA QUÍMICA FUNCIONAL, 2018-2027 (MILLONES DE USD)

CUADRO 57 MERCADO DE PAPEL ESPECIALIZADO DE ASIA Y EL PACÍFICO, POR APLICACIÓN, 2018-2027 (MILLONES DE USD)

TABLA 58 ETIQUETA DE ASIA Y EL PACÍFICO EN EL MERCADO DE PAPEL ESPECIALIZADO, POR TIPO DE PRODUCTO, 2018-2027 (MILLONES DE USD)

TABLA 59 ENVASES DE ASIA Y EL PACÍFICO EN EL MERCADO DE PAPEL ESPECIAL, POR TIPO DE PRODUCTO, 2018-2027 (MILLONES DE USD)

CUADRO 60 SERVICIOS ALIMENTARIOS DE ASIA Y EL PACÍFICO EN EL MERCADO DE PAPEL ESPECIALIZADO, POR TIPO DE PRODUCTO, 2018-2027 (MILLONES DE USD)

TABLA 61 EDIFICACIÓN Y CONSTRUCCIÓN EN EL MERCADO DE PAPEL ESPECIALIZADO DE ASIA Y EL PACÍFICO, POR TIPO DE PRODUCTO, 2018-2027 (MILLONES DE USD)

TABLA 62 MERCADO INDUSTRIAL DE PAPEL ESPECIALIZADO DE ASIA Y EL PACÍFICO, POR TIPO DE PRODUCTO, 2018-2027 (MILLONES DE USD)

TABLA 63 IMPRESIONES EN EL MERCADO DE PAPEL ESPECIALIZADO DE ASIA Y EL PACÍFICO, POR TIPO DE PRODUCTO, 2018-2027 (MILLONES DE USD)

TABLA 64 APLICACIÓN MÉDICA DE ASIA Y EL PACÍFICO EN EL MERCADO DE PAPEL ESPECIALIZADO, POR TIPO DE PRODUCTO, 2018-2027 (MILLONES DE USD)

TABLA 65 ELÉCTRICOS DE ASIA Y EL PACÍFICO EN EL MERCADO DE PAPEL ESPECIAL, POR TIPO DE PRODUCTO, 2018-2027 (MILLONES DE USD)

TABLA 66 ASIA-PACÍFICO AUTOMOTRIZ EN EL MERCADO DE PAPEL ESPECIAL, POR TIPO DE PRODUCTO, 2018-2027 (MILLONES DE USD)

TABLA 67 ASIA Y EL PACÍFICO OTROS EN EL MERCADO DE PAPEL ESPECIALIZADO, POR TIPO DE PRODUCTO, 2018-2027 (MILLONES DE USD)

TABLA 68 MERCADO DE PAPEL ESPECIALIZADO DE CHINA, POR TIPO DE PRODUCTO, 2018-2027 (KILO TONELADAS)

TABLA 69 MERCADO DE PAPEL ESPECIAL DE CHINA, POR TIPO DE PRODUCTO, 2018-2027 (MILLONES DE USD)

CUADRO 70 MERCADO DE PAPEL ESPECIALIZADO DE CHINA, POR MATERIA PRIMA, 2018-2027 (MILLONES DE USD)

TABLA 71 QUÍMICO FUNCIONAL EN EL MERCADO DE PAPEL DE ESPECIALIDAD DE CHINA, POR MATERIA PRIMA QUÍMICA FUNCIONAL, 2018-2027 (MILLONES DE USD)

CUADRO 72 MERCADO DE PAPEL ESPECIALIZADO DE CHINA, POR APLICACIÓN, 2018-2027 (MILLONES DE USD)

TABLA 73 ETIQUETA DE CHINA EN EL MERCADO DE PAPEL DE ESPECIALIDAD, POR TIPO DE PRODUCTO, 2018-2027 (MILLONES DE USD)

TABLA 74 EMBALAJE DE CHINA EN EL MERCADO DE PAPEL ESPECIALIZADO, POR TIPO DE PRODUCTO, 2018-2027 (MILLONES DE USD)

CUADRO 75 SERVICIOS DE ALIMENTOS DE CHINA EN EL MERCADO DE PAPEL ESPECIALIZADO, POR TIPO DE PRODUCTO, 2018-2027 (MILLONES DE USD)

TABLA 76 EDIFICACIÓN Y CONSTRUCCIÓN DE CHINA EN EL MERCADO DE PAPEL ESPECIALIZADO, POR TIPO DE PRODUCTO, 2018-2027 (MILLONES DE USD)

TABLA 77 MERCADO INDUSTRIAL DE CHINA EN PAPEL ESPECIALIZADO, POR TIPO DE PRODUCTO, 2018-2027 (MILLONES DE USD)

TABLA 78 IMPRESIONES EN CHINA EN EL MERCADO DE PAPEL ESPECIALIZADO, POR TIPO DE PRODUCTO, 2018-2027 (MILLONES DE USD)

TABLA 79 APLICACIÓN MÉDICA DE CHINA EN EL MERCADO DE PAPEL ESPECIALIZADO, POR TIPO DE PRODUCTO, 2018-2027 (MILLONES DE USD)

TABLA 80 ELÉCTRICOS DE CHINA EN EL MERCADO DE PAPEL ESPECIALIZADO, POR TIPO DE PRODUCTO, 2018-2027 (MILLONES DE USD)

TABLA 81 MERCADO AUTOMOTRIZ DE CHINA EN PAPEL ESPECIALIZADO, POR TIPO DE PRODUCTO, 2018-2027 (MILLONES DE USD)

CUADRO 82 CHINA OTROS EN EL MERCADO DE PAPEL ESPECIALIZADO, POR TIPO DE PRODUCTO, 2018-2027 (MILLONES DE USD)

TABLA 83 MERCADO DE PAPEL ESPECIALIZADO DE JAPÓN, POR TIPO DE PRODUCTO, 2018-2027 (KILO TONELADAS)

TABLA 84 MERCADO DE PAPEL ESPECIALIZADO DE JAPÓN, POR TIPO DE PRODUCTO, 2018-2027 (MILLONES DE USD)

CUADRO 85 MERCADO DE PAPEL ESPECIALIZADO DE JAPÓN, POR MATERIA PRIMA, 2018-2027 (MILLONES DE USD)

TABLA 86 PRODUCTOS QUÍMICOS FUNCIONALES EN EL MERCADO DE PAPEL ESPECIALIZADO DE JAPÓN, POR MATERIA PRIMA DE QUÍMICOS FUNCIONALES, 2018-2027 (MILLONES DE USD)

TABLA 87 MERCADO DE PAPEL ESPECIALIZADO DE JAPÓN, POR APLICACIÓN, 2018-2027 (MILLONES DE USD)

TABLA 88 ETIQUETA JAPÓN EN EL MERCADO DE PAPEL ESPECIALIZADO, POR TIPO DE PRODUCTO, 2018-2027 (MILLONES DE USD)

TABLA 89 EMBALAJE JAPÓN EN EL MERCADO DE PAPEL ESPECIAL, POR TIPO DE PRODUCTO, 2018-2027 (MILLONES DE USD)

TABLA 90 SERVICIOS ALIMENTARIOS DE JAPÓN EN EL MERCADO DE PAPEL ESPECIALIZADO, POR TIPO DE PRODUCTO, 2018-2027 (MILLONES DE USD)

TABLA 91 EDIFICACIÓN Y CONSTRUCCIÓN EN EL MERCADO DE PAPEL ESPECIALIZADO EN JAPÓN, POR TIPO DE PRODUCTO, 2018-2027 (MILLONES DE USD)

TABLA 92 MERCADO INDUSTRIAL DE JAPÓN EN PAPEL ESPECIALIZADO, POR TIPO DE PRODUCTO, 2018-2027 (MILLONES DE USD)

TABLA 93 IMPRESIONES JAPONESAS EN EL MERCADO DE PAPEL ESPECIALIZADO, POR TIPO DE PRODUCTO, 2018-2027 (MILLONES DE USD)

TABLA 94 APLICACIÓN MÉDICA DE JAPÓN EN EL MERCADO DE PAPEL ESPECIALIZADO, POR TIPO DE PRODUCTO, 2018-2027 (MILLONES DE USD)

TABLA 95 ELÉCTRICOS JAPONES EN EL MERCADO DE PAPEL ESPECIALIZADO, POR TIPO DE PRODUCTO, 2018-2027 (MILLONES DE USD)

TABLA 96 MERCADO DE PAPEL ESPECIALIZADO DE LA AUTOMOCIÓN EN JAPÓN, POR TIPO DE PRODUCTO, 2018-2027 (MILLONES DE USD)

TABLA 97 OTROS EN EL MERCADO DE PAPEL ESPECIALIZADO DE JAPÓN, POR TIPO DE PRODUCTO, 2018-2027 (MILLONES DE USD)

TABLA 98 MERCADO DE PAPEL ESPECIALIZADO DE COREA DEL SUR, POR TIPO DE PRODUCTO, 2018-2027 (KILO TONELADAS)

TABLA 99 MERCADO DE PAPEL ESPECIAL DE COREA DEL SUR, POR TIPO DE PRODUCTO, 2018-2027 (MILLONES DE USD)

CUADRO 100 MERCADO DE PAPEL ESPECIALIZADO DE COREA DEL SUR, POR MATERIA PRIMA, 2018-2027 (MILLONES DE USD)

TABLA 101 QUÍMICO FUNCIONAL DE COREA DEL SUR EN EL MERCADO DE PAPEL ESPECIAL, POR MATERIA PRIMA QUÍMICA FUNCIONAL, 2018-2027 (MILLONES DE USD)

TABLA 102 MERCADO DE PAPEL ESPECIAL DE COREA DEL SUR, POR APLICACIÓN, 2018-2027 (MILLONES DE USD)

TABLA 103 ETIQUETA DE COREA DEL SUR EN EL MERCADO DE PAPEL ESPECIAL, POR TIPO DE PRODUCTO, 2018-2027 (MILLONES DE USD)

TABLA 104 EMBALAJE DE COREA DEL SUR EN EL MERCADO DE PAPEL ESPECIAL, POR TIPO DE PRODUCTO, 2018-2027 (MILLONES DE USD)

CUADRO 105 SERVICIOS ALIMENTARIOS DE COREA DEL SUR EN EL MERCADO DE PAPEL ESPECIALIZADO, POR TIPO DE PRODUCTO, 2018-2027 (MILLONES DE USD)

TABLA 106 EDIFICACIÓN Y CONSTRUCCIÓN DE COREA DEL SUR EN EL MERCADO DE PAPEL ESPECIALIZADO, POR TIPO DE PRODUCTO, 2018-2027 (MILLONES DE USD)

TABLA 107 MERCADO INDUSTRIAL DE PAPEL ESPECIALIZADO DE COREA DEL SUR, POR TIPO DE PRODUCTO, 2018-2027 (MILLONES DE USD)

TABLA 108 IMPRESIONES DE COREA DEL SUR EN EL MERCADO DE PAPEL ESPECIAL, POR TIPO DE PRODUCTO, 2018-2027 (MILLONES DE USD)

TABLA 109 APLICACIÓN MÉDICA DE COREA DEL SUR EN EL MERCADO DE PAPEL ESPECIALIZADO, POR TIPO DE PRODUCTO, 2018-2027 (MILLONES DE USD)

TABLA 110 PRODUCTOS ELÉCTRICOS DE COREA DEL SUR EN EL MERCADO DE PAPEL ESPECIAL, POR TIPO DE PRODUCTO, 2018-2027 (MILLONES DE USD)

TABLA 111 MERCADO AUTOMOTRIZ DE COREA DEL SUR EN PAPEL ESPECIAL, POR TIPO DE PRODUCTO, 2018-2027 (MILLONES DE USD)

TABLA 112 COREA DEL SUR OTROS EN EL MERCADO DE PAPEL ESPECIALIZADO, POR TIPO DE PRODUCTO, 2018-2027 (MILLONES DE USD)

TABLA 113 MERCADO DE PAPEL ESPECIAL DE LA INDIA, POR TIPO DE PRODUCTO, 2018-2027 (KILO TONELADAS)

TABLA 114 MERCADO DE PAPEL ESPECIAL DE LA INDIA, POR TIPO DE PRODUCTO, 2018-2027 (MILLONES DE USD)

CUADRO 115 MERCADO DE PAPEL ESPECIAL DE LA INDIA, POR MATERIA PRIMA, 2018-2027 (MILLONES DE USD)

TABLA 116 PRODUCTO QUÍMICO FUNCIONAL DE LA INDIA EN EL MERCADO DE PAPEL ESPECIALIZADO, POR MATERIA PRIMA QUÍMICA FUNCIONAL, 2018-2027 (MILLONES DE USD)

CUADRO 117 MERCADO DE PAPEL ESPECIAL DE LA INDIA, POR APLICACIÓN, 2018-2027 (MILLONES DE USD)

TABLA 118 ETIQUETA DE LA INDIA EN EL MERCADO DE PAPEL ESPECIALIZADO, POR TIPO DE PRODUCTO, 2018-2027 (MILLONES DE USD)

TABLA 119 EMBALAJE DE LA INDIA EN EL MERCADO DE PAPEL ESPECIALIZADO, POR TIPO DE PRODUCTO, 2018-2027 (MILLONES DE USD)

CUADRO 120 SERVICIOS ALIMENTARIOS DE LA INDIA EN EL MERCADO DE PAPEL ESPECIALIZADO, POR TIPO DE PRODUCTO, 2018-2027 (MILLONES DE USD)

TABLA 121 EDIFICACIÓN Y CONSTRUCCIÓN DE LA INDIA EN EL MERCADO DE PAPEL ESPECIALIZADO, POR TIPO DE PRODUCTO, 2018-2027 (MILLONES DE USD)

TABLA 122 MERCADO INDUSTRIAL DE PAPEL ESPECIALIZADO DE LA INDIA, POR TIPO DE PRODUCTO, 2018-2027 (MILLONES DE USD)

TABLA 123 IMPRESIONES DE LA INDIA EN EL MERCADO DE PAPEL ESPECIALIZADO, POR TIPO DE PRODUCTO, 2018-2027 (MILLONES DE USD)

TABLA 124 APLICACIÓN MÉDICA DE LA INDIA EN EL MERCADO DE PAPEL ESPECIALIZADO, POR TIPO DE PRODUCTO, 2018-2027 (MILLONES DE USD)

TABLA 125 PRODUCTOS ELÉCTRICOS DE LA INDIA EN EL MERCADO DE PAPEL ESPECIALIZADO, POR TIPO DE PRODUCTO, 2018-2027 (MILLONES DE USD)

TABLA 126 MERCADO AUTOMOTRIZ DE LA INDIA EN PAPEL ESPECIAL, POR TIPO DE PRODUCTO, 2018-2027 (MILLONES DE USD)

CUADRO 127 INDIA OTROS EN EL MERCADO DE PAPEL ESPECIALIZADO, POR TIPO DE PRODUCTO, 2018-2027 (MILLONES DE USD)

TABLA 128 MERCADO DE PAPEL ESPECIAL DE INDONESIA, POR TIPO DE PRODUCTO, 2018-2027 (KILO TONELADAS)

TABLA 129 MERCADO DE PAPEL ESPECIAL DE INDONESIA, POR TIPO DE PRODUCTO, 2018-2027 (MILLONES DE USD)

CUADRO 130 MERCADO DE PAPEL ESPECIAL DE INDONESIA, POR MATERIA PRIMA, 2018-2027 (MILLONES DE USD)

TABLA 131 QUÍMICO FUNCIONAL EN EL MERCADO DE PAPEL DE ESPECIALIDAD DE INDONESIA, POR MATERIA PRIMA QUÍMICA FUNCIONAL, 2018-2027 (MILLONES DE USD)

CUADRO 132 MERCADO DE PAPEL ESPECIAL DE INDONESIA, POR APLICACIÓN, 2018-2027 (MILLONES DE USD)

TABLA 133 ETIQUETA DE INDONESIA EN EL MERCADO DE PAPEL ESPECIALIZADO, POR TIPO DE PRODUCTO, 2018-2027 (MILLONES DE USD)

TABLA 134 EMBALAJE DE INDONESIA EN EL MERCADO DE PAPEL ESPECIAL, POR TIPO DE PRODUCTO, 2018-2027 (MILLONES DE USD)

CUADRO 135 SERVICIOS DE ALIMENTACIÓN DE INDONESIA EN EL MERCADO DE PAPEL ESPECIALIZADO, POR TIPO DE PRODUCTO, 2018-2027 (MILLONES DE USD)

TABLA 136 EDIFICACIÓN Y CONSTRUCCIÓN DE INDONESIA EN EL MERCADO DE PAPEL ESPECIALIZADO, POR TIPO DE PRODUCTO, 2018-2027 (MILLONES DE USD)

TABLA 137 MERCADO INDUSTRIAL DE PAPEL ESPECIALIZADO DE INDONESIA, POR TIPO DE PRODUCTO, 2018-2027 (MILLONES DE USD)

TABLA 138 IMPRESIONES EN EL MERCADO DE PAPEL ESPECIALIZADO DE INDONESIA, POR TIPO DE PRODUCTO, 2018-2027 (MILLONES DE USD)

TABLA 139 SOLICITUD MÉDICA DE INDONESIA EN EL MERCADO DE PAPEL ESPECIALIZADO, POR TIPO DE PRODUCTO, 2018-2027 (MILLONES DE USD)

TABLA 140 PRODUCTOS ELÉCTRICOS DE INDONESIA EN EL MERCADO DE PAPEL ESPECIALIZADO, POR TIPO DE PRODUCTO, 2018-2027 (MILLONES DE USD)

TABLA 141 MERCADO AUTOMOTRIZ DE INDONESIA EN PAPEL ESPECIAL, POR TIPO DE PRODUCTO, 2018-2027 (MILLONES DE USD)

CUADRO 142 INDONESIA OTROS EN EL MERCADO DE PAPEL ESPECIALIZADO, POR TIPO DE PRODUCTO, 2018-2027 (MILLONES DE USD)

TABLA 143 MERCADO DE PAPEL ESPECIAL DE AUSTRALIA Y NUEVA ZELANDA, POR TIPO DE PRODUCTO, 2018-2027 (KILO TONELADAS)

CUADRO 144 MERCADO DE PAPEL ESPECIAL DE AUSTRALIA Y NUEVA ZELANDA, POR TIPO DE PRODUCTO, 2018-2027 (MILLONES DE USD)

CUADRO 145 MERCADO DE PAPEL ESPECIAL DE AUSTRALIA Y NUEVA ZELANDA, POR MATERIA PRIMA, 2018-2027 (MILLONES DE USD)

TABLA 146 PRODUCTOS QUÍMICOS FUNCIONALES EN AUSTRALIA Y NUEVA ZELANDA EN EL MERCADO DE PAPEL ESPECIAL, POR MATERIA PRIMA DE QUÍMICOS FUNCIONALES, 2018-2027 (MILLONES DE USD)

CUADRO 147 MERCADO DE PAPEL ESPECIAL DE AUSTRALIA Y NUEVA ZELANDA, POR APLICACIÓN, 2018-2027 (MILLONES DE USD)

TABLA 148 ETIQUETA DE AUSTRALIA Y NUEVA ZELANDA EN EL MERCADO DE PAPEL ESPECIAL, POR TIPO DE PRODUCTO, 2018-2027 (MILLONES DE USD)

TABLA 149 ENVASES DE AUSTRALIA Y NUEVA ZELANDA EN EL MERCADO DE PAPEL ESPECIAL, POR TIPO DE PRODUCTO, 2018-2027 (MILLONES DE USD)

CUADRO 150 SERVICIOS ALIMENTARIOS DE AUSTRALIA Y NUEVA ZELANDA EN EL MERCADO DE PAPEL ESPECIALIZADO, POR TIPO DE PRODUCTO, 2018-2027 (MILLONES DE USD)

CUADRO 151 AUSTRALIA Y NUEVA ZELANDA EDIFICACIÓN Y CONSTRUCCIÓN EN EL MERCADO DE PAPEL ESPECIALIZADO, POR TIPO DE PRODUCTO, 2018-2027 (MILLONES DE USD)

TABLA 152 MERCADO INDUSTRIAL DE PAPEL ESPECIALIZADO DE AUSTRALIA Y NUEVA ZELANDA, POR TIPO DE PRODUCTO, 2018-2027 (MILLONES DE USD)

CUADRO 153 IMPRESIONES DE AUSTRALIA Y NUEVA ZELANDA EN EL MERCADO DE PAPEL ESPECIAL, POR TIPO DE PRODUCTO, 2018-2027 (MILLONES DE USD)

TABLA 154 APLICACIÓN MÉDICA DE AUSTRALIA Y NUEVA ZELANDA EN EL MERCADO DE PAPEL ESPECIALIZADO, POR TIPO DE PRODUCTO, 2018-2027 (MILLONES DE USD)

CUADRO 155 PRODUCTOS ELÉCTRICOS DE AUSTRALIA Y NUEVA ZELANDA EN EL MERCADO DE PAPEL ESPECIALIZADO, POR TIPO DE PRODUCTO, 2018-2027 (MILLONES DE USD)

TABLA 156 AUTOMOTRIZ DE AUSTRALIA Y NUEVA ZELANDA EN EL MERCADO DE PAPEL ESPECIAL, POR TIPO DE PRODUCTO, 2018-2027 (MILLONES DE USD)

CUADRO 157 AUSTRALIA Y NUEVA ZELANDA OTROS EN EL MERCADO DE PAPEL ESPECIAL, POR TIPO DE PRODUCTO, 2018-2027 (MILLONES DE USD)

TABLA 158 MERCADO DE PAPEL ESPECIALIZADO DE TAIWÁN, POR TIPO DE PRODUCTO, 2018-2027 (KILO TONELADAS)

TABLA 159 MERCADO DE PAPEL ESPECIAL DE TAIWÁN, POR TIPO DE PRODUCTO, 2018-2027 (MILLONES DE USD)

CUADRO 160 MERCADO DE PAPEL ESPECIALIZADO DE TAIWÁN, POR MATERIA PRIMA, 2018-2027 (MILLONES DE USD)

TABLA 161 QUÍMICO FUNCIONAL EN EL MERCADO DE PAPEL DE ESPECIALIDAD DE TAIWÁN, POR MATERIA PRIMA QUÍMICA FUNCIONAL, 2018-2027 (MILLONES DE USD)

CUADRO 162 MERCADO DE PAPEL ESPECIALIZADO DE TAIWÁN, POR APLICACIÓN, 2018-2027 (MILLONES DE USD)

TABLA 163 ETIQUETA DE TAIWÁN EN EL MERCADO DE PAPEL ESPECIALIZADO, POR TIPO DE PRODUCTO, 2018-2027 (MILLONES DE USD)

TABLA 164 EMBALAJE DE TAIWÁN EN EL MERCADO DE PAPEL ESPECIALIZADO, POR TIPO DE PRODUCTO, 2018-2027 (MILLONES DE USD)

CUADRO 165 SERVICIOS ALIMENTARIOS DE TAIWÁN EN EL MERCADO DE PAPEL ESPECIALIZADO, POR TIPO DE PRODUCTO, 2018-2027 (MILLONES DE USD)

TABLA 166 EDIFICACIÓN Y CONSTRUCCIÓN DE TAIWÁN EN EL MERCADO DE PAPEL ESPECIALIZADO, POR TIPO DE PRODUCTO, 2018-2027 (MILLONES DE USD)

TABLA 167 MERCADO INDUSTRIAL DE TAIWÁN EN PAPEL ESPECIAL, POR TIPO DE PRODUCTO, 2018-2027 (MILLONES DE USD)

TABLA 168 IMPRESIONES DE TAIWÁN EN EL MERCADO DE PAPEL ESPECIALIZADO, POR TIPO DE PRODUCTO, 2018-2027 (MILLONES DE USD)

TABLA 169 APLICACIÓN MÉDICA DE TAIWÁN EN EL MERCADO DE PAPEL ESPECIALIZADO, POR TIPO DE PRODUCTO, 2018-2027 (MILLONES DE USD)

TABLA 170 PRODUCTOS ELÉCTRICOS DE TAIWÁN EN EL MERCADO DE PAPEL ESPECIALIZADO, POR TIPO DE PRODUCTO, 2018-2027 (MILLONES DE USD)

TABLA 171 MERCADO DE PAPEL ESPECIALIZADO DE LA AUTOMOCIÓN DE TAIWÁN, POR TIPO DE PRODUCTO, 2018-2027 (MILLONES DE USD)

TABLA 172 TAIWÁN OTROS EN EL MERCADO DE PAPEL ESPECIALIZADO, POR TIPO DE PRODUCTO, 2018-2027 (MILLONES DE USD)

TABLA 173 MERCADO DE PAPEL ESPECIAL DE TAILANDIA, POR TIPO DE PRODUCTO, 2018-2027 (KILO TONELADAS)

TABLA 174 MERCADO DE PAPEL ESPECIAL DE TAILANDIA, POR TIPO DE PRODUCTO, 2018-2027 (MILLONES DE USD)

CUADRO 175 MERCADO DE PAPEL ESPECIALIZADO DE TAILANDIA, POR MATERIA PRIMA, 2018-2027 (MILLONES DE USD)

TABLA 176 QUÍMICO FUNCIONAL EN EL MERCADO DE PAPEL DE ESPECIALIDAD DE TAILANDIA, POR MATERIA PRIMA DE QUÍMICO FUNCIONAL, 2018-2027 (MILLONES DE USD)

CUADRO 177 MERCADO DE PAPEL ESPECIALIZADO DE TAILANDIA, POR APLICACIÓN, 2018-2027 (MILLONES DE USD)

TABLA 178 ETIQUETA DE TAILANDIA EN EL MERCADO DE PAPEL ESPECIALIZADO, POR TIPO DE PRODUCTO, 2018-2027 (MILLONES DE USD)

TABLA 179 EMBALAJE DE TAILANDIA EN EL MERCADO DE PAPEL ESPECIAL, POR TIPO DE PRODUCTO, 2018-2027 (MILLONES DE USD)

CUADRO 180 SERVICIOS DE ALIMENTACIÓN DE TAILANDIA EN EL MERCADO DE PAPEL ESPECIALIZADO, POR TIPO DE PRODUCTO, 2018-2027 (MILLONES DE USD)

TABLA 181 EDIFICACIÓN Y CONSTRUCCIÓN DE TAILANDIA EN EL MERCADO DE PAPEL ESPECIALIZADO, POR TIPO DE PRODUCTO, 2018-2027 (MILLONES DE USD)

TABLA 182 MERCADO INDUSTRIAL DE TAILANDIA EN PAPEL ESPECIAL, POR TIPO DE PRODUCTO, 2018-2027 (MILLONES DE USD)

CUADRO 183 IMPRESIONES DE TAILANDIA EN EL MERCADO DE PAPEL ESPECIALIZADO, POR TIPO DE PRODUCTO, 2018-2027 (MILLONES DE USD)

TABLA 184 SOLICITUD MÉDICA DE TAILANDIA EN EL MERCADO DE PAPEL ESPECIALIZADO, POR TIPO DE PRODUCTO, 2018-2027 (MILLONES DE USD)

TABLA 185 PRODUCTOS ELÉCTRICOS DE TAILANDIA EN EL MERCADO DE PAPEL ESPECIALIZADO, POR TIPO DE PRODUCTO, 2018-2027 (MILLONES DE USD)

TABLA 186 MERCADO AUTOMOTRIZ DE TAILANDIA EN PAPEL ESPECIAL, POR TIPO DE PRODUCTO, 2018-2027 (MILLONES DE USD)

CUADRO 187 TAILANDIA OTROS EN EL MERCADO DE PAPEL ESPECIALIZADO, POR TIPO DE PRODUCTO, 2018-2027 (MILLONES DE USD)

TABLA 188 MERCADO DE PAPEL ESPECIALIZADO DE MALASIA, POR TIPO DE PRODUCTO, 2018-2027 (KILO TONELADAS)

CUADRO 189 MERCADO DE PAPEL ESPECIALIZADO DE MALASIA, POR TIPO DE PRODUCTO, 2018-2027 (MILLONES DE USD)

CUADRO 190 MERCADO DE PAPEL ESPECIAL DE MALASIA, POR MATERIA PRIMA, 2018-2027 (MILLONES DE USD)

TABLA 191 QUÍMICO FUNCIONAL EN EL MERCADO DE PAPEL DE ESPECIALIDAD DE MALASIA, POR MATERIA PRIMA QUÍMICA FUNCIONAL, 2018-2027 (MILLONES DE USD)

CUADRO 192 MERCADO DE PAPEL ESPECIALIZADO DE MALASIA, POR APLICACIÓN, 2018-2027 (MILLONES DE USD)

TABLA 193 ETIQUETA DE MALASIA EN EL MERCADO DE PAPEL ESPECIALIZADO, POR TIPO DE PRODUCTO, 2018-2027 (MILLONES DE USD)

TABLA 194 EMBALAJE DE MALASIA EN EL MERCADO DE PAPEL ESPECIAL, POR TIPO DE PRODUCTO, 2018-2027 (MILLONES DE USD)

CUADRO 195 SERVICIOS ALIMENTARIOS DE MALASIA EN EL MERCADO DE PAPEL ESPECIALIZADO, POR TIPO DE PRODUCTO, 2018-2027 (MILLONES DE USD)

TABLA 196 EDIFICACIÓN Y CONSTRUCCIÓN DE MALASIA EN EL MERCADO DE PAPEL ESPECIALIZADO, POR TIPO DE PRODUCTO, 2018-2027 (MILLONES DE USD)

TABLA 197 MERCADO INDUSTRIAL DE MALASIA EN PAPEL ESPECIALIZADO, POR TIPO DE PRODUCTO, 2018-2027 (MILLONES DE USD)

TABLA 198 IMPRESIONES DE MALASIA EN EL MERCADO DE PAPEL ESPECIALIZADO, POR TIPO DE PRODUCTO, 2018-2027 (MILLONES DE USD)

TABLA 199 APLICACIÓN MÉDICA DE MALASIA EN EL MERCADO DE PAPEL ESPECIALIZADO, POR TIPO DE PRODUCTO, 2018-2027 (MILLONES DE USD)

TABLA 200 PRODUCTOS ELÉCTRICOS DE MALASIA EN EL MERCADO DE PAPEL ESPECIAL, POR TIPO DE PRODUCTO, 2018-2027 (MILLONES DE USD)

TABLA 201 MERCADO AUTOMOTRIZ DE MALASIA EN PAPEL ESPECIAL, POR TIPO DE PRODUCTO, 2018-2027 (MILLONES DE USD)

TABLA 202 MALASIA OTROS EN EL MERCADO DE PAPEL ESPECIALIZADO, POR TIPO DE PRODUCTO, 2018-2027 (MILLONES DE USD)

TABLA 203 MERCADO DE PAPEL ESPECIALIZADO DE FILIPINAS, POR TIPO DE PRODUCTO, 2018-2027 (KILO TONELADAS)

CUADRO 204 MERCADO DE PAPEL ESPECIALIZADO DE FILIPINAS, POR TIPO DE PRODUCTO, 2018-2027 (MILLONES DE USD)

CUADRO 205 MERCADO DE PAPEL ESPECIALIZADO DE FILIPINAS, POR MATERIA PRIMA, 2018-2027 (MILLONES DE USD)

CUADRO 206 QUÍMICO FUNCIONAL EN EL MERCADO DE PAPEL DE ESPECIALIDAD DE FILIPINAS, POR MATERIA PRIMA QUÍMICA FUNCIONAL, 2018-2027 (MILLONES DE USD)

CUADRO 207 MERCADO DE PAPEL ESPECIALIZADO DE FILIPINAS, POR APLICACIÓN, 2018-2027 (MILLONES DE USD)

TABLA 208 ETIQUETA DE FILIPINAS EN EL MERCADO DE PAPEL ESPECIALIZADO, POR TIPO DE PRODUCTO, 2018-2027 (MILLONES DE USD)

TABLA 209 EMBALAJE DE FILIPINAS EN EL MERCADO DE PAPEL ESPECIAL, POR TIPO DE PRODUCTO, 2018-2027 (MILLONES DE USD)

CUADRO 210 SERVICIOS DE ALIMENTACIÓN DE FILIPINAS EN EL MERCADO DE PAPEL ESPECIALIZADO, POR TIPO DE PRODUCTO, 2018-2027 (MILLONES DE USD)

CUADRO 211 EDIFICACIÓN Y CONSTRUCCIÓN DE FILIPINAS EN EL MERCADO DE PAPEL ESPECIALIZADO, POR TIPO DE PRODUCTO, 2018-2027 (MILLONES DE USD)

CUADRO 212 MERCADO INDUSTRIAL DE PAPEL ESPECIALIZADO DE FILIPINAS, POR TIPO DE PRODUCTO, 2018-2027 (MILLONES DE USD)

CUADRO 213 IMPRESIONES EN FILIPINAS EN EL MERCADO DE PAPEL ESPECIALIZADO, POR TIPO DE PRODUCTO, 2018-2027 (MILLONES DE USD)

TABLA 214 APLICACIÓN MÉDICA DE FILIPINAS EN EL MERCADO DE PAPEL ESPECIALIZADO, POR TIPO DE PRODUCTO, 2018-2027 (MILLONES DE USD)

CUADRO 215 ELÉCTRICOS DE FILIPINAS EN EL MERCADO DE PAPEL ESPECIALIZADO, POR TIPO DE PRODUCTO, 2018-2027 (MILLONES DE USD)

TABLA 216 FILIPINAS AUTOMOTRIZ EN EL MERCADO DE PAPEL ESPECIAL, POR TIPO DE PRODUCTO, 2018-2027 (MILLONES DE USD)

CUADRO 217 FILIPINAS OTROS EN EL MERCADO DE PAPEL ESPECIALIZADO, POR TIPO DE PRODUCTO, 2018-2027 (MILLONES DE USD)

TABLA 218 MERCADO DE PAPEL ESPECIALIZADO DE HONG KONG, POR TIPO DE PRODUCTO, 2018-2027 (KILO TONELADAS)

TABLA 219 MERCADO DE PAPEL ESPECIALIZADO DE HONG KONG, POR TIPO DE PRODUCTO, 2018-2027 (MILLONES DE USD)

CUADRO 220 MERCADO DE PAPEL ESPECIALIZADO DE HONG KONG, POR MATERIA PRIMA, 2018-2027 (MILLONES DE USD)

TABLA 221 QUÍMICO FUNCIONAL EN EL MERCADO DE PAPEL DE ESPECIALIDAD DE HONG KONG, POR MATERIA PRIMA QUÍMICA FUNCIONAL, 2018-2027 (MILLONES DE USD)

CUADRO 222 MERCADO DE PAPEL ESPECIALIZADO DE HONG KONG, POR APLICACIÓN, 2018-2027 (MILLONES DE USD)

TABLA 223 ETIQUETAS DE HONG KONG EN EL MERCADO DE PAPEL ESPECIALIZADO, POR TIPO DE PRODUCTO, 2018-2027 (MILLONES DE USD)

TABLA 224 EMBALAJE DE HONG KONG EN EL MERCADO DE PAPEL ESPECIALIZADO, POR TIPO DE PRODUCTO, 2018-2027 (MILLONES DE USD)

CUADRO 225 SERVICIOS DE ALIMENTACIÓN DE HONG KONG EN EL MERCADO DE PAPEL ESPECIALIZADO, POR TIPO DE PRODUCTO, 2018-2027 (MILLONES DE USD)

TABLA 226 EDIFICACIÓN Y CONSTRUCCIÓN DE HONG KONG EN EL MERCADO DE PAPEL ESPECIALIZADO, POR TIPO DE PRODUCTO, 2018-2027 (MILLONES DE USD)

TABLA 227 MERCADO INDUSTRIAL DE PAPEL ESPECIALIZADO DE HONG KONG, POR TIPO DE PRODUCTO, 2018-2027 (MILLONES DE USD)

TABLA 228 IMPRESIONES DE HONG KONG EN EL MERCADO DE PAPEL ESPECIALIZADO, POR TIPO DE PRODUCTO, 2018-2027 (MILLONES DE USD)

TABLA 229 APLICACIÓN MÉDICA DE HONG KONG EN EL MERCADO DE PAPEL ESPECIALIZADO, POR TIPO DE PRODUCTO, 2018-2027 (MILLONES DE USD)

TABLA 230 ELÉCTRICOS DE HONG KONG EN EL MERCADO DE PAPEL ESPECIALIZADO, POR TIPO DE PRODUCTO, 2018-2027 (MILLONES DE USD)

TABLA 231 MERCADO AUTOMOTRIZ DE HONG KONG EN PAPEL ESPECIAL, POR TIPO DE PRODUCTO, 2018-2027 (MILLONES DE USD)

TABLA 232 OTROS DE HONG KONG EN EL MERCADO DE PAPEL ESPECIALIZADO, POR TIPO DE PRODUCTO, 2018-2027 (MILLONES DE USD)

TABLA 233 MERCADO DE PAPEL ESPECIALIZADO DE SINGAPUR, POR TIPO DE PRODUCTO, 2018-2027 (KILO TONELADAS)

TABLA 234 MERCADO DE PAPEL ESPECIALIZADO DE SINGAPUR, POR TIPO DE PRODUCTO, 2018-2027 (MILLONES DE USD)

CUADRO 235 MERCADO DE PAPEL ESPECIALIZADO DE SINGAPUR, POR MATERIA PRIMA, 2018-2027 (MILLONES DE USD)

TABLA 236 QUÍMICO FUNCIONAL EN EL MERCADO DE PAPEL DE ESPECIALIDAD DE SINGAPUR, POR MATERIA PRIMA QUÍMICA FUNCIONAL, 2018-2027 (MILLONES DE USD)

CUADRO 237 MERCADO DE PAPEL ESPECIALIZADO DE SINGAPUR, POR APLICACIÓN, 2018-2027 (MILLONES DE USD)

TABLA 238 ETIQUETA DE SINGAPUR EN EL MERCADO DE PAPEL ESPECIALIZADO, POR TIPO DE PRODUCTO, 2018-2027 (MILLONES DE USD)

TABLA 239 EMBALAJE DE SINGAPUR EN EL MERCADO DE PAPEL ESPECIAL, POR TIPO DE PRODUCTO, 2018-2027 (MILLONES DE USD)

TABLA 240 SERVICIOS DE ALIMENTACIÓN DE SINGAPUR EN EL MERCADO DE PAPEL ESPECIALIZADO, POR TIPO DE PRODUCTO, 2018-2027 (MILLONES DE USD)

TABLA 241 EDIFICACIÓN Y CONSTRUCCIÓN DE SINGAPUR EN EL MERCADO DE PAPEL ESPECIALIZADO, POR TIPO DE PRODUCTO, 2018-2027 (MILLONES DE USD)

TABLA 242 MERCADO INDUSTRIAL DE SINGAPUR EN PAPEL ESPECIALIZADO, POR TIPO DE PRODUCTO, 2018-2027 (MILLONES DE USD)

TABLA 243 IMPRESIONES DE SINGAPUR EN EL MERCADO DE PAPEL ESPECIALIZADO, POR TIPO DE PRODUCTO, 2018-2027 (MILLONES DE USD)

TABLA 244 SOLICITUD MÉDICA DE SINGAPUR EN EL MERCADO DE PAPEL ESPECIALIZADO, POR TIPO DE PRODUCTO, 2018-2027 (MILLONES DE USD)

TABLA 245 ELÉCTRICOS DE SINGAPUR EN EL MERCADO DE PAPEL ESPECIALIZADO, POR TIPO DE PRODUCTO, 2018-2027 (MILLONES DE USD)

TABLA 246 MERCADO AUTOMOTRIZ DE SINGAPUR EN PAPEL ESPECIAL, POR TIPO DE PRODUCTO, 2018-2027 (MILLONES DE USD)

TABLA 247 OTROS DE SINGAPUR EN EL MERCADO DE PAPEL ESPECIALIZADO, POR TIPO DE PRODUCTO, 2018-2027 (MILLONES DE USD)

TABLA 248 RESTO DEL MERCADO DE PAPEL ESPECIALIZADO DE ASIA-PACÍFICO, POR TIPO DE PRODUCTO, 2018-2027 (KILO TONELADAS)

TABLA 249 RESTO DEL MERCADO DE PAPEL ESPECIALIZADO DE ASIA Y EL PACÍFICO, POR TIPO DE PRODUCTO, 2018-2027 (MILLONES DE USD)


Por favor complete el siguiente formulario para Infografías

Al hacer clic en el botón "Enviar", usted acepta la investigación de mercado de Data Bridge. política de privacidad y Términos y condiciones

Metodología de investigación:

La recopilación de datos y el análisis del año base se realizan mediante módulos de recopilación de datos con muestras de gran tamaño. La etapa incluye la obtención de información de mercado o datos relacionados a través de diversas fuentes y estrategias. Incluye examinar y planificar de antemano todos los datos adquiridos del pasado. Asimismo, abarca el examen de las inconsistencias de la información observadas en diferentes fuentes de información. Los datos de mercado se analizan y estiman utilizando modelos estadísticos y coherentes de mercado. Además, el análisis de la cuota de mercado y el análisis de tendencias clave son los principales factores de éxito en el informe de mercado. Para saber más, solicite una llamada de analista o envíe su consulta.

La metodología de investigación clave utilizada por el equipo de investigación de DBMR es la triangulación de datos, que implica extracción de datos, análisis del impacto de las variables de datos en el mercado y validación primaria (experto de la industria). Los modelos de datos incluyen cuadrícula de posicionamiento de proveedores, análisis de la línea de tiempo del mercado, descripción general y guía del mercado, cuadrícula de posicionamiento de la empresa, análisis de patentes, análisis de precios, análisis de participación de mercado de la empresa, estándares de medición, análisis global versus regional y de participación de proveedores. Para saber más sobre la metodología de investigación, envíe una consulta para hablar con nuestros expertos de la industria.

Por favor complete el siguiente formulario para Metodología de Investigación

Al hacer clic en el botón "Enviar", usted acepta la investigación de mercado de Data Bridge. política de privacidad y Términos y condiciones

Personalización disponible:

Data Bridge Market Research es líder en investigación formativa avanzada. Estamos orgullosos de brindar servicios a nuestros clientes nuevos y existentes con datos y análisis que coinciden y se adaptan a sus objetivos. El informe se puede personalizar para incluir análisis de tendencias de precios de marcas objetivo que comprendan el mercado de países adicionales (solicite la lista de países), datos de resultados de ensayos clínicos, revisión de literatura, mercado renovado y análisis de la base de productos. El análisis de mercado de los competidores objetivo se puede analizar desde análisis basados ​​en tecnología hasta estrategias de cartera de mercado. Podemos agregar tantos competidores sobre los que necesite datos en el formato y estilo de datos que esté buscando. Nuestro equipo de analistas también puede proporcionarle datos en tablas dinámicas de archivos de Excel sin procesar (libro de datos) o puede ayudarlo a crear presentaciones a partir de los conjuntos de datos disponibles en el informe.

Complete el siguiente formulario para personalizar disponible

Al hacer clic en el botón "Enviar", usted acepta la investigación de mercado de Data Bridge. política de privacidad y Términos y condiciones

Obtenga acceso en línea al informe sobre la primera nube de inteligencia de mercado del mundo

  • Panel de análisis de datos interactivo
  • Panel de análisis de la empresa para oportunidades de alto potencial de crecimiento
  • Acceso de analista de investigación para personalización y consultas
  • Análisis de la competencia con panel interactivo
  • Últimas noticias, actualizaciones y análisis de tendencias
  • Aproveche el poder del análisis de referencia para un seguimiento integral de la competencia
Solicitar muestra

HAGA PREGUNTAS FRECUENTES

El mercado de papel especial de Asia y el Pacífico aumentará un 8,6% de CAGR para 2027
Para 2027, el mercado de papel especial de Asia y el Pacífico se expandirá exponencialmente en 36.477,48 millones de dólares.
El informe del mercado de papel especial de Asia y el Pacífico tiene segmentos como tipo, materia prima y aplicación.
Las ubicaciones geográficas centradas en el informe del mercado de papel especial de Asia y el Pacífico son Japón, China, Corea del Sur, India, Singapur, Tailandia, Indonesia, Malasia, Filipinas, Australia y Nueva Zelanda, Hong Kong, Taiwán, etc.
Informe de muestra gratuito

ELEGIR TIPO DE LICENCIA

  • 4200.00
  • 3500.00
  • 2000.00
  • 5500.00
  • 7500.00

Por qué elegirnos

Cobertura de la industria

DBMR trabaja en todo el mundo en múltiples industrias, lo que nos brinda conocimiento en todos los sectores verticales y brinda a nuestros clientes información no solo de su industria sino también de cómo otras industrias afectarán su ecosistema.

Cobertura Regional

La cobertura de Data Bridge no se limita a las economías desarrolladas o emergentes. Trabajamos en todo el mundo cubriendo la mayor variedad de países donde ninguna otra firma de investigación de mercado o consultoría de negocios ha realizado investigaciones; creando oportunidades de crecimiento para nuestros clientes en áreas aún desconocidas.

Cobertura Tecnológica

En el mundo actual, la tecnología impulsa el sentimiento del mercado, por lo que nuestra visión es brindar a nuestros clientes información no solo sobre las tecnologías desarrolladas, sino también sobre los cambios tecnológicos futuros e disruptivos a lo largo del ciclo de vida del producto, brindándoles oportunidades imprevistas en el mercado que crearán disrupciones en su industria. . Esto lleva a la innovación y a que nuestros clientes salgan ganadores.

Soluciones orientadas a objetivos

El objetivo de DBMR es ayudar a nuestros clientes a alcanzar sus objetivos a través de nuestras soluciones; por lo tanto, creamos de manera formativa las soluciones más adecuadas para las necesidades de nuestros clientes, ahorrándoles tiempo y esfuerzos para impulsar sus grandes estrategias.

Soporte de analista incomparable

Nuestros analistas se enorgullecen del éxito de nuestros clientes. A diferencia de otros, creemos en trabajar junto a nuestros clientes para lograr sus objetivos con soporte de analistas las 24 horas para determinar las necesidades correctas e inspirar la innovación a través del servicio.

Banner

testimonios de clientes