
Asia Pacific Preclinical Imaging Market
Tamaño del mercado en miles de millones de dólares
Tasa de crecimiento anual compuesta (CAGR) :
% 
 USD
294.06 Million
USD
451.29 Million
2024
2032
USD
294.06 Million
USD
451.29 Million
2024
2032
| 2025 –2032 | |
| USD 294.06 Million | |
| USD 451.29 Million | |
| % | |
|
Segmentación del mercado de imágenes preclínicas en Asia-Pacífico, por producto (sistemas y servicios), reactivos (reactivos para imágenes ópticas preclínicas, reactivos para imágenes nucleares preclínicas, agentes de contraste para resonancia magnética preclínica, agentes de contraste para ecografía preclínica y agentes de contraste para tomografía computarizada preclínica), aplicación (investigación y desarrollo, descubrimiento de fármacos, biodistribución, detección de células cancerosas, biomarcadores, etc.), usuario final (organización de investigación por contrato, empresas farmacéuticas y biotecnológicas, institutos de investigación académicos y gubernamentales, centros de diagnóstico, etc.): tendencias del sector y pronóstico hasta 2032.
Tamaño del mercado de imágenes preclínicas en Asia-Pacífico
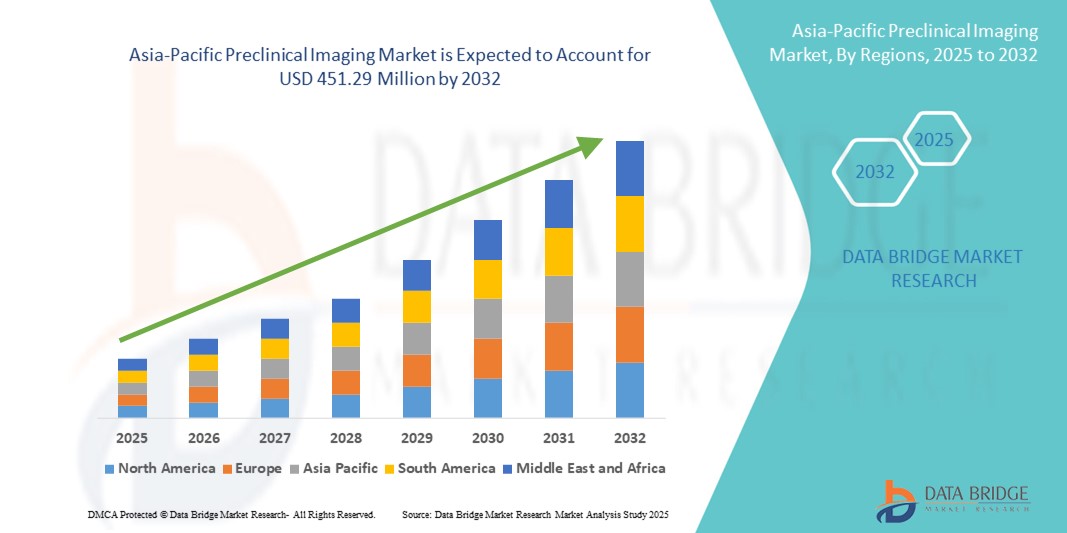
- El tamaño del mercado de imágenes preclínicas de Asia-Pacífico se valoró en USD 294,06 millones en 2024 y se espera que alcance los USD 451,29 millones para 2032 , con una CAGR del 5,50 % durante el período de pronóstico.
- El crecimiento del mercado está impulsado en gran medida por la creciente adopción de modalidades de imágenes avanzadas y la creciente inversión en investigación preclínica y descubrimiento de fármacos en toda la región, particularmente en países como China, Japón e India.
- Además, el creciente enfoque en la investigación traslacional, el diagnóstico precoz de enfermedades y las técnicas de imagen no invasivas está fomentando el uso de sistemas de imagen preclínica en la investigación farmacéutica y biotecnológica . Estos factores convergentes están acelerando la adopción de soluciones de imagen innovadoras, impulsando así significativamente el crecimiento de la industria.
Análisis del mercado de imágenes preclínicas en Asia-Pacífico
- Las imágenes preclínicas, que abarcan modalidades avanzadas como la resonancia magnética, la tomografía computarizada, la tomografía por emisión de positrones (PET) , la tomografía por emisión de positrones (SPECT) y las imágenes ópticas, se están convirtiendo en un componente esencial del descubrimiento de fármacos, la investigación traslacional y el diagnóstico temprano de enfermedades en entornos de investigación académicos, farmacéuticos y biotecnológicos debido a sus capacidades no invasivas, imágenes de alta resolución y capacidad para acelerar los estudios preclínicos.
- La creciente demanda de imágenes preclínicas se ve impulsada principalmente por el aumento de las inversiones en I+D farmacéutica, el enfoque creciente en la medicina de precisión y la creciente adopción de tecnologías de imágenes avanzadas para reducir los plazos de desarrollo de fármacos y mejorar los resultados de la investigación traslacional.
- China dominó el mercado de imágenes preclínicas de Asia-Pacífico con la mayor participación en los ingresos del 39 % en 2024, caracterizado por una financiación gubernamental sustancial para la investigación biomédica, una rápida expansión de la fabricación farmacéutica y la adopción de sistemas de imágenes avanzados en oncología, neurología y estudios de biomarcadores .
- Se espera que India sea el país de más rápido crecimiento en el mercado de imágenes preclínicas de Asia-Pacífico durante el período de pronóstico, impulsado por el aumento de los volúmenes de ensayos clínicos, el aumento de las actividades de investigación farmacéutica y biotecnológica y la creciente adopción de soluciones de imágenes rentables.
- El segmento de reactivos de imágenes ópticas preclínicas dominó el mercado de imágenes preclínicas de Asia-Pacífico con una participación de mercado del 38,7 % en 2024, debido a su amplia aplicación en imágenes moleculares, investigación del cáncer y modelado de enfermedades in vivo.
Alcance del informe y segmentación del mercado de imágenes preclínicas en Asia-Pacífico
|
Atributos |
Perspectivas clave del mercado de imágenes preclínicas en Asia-Pacífico |
|
Segmentos cubiertos |
|
|
Países cubiertos |
Asia-Pacífico
|
|
Actores clave del mercado |
|
|
Oportunidades de mercado |
|
|
Conjuntos de información de datos de valor añadido |
Además de los conocimientos sobre escenarios de mercado, como valor de mercado, tasa de crecimiento, segmentación, cobertura geográfica y actores principales, los informes de mercado seleccionados por Data Bridge Market Research también incluyen análisis en profundidad de expertos, análisis de precios, análisis de participación de marca, encuesta de consumidores, análisis demográfico, análisis de la cadena de suministro, análisis de la cadena de valor, descripción general de materias primas/consumibles, criterios de selección de proveedores, análisis PESTLE, análisis de Porter y marco regulatorio. |
Tendencias del mercado de imágenes preclínicas en Asia-Pacífico
Avances en imágenes multimodales e integración de IA
- Una tendencia significativa y en auge en el mercado de imágenes preclínicas de Asia-Pacífico es la integración de sistemas de imágenes multimodales con inteligencia artificial (IA) y plataformas avanzadas de análisis de datos. Esta combinación mejora la resolución de la imagen, acelera el análisis y permite estudios preclínicos más precisos y predictivos.
- Por ejemplo, la combinación de sistemas PET/MRI con reconstrucción de imágenes basada en IA en China permite a los investigadores realizar estudios longitudinales con mayor precisión y tiempos de escaneo reducidos. De igual manera, Japón ha sido testigo de la adopción de plataformas de imágenes ópticas basadas en IA para la investigación oncológica de alto rendimiento, lo que mejora la detección temprana y la evaluación terapéutica.
- La integración de IA permite la segmentación automatizada de imágenes, el reconocimiento de patrones y el modelado predictivo, lo que ayuda a comprender mejor la progresión de la enfermedad y la eficacia de los fármacos. Por ejemplo, el análisis de resonancia magnética asistido por IA en India mejora la identificación de biomarcadores y reduce los errores de interpretación manual, mientras que las imágenes multimodales proporcionan información completa al combinar datos anatómicos y funcionales.
- La integración perfecta de los sistemas de imágenes con plataformas centralizadas de gestión de información de laboratorio permite a los investigadores gestionar datos de múltiples estudios preclínicos, lo que facilita flujos de trabajo de alto rendimiento y resultados reproducibles.
- Esta tendencia hacia soluciones de imagenología más inteligentes, precisas e interconectadas está transformando radicalmente los estándares de la investigación preclínica. Por ello, empresas como MILabs y Bruker están desarrollando sistemas de imagenología preclínica basados en IA con funcionalidad multimodal y capacidades mejoradas de análisis de imágenes.
- La demanda de sistemas de imágenes preclínicas con IA e integración multimodal está creciendo rápidamente en los sectores de investigación farmacéutica, biotecnológica y académica, ya que estas tecnologías aceleran el descubrimiento de fármacos y mejoran los resultados de la investigación traslacional.
Dinámica del mercado de imágenes preclínicas en Asia-Pacífico
Conductor
Aumento de la inversión en I+D farmacéutica e investigación traslacional
- La creciente inversión en I+D farmacéutica y biotecnológica en Asia-Pacífico, en particular en China, Japón e India, es un importante impulsor de la adopción de la imagenología preclínica. Los sistemas avanzados de imagenología respaldan el desarrollo de fármacos en las primeras etapas, la validación de biomarcadores y el modelado de enfermedades.
- Por ejemplo, en marzo de 2024, un consorcio de investigación chino líder amplió su infraestructura de imágenes preclínicas para respaldar los ensayos de medicamentos oncológicos, integrando sistemas PET/CT y MRI con herramientas de análisis basadas en IA.
- A medida que las compañías farmacéuticas buscan reducir los tiempos y costos de desarrollo de medicamentos, las imágenes preclínicas ofrecen información no invasiva y de alta resolución sobre la progresión de la enfermedad y la eficacia terapéutica.
- El creciente enfoque en la medicina de precisión, la detección temprana de enfermedades y la investigación traslacional está aumentando la demanda de sistemas de imágenes integrados y de alto rendimiento tanto en entornos de investigación académica como comercial.
- Las iniciativas y subvenciones gubernamentales en países como Japón y Corea del Sur destinadas a apoyar la investigación biomédica están proporcionando financiación adicional para la infraestructura de imágenes, lo que acelera aún más el crecimiento del mercado.
- Las colaboraciones entre fabricantes de equipos de imágenes e institutos de investigación para el desarrollo conjunto de soluciones de imágenes especializadas están abriendo nuevas oportunidades de mercado.
Restricción/Desafío
Altos costos de equipo y requerimientos de mano de obra calificada
- El alto costo de los sistemas avanzados de imágenes preclínicas y los reactivos sigue siendo un obstáculo importante para su adopción generalizada, especialmente para institutos de investigación más pequeños y empresas biotecnológicas emergentes. Sistemas como la PET/MRI o la imagen óptica multimodal requieren una inversión de capital sustancial.
- Además, operar sistemas de imágenes complejos exige personal altamente capacitado para la adquisición, el análisis y el mantenimiento de imágenes. La escasez de especialistas en imágenes cualificados en mercados emergentes como la India y el Sudeste Asiático puede frenar la penetración en el mercado.
- Por ejemplo, un informe de 2024 destacó que varios laboratorios de biotecnología de tamaño mediano en India retrasaron la adopción de PET/CT debido a limitaciones presupuestarias y falta de operadores capacitados.
- Si bien algunas empresas ofrecen soluciones de imágenes más pequeñas y rentables, los sistemas multimodales premium con integración de IA siguen teniendo precios elevados, lo que limita la accesibilidad.
- El cumplimiento normativo y las aprobaciones para equipos de imágenes preclínicas, particularmente en China y Japón, pueden retrasar la implementación y aumentar los costos operativos.
- Los desafíos de gestión e integración de datos, incluido el manejo seguro y eficiente de grandes volúmenes de datos de imágenes, siguen siendo una barrera para las instituciones más pequeñas que carecen de infraestructura de TI.
- Superar estos desafíos a través de programas de capacitación, iniciativas de investigación colaborativa y el desarrollo de plataformas de imágenes asequibles será crucial para el crecimiento sostenido del mercado en el sector de imágenes preclínicas de Asia y el Pacífico.
Alcance del mercado de imágenes preclínicas en Asia-Pacífico
El mercado está segmentado según el producto, los reactivos, la aplicación y el usuario final.
- Por producto
En cuanto a productos, el mercado de imágenes preclínicas de Asia-Pacífico se segmenta en sistemas y servicios. El segmento de sistemas dominó el mercado con la mayor participación en ingresos, con un 65,4%, en 2024, impulsado por la creciente adopción de modalidades de imagen avanzadas como la resonancia magnética, la tomografía computarizada (TC), la tomografía por emisión de positrones (PET), la tomografía por emisión de fotón único (SPECT) y la imagen óptica en la investigación preclínica. Las compañías farmacéuticas y las instituciones académicas prefieren cada vez más los sistemas de imágenes de alta resolución para estudios anatómicos y funcionales detallados. Su fiabilidad, reproducibilidad y utilidad a largo plazo los hacen indispensables para el descubrimiento de fármacos y la investigación traslacional. Los institutos de investigación priorizan los sistemas por su capacidad para respaldar estudios de imágenes multimodales y experimentos longitudinales. Además, el creciente enfoque en la medicina de precisión y la identificación de biomarcadores está acelerando aún más la adopción de sistemas de imágenes en la región.
Se prevé que el segmento de servicios experimente el mayor crecimiento entre 2025 y 2032, impulsado por la creciente externalización de estudios de imagen a proveedores de servicios preclínicos especializados. Los servicios permiten a los laboratorios más pequeños y a las CRO acceder a tecnologías de imagen avanzadas sin la carga de una gran inversión de capital. Los proveedores de servicios de imagen preclínica ofrecen soluciones integrales, que incluyen imágenes, análisis de datos y generación de informes, lo que facilita la toma de decisiones rápida en el desarrollo de fármacos. Este segmento se beneficia de la creciente demanda de estudios preclínicos por contrato en oncología, neurología e investigación cardiovascular. Además, los modelos de servicio flexibles y las soluciones de imagen personalizadas están fomentando su adopción en los mercados emergentes de Asia-Pacífico. La rentabilidad y la comodidad de estos servicios los hacen atractivos para un público más amplio.
- Por reactivos
En cuanto a los reactivos, el mercado de imágenes preclínicas de Asia-Pacífico se segmenta en reactivos de imágenes ópticas preclínicas, reactivos de imágenes nucleares preclínicas, agentes de contraste para resonancia magnética preclínica, agentes de contraste para ultrasonidos preclínicos y agentes de contraste para TC preclínicas. Los reactivos de imágenes ópticas preclínicas dominaron el mercado con una participación del 38,7 % en 2024, debido a su amplia aplicación en imágenes moleculares, investigación del cáncer y modelado de enfermedades in vivo. Estos reactivos se utilizan ampliamente en estudios longitudinales, lo que permite la obtención repetida de imágenes del mismo sujeto para monitorizar la progresión de la enfermedad o la respuesta terapéutica. Su compatibilidad con sistemas de imágenes multimodales mejora su utilidad en la investigación traslacional. Los reactivos de imágenes ópticas también permiten la detección de alta sensibilidad de biomoléculas específicas y eventos celulares en modelos preclínicos. La capacidad de visualizar interacciones moleculares en animales vivos facilita el desarrollo rápido de fármacos y la validación de biomarcadores.
Se espera que los agentes de contraste para resonancia magnética preclínica experimenten el mayor crecimiento durante el período de pronóstico, impulsado por la creciente adopción de la resonancia magnética para la obtención de imágenes de tejidos blandos y la evaluación de biomarcadores. Las innovaciones en agentes de contraste que mejoran la resolución, reducen la toxicidad y proporcionan imágenes específicas de cada tejido están impulsando la expansión del mercado. El creciente uso de agentes de contraste para resonancia magnética en estudios longitudinales permite a los investigadores rastrear los cambios en la estructura y función de los tejidos a lo largo del tiempo. Las compañías farmacéuticas utilizan cada vez más agentes de resonancia magnética avanzados para estudiar la progresión de enfermedades y la eficacia terapéutica. Las colaboraciones de investigación con fabricantes de equipos de imagen están acelerando el desarrollo de reactivos de contraste para resonancia magnética de nueva generación. Además, el apoyo gubernamental a la investigación biomédica en Asia-Pacífico está contribuyendo a la adopción de estos agentes en estudios preclínicos.
- Por aplicación
En función de su aplicación, el mercado de imágenes preclínicas en Asia-Pacífico se segmenta en investigación y desarrollo, descubrimiento de fármacos, biodistribución, detección de células cancerosas, biomarcadores, entre otros. El segmento de investigación y desarrollo dominó el mercado con una participación del 44,5 % en 2024, impulsado por una creciente inversión en el descubrimiento de fármacos en etapas tempranas y la investigación traslacional. La alta adopción de sistemas de imágenes en la I+D académica y farmacéutica permite a los investigadores estudiar modelos de enfermedades in vivo y evaluar la eficacia de los fármacos en tiempo real. Las imágenes preclínicas facilitan estudios mecanísticos detallados, lo que ayuda a optimizar los candidatos a fármacos antes de los ensayos clínicos. La integración de IA y software avanzado de análisis de imágenes está mejorando la eficiencia y la precisión de los flujos de trabajo de I+D. Los investigadores recurren cada vez más a las imágenes para validar dianas terapéuticas, analizar la farmacocinética y evaluar la toxicidad. Esto ha posicionado a las imágenes preclínicas como una piedra angular de la investigación biomédica moderna en Asia-Pacífico.
Se prevé que el segmento de detección de células cancerosas experimente la tasa de crecimiento anual compuesta (TCAC) más rápida entre 2025 y 2032, debido a la creciente prevalencia del cáncer y al papel crucial de la imagenología preclínica en la evaluación de terapias contra el cáncer. Las modalidades de imagenología permiten el seguimiento del crecimiento tumoral, la metástasis y la respuesta al tratamiento en modelos animales. El uso de agentes de imagenología molecular y óptica permite la visualización precisa de células cancerosas en etapas tempranas. Las compañías farmacéuticas dependen de la imagenología preclínica para probar nuevos compuestos terapéuticos e inmunoterapias. El creciente enfoque en la medicina personalizada y la terapia dirigida está impulsando aún más la demanda. Además, las colaboraciones entre desarrolladores de reactivos de imagenología e institutos de investigación están mejorando las capacidades para la detección de células cancerosas de alta sensibilidad.
- Por el usuario final
En función del usuario final, el mercado de imágenes preclínicas en Asia-Pacífico se segmenta en organizaciones de investigación por contrato (CRO), empresas farmacéuticas y biotecnológicas, institutos de investigación académicos y gubernamentales, centros de diagnóstico, entre otros. Las empresas farmacéuticas y biotecnológicas dominaron el mercado con una participación del 47,1 % en 2024, debido a su importante inversión en I+D y a la creciente demanda de evaluación de fármacos en fase inicial. Estas empresas utilizan imágenes preclínicas para la selección de fármacos candidatos, la evaluación de toxicidad y la validación de biomarcadores. Los sistemas de imágenes permiten tomar decisiones más rápidas sobre si se debe o no proceder, lo que reduce los costes y plazos de desarrollo. La integración con plataformas automatizadas y de alto rendimiento refuerza aún más su adopción. La creciente tendencia hacia la medicina de precisión y las terapias dirigidas ha incrementado la dependencia de las tecnologías de imágenes para estudios preclínicos. Las colaboraciones con fabricantes de equipos de imágenes y reactivos también impulsan la expansión en este segmento.
Se espera que los institutos de investigación académicos y gubernamentales experimenten el mayor crecimiento durante el período de pronóstico, impulsado por el aumento de la financiación gubernamental para la investigación biomédica y la expansión de la infraestructura de investigación. Los institutos están adoptando la imagenología preclínica para avanzar en la investigación fundamental, estudiar los mecanismos de las enfermedades y desarrollar nuevas estrategias terapéuticas. Las alianzas con proveedores globales de equipos de imagenología permiten el acceso a sistemas de alta resolución y reactivos de vanguardia. Los programas de capacitación y los proyectos de investigación colaborativa están promoviendo un uso más amplio de la imagenología en los laboratorios académicos. La adopción de imágenes multimodales y herramientas de análisis basadas en IA está mejorando aún más las capacidades de investigación.
Análisis regional del mercado de imágenes preclínicas en Asia-Pacífico
- China dominó el mercado de imágenes preclínicas de Asia-Pacífico con la mayor participación en los ingresos del 39 % en 2024, caracterizado por una financiación gubernamental sustancial para la investigación biomédica, una rápida expansión de la fabricación farmacéutica y la adopción de sistemas de imágenes avanzados en oncología, neurología y estudios de biomarcadores.
- Los investigadores e instituciones de la región valoran mucho las capacidades de imágenes no invasivas de alta resolución que brindan los sistemas preclínicos, que aceleran el descubrimiento de fármacos, la investigación traslacional y la detección temprana de enfermedades.
- Esta adopción generalizada se ve respaldada además por la creciente inversión en I+D farmacéutica y biotecnológica, el aumento del volumen de ensayos clínicos y el enfoque creciente en la medicina de precisión, lo que establece las imágenes preclínicas como una herramienta fundamental para las organizaciones de investigación académica y comercial en Asia-Pacífico.
Perspectiva del mercado de imágenes preclínicas de China
El mercado chino de imágenes preclínicas captó la mayor participación en los ingresos de Asia-Pacífico en 2024, impulsado por la amplia financiación gubernamental a la investigación biomédica, la rápida expansión de la industria farmacéutica y la creciente adopción de sistemas de imágenes multimodales en oncología, neurología y estudios de biomarcadores. El énfasis del país en la investigación de alta tecnología y el desarrollo de fármacos traslacionales está impulsando la implementación de soluciones avanzadas de imágenes en laboratorios académicos y comerciales.
Perspectivas del mercado de imágenes preclínicas en Japón
El mercado japonés de imágenes preclínicas está cobrando impulso gracias a su sólido ecosistema de I+D, la alta adopción de tecnología y su enfoque en la medicina de precisión. Esta adopción se ve impulsada aún más por la integración de la IA y la imagen multimodal en estudios preclínicos, lo que permite un modelado de enfermedades y una evaluación terapéutica más precisos. La consolidada infraestructura de investigación del país y el apoyo gubernamental a la innovación biomédica siguen impulsando el crecimiento del mercado.
Perspectivas del mercado de imágenes preclínicas en India
Se prevé que el mercado indio de imágenes preclínicas experimente el mayor crecimiento en Asia-Pacífico durante el período de pronóstico, debido a la rápida expansión de la infraestructura de investigación, el aumento de la actividad de ensayos clínicos y la creciente adopción de sistemas de imágenes rentables. Las iniciativas gubernamentales que promueven la investigación biomédica, la aparición de CRO y las colaboraciones con proveedores globales de tecnología de imágenes están impulsando la demanda tanto en el sector académico como en el farmacéutico.
Perspectivas del mercado de imágenes preclínicas en Corea del Sur
El mercado surcoreano de imágenes preclínicas está en constante expansión, impulsado por la creciente inversión en I+D biotecnológica, la adopción de imágenes avanzadas en la investigación oncológica y neurológica, y la creciente colaboración entre institutos de investigación locales y fabricantes internacionales de sistemas de imágenes. El enfoque del país en la salud digital y las soluciones innovadoras de imágenes está impulsando una mayor penetración en el mercado.
Cuota de mercado de imágenes preclínicas en Asia-Pacífico
La industria de imágenes preclínicas de Asia-Pacífico está liderada principalmente por empresas bien establecidas, entre las que se incluyen:
- Bruker (EE. UU.)
- PerkinElmer (Estados Unidos)
- FUJIFILM VisualSonics, Inc. (Canadá)
- Aspect Imaging Ltd. (Israel)
- Imágenes TriFoil (EE. UU.)
- LI-COR Biosciences (EE. UU.)
- Mediso Ltd. (Hungría)
- MILabs BV (Países Bajos)
- MR Solutions Ltd. (Reino Unido)
- GE Healthcare (EE. UU.)
- Siemens Healthineers AG (Alemania)
- Canon Medical Systems Corporation (Japón)
- Shanghai United Imaging Healthcare Co., Ltd. (China)
- Mindray Medical International Limited (China)
- Neusoft Medical Systems Co., Ltd. (China)
- Hitachi Medical Corporation (Japón)
- Koninklijke Philips NV (Países Bajos)
- Olympus Corporation (Japón)
- Hamamatsu Photonics KK (Japón)
- 3DHISTECH Ltd. (Hungría)
¿Cuáles son los desarrollos recientes en el mercado de imágenes preclínicas de Asia-Pacífico?
- En diciembre de 2024, Intas Pharmaceuticals anunció un acuerdo para adquirir el negocio UDENYCA (pegfilgrastim-cbqv) de Coherus BioSciences, Inc. por hasta 558 millones de dólares. La adquisición, que se completó en el primer trimestre de 2025, incluye el biosimilar y todos los activos relacionados. UDENYCA es un biosimilar de Neulasta, utilizado para tratar la neutropenia inducida por quimioterapia. Esta estrategia fortalece la cartera de biosimilares de Intas y consolida su posición como uno de los principales proveedores mundiales de pegfilgrastim.
- En octubre de 2024, la Organización Mundial de la Salud (OMS) organizó una Reunión de Socios en Farmacovigilancia en Nueva Delhi (India). La reunión, celebrada durante la 19.ª Conferencia Internacional de Autoridades Reguladoras de Medicamentos (ICDRA), reunió a reguladores de 68 países para revisar el borrador de la Estrategia Global de Farmacovigilancia Inteligente de la OMS. El objetivo de esta iniciativa es promover una evolución convergente de las actividades de farmacovigilancia entre los países miembros, que conduzca a requisitos regulatorios armonizados y pragmáticos.
- En abril de 2024, WuXi STA, subsidiaria de WuXi AppTec, detalló un plan de expansión global con múltiples sedes, que incluye una nueva planta de fabricación de ingredientes farmacéuticos activos (API) de 70 hectáreas en Taixing, China. Esta expansión, junto con otras instalaciones, busca mejorar la capacidad de fabricación y satisfacer la creciente demanda de servicios de desarrollo de fármacos, incluyendo estudios preclínicos, en la región de Asia-Pacífico y a nivel mundial.
- En noviembre de 2022, Bruker Corporation anunció la adquisición de Inscopix, Inc., empresa de neurociencia especializada en microscopios miniaturizados, o "miniscopios", para la obtención de imágenes cerebrales en animales en movimiento. Esta adquisición enriquece la cartera de productos de neurociencia de Bruker al incorporar productos y servicios que permiten una exploración más profunda de la función de las redes neuronales en animales, crucial para comprender los trastornos neurológicos.
- En mayo de 2022, FUJIFILM VisualSonics Inc. lanzó el Vevo F2, el primer sistema de ultrasonidos y fotoacústica de ultraalta a baja frecuencia (71 MHz-1 MHz) del mundo para uso preclínico. Este sistema incorpora tecnología de procesamiento de imágenes HD y una ruta de señal completamente nueva desde el transductor hasta la pantalla, lo que permite una mayor claridad de imagen y una mayor velocidad de fotogramas. Este avance es especialmente adecuado para la investigación biológica y fisiológica interdisciplinaria, como la oncología, la biología del desarrollo, la neurobiología y la cardiología.
SKU-
Obtenga acceso en línea al informe sobre la primera nube de inteligencia de mercado del mundo

- Panel de análisis de datos interactivo
- Panel de análisis de empresas para oportunidades con alto potencial de crecimiento
- Acceso de analista de investigación para personalización y consultas
- Análisis de la competencia con panel interactivo
- Últimas noticias, actualizaciones y análisis de tendencias
- Aproveche el poder del análisis de referencia para un seguimiento integral de la competencia
Metodología de investigación
La recopilación de datos y el análisis del año base se realizan utilizando módulos de recopilación de datos con muestras de gran tamaño. La etapa incluye la obtención de información de mercado o datos relacionados a través de varias fuentes y estrategias. Incluye el examen y la planificación de todos los datos adquiridos del pasado con antelación. Asimismo, abarca el examen de las inconsistencias de información observadas en diferentes fuentes de información. Los datos de mercado se analizan y estiman utilizando modelos estadísticos y coherentes de mercado. Además, el análisis de la participación de mercado y el análisis de tendencias clave son los principales factores de éxito en el informe de mercado. Para obtener más información, solicite una llamada de un analista o envíe su consulta.
La metodología de investigación clave utilizada por el equipo de investigación de DBMR es la triangulación de datos, que implica la extracción de datos, el análisis del impacto de las variables de datos en el mercado y la validación primaria (experto en la industria). Los modelos de datos incluyen cuadrícula de posicionamiento de proveedores, análisis de línea de tiempo de mercado, descripción general y guía del mercado, cuadrícula de posicionamiento de la empresa, análisis de patentes, análisis de precios, análisis de participación de mercado de la empresa, estándares de medición, análisis global versus regional y de participación de proveedores. Para obtener más información sobre la metodología de investigación, envíe una consulta para hablar con nuestros expertos de la industria.
Personalización disponible
Data Bridge Market Research es líder en investigación formativa avanzada. Nos enorgullecemos de brindar servicios a nuestros clientes existentes y nuevos con datos y análisis que coinciden y se adaptan a sus objetivos. El informe se puede personalizar para incluir análisis de tendencias de precios de marcas objetivo, comprensión del mercado de países adicionales (solicite la lista de países), datos de resultados de ensayos clínicos, revisión de literatura, análisis de mercado renovado y base de productos. El análisis de mercado de competidores objetivo se puede analizar desde análisis basados en tecnología hasta estrategias de cartera de mercado. Podemos agregar tantos competidores sobre los que necesite datos en el formato y estilo de datos que esté buscando. Nuestro equipo de analistas también puede proporcionarle datos en archivos de Excel sin procesar, tablas dinámicas (libro de datos) o puede ayudarlo a crear presentaciones a partir de los conjuntos de datos disponibles en el informe.

