
Asia Pacific Ophthalmology Market
Tamaño del mercado en miles de millones de dólares
Tasa de crecimiento anual compuesta (CAGR) :
% 
 USD
15.84 Billion
USD
28.23 Billion
2024
2032
USD
15.84 Billion
USD
28.23 Billion
2024
2032
| 2025 –2032 | |
| USD 15.84 Billion | |
| USD 28.23 Billion | |
| % | |
Segmentación del mercado de oftalmología en Asia y el Pacífico, por productos (dispositivos, medicamentos y otros), enfermedades (cataratas, trastornos refractivos, glaucoma, degeneración macular relacionada con la edad, enfermedades inflamatorias y otras), examen ocular integral (refracción, prueba de agudeza visual, presión intraocular, segmento anterior y examen pupilar, prueba de campos visuales, prueba de visión del color y otras), usuario final (clínicas, hospitales, atención médica domiciliaria y otros), canal de distribución (ventas minoristas, licitación directa y otros): tendencias de la industria y pronóstico hasta 2032
Análisis del mercado de oftalmología en Asia y el Pacífico
El mercado de la oftalmología en Asia y el Pacífico ha evolucionado significativamente a lo largo de los siglos, comenzando con los tratamientos antiguos para las enfermedades oculares en Egipto y Grecia. El campo comenzó a tomar forma en los siglos XVII y XVIII, con el desarrollo de técnicas y herramientas quirúrgicas más avanzadas. En el siglo XIX, innovaciones como el oftalmoscopio transformaron las capacidades de diagnóstico. El siglo XX fue testigo de avances como la cirugía de cataratas y la invención de las lentes intraoculares, junto con la llegada de la cirugía LASIK en la década de 1990. El siglo XXI trajo consigo un crecimiento continuo impulsado por el envejecimiento de la población, los avances tecnológicos y el desarrollo de dispositivos quirúrgicos y de diagnóstico especializados, incluida la tomografía de coherencia óptica (OCT) y los sistemas de imágenes de retina. Las tendencias recientes se centran en el uso creciente de la inteligencia artificial, la telemedicina y las terapias biológicas, como la terapia génica y los tratamientos con células madre, lo que ha dado forma aún más al crecimiento del mercado. Hoy en día, el mercado de la oftalmología continúa expandiéndose debido a la creciente prevalencia de enfermedades oculares, las nuevas tecnologías y la evolución de las opciones de tratamiento.
Tamaño del mercado de oftalmología en Asia y el Pacífico
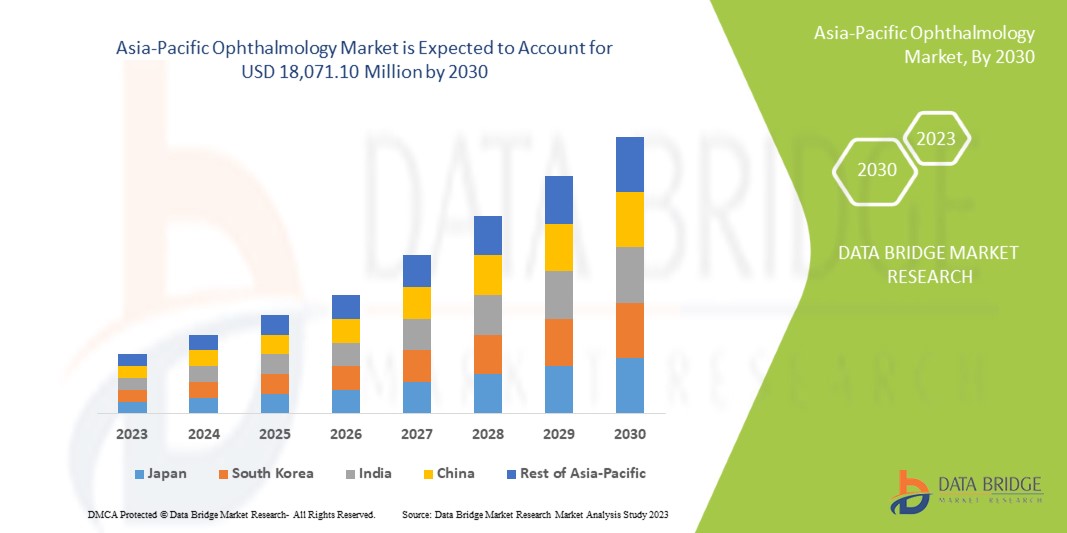
Se espera que el mercado de oftalmología de Asia y el Pacífico alcance los 28,23 mil millones de dólares en 2032, desde los 15,84 mil millones de dólares en 2024, creciendo a una CAGR del 7,5 % en el período de pronóstico de 2025 a 2032.
Además de la información sobre escenarios de mercado como valor de mercado, tasa de crecimiento, segmentación, cobertura geográfica y actores principales, los informes de mercado seleccionados por Data Bridge Market Research también incluyen análisis de importación y exportación, descripción general de la capacidad de producción, análisis de consumo de producción, análisis de tendencias de precios, escenario de cambio climático, análisis de la cadena de suministro, análisis de la cadena de valor, descripción general de materias primas/consumibles, criterios de selección de proveedores, análisis PESTLE, análisis de Porter y marco regulatorio.
Tendencias del mercado de oftalmología en Asia y el Pacífico
“Seguridad y eficacia mejoradas de las jeringas precargadas con solución salina”
El mercado de la oftalmología en Asia-Pacífico está experimentando un crecimiento sólido, impulsado por la creciente prevalencia de enfermedades oculares, los avances tecnológicos y el envejecimiento de la población. Las tasas cada vez mayores de enfermedades como cataratas, glaucoma, retinopatía diabética y degeneración macular relacionada con la edad están contribuyendo a la creciente demanda de tratamientos para el cuidado de los ojos. El envejecimiento de la población de Asia-Pacífico está afectando particularmente a esta tendencia, ya que las personas mayores son más propensas a sufrir problemas relacionados con la visión. Además, los avances en las tecnologías de diagnóstico, como la tomografía de coherencia óptica (OCT), las cámaras de fondo de ojo y los sistemas impulsados por IA, están mejorando la precisión y la eficiencia de los diagnósticos. Las técnicas quirúrgicas mínimamente invasivas, incluidos los tratamientos con láser y las cirugías asistidas por robot, están ganando popularidad, ofreciendo tiempos de recuperación más rápidos y mejores resultados para los pacientes. Además, el crecimiento de la medicina personalizada en oftalmología, con terapias dirigidas a enfermedades como las de la retina, también está desempeñando un papel fundamental. La introducción de nuevos sistemas de administración de fármacos, como los productos biológicos inyectables y los implantes de liberación sostenida, está mejorando la eficacia del tratamiento, en particular para las enfermedades crónicas. La telemedicina es otra tendencia en alza en el mercado de la oftalmología, ya que las consultas remotas y los exámenes virtuales se están volviendo más comunes, mejorando el acceso a la atención en regiones desatendidas. Los actores clave del mercado se están centrando en la investigación y el desarrollo para ampliar sus carteras de productos, mientras que los mercados emergentes están viendo una mayor demanda de soluciones de cuidado ocular asequibles y accesibles. Con un enfoque en la innovación, la mejora de la atención al paciente y la expansión del acceso a la atención médica, el mercado de la oftalmología está preparado para un crecimiento significativo en los próximos años.
Alcance del informe y segmentación del mercado de oftalmología en Asia y el Pacífico
|
Atributos |
Perspectivas del mercado de oftalmología en Asia y el Pacífico |
|
Segmentos cubiertos |
Productos secundarios : dispositivos, medicamentos y otros Por enfermedades : cataratas, trastornos refractivos, glaucoma, degeneración macular relacionada con la edad, enfermedades inflamatorias y otras Mediante examen ocular completo : refracción, prueba de agudeza visual, presión intraocular, examen del segmento anterior y pupilar, prueba de campos visuales, prueba de visión del color y otros Por usuario final : clínicas, hospitales, atención médica domiciliaria y otros Por canal de distribución : Ventas minoristas, licitación directa y otros |
|
Región cubierta |
China, India, Japón, Corea del Sur, Australia, Indonesia, Tailandia, Malasia, Filipinas, Singapur y el resto de Asia-Pacífico |
|
Actores clave del mercado |
Alcon (Suiza), Bausch + Lomb (Canadá), Carl Zeiss Meditec (Alemania), Hoya Corporation (Japón), Johnson & Johnson Services, Inc. (EE. UU.), Essilor International (Francia), Topcon Corporation (Japón), Glaukos Corporation (EE. UU.), Haag-Streit Group (Suiza), Nidek Co., Ltd (EE. UU.), Staar Surgical (California), Ziemer Ophthalmic Systems Ag (Suiza), Cooper Companies (EE. UU.), Lumenis Be Ltd. (Israel), Reichert Inc. (Nueva York), Bayer Ag (Alemania), Novartis Ag (Suiza), Abbvie Inc. (EE. UU.), F. Hoffmann-La Roche Ltd. (Suiza), Dompé (Italia), Santen Pharmaceutical Co. (Japón), Ltd, entre otros. |
|
Oportunidades de mercado |
|
|
Conjuntos de información de datos de valor añadido |
Además de la información sobre escenarios de mercado como valor de mercado, tasa de crecimiento, segmentación, cobertura geográfica y actores principales, los informes de mercado seleccionados por Data Bridge Market Research también incluyen análisis de importación y exportación, descripción general de la capacidad de producción, análisis de consumo de producción, análisis de tendencias de precios, escenario de cambio climático, análisis de la cadena de suministro, análisis de la cadena de valor, descripción general de materias primas/consumibles, criterios de selección de proveedores, análisis PESTLE, análisis de Porter y marco regulatorio. |
Definición del mercado de oftalmología en Asia y el Pacífico
La oftalmología es una rama de la medicina y la cirugía que se centra en el diagnóstico, el tratamiento y la prevención de los trastornos y enfermedades oculares. Incluye la atención médica y quirúrgica de las afecciones que afectan a los ojos y al sistema visual, como las cataratas, el glaucoma, la degeneración macular y la retinopatía diabética.
Dinámica de definición del mercado de oftalmología en Asia y el Pacífico
Conductores
- Aumento de la prevalencia de enfermedades oculares
La creciente prevalencia de enfermedades oculares, como cataratas, degeneración macular y retinopatía diabética, es un factor importante que impulsa el mercado de la oftalmología en Asia y el Pacífico. A medida que la población de Asia y el Pacífico envejece, aumenta la incidencia de estas enfermedades. Las cataratas, que provocan visión borrosa y ceguera, exigen un mercado en expansión para cirugías y tratamientos correctivos. De manera similar, la degeneración macular y la retinopatía diabética contribuyen a la necesidad de herramientas de diagnóstico avanzadas y terapias especializadas. El creciente número de personas afectadas asegura una demanda sostenida de servicios de atención oftalmológica, incluidas cirugías, medicamentos y tecnologías de diagnóstico innovadoras. Este aumento de las enfermedades oculares impulsa directamente la expansión del mercado, ya que los proveedores de atención médica y los fabricantes se esfuerzan por satisfacer la creciente necesidad de tratamientos y soluciones eficaces.
Por ejemplo,
- En julio de 2022, según el artículo publicado por NCBI, la prevalencia de ceguera aumenta con la edad, pasando del 0,45 % en las personas de 50 a 59 años al 11,62 % en las personas de 80 años o más. Las mujeres (2,31 %) y los residentes rurales (2,14 %) experimentan tasas más altas. La discapacidad visual también afecta al 26,68 % de los participantes, mostrando tendencias similares. Esta creciente carga de enfermedades oculares, especialmente entre los ancianos, impulsa la demanda de tratamientos y tecnologías oftálmicas, impulsando el mercado de la oftalmología.
- En agosto de 2023, según el artículo publicado por la OMS en Asia y el Pacífico, más de 2200 millones de personas padecen problemas de visión, y casi 1000 millones de casos son prevenibles o no se tratan. Esta creciente prevalencia de problemas de visión pone de relieve la creciente demanda de servicios, tratamientos y soluciones correctivas para el cuidado de los ojos. A medida que más personas buscan atención médica para afecciones prevenibles o no resueltas, la creciente carga de enfermedades oculares actúa como un importante impulsor del mercado de la oftalmología.
La creciente prevalencia de enfermedades oculares relacionadas con la edad, como cataratas, degeneración macular y retinopatía diabética, está impulsando el mercado de la oftalmología en Asia y el Pacífico. A medida que la población envejece, estas enfermedades se vuelven más comunes, lo que aumenta la demanda de tratamientos, cirugías y herramientas de diagnóstico. La necesidad de tecnologías y terapias avanzadas aumenta a medida que más personas requieren atención. Este aumento de las enfermedades oculares impulsa el crecimiento del mercado, ya que los proveedores de atención médica y los fabricantes apuntan a satisfacer la creciente demanda de soluciones efectivas.
- Centrarse en el cuidado preventivo de los ojos
Cada vez se hace más hincapié en la prevención de problemas oculares y la detección temprana de problemas relacionados con la visión, lo que desempeña un papel importante en el impulso del mercado de la oftalmología en Asia y el Pacífico. A medida que aumenta la conciencia sobre la importancia de la salud ocular, más personas buscan controles oculares de rutina para detectar afecciones como el glaucoma, la retinopatía diabética y las cataratas en sus primeras etapas. El diagnóstico temprano permite intervenciones oportunas, lo que reduce el riesgo de pérdida de visión y mejora la salud ocular general. Este enfoque proactivo no solo mejora los resultados de los pacientes, sino que también impulsa la demanda de servicios oftálmicos, herramientas de diagnóstico y tratamientos correctivos. El creciente enfoque en la atención preventiva está generando un aumento de las inversiones en tecnologías para el cuidado de los ojos, dispositivos y servicios oftálmicos, lo que contribuye a la expansión del mercado. Esta tendencia actúa fuertemente como un motor de crecimiento en el sector de la oftalmología.
Por ejemplo,
- En octubre de 2022, según el artículo publicado por el Instituto Nacional del Ojo, el Programa Nacional de Educación sobre la Salud Ocular (NEHEP, por sus siglas en inglés) colabora con los profesionales de la salud para promover la concienciación sobre la detección temprana, el tratamiento de las enfermedades oculares y los beneficios de la rehabilitación de la visión. También se dirige a las poblaciones con alto riesgo de sufrir enfermedades oculares y pérdida de la visión. Este enfoque en la atención preventiva anima a las personas a buscar controles y tratamientos oculares oportunos, lo que impulsa la demanda de servicios oftálmicos, herramientas de diagnóstico y productos, impulsando así el mercado de la oftalmología.
- En octubre de 2024, según el artículo publicado por la Dirección General de Servicios de Salud, el Programa Nacional para el Control de la Ceguera y la Discapacidad Visual (NPCB&VI) tiene como objetivo reducir la prevalencia de la ceguera mediante la identificación y el tratamiento de la ceguera curable en todos los niveles de atención sanitaria. Al centrarse en la detección temprana y abordar la ceguera evitable, el programa destaca la importancia de la atención preventiva. Esta iniciativa impulsa la demanda de servicios de atención oftalmológica, herramientas de diagnóstico y tratamientos, lo que contribuye significativamente al crecimiento del mercado de oftalmología de Asia y el Pacífico.
El creciente interés por la prevención y la detección temprana de enfermedades oculares está impulsando de forma significativa el mercado de la oftalmología en Asia-Pacífico. A medida que aumenta la concienciación sobre la salud ocular, cada vez más personas optan por hacerse exámenes oculares de rutina para identificar de forma temprana enfermedades como el glaucoma y las cataratas. La detección temprana permite aplicar tratamientos eficaces que previenen una mayor pérdida de visión. Este enfoque proactivo está impulsando la demanda de herramientas de diagnóstico, servicios oftálmicos y tratamientos correctivos. La creciente importancia de la atención preventiva está impulsando la inversión en tecnologías avanzadas para el cuidado ocular, lo que contribuye al crecimiento general del mercado de la oftalmología y garantiza su expansión continua.
Oportunidades
- Aumento de la población que envejece
El aumento de la población que envejece presenta una oportunidad significativa para el mercado de oftalmología de Asia y el Pacífico, ya que las personas mayores son más susceptibles a diversos trastornos y enfermedades oculares. Afecciones como cataratas, degeneración macular relacionada con la edad (DMRE), retinopatía diabética y glaucoma son frecuentes entre los ancianos, lo que genera una demanda sustancial de atención y tratamientos oftálmicos. Como resultado, los sistemas de atención médica y los proveedores de servicios oftálmicos están preparados para expandir sus servicios, mejorar las opciones de diagnóstico y terapéuticas y atender las necesidades únicas de este grupo demográfico. Esta creciente base de pacientes requiere una variedad de soluciones, desde intervenciones quirúrgicas y terapias farmacológicas avanzadas hasta productos para la corrección de la visión, lo que garantiza una demanda constante y creciente de procedimientos y productos oftálmicos.
Por ejemplo,
- En marzo de 2023, según un artículo publicado en la Biblioteca Nacional de Medicina, las cataratas son una de las principales causas de discapacidad visual en la vejez. La opacificación del cristalino está notoriamente asociada con varias afecciones geriátricas, como la fragilidad, el riesgo de caídas, la depresión y el deterioro cognitivo. Además, según la misma fuente, en 2020, las principales causas mundiales de ceguera en pacientes de 50 años o más fueron las cataratas, seguidas del glaucoma, el error refractivo subcorregido, la degeneración macular relacionada con la edad y la retinopatía diabética.
- En agosto de 2022, según un artículo publicado en la Academia Estadounidense de Oftalmología, la DMAE es una enfermedad ocular común, que generalmente se encuentra en adultos mayores de 50 años. Además, se afirma que la mitad de los estadounidenses mayores de 75 años desarrollan cataratas.
Además, abordar las necesidades de salud ocular de la población que envejece puede estimular más inversiones en investigación y desarrollo dentro del sector de la oftalmología. Las compañías farmacéuticas y los fabricantes de dispositivos médicos se centran en la creación de soluciones innovadoras diseñadas específicamente para las enfermedades relacionadas con la edad, lo que podría conducir a avances en los protocolos de tratamiento y la atención al paciente. La integración de nuevas tecnologías, como la teleoftalmología y las técnicas avanzadas de diagnóstico por imagen, facilitan una mejor gestión de la salud ocular en los adultos mayores, lo que hace más fácil el seguimiento y el tratamiento de las enfermedades a distancia. En general, el envejecimiento de la población amplifica la necesidad de los servicios oftálmicos existentes y presenta un terreno fértil para la innovación y el crecimiento dentro del mercado de la oftalmología de Asia y el Pacífico.
- Aumento de las plataformas de venta minorista en línea y de salud electrónica
El auge de las plataformas de venta minorista en línea y de salud electrónica ofrece una oportunidad significativa para el mercado de oftalmología de Asia y el Pacífico, ya que ofrece a los consumidores un acceso más fácil a una amplia gama de productos y servicios para el cuidado de los ojos. Con la creciente adopción del comercio electrónico, los pacientes pueden comprar cómodamente artículos como anteojos recetados, lentes de contacto y productos para el cuidado de los ojos de venta libre desde la comodidad de sus hogares. Esta tendencia es especialmente atractiva para los consumidores más jóvenes y expertos en tecnología, y para aquellos que viven en áreas remotas con acceso limitado a las tiendas de óptica tradicionales. La capacidad de comparar precios, leer reseñas y acceder a una gama más amplia de productos en línea mejora la satisfacción del cliente y fomenta el uso, impulsando así el crecimiento en el segmento de productos oftálmicos.
Por ejemplo,
- En septiembre de 2023, según un artículo de The Times of India, el brote de "conjuntivitis" provocó un aumento en las ventas de medicamentos oftalmológicos. Las ventas aumentaron casi un 30% interanual por segundo mes consecutivo en agosto, superando al mercado general en casi cinco veces. El aumento refleja la incidencia masiva de conjuntivitis y complicaciones oculares en los últimos meses en todo el país.
- En abril de 2020, según un artículo, 'Opiniones de los pacientes sobre la compra online de gafas', la compra online de lentes de contacto está en aumento: entre el 10% y el 20% de los usuarios de lentes de contacto en Australia, EE. UU. y el Reino Unido han considerado o investigado la posibilidad de comprar por Internet.
Además de las oportunidades de venta minorista, las plataformas de salud electrónica facilitan servicios de telesalud que permiten a los pacientes consultar con profesionales de la salud ocular de forma remota. Las consultas virtuales para exámenes oculares de rutina, seguimientos y triaje para afecciones más graves pueden mejorar significativamente el acceso a la atención, en particular para adultos mayores o personas con problemas de movilidad. Estas plataformas mejoran la participación de los pacientes y la adherencia a las recomendaciones de salud ocular y permiten a los oftalmólogos llegar a una base de pacientes más amplia sin las limitaciones de los límites geográficos. Además, la integración de herramientas de salud digital, como aplicaciones móviles para monitorear la salud ocular o controlar enfermedades crónicas, puede crear una experiencia fluida para el paciente y fomentar la atención ocular proactiva, impulsando aún más el crecimiento en el mercado de la oftalmología.
Restricciones/Desafíos
- Efectos secundarios y complicaciones relacionadas con las cirugías oculares
A pesar de los avances significativos en los tratamientos oftalmológicos, ciertos procedimientos oftálmicos, en particular las intervenciones quirúrgicas, conllevan riesgos de efectos secundarios y complicaciones como infecciones, cicatrices o deterioro de la visión. Estos riesgos potenciales pueden disuadir a los pacientes de someterse a terapias específicas, especialmente aquellas que implican procedimientos invasivos. El miedo a los resultados adversos, como la reducción de la visión o tiempos de recuperación prolongados, puede generar dudas a la hora de buscar tratamiento, lo que limita la adopción general de ciertas terapias. Además, las complicaciones derivadas de las cirugías pueden requerir tratamientos adicionales, lo que aumenta aún más los costos de la atención médica y afecta la confianza de los pacientes en los tratamientos avanzados. Esta renuencia a someterse a tratamientos debido a la posibilidad de efectos secundarios negativos restringe el crecimiento general del mercado de la oftalmología al frenar la adopción de nuevas tecnologías y terapias.
Por ejemplo,
- En octubre de 2024, según el artículo publicado por Harvard Health, las cirugías oculares modernas, si bien son efectivas para tratar afecciones como las cataratas y el glaucoma, a menudo provocan complicaciones como la enfermedad del ojo seco, caracterizada por una sensación de ardor, arenilla o picazón. Este efecto secundario puede resultar incómodo y desalentador para los pacientes, lo que lleva a algunos a dudar o evitar las cirugías oculares. Como resultado, las complicaciones de los tratamientos actúan como un freno al crecimiento del mercado de la oftalmología.
- En julio de 2021, según el artículo publicado por Medical News Today, hasta el 95% de las personas que se someten a una cirugía ocular con láser pueden experimentar ojos secos, mientras que el 20% informa alteraciones visuales como deslumbramiento o halos. Además, 1 de cada 50 personas puede sufrir visión borrosa o síndrome de las “arenas del Sahara”. Estos efectos secundarios pueden disuadir a los pacientes de optar por la cirugía, lo que limita la adopción de procedimientos con láser y actúa como un freno al crecimiento del mercado de la oftalmología.
A pesar de los avances en oftalmología, algunos tratamientos quirúrgicos conllevan riesgos como infecciones, cicatrices o deterioro de la visión. Estas complicaciones pueden disuadir a los pacientes de optar por ciertas terapias, en particular los procedimientos invasivos. El miedo a los resultados adversos y a los costos adicionales del tratamiento puede obstaculizar la disposición de los pacientes a buscar atención, lo que frena la adopción de nuevos tratamientos. Esta renuencia limita el crecimiento del mercado de oftalmología en Asia y el Pacífico.
- Acceso limitado a atención oftalmológica especializada en zonas rurales
A pesar de los avances en la infraestructura de atención médica, el acceso a la atención oftálmica especializada sigue siendo limitado en las áreas rurales y remotas, lo que obstaculiza significativamente el potencial de crecimiento del mercado de la oftalmología en estas regiones. Muchas poblaciones rurales aún enfrentan desafíos como la falta de profesionales capacitados en el cuidado de los ojos, instalaciones inadecuadas y acceso limitado a tecnologías avanzadas de diagnóstico y tratamiento. Como resultado, las personas en estas áreas a menudo tienen dificultades para recibir un diagnóstico y tratamiento oportunos para las afecciones oculares, lo que lleva a una mayor incidencia de ceguera evitable y deterioro de la visión. La disponibilidad limitada de atención especializada restringe la expansión del mercado al reducir la adopción de servicios y productos avanzados para el cuidado de los ojos. Esta barrera al acceso continúa actuando como una restricción importante para el crecimiento general del mercado de oftalmología de Asia y el Pacífico.
Por ejemplo,
- En febrero de 2023, según el artículo publicado por NCBI, la gran población rural de la India enfrenta importantes necesidades de atención oftalmológica insatisfechas, y la mayoría de las instalaciones y profesionales se concentran en áreas urbanas y semiurbanas. La disparidad en el acceso a la atención oftalmológica entre las regiones rurales y urbanas sigue siendo un desafío, ya que limita la disponibilidad de tratamientos. Esta distribución desigual de los recursos de atención médica restringe el crecimiento del mercado de oftalmología de Asia y el Pacífico al impedir el acceso generalizado a servicios esenciales en las áreas rurales.
- En marzo de 2024, según el artículo publicado por Research Gate, la falta de conectividad y personal capacitado en áreas remotas dificulta el acceso a la atención oftalmológica continua, incluso después de los campamentos oftalmológicos exitosos. Los pacientes en estas áreas tienen dificultades para recibir atención de seguimiento o tratamientos avanzados debido a la ausencia de la infraestructura adecuada. Esta brecha en la prestación de atención médica limita el alcance y la eficacia de los programas de atención oftalmológica, lo que actúa como una restricción para el crecimiento del mercado de oftalmología de Asia y el Pacífico.
El acceso a la atención oftalmológica especializada sigue siendo limitado en las zonas rurales, a pesar de las mejoras en la atención sanitaria. La falta de profesionales de la atención oftalmológica, tecnología avanzada e instalaciones impide el tratamiento y el diagnóstico oportunos, lo que conduce a tasas más altas de ceguera evitable. Este acceso limitado obstaculiza el crecimiento del mercado de oftalmología de Asia y el Pacífico al restringir la adopción de tratamientos y servicios avanzados en estas regiones.
Alcance del mercado de oftalmología en Asia y el Pacífico
El mercado está segmentado en función de los productos, las enfermedades, el examen ocular completo, el usuario final y el canal de distribución. El crecimiento entre estos segmentos le ayudará a analizar los segmentos de crecimiento reducido de las industrias y brindará a los usuarios una valiosa descripción general del mercado y conocimientos del mercado para ayudarlos a tomar decisiones estratégicas para identificar las principales aplicaciones del mercado.
Por productos
- Dispositivo
- Dispositivo quirúrgico
- Dispositivos quirúrgicos para cataratas
- Dispositivos viscoelásticos oftálmicos
- Dispositivos de facoemulsificación
- Láseres quirúrgicos para cataratas
- Inyectores de LIO
- Dispositivos quirúrgicos vitreorretinianos
- Máquinas de vitrectomía
- Paquetes vítreorretinianos
- Láseres de fotocoagulación
- Sondas de vitrectomía
- Dispositivos de iluminación
- Dispositivos quirúrgicos refractivos
- Láseres de femtosegundo
- Láseres excimer
- Otros láseres quirúrgicos refractivos
- Dispositivos quirúrgicos para el glaucoma
- Dispositivos de drenaje para el glaucoma
- Dispositivos para cirugía microinvasiva de glaucoma
- Sistemas láser para el glaucoma
- Dispositivo de diagnóstico
- Tomografía de coherencia óptica (OCT)
- Autorefractores y queratómetros
- Tonómetros
- Forópteros
- Retinoscopios
- Oftalmoscopios
- Lámparas de hendidura
- Analizadores de perímetros/campos visuales
- Sistemas de topografía corneal
- Cámaras de fondo de ojo
- Sistemas de imágenes por ultrasonidos oftálmicos
- Sistema de imágenes A-Scan
- Sistema de imágenes B-Scan
- Paquímetros
- Biomicroscopios ultrasónicos
- Lensómetros
- Aberrómetros de frente de onda
- Sistemas de biometría óptica
- Microscopios especulares
- Proyectores de gráficos
- Accesorios quirúrgicos oftálmicos
- Instrumentos y kits quirúrgicos
- Pinzas oftálmicas
- Espátula oftálmica
- Puntas y mangos oftálmicos
- Cánulas oftálmicas
- Tijeras oftálmicas
- Otros accesorios quirúrgicos
- Microscopios oftálmicos
- Dispositivo quirúrgico
- Medicamentos, subproductos
- Medicamentos anti-VEGF
- Ranibizumab
- Bevacizumab
- Medicamentos para tratar los trastornos de la retina
- Medicamentos contra el glaucoma
- Análogos de prostaglandinas
- Latanoprost
- Bimatoprost
- Travoprost
- Tafluprost
- Latanoprosteno
- Antagonistas adrenérgicos BETA
- Maleato de timolal
- Betaxolol
- Agonistas alfa adrenérgicos
- Epinefrina
- Depiveprina
- Mióticos
- Pilocarpina
- Eserina
- Análogos de prostaglandinas
- Medicamentos para el ojo seco
- Medicamentos antiinflamatorios
- Medicamentos antiinflamatorios esteroides
- Medicamentos antiinflamatorios no esteroides
- Medicamentos para la conjuntivitis alérgica
- Otros
- Medicamentos anti-VEGF
- Medicamentos, por tipo de medicamento
- De marca
- Genérico
- Medicamentos, según el modo de prescripción
- Prescripción
- En el mostrador
- Medicamentos, por vía de administración
- Actual
- Gotas para los ojos
- Solución para los ojos
- Cremas y ungüentos
- Gel
- Otros
- Ocular local
- Intravítreo
- Subconjuntival
- Retrobulbar
- Intracameral
- Inyectables
- Intramuscular
- Intravenoso
- Otros
- Oral
- Tableta
- Cápsulas
- Otros
- Otros
- Actual
- Otros
- Productos para el cuidado de la vista
- Gafas
- Lentes de contacto
- Lentes de contacto blandas
- Lentes de contacto híbridos
- Lentes rígidos permeables al gas
- Otros
- Productos para el cuidado de la vista
Por enfermedades
- Catarata
- Trastornos refractivos
- Glaucoma
- Degeneración macular relacionada con la edad
- Enfermedades inflamatorias
- Otros
Mediante un examen ocular completo
- Refracción
- Refractómetros automáticos
- Juego de lentes de prueba
- Medicamentos ciclopléjicos
- Marco de prueba
- Retinoscopio autoiluminado/de espejo
- Cilindro de cruz de Jackson
- Prueba de agudeza visual
- Diagrama de Snellen
- Gráficos de visión cercana
- Presión intraocular
- Tonómetros (Goldmann, Tono-Pen, Perkins, Shiotz)
- Otros
- Examen del segmento anterior y pupilar
- Biomicroscopio con lámpara de hendidura
- Luz de antorcha
- Prueba de campos visuales
- Analizador de campo visual Humphrey de umbral completo Central 30-2
- Perímetro de duplicación de frecuencia
- Perímetro cinético de Goldmann
- Prueba de visión del color
- Otros
Por el usuario final
- Clínicas
- Hospitales
- Atención médica domiciliaria
- Otros
Por canal de distribución
- Ventas al por menor
- Tiendas minoristas
- Farmacia hospitalaria
- Farmacia en línea
- Licitación directa
- Otros
Análisis regional del mercado de oftalmología en Asia y el Pacífico
El mercado está segmentado en función de productos, enfermedades, examen ocular integral, usuario final y canal de distribución.
Los países cubiertos en el mercado son China, India, Japón, Corea del Sur, Australia, Indonesia, Tailandia, Malasia, Filipinas, Singapur y el resto de Asia-Pacífico.
Se espera que China domine y crezca más rápidamente en el mercado debido a su avanzada infraestructura sanitaria, el alto gasto en atención médica y una gran población envejecida con una creciente prevalencia de enfermedades oculares. Además, las inversiones significativas en investigación, desarrollo y adopción de tecnologías de vanguardia impulsan el liderazgo del mercado en la región.
La sección de países del informe también proporciona factores de impacto de mercado individuales y cambios en la regulación en el mercado a nivel nacional que afectan las tendencias actuales y futuras del mercado. Puntos de datos como análisis de la cadena de valor aguas arriba y aguas abajo, tendencias técnicas y análisis de las cinco fuerzas de Porter, estudios de casos son algunos de los indicadores utilizados para pronosticar el escenario del mercado para países individuales. Además, la presencia y disponibilidad de marcas de Asia-Pacífico y sus desafíos enfrentados debido a la competencia grande o escasa de las marcas locales y nacionales, el impacto de los aranceles nacionales y las rutas comerciales se consideran al proporcionar un análisis de pronóstico de los datos del país.
Cuota de mercado de la oftalmología en Asia y el Pacífico
El panorama competitivo del mercado proporciona detalles por competidor. Los detalles incluidos son una descripción general de la empresa, las finanzas de la empresa, los ingresos generados, el potencial de mercado, la inversión en investigación y desarrollo, las nuevas iniciativas de mercado, la presencia en Asia-Pacífico, los sitios e instalaciones de producción, las capacidades de producción, las fortalezas y debilidades de la empresa, el lanzamiento de productos, la amplitud y variedad de productos, y el dominio de las aplicaciones. Los puntos de datos anteriores proporcionados solo están relacionados con el enfoque de las empresas en relación con el mercado.
Los líderes del mercado de oftalmología de Asia y el Pacífico que operan en el mercado son:
- Alcon (Suiza)
- Bausch + Lomb (Canadá)
- Carl Zeiss Meditec (Alemania)
- Corporación Hoya (Japón)
- Johnson & Johnson Services, Inc. (Estados Unidos)
- Essilor Internacional (Francia)
- Corporación Topcon (Japón)
- Corporación Glaukos (Estados Unidos)
- Grupo Haag-Streit (Suiza)
- Nidek Co., Ltd (Estados Unidos)
- Cirugía Staar (California)
- Ziemer Ophthalmic Systems Ag (Suiza)
- Cooper Companies (Estados Unidos)
Últimos avances en el mercado oftalmológico de Asia y el Pacífico
- En octubre de 2024, en la reunión AAO 2024, Alcon presentó sus innovaciones, incluido el Voyager DSLT para el tratamiento del glaucoma, los sistemas portátiles de suministro de gas UNIFEYE y UNIPEXY y datos fundamentales para AR-15512, un tratamiento para el ojo seco. Estos avances apuntaban a mejorar los resultados y la eficiencia quirúrgica.
- En septiembre de 2024, EssilorLuxottica y Meta ampliarán su colaboración y firmarán un acuerdo a largo plazo para desarrollar gafas inteligentes multigeneracionales. Basándose en el éxito de las gafas Ray-Ban Meta, las empresas aspiran a dar forma juntas al futuro de la tecnología portátil
- En OCTUBRE DE 2024, Bausch + Lomb presentó nuevos datos científicos y eventos educativos en la reunión de la AAO de 2024 en Chicago. Entre los aspectos más destacados se incluyeron estudios sobre la lente intraocular enVista Envy, el láser excimer TENEO, VYZULTA y presentaciones sobre Blink Nutritears, MIEBO y Xiidra.
- En abril de 2024, AbbVie completó la adquisición de Cerevel Therapeutics, lo que mejoró su cartera de productos en neurociencia. La adquisición incluye los prometedores activos en etapa clínica de Cerevel, como emraclidina para la esquizofrenia y tavapadon para la enfermedad de Parkinson, lo que fortalece la posición de AbbVie en neurología y psiquiatría.
- En septiembre de 2023, Novartis completó la desinversión de sus activos de oftalmología "front of eye" a Bausch + Lomb por hasta USD 2.500 millones, incluidos USD 1.750 millones en efectivo por adelantado y posibles pagos por hitos. El acuerdo incluyó Xiidra®, SAF312, AcuStream y OJL332. Novartis avanzó en su estrategia para centrarse en áreas terapéuticas prioritarias para el crecimiento futuro
SKU-
Obtenga acceso en línea al informe sobre la primera nube de inteligencia de mercado del mundo

- Panel de análisis de datos interactivo
- Panel de análisis de empresas para oportunidades con alto potencial de crecimiento
- Acceso de analista de investigación para personalización y consultas
- Análisis de la competencia con panel interactivo
- Últimas noticias, actualizaciones y análisis de tendencias
- Aproveche el poder del análisis de referencia para un seguimiento integral de la competencia
Tabla de contenido
1 INTRODUCTION
1.1 OBJECTIVES OF THE STUDY
1.2 MARKET DEFINITION
1.3 OVERVIEW OF THE ASIA-PACIFIC OPHTHALMOLOGY MARKET
1.4 CURRENCY AND PRICING
1.5 LIMITATIONS
1.6 MARKETS COVERED
2 MARKET SEGMENTATION
2.1 MARKETS COVERED
2.2 GEOGRAPHICAL SCOPE
2.3 YEARS CONSIDERED FOR THE STUDY
2.4 DBMR TRIPOD DATA VALIDATION MODEL
2.5 PRIMARY INTERVIEWS WITH KEY OPINION LEADERS
2.6 MULTIVARIATE MODELLING
2.7 MARKET APPLICATION COVERAGE GRID
2.8 PRODUCT LIFELINE CURVE
2.9 DBMR MARKET POSITION GRID
2.1 VENDOR SHARE ANALYSIS
2.11 SECONDARY SOURCES
2.12 ASSUMPTIONS
3 EXECUTIVE SUMMARY
4 PREMIUM INSIGHTS
4.1 PESTAL ANALYSIS
4.2 PORTERS FIVE FORCES ANALYSIS
5 ASIA-PACIFIC OPHTHALMOLOGY MARKET : REGULATIONS
6 MARKET OVERVIEW
6.1 DRIVERS
6.1.1 INCREASING PREVALENCE OF EYE DISEASES
6.1.2 FOCUS ON PREVENTATIVE EYE CARE
6.1.3 GOVERNMENT EYECARE INITIATIVES
6.1.4 INNOVATIONS IN OPHTHALMIC SURGICAL TECHNIQUES
6.2 RESTRAINTS
6.2.1 SIDE EFFECTS AND COMPLICATIONS RELATED TO EYE SURGERIES
6.2.2 LIMITED ACCESS TO SPECIALIZED OPHTHALMIC CARE IN RURAL AREAS
6.3 OPPORTUNITIES
6.3.1 RISE IN THE AGING POPULATION
6.3.2 RISE IN ONLINE RETAIL AND E-HEALTH PLATFORMS
6.3.3 ENHANCED PATIENT EDUCATION
6.4 CHALLENGES
6.4.1 RISING COSTS OF OPHTHALMIC TREATMENTS
6.4.2 SHORTAGE OF EYE CARE PROFESSIONALS
7 ASIA-PACIFIC OPHTHALMOLOGY MARKETASIA-PACIFIC OPHTHALMOLOGY MARKET, BY PRODUCTS
7.1 OVERVIEW
7.2 DEVICE
7.2.1 SURGICAL DEVICE
7.2.1.1 CATARACT SURGICAL DEVICES
7.2.1.2 OPHTHALMIC VISCOELASTIC DEVICES
7.2.1.2.1 PHACOEMULSIFICATION DEVICES
7.2.1.2.2 CATARACT SURGICAL LASERS
7.2.1.2.3 IOL INJECTORS
7.2.1.3 VITREORETINAL SURGICAL DEVICES
7.2.1.3.1 VITREORETINAL PACKS
7.2.1.3.2 VITRECTOMY MACHINES
7.2.1.3.3 VITRECTOMY PROBES
7.2.1.3.4 PHOTOCOAGULATION LASERS
7.2.1.3.5 ILLUMINATION DEVICES
7.2.1.4 REFRACTIVE SURGICAL DEVICES
7.2.1.4.1 FEMTOSECOND LASERS
7.2.1.4.2 EXCIMER LASERS
7.2.1.4.3 OTHER REFRACTIVE SURGICAL LASERS
7.2.1.5 GLAUCOMA SURGICAL DEVICES
7.2.1.5.1 GLAUCOMA DRAINAGE DEVICES
7.2.1.5.2 GLAUCOMA LASER SYSTEMS
7.2.1.5.3 MICRO INVASIVE GLAUCOMA SURGERY DEVICES
7.2.2 DIAGNOSTIC DEVICE
7.2.2.1 OPTICAL COHERENCE TOMOGRAPHY (OCT) SCANNERS
7.2.2.2 AUTOREFRACTORS & KERATOMETERS
7.2.2.3 TONOMETERS
7.2.2.4 PHOROPTERS
7.2.2.5 RETINOSCOPES
7.2.2.6 OPHTHALMOSCOPES
7.2.2.7 SLIT LAMPS
7.2.2.8 PERIMETERS/VISUAL FIELD ANALYZERS
7.2.2.9 CORNEAL TOPOGRAPHY SYSTEMS
7.2.2.10 FUNDUS CAMERAS
7.2.2.11 OPHTHALMIC ULTRASOUND IMAGING SYSTEMS
7.2.2.11.1 A- SCAN IMAGING SYSTEM
7.2.2.11.2 B-SCAN IMAGING SYSTEM
7.2.2.11.3 PACHYMETERS
7.2.2.11.4 ULTRASOUND BIOMICROSCOPES
7.2.2.12 LENSMETERS
7.2.2.13 WAVEFRONT ABERROMETERS
7.2.2.14 OPTICAL BIOMETRY SYSTEMS
7.2.2.15 SPECULAR MICROSCOPES
7.2.2.16 CHART PROJECTORS
7.2.3 OPHTHALMIC SURGICAL ACCESSORIES
7.2.3.1 SURGICAL INSTRUMENTS & KITS
7.2.3.2 OPHTHALMIC FORCEPS
7.2.3.3 OPHTHALMIC SPATULA
7.2.3.4 OPHTHALMIC TIPS AND HANDLES
7.2.3.5 OPHTHALMIC CANNULAS
7.2.3.6 OPHTHALMIC SCISSORS
7.2.3.7 OTHERS SURGICAL ACCESSORIES
7.2.4 OPHTHALMIC MICROSCOPES
7.3 DRUGS
7.3.1 ANTI-VEGF DRUGS
7.3.1.1 RANIBIZUMAB
7.3.1.2 BEVACIZUMAB
7.3.2 ANTI-GLAUCOMA DRUGS
7.3.2.1 PROSTAGLANDIN ANALOGS
7.3.2.1.1 LATANOPROST
7.3.2.1.2 BIMATOPROST
7.3.2.1.3 TRAVOPROST
7.3.2.1.4 TAFLUPROST
7.3.2.1.5 LATANOPROSTENE
7.3.2.2 BETA ADRENERGIC ANTAGONISTS
7.3.2.2.1 TIMOLAL MALEATE
7.3.2.2.2 BETAXOLOL
7.3.2.3 ALPHA ADRENERGIC AGONISTS
7.3.2.3.1 EPINEPHRINE
7.3.2.3.2 DEPIVEPRINE
7.3.2.4 MIOTICS
7.3.2.4.1 PILOCARPINE
7.3.2.4.2 ESERINE
7.3.3 ANTI-INFLAMMATION DRUGS
7.3.3.1 STEROIDAL ANTI-INFLAMMATORY DRUGS
7.3.3.2 NON-STEROIDAL ANTI-INFLAMMATORY DRUGS
7.3.4 RETINAL DISORDER DRUGS
7.3.5 DRY EYE DRUGS
7.3.6 ALLERGIC CONJUCTIVITIS DRUGS
7.3.7 OTHERS
7.3.7.1 BRANDED
7.3.7.2 GENERIC
7.3.7.3 PRESCRIPTION
7.3.7.4 OVER THE COUNTER
7.3.7.5 TOPICAL
7.3.7.6 LOCAL OCULAR
7.3.7.7 INJECTABLES
7.3.7.8 ORAL
7.3.7.9 OTHERS
7.3.7.10 EYE DROPS
7.3.7.11 EYE SOLUTION
7.3.7.12 CREAM & OINTMENTS
7.3.7.13 GEL
7.3.7.14 OTHERS
7.3.7.15 INTRAVITREAL
7.3.7.16 SUBCONJUNCTIVAL
7.3.7.17 RETROBULBAR
7.3.7.18 INTRACAMERAL
7.3.7.19 INTRAMUSCULAR
7.3.7.20 INTRAVENOUS
7.3.7.21 OTHERS
7.3.7.22 TABLET
7.3.7.23 CAPSULES
7.3.7.24 OTHERS
7.4 OTHERS
7.4.1 VISION CARE PRODUCTS
7.4.1.1 SPECTACLES
7.4.1.2 CONTACT LENSES
7.4.1.2.1 SOFT CONTACT LENSES
7.4.1.2.2 HYBRID CONTACT LENSES
7.4.1.2.3 RIGID GAS PERMEABLE LENSES
7.4.2 OTHERS
8 ASIA-PACIFIC OPHTHALMOLOGY MARKET, BY DISEASES
8.1 OVERVIEW
8.2 CATARACT
8.3 REFRACTIVE DISORDERS
8.4 GLAUCOMA
8.5 AGE-RELATED MACULAR DEGENERATION
8.6 INFLAMMATORY DISEASES
8.7 OTHERS
9 ASIA-PACIFIC OPHTHALMOLOGY MARKET, BY COMPREHENSIVE EYE EXAMINATION
9.1 OVERVIEW
9.2 REFRACTION
9.2.1 AUTOMATED REFRACTOMETERS
9.2.2 SET OF TRIAL LENSES
9.2.3 CYCLOPLEGIC DRUGS
9.2.4 TRIAL FRAME
9.2.5 SELF-ILLUMINATED/ MIRROR RETINOSCOPE
9.2.6 JACKSON CROSS CYLINDER
9.3 VISUAL ACUITY TEST
9.3.1 SNELLEN'S CHART
9.3.2 NEAR VISION CHARTS
9.4 INTRAOCULAR PRESSURE
9.4.1 TONOMETERS (GOLDMANN, TONO-PEN, PERKINS, SHIOTZ)
9.4.2 OTHERS
9.5 ANTERIOR SEGMENT AND PUPILLARY EXAMINATION
9.5.1 SLIT LAMP BIOMICROSCOPE
9.5.2 TORCH LIGHT
9.6 VISUAL FIELDS TEST
9.6.1 CENTRAL 30-2 FULL THRESHOLD HUMPHREY VISUAL FIELD ANALYZER
9.6.2 FREQUENCY DOUBLING PERIMETER
9.6.3 GOLDMANN KINETIC PERIMETER
9.7 COLOR VISION TEST
9.8 OTHERS
10 ASIA-PACIFIC OPHTHALMOLOGY MARKET, BY END USER
10.1 OVERVIEW
10.2 CLINICS
10.3 HOSPITALS
10.4 HOME HEALTHCARE
10.5 OTHERS
11 ASIA-PACIFIC OPHTHALMOLOGY MARKET, BY DISTRIBUTION CHANNEL
11.1 OVERVIEW
11.2 RETAIL SALES
11.2.1 RETAIL SHOPS
11.2.2 HOSPITAL PHARMACY
11.2.3 ONLINE PHARMACY
11.3 DIRECT TENDER
11.4 OTHERS
12 ASIA-PACIFIC OPHTHALMOLOGY MARKET BY GEOGRAPHY
12.1 ASIA-PACIFIC
12.1.1 CHINA
12.1.2 INDIA
12.1.3 JAPAN
12.1.4 SOUTH KOREA
12.1.5 AUSTRALIA
12.1.6 INDONESIA
12.1.7 THAILAND
12.1.8 MALAYSIA
12.1.9 PHILIPPINES
12.1.10 SINGAPORE
12.1.11 REST OF ASIA-PACIFIC
13 ASIA-PACIFIC OPHTHALMOLOGY MARKET: COMPANY LANDSCAPE
13.1 COMPANY SHARE ANALYSIS: ASIA-PACIFIC
14 SWOT ANALYSIS
15 COMPANY PROFILES
15.1 ALCON
15.1.1 COMPANY SNAPSHOT
15.1.2 REVENUE ANALYSIS
15.1.3 COMPANY SHARE ANALYSIS
15.1.4 PRODUCT PORTFOLIO
15.1.5 RECENT DEVELOPMENT
15.2 JOHNSON & JOHNSON SERVICES, INC.
15.2.1 COMPANY SNAPSHOT
15.2.2 REVENUE ANALYSIS
15.2.3 COMPANY SHARE ANALYSIS
15.2.4 PRODUCT PORTFOLIO
15.2.5 RECENT DEVELOPMENT
15.3 ESSILOR LUXOTTICA
15.3.1 COMPANY SNAPSHOT
15.3.2 REVENUE ANALYSIS
15.3.3 COMPANY SHARE ANALYSIS
15.3.4 PRODUCT PORTFOLIO
15.3.5 RECENT DEVELOPMENT
15.4 NOVARTIS AG
15.4.1 COMPANY SNAPSHOT
15.4.2 REVENUE ANALYSIS
15.4.3 COMPANY SHARE ANALYSIS
15.4.4 PRODUCT PORTFOLIO
15.4.5 RECENT DEVELOPMENT
15.5 BAUSCH + LOMB
15.5.1 COMPANY SNAPSHOT
15.5.2 COMPANY SHARE ANALYSIS
15.5.3 REVENUE ANALYSIS
15.5.4 PRODUCT PORTFOLIO
15.5.5 RECENT DEVELOPMENT
15.6 ABBVIE INC.
15.6.1 COMPANY SNAPSHOT
15.6.2 REVENUE ANALYSIS
15.6.3 PRODUCT PORTFOLIO
15.6.4 RECENT DEVELOPMENT
15.7 BAYER AG
15.7.1 COMPANY SNAPSHOT
15.7.2 REVENUE ANALYSIS
15.7.3 PRODUCT PORTFOLIO
15.7.4 RECENT DEVELOPMENT
15.8 CARL ZEISS MEDITEC AG
15.8.1 COMPANY SNAPSHOT
15.8.2 REVENUE ANALYSIS
15.8.3 PRODUCT PORTFOLIO
15.8.4 RECENT DEVELOPMENT
15.9 COOPER COMPANIES
15.9.1 COMPANY SNAPSHOT
15.9.2 REVENUE ANALYSIS
15.9.3 PRODUCT PORTFOLIO
15.1 DOMPÉ
15.10.1 COMPANY SNAPSHOT
15.10.2 PRODUCT PORTFOLIO
15.10.3 RECENT DEVELOPMENT
15.11 F. HOFFMANN-LA ROCHE LTD
15.11.1 COMPANY SNAPSHOT
15.11.2 REVENUE ANALYSIS
15.11.3 PRODUCT PORTFOLIO
15.11.4 RECENT DEVELOPMENT
15.12 GLAUKOS CORPORATION
15.12.1 COMPANY SNAPSHOT
15.12.2 REVENUE ANALYSIS
15.12.3 PRODUCT PORTFOLIO
15.12.4 RECENT DEVELOPMENT
15.13 HAAG-STREIT
15.13.1 COMPANY SNAPSHOT
15.13.2 PRODUCT PORTFOLIO
15.13.3 RECENT DEVELOPMENT
15.14 HOYA CORPORATION
15.14.1 COMPANY SNAPSHOT
15.14.2 REVENUE ANALYSIS
15.14.3 PRODUCT PORTFOLIO
15.14.4 RECENT DEVELOPMENT
15.15 LUMENIS BE LTD.
15.15.1 COMPANY SNAPSHOT
15.15.2 PRODUCT PORTFOLIO
15.15.3 RECENT DEVELOPMENT
15.16 NIDEK CO.
15.16.1 COMPANY SNAPSHOT
15.16.2 PRODUCT PORTFOLIO
15.16.3 RECENT DEVELOPMENT
15.17 REICHERT, INC
15.17.1 COMPANY SNAPSHOT
15.17.2 REVENUE ANALYSIS
15.17.3 PRODUCT PORTFOLIO
15.17.4 RECENT DEVELOPMENT
15.18 SANTEN PHARMACEUTICAL CO.
15.18.1 COMPANY SNAPSHOT
15.18.2 REVENUE ANALYSIS
15.18.3 PRODUCT PORTFOLIO
15.18.4 RECENT DEVELOPMENT
15.19 STAAR SURGICAL
15.19.1 COMPANY SNAPSHOT
15.19.2 REVENUE ANALYSIS
15.19.3 PRODUCT PORTFOLIO
15.19.4 RECENT DEVELOPMENT
15.2 TOPCON CORPORATION
15.20.1 COMPANY SNAPSHOT
15.20.2 REVENUE ANALYSIS
15.20.3 PRODUCT PORTFOLIO
15.20.4 RECENT DEVELOPMENT
15.21 ZIEMER OPHTHALMIC SYSTEMS AG
15.21.1 COMPANY SNAPSHOT
15.21.2 PRODUCT PORTFOLIO
15.21.3 RECENT DEVELOPMENT
16 QUESTIONNAIRE
17 RELATED REPORTS
Lista de Tablas
TABLE 1 ASIA-PACIFIC OPHTHALMOLOGY MARKET, BY PRODUCTS, 2018-2032 (USD MILLION)
TABLE 2 ASIA-PACIFIC DEVICE IN OPHTHALMOLOGY MARKET, BY PRODUCTS, 2018-2032 (USD MILLION)
TABLE 3 ASIA-PACIFIC SURGICAL DEVICE IN OPHTHALMOLOGY MARKET, BY PRODUCT, 2018-2032 (USD MILLION)
TABLE 4 ASIA-PACIFIC OPHTHALMIC VISCOELASTIC DEVICES IN OPHTHALMOLOGY MARKET, BY PRODUCTS, 2018-2032 (USD MILLION)
TABLE 5 ASIA-PACIFIC VITREORETINAL SURGICAL DEVICES IN OPHTHALMOLOGY MARKET, BY PRODUCTS, 2018-2032 (USD MILLION)
TABLE 6 ASIA-PACIFIC REFRACTIVE SURGICAL DEVICES IN OPHTHALMOLOGY MARKET, BY PRODUCTS, 2021-2032 (USD MILLION)
TABLE 7 ASIA-PACIFIC GLAUCOMA SURGICAL DEVICES IN OPHTHALMOLOGY MARKET, BY PRODUCTS, 2018-2032 (USD MILLION)
TABLE 8 ASIA-PACIFIC DIAGNOSTIC DEVICE IN OPHTHALMOLOGY MARKET, BY PRODUCTS, 2018-2032 (USD MILLION)
TABLE 9 ASIA-PACIFIC OPHTHALMIC ULTRASOUND IMAGING SYSTEMS IN OPHTHALMOLOGY MARKET, BY PRODUCTS, 2018-2032 (USD MILLION)
TABLE 10 ASIA-PACIFIC OPHTHALMIC SURGICAL ACCESSORIES IN OPHTHALMOLOGY MARKET, BY PRODUCTS, 2018-2032 (USD MILLION)
TABLE 11 ASIA-PACIFIC DRUGS IN OPHTHALMOLOGY MARKET, BY PRODUCTS, 2021-2032 (USD MILLION)
TABLE 12 ASIA-PACIFIC ANTI-VEGF DRUGS IN OPHTHALMOLOGY MARKET, BY PRODUCTS, 2021-2032 (USD MILLION)
TABLE 13 ASIA-PACIFIC ANTI-GLAUCOMA DRUGS IN OPHTHALMOLOGY MARKET, BY PRODUCTS, 2018-2032 (USD MILLION)
TABLE 14 ASIA-PACIFIC PROSTAGLANDIN ANALOGS IN OPHTHALMOLOGY MARKET, BY PRODUCTS, 2018-2032 (USD MILLION)
TABLE 15 ASIA-PACIFIC BETA ADRENERGIC ANTAGONISTS IN OPHTHALMOLOGY MARKET, BY PRODUCTS, 2018-2032 (USD MILLION)
TABLE 16 ASIA-PACIFIC ALPHA ADRENERGIC AGONISTS IN OPHTHALMOLOGY MARKET, BY PRODUCTS, 2021-2032 (USD MILLION)
TABLE 17 ASIA-PACIFIC MIOTICS IN OPHTHALMOLOGY MARKET, BY PRODUCTS, 2021-2032 (USD MILLION)
TABLE 18 ASIA-PACIFIC ANTI INFLAMMATION DRUGS IN OPHTHALMOLOGY MARKET, BY PRODUCTS, 2021-2032 (USD MILLION)
TABLE 19 ASIA-PACIFIC DRUGS IN OPHTHALMOLOGY MARKET, BY DRUG TYPE, 2018-2032 (USD MILLION)
TABLE 20 ASIA-PACIFIC DRUGS IN OPHTHALMOLOGY MARKET, BY PRESCRIPTION MODE, 2018-2032 (USD MILLION)
TABLE 21 ASIA-PACIFIC DRUGS IN OPHTHALMOLOGY MARKET, BY ROUTE OF ADMINISTRATION, 2018-2032 (USD MILLION)
TABLE 22 ASIA-PACIFIC TOPICAL IN OPHTHALMOLOGY MARKET, BY ROUTE OF ADMINISTRATION, 2018-2032 (USD MILLION)
TABLE 23 ASIA-PACIFIC LOCAL OCULAR IN OPHTHALMOLOGY MARKET, BY ROUTE OF ADMINISTRATION, 2018-2032 (USD MILLION)
TABLE 24 ASIA-PACIFIC INJECTABLES IN OPHTHALMOLOGY MARKET, BY ROUTE OF ADMINISTRATION, 2018-2032 (USD MILLION)
TABLE 25 ASIA-PACIFIC ORAL IN OPHTHALMOLOGY MARKET, BY ROUTE OF ADMINISTRATION, 2018-2032 (USD MILLION)
TABLE 26 ASIA-PACIFIC OTHERS IN OPHTHALMOLOGY MARKET, BY PRODUCTS, 2018-2032 (USD MILLION)
TABLE 27 ASIA-PACIFIC VISION CARE PRODUCTS IN OPHTHALMOLOGY MARKET, BY PRODUCTS, 2018-2032 (USD MILLION)
TABLE 28 ASIA-PACIFIC CONTACT LENSES IN OPHTHALMOLOGY MARKET, BY PRODUCTS, 2018-2032 (USD MILLION)
TABLE 29 ASIA-PACIFIC OPHTHALMOLOGY MARKET, BY DISEASES, 2018-2032 (USD MILLION)
TABLE 30 ASIA-PACIFIC CATARACT IN OPHTHALMOLOGY MARKET, BY REGION, 2018-2032 (USD MILLION)
TABLE 31 ASIA-PACIFIC REFRACTIVE DISORDERS IN OPHTHALMOLOGY MARKET, BY REGION, 2018-2032 (USD MILLION)
TABLE 32 ASIA-PACIFIC GLAUCOMA IN OPHTHALMOLOGY MARKET, BY REGION, 2018-2032 (USD MILLION)
TABLE 33 ASIA-PACIFIC AGE-RELATED MACULAR DEGENERATION IN OPHTHALMOLOGY MARKET, BY REGION, 2018-2032 (USD MILLION)
TABLE 34 ASIA-PACIFIC INFLAMMATORY DISEASES IN OPHTHALMOLOGY MARKET, BY REGION, 2018-2032 (USD MILLION)
TABLE 35 ASIA-PACIFIC OTHERS IN OPHTHALMOLOGY MARKET, BY REGION, 2018-2032 (USD MILLION)
TABLE 36 ASIA-PACIFIC OPHTHALMOLOGY MARKET, BY COMPREHENSIVE EYE EXAMINATION, 2018-2032 (USD MILLION)
TABLE 37 ASIA-PACIFIC REFRACTION IN OPHTHALMOLOGY MARKET, BY REGION, 2018-2032 (USD MILLION)
TABLE 38 ASIA-PACIFIC REFRACTION IN OPHTHALMOLOGY MARKET, BY COMPREHENSIVE EYE EXAMINATION, 2018-2032 (USD MILLION)
TABLE 39 ASIA-PACIFIC VISUAL ACUITY TEST IN OPHTHALMOLOGY MARKET, BY REGION, 2018-2032 (USD MILLION)
TABLE 40 ASIA-PACIFIC VISUAL ACUITY TEST IN OPHTHALMOLOGY MARKET, BY COMPREHENSIVE EYE EXAMINATION, 2018-2032 (USD MILLION)
TABLE 41 ASIA-PACIFIC INTRAOCULAR PRESSURE IN OPHTHALMOLOGY MARKET, BY REGION, 2018-2032 (USD MILLION)
TABLE 42 ASIA-PACIFIC INTRAOCULAR PRESSURE IN OPHTHALMOLOGY MARKET, BY COMPREHENSIVE EYE EXAMINATION, 2018-2032 (USD MILLION)
TABLE 43 ASIA-PACIFIC ANTERIOR SEGMENT AND PUPILLARY EXAMINATION IN OPHTHALMOLOGY MARKET, BY REGION, 2018-2032 (USD MILLION)
TABLE 44 ASIA-PACIFIC ANTERIOR SEGMENT AND PUPILLARY EXAMINATION IN OPHTHALMOLOGY MARKET, BY COMPREHENSIVE EYE EXAMINATION, 2018-2032 (USD MILLION)
TABLE 45 ASIA-PACIFIC VISUAL FIELDS TEST IN OPHTHALMOLOGY MARKET, BY REGION, 2018-2032 (USD MILLION)
TABLE 46 ASIA-PACIFIC VISUAL FIELDS TEST IN OPHTHALMOLOGY MARKET, BY COMPREHENSIVE EYE EXAMINATION, 2018-2032 (USD MILLION)
TABLE 47 ASIA-PACIFIC COLOR VISION TEST IN OPHTHALMOLOGY MARKET, BY REGION, 2018-2032 (USD MILLION)
TABLE 48 ASIA-PACIFIC OTHERS IN OPHTHALMOLOGY MARKET, BY REGION, 2018-2032 (USD MILLION)
TABLE 49 ASIA-PACIFIC OPHTHALMOLOGY MARKET, BY END USER, 2018-2032 (USD MILLION)
TABLE 50 ASIA-PACIFIC CLINICS IN OPHTHALMOLOGY MARKET, BY REGION, 2018-2032 (USD MILLION)
TABLE 51 ASIA-PACIFIC HOSPITALS IN OPHTHALMOLOGY MARKET, BY REGION, 2018-2032 (USD MILLION)
TABLE 52 ASIA-PACIFIC HOME HEALTHCARE IN OPHTHALMOLOGY MARKET, BY REGION, 2018-2032 (USD MILLION)
TABLE 53 ASIA-PACIFIC OTHERS IN OPHTHALMOLOGY MARKET, BY REGION, 2018-2032 (USD MILLION)
TABLE 54 ASIA-PACIFIC OPHTHALMOLOGY MARKET, BY DISTRIBUTION CHANNEL, 2018-2032 (USD MILLION)
TABLE 55 ASIA-PACIFIC RETAIL SALES IN OPHTHALMOLOGY MARKET, BY REGION, 2018-2032 (USD MILLION)
TABLE 56 ASIA-PACIFIC RETAIL SALES IN OPHTHALMOLOGY MARKET, BY DISTRIBUTION CHANNEL, 2018-2032 (USD MILLION)
TABLE 57 ASIA-PACIFIC DIRECT TENDER IN OPHTHALMOLOGY MARKET, BY REGION, 2018-2032 (USD MILLION)
TABLE 58 ASIA-PACIFIC OTHERS IN OPHTHALMOLOGY MARKET, BY REGION, 2018-2032 (USD MILLION)
TABLE 59 ASIA-PACIFIC OPHTHALMOLOGY MARKET, BY COUNTRY, 2018-2032 (USD MILLION)
TABLE 60 ASIA-PACIFIC OPHTHALMOLOGY MARKET, BY PRODUCTS, 2018-2032 (USD MILLION)
TABLE 61 ASIA-PACIFIC DEVICE IN OPHTHALMOLOGY MARKET, BY PRODUCTS, 2018-2032 (USD MILLION)
TABLE 62 ASIA-PACIFIC SURGICAL DEVICE IN OPHTHALMOLOGY MARKET, BY PRODUCT, 2018-2032 (USD MILLION)
TABLE 63 ASIA-PACIFIC OPHTHALMIC VISCOELASTIC DEVICES IN OPHTHALMOLOGY MARKET, BY PRODUCTS, 2018-2032 (USD MILLION)
TABLE 64 ASIA-PACIFIC VITREORETINAL SURGICAL DEVICES IN OPHTHALMOLOGY MARKET, BY PRODUCTS, 2018-2032 (USD MILLION)
TABLE 65 ASIA-PACIFIC REFRACTIVE SURGICAL DEVICES IN OPHTHALMOLOGY MARKET, BY PRODUCTS, 2018-2032 (USD MILLION)
TABLE 66 ASIA-PACIFIC GLAUCOMA SURGICAL DEVICES IN OPHTHALMOLOGY MARKET, BY PRODUCTS, 2018-2032 (USD MILLION)
TABLE 67 ASIA-PACIFIC DIAGNOSTIC DEVICE IN OPHTHALMOLOGY MARKET, BY PRODUCTS, 2018-2032 (USD MILLION)
TABLE 68 ASIA-PACIFIC OPHTHALMIC ULTRASOUND IMAGING SYSTEMS IN OPHTHALMOLOGY MARKET, BY PRODUCTS, 2018-2032 (USD MILLION)
TABLE 69 ASIA-PACIFIC OPHTHALMIC SURGICAL ACCESSORIES IN OPHTHALMOLOGY MARKET, BY PRODUCTS, 2018-2032 (USD MILLION)
TABLE 70 ASIA-PACIFIC DRUGS IN OPHTHALMOLOGY MARKET, BY PRODUCTS, 2018-2032 (USD MILLION)
TABLE 71 ASIA-PACIFIC ANTI-VEGF DRUGS IN OPHTHALMOLOGY MARKET, BY PRODUCTS, 2018-2032 (USD MILLION)
TABLE 72 ASIA-PACIFIC ANTI-GLAUCOMA DRUGS IN OPHTHALMOLOGY MARKET, BY PRODUCTS, 2018-2032 (USD MILLION)
TABLE 73 ASIA-PACIFIC PROSTAGLANDIN ANALOGS IN OPHTHALMOLOGY MARKET, BY PRODUCTS, 2018-2032 (USD MILLION)
TABLE 74 ASIA-PACIFIC BETA ADRENERGIC ANTAGONISTS IN OPHTHALMOLOGY MARKET, BY PRODUCTS, 2018-2032 (USD MILLION)
TABLE 75 ASIA-PACIFIC ALPHA ADRENERGIC AGONISTS IN OPHTHALMOLOGY MARKET, BY PRODUCTS, 2018-2032 (USD MILLION)
TABLE 76 ASIA-PACIFIC MIOTICS IN OPHTHALMOLOGY MARKET, BY PRODUCTS, 2018-2032 (USD MILLION)
TABLE 77 ASIA-PACIFIC ANTI-INFLAMMATORY DRUGS IN OPHTHALMOLOGY MARKET, BY PRODUCTS, 2018-2032 (USD MILLION)
TABLE 78 ASIA-PACIFIC OTHERS IN OPHTHALMOLOGY MARKET, BY PRODUCTS, 2018-2032 (USD MILLION)
TABLE 79 ASIA-PACIFIC VISION CARE PRODUCTS IN OPHTHALMOLOGY MARKET, BY PRODUCTS, 2018-2032 (USD MILLION)
TABLE 80 ASIA-PACIFIC CONTACT LENSES IN OPHTHALMOLOGY MARKET, BY PRODUCTS, 2018-2032 (USD MILLION)
TABLE 81 ASIA-PACIFIC OPHTHALMOLOGY MARKET, BY DISEASES, 2018-2032 (USD MILLION)
TABLE 82 ASIA-PACIFIC DRUGS IN OPHTHALMOLOGY MARKET, BY DRUG TYPE, 2018-2032 (USD MILLION)
TABLE 83 ASIA-PACIFIC DRUGS IN OPHTHALMOLOGY MARKET, BY PRESCRIPTION MODE, 2018-2032 (USD MILLION)
TABLE 84 ASIA-PACIFIC DRUGS IN OPHTHALMOLOGY MARKET, BY ROUTE OF ADMINISTRATION, 2018-2032 (USD MILLION)
TABLE 85 ASIA-PACIFIC TOPICAL IN OPHTHALMOLOGY MARKET, BY ROUTE OF ADMINISTRATION, 2018-2032 (USD MILLION)
TABLE 86 ASIA-PACIFIC LOCAL OCULAR IN OPHTHALMOLOGY MARKET, BY ROUTE OF ADMINISTRATION, 2018-2032 (USD MILLION)
TABLE 87 ASIA-PACIFIC INJECTABLES IN OPHTHALMOLOGY MARKET, BY ROUTE OF ADMINISTRATION, 2018-2032 (USD MILLION)
TABLE 88 ASIA-PACIFIC ORAL IN OPHTHALMOLOGY MARKET, BY ROUTE OF ADMINISTRATION, 2018-2032 (USD MILLION)
TABLE 89 ASIA-PACIFIC OPHTHALMOLOGY MARKET, BY COMPREHENSIVE EYE EXAMINATION, 2018-2032 (USD MILLION)
TABLE 90 ASIA-PACIFIC REFRACTION IN OPHTHALMOLOGY MARKET, BY COMPREHENSIVE EYE EXAMINATION, 2018-2032 (USD MILLION)
TABLE 91 ASIA-PACIFIC VISUAL ACUITY TEST IN OPHTHALMOLOGY MARKET, BY COMPREHENSIVE EYE EXAMINATION, 2018-2032 (USD MILLION)
TABLE 92 ASIA-PACIFIC INTRAOCULAR PRESSURE IN OPHTHALMOLOGY MARKET, BY COMPREHENSIVE EYE EXAMINATION, 2018-2032 (USD MILLION)
TABLE 93 ASIA-PACIFIC ANTERIOR SEGMENT AND PUPILLARY EXAMINATION IN OPHTHALMOLOGY MARKET, BY COMPREHENSIVE EYE EXAMINATION, 2018-2032 (USD MILLION)
TABLE 94 ASIA-PACIFIC VISUAL FIELDS TEST IN OPHTHALMOLOGY MARKET, BY COMPREHENSIVE EYE EXAMINATION, 2018-2032 (USD MILLION)
TABLE 95 ASIA-PACIFIC OPHTHALMOLOGY MARKET, BY END USER, 2018-2032 (USD MILLION)
TABLE 96 ASIA-PACIFIC OPHTHALMOLOGY MARKET, BY DISTRIBUTION CHANNEL, 2018-2032 (USD MILLION)
TABLE 97 ASIA-PACIFIC RETAIL SALES IN OPHTHALMOLOGY MARKET, BY DISTRIBUTION CHANNEL, 2018-2032 (USD MILLION)
TABLE 98 CHINA OPHTHALMOLOGY MARKET, BY PRODUCTS, 2018-2032 (USD MILLION)
TABLE 99 CHINA DEVICE IN OPHTHALMOLOGY MARKET, BY PRODUCTS, 2018-2032 (USD MILLION)
TABLE 100 CHINA SURGICAL DEVICE IN OPHTHALMOLOGY MARKET, BY PRODUCT, 2018-2032 (USD MILLION)
TABLE 101 CHINA OPHTHALMIC VISCOELASTIC DEVICES IN OPHTHALMOLOGY MARKET, BY PRODUCTS, 2018-2032 (USD MILLION)
TABLE 102 CHINA VITREORETINAL SURGICAL DEVICES IN OPHTHALMOLOGY MARKET, BY PRODUCTS, 2018-2032 (USD MILLION)
TABLE 103 CHINA REFRACTIVE SURGICAL DEVICES IN OPHTHALMOLOGY MARKET, BY PRODUCTS, 2018-2032 (USD MILLION)
TABLE 104 CHINA GLAUCOMA SURGICAL DEVICES IN OPHTHALMOLOGY MARKET, BY PRODUCTS, 2018-2032 (USD MILLION)
TABLE 105 CHINA DIAGNOSTIC DEVICE IN OPHTHALMOLOGY MARKET, BY PRODUCTS, 2018-2032 (USD MILLION)
TABLE 106 CHINA OPHTHALMIC ULTRASOUND IMAGING SYSTEMS IN OPHTHALMOLOGY MARKET, BY PRODUCTS, 2018-2032 (USD MILLION)
TABLE 107 CHINA OPHTHALMIC SURGICAL ACCESSORIES IN OPHTHALMOLOGY MARKET, BY PRODUCTS, 2018-2032 (USD MILLION)
TABLE 108 CHINA DRUGS IN OPHTHALMOLOGY MARKET, BY PRODUCTS, 2018-2032 (USD MILLION)
TABLE 109 CHINA ANTI-VEGF DRUGS IN OPHTHALMOLOGY MARKET, BY PRODUCTS, 2018-2032 (USD MILLION)
TABLE 110 CHINA ANTI-GLAUCOMA DRUGS IN OPHTHALMOLOGY MARKET, BY PRODUCTS, 2018-2032 (USD MILLION)
TABLE 111 CHINA PROSTAGLANDIN ANALOGS IN OPHTHALMOLOGY MARKET, BY PRODUCTS, 2018-2032 (USD MILLION)
TABLE 112 CHINA BETA ADRENERGIC ANTAGONISTS IN OPHTHALMOLOGY MARKET, BY PRODUCTS, 2018-2032 (USD MILLION)
TABLE 113 CHINA ALPHA ADRENERGIC AGONISTS IN OPHTHALMOLOGY MARKET, BY PRODUCTS, 2018-2032 (USD MILLION)
TABLE 114 CHINA MIOTICS IN OPHTHALMOLOGY MARKET, BY PRODUCTS, 2018-2032 (USD MILLION)
TABLE 115 CHINA ANTI-INFLAMMATORY DRUGS IN OPHTHALMOLOGY MARKET, BY PRODUCTS, 2018-2032 (USD MILLION)
TABLE 116 CHINA OTHERS IN OPHTHALMOLOGY MARKET, BY PRODUCTS, 2018-2032 (USD MILLION)
TABLE 117 CHINA VISION CARE PRODUCTS IN OPHTHALMOLOGY MARKET, BY PRODUCTS, 2018-2032 (USD MILLION)
TABLE 118 CHINA CONTACT LENSES IN OPHTHALMOLOGY MARKET, BY PRODUCTS, 2018-2032 (USD MILLION)
TABLE 119 CHINA OPHTHALMOLOGY MARKET, BY DISEASES, 2018-2032 (USD MILLION)
TABLE 120 CHINA DRUGS IN OPHTHALMOLOGY MARKET, BY DRUG TYPE, 2018-2032 (USD MILLION)
TABLE 121 CHINA DRUGS IN OPHTHALMOLOGY MARKET, BY PRESCRIPTION MODE, 2018-2032 (USD MILLION)
TABLE 122 CHINA DRUGS IN OPHTHALMOLOGY MARKET, BY ROUTE OF ADMINISTRATION, 2018-2032 (USD MILLION)
TABLE 123 CHINA TOPICAL IN OPHTHALMOLOGY MARKET, BY ROUTE OF ADMINISTRATION, 2018-2032 (USD MILLION)
TABLE 124 CHINA LOCAL OCULAR IN OPHTHALMOLOGY MARKET, BY ROUTE OF ADMINISTRATION, 2018-2032 (USD MILLION)
TABLE 125 CHINA INJECTABLES IN OPHTHALMOLOGY MARKET, BY ROUTE OF ADMINISTRATION, 2018-2032 (USD MILLION)
TABLE 126 CHINA ORAL IN OPHTHALMOLOGY MARKET, BY ROUTE OF ADMINISTRATION, 2018-2032 (USD MILLION)
TABLE 127 CHINA OPHTHALMOLOGY MARKET, BY COMPREHENSIVE EYE EXAMINATION, 2018-2032 (USD MILLION)
TABLE 128 CHINA REFRACTION IN OPHTHALMOLOGY MARKET, BY COMPREHENSIVE EYE EXAMINATION, 2018-2032 (USD MILLION)
TABLE 129 CHINA VISUAL ACUITY TEST IN OPHTHALMOLOGY MARKET, BY COMPREHENSIVE EYE EXAMINATION, 2018-2032 (USD MILLION)
TABLE 130 CHINA INTRAOCULAR PRESSURE IN OPHTHALMOLOGY MARKET, BY COMPREHENSIVE EYE EXAMINATION, 2018-2032 (USD MILLION)
TABLE 131 CHINA ANTERIOR SEGMENT AND PUPILLARY EXAMINATION IN OPHTHALMOLOGY MARKET, BY COMPREHENSIVE EYE EXAMINATION, 2018-2032 (USD MILLION)
TABLE 132 CHINA VISUAL FIELDS TEST IN OPHTHALMOLOGY MARKET, BY COMPREHENSIVE EYE EXAMINATION, 2018-2032 (USD MILLION)
TABLE 133 CHINA OPHTHALMOLOGY MARKET, BY END USER, 2018-2032 (USD MILLION)
TABLE 134 CHINA OPHTHALMOLOGY MARKET, BY DISTRIBUTION CHANNEL, 2018-2032 (USD MILLION)
TABLE 135 CHINA RETAIL SALES IN OPHTHALMOLOGY MARKET, BY DISTRIBUTION CHANNEL, 2018-2032 (USD MILLION)
TABLE 136 INDIA OPHTHALMOLOGY MARKET, BY PRODUCTS, 2018-2032 (USD MILLION)
TABLE 137 INDIA DEVICE IN OPHTHALMOLOGY MARKET, BY PRODUCTS, 2018-2032 (USD MILLION)
TABLE 138 INDIA SURGICAL DEVICE IN OPHTHALMOLOGY MARKET, BY PRODUCT, 2018-2032 (USD MILLION)
TABLE 139 INDIA OPHTHALMIC VISCOELASTIC DEVICES IN OPHTHALMOLOGY MARKET, BY PRODUCTS, 2018-2032 (USD MILLION)
TABLE 140 INDIA VITREORETINAL SURGICAL DEVICES IN OPHTHALMOLOGY MARKET, BY PRODUCTS, 2018-2032 (USD MILLION)
TABLE 141 INDIA REFRACTIVE SURGICAL DEVICES IN OPHTHALMOLOGY MARKET, BY PRODUCTS, 2018-2032 (USD MILLION)
TABLE 142 INDIA GLAUCOMA SURGICAL DEVICES IN OPHTHALMOLOGY MARKET, BY PRODUCTS, 2018-2032 (USD MILLION)
TABLE 143 INDIA DIAGNOSTIC DEVICE IN OPHTHALMOLOGY MARKET, BY PRODUCTS, 2018-2032 (USD MILLION)
TABLE 144 INDIA OPHTHALMIC ULTRASOUND IMAGING SYSTEMS IN OPHTHALMOLOGY MARKET, BY PRODUCTS, 2018-2032 (USD MILLION)
TABLE 145 INDIA OPHTHALMIC SURGICAL ACCESSORIES IN OPHTHALMOLOGY MARKET, BY PRODUCTS, 2018-2032 (USD MILLION)
TABLE 146 INDIA DRUGS IN OPHTHALMOLOGY MARKET, BY PRODUCTS, 2018-2032 (USD MILLION)
TABLE 147 INDIA ANTI-VEGF DRUGS IN OPHTHALMOLOGY MARKET, BY PRODUCTS, 2018-2032 (USD MILLION)
TABLE 148 INDIA ANTI-GLAUCOMA DRUGS IN OPHTHALMOLOGY MARKET, BY PRODUCTS, 2018-2032 (USD MILLION)
TABLE 149 INDIA PROSTAGLANDIN ANALOGS IN OPHTHALMOLOGY MARKET, BY PRODUCTS, 2018-2032 (USD MILLION)
TABLE 150 INDIA BETA ADRENERGIC ANTAGONISTS IN OPHTHALMOLOGY MARKET, BY PRODUCTS, 2018-2032 (USD MILLION)
TABLE 151 INDIA ALPHA ADRENERGIC AGONISTS IN OPHTHALMOLOGY MARKET, BY PRODUCTS, 2018-2032 (USD MILLION)
TABLE 152 INDIA MIOTICS IN OPHTHALMOLOGY MARKET, BY PRODUCTS, 2018-2032 (USD MILLION)
TABLE 153 INDIA ANTI-INFLAMMATORY DRUGS IN OPHTHALMOLOGY MARKET, BY PRODUCTS, 2018-2032 (USD MILLION)
TABLE 154 INDIA OTHERS IN OPHTHALMOLOGY MARKET, BY PRODUCTS, 2018-2032 (USD MILLION)
TABLE 155 INDIA VISION CARE PRODUCTS IN OPHTHALMOLOGY MARKET, BY PRODUCTS, 2018-2032 (USD MILLION)
TABLE 156 INDIA CONTACT LENSES IN OPHTHALMOLOGY MARKET, BY PRODUCTS, 2018-2032 (USD MILLION)
TABLE 157 INDIA OPHTHALMOLOGY MARKET, BY DISEASES, 2018-2032 (USD MILLION)
TABLE 158 INDIA DRUGS IN OPHTHALMOLOGY MARKET, BY DRUG TYPE, 2018-2032 (USD MILLION)
TABLE 159 INDIA DRUGS IN OPHTHALMOLOGY MARKET, BY PRESCRIPTION MODE, 2018-2032 (USD MILLION)
TABLE 160 INDIA DRUGS IN OPHTHALMOLOGY MARKET, BY ROUTE OF ADMINISTRATION, 2018-2032 (USD MILLION)
TABLE 161 INDIA TOPICAL IN OPHTHALMOLOGY MARKET, BY ROUTE OF ADMINISTRATION, 2018-2032 (USD MILLION)
TABLE 162 INDIA LOCAL OCULAR IN OPHTHALMOLOGY MARKET, BY ROUTE OF ADMINISTRATION, 2018-2032 (USD MILLION)
TABLE 163 INDIA INJECTABLES IN OPHTHALMOLOGY MARKET, BY ROUTE OF ADMINISTRATION, 2018-2032 (USD MILLION)
TABLE 164 INDIA ORAL IN OPHTHALMOLOGY MARKET, BY ROUTE OF ADMINISTRATION, 2018-2032 (USD MILLION)
TABLE 165 INDIA OPHTHALMOLOGY MARKET, BY COMPREHENSIVE EYE EXAMINATION, 2018-2032 (USD MILLION)
TABLE 166 INDIA REFRACTION IN OPHTHALMOLOGY MARKET, BY COMPREHENSIVE EYE EXAMINATION, 2018-2032 (USD MILLION)
TABLE 167 INDIA VISUAL ACUITY TEST IN OPHTHALMOLOGY MARKET, BY COMPREHENSIVE EYE EXAMINATION, 2018-2032 (USD MILLION)
TABLE 168 INDIA INTRAOCULAR PRESSURE IN OPHTHALMOLOGY MARKET, BY COMPREHENSIVE EYE EXAMINATION, 2018-2032 (USD MILLION)
TABLE 169 INDIA ANTERIOR SEGMENT AND PUPILLARY EXAMINATION IN OPHTHALMOLOGY MARKET, BY COMPREHENSIVE EYE EXAMINATION, 2018-2032 (USD MILLION)
TABLE 170 INDIA VISUAL FIELDS TEST IN OPHTHALMOLOGY MARKET, BY COMPREHENSIVE EYE EXAMINATION, 2018-2032 (USD MILLION)
TABLE 171 INDIA OPHTHALMOLOGY MARKET, BY END USER, 2018-2032 (USD MILLION)
TABLE 172 INDIA OPHTHALMOLOGY MARKET, BY DISTRIBUTION CHANNEL, 2018-2032 (USD MILLION)
TABLE 173 INDIA RETAIL SALES IN OPHTHALMOLOGY MARKET, BY DISTRIBUTION CHANNEL, 2018-2032 (USD MILLION)
TABLE 174 JAPAN OPHTHALMOLOGY MARKET, BY PRODUCTS, 2018-2032 (USD MILLION)
TABLE 175 JAPAN DEVICE IN OPHTHALMOLOGY MARKET, BY PRODUCTS, 2018-2032 (USD MILLION)
TABLE 176 JAPAN SURGICAL DEVICE IN OPHTHALMOLOGY MARKET, BY PRODUCT, 2018-2032 (USD MILLION)
TABLE 177 JAPAN OPHTHALMIC VISCOELASTIC DEVICES IN OPHTHALMOLOGY MARKET, BY PRODUCTS, 2018-2032 (USD MILLION)
TABLE 178 JAPAN VITREORETINAL SURGICAL DEVICES IN OPHTHALMOLOGY MARKET, BY PRODUCTS, 2018-2032 (USD MILLION)
TABLE 179 JAPAN REFRACTIVE SURGICAL DEVICES IN OPHTHALMOLOGY MARKET, BY PRODUCTS, 2018-2032 (USD MILLION)
TABLE 180 JAPAN GLAUCOMA SURGICAL DEVICES IN OPHTHALMOLOGY MARKET, BY PRODUCTS, 2018-2032 (USD MILLION)
TABLE 181 JAPAN DIAGNOSTIC DEVICE IN OPHTHALMOLOGY MARKET, BY PRODUCTS, 2018-2032 (USD MILLION)
TABLE 182 JAPAN OPHTHALMIC ULTRASOUND IMAGING SYSTEMS IN OPHTHALMOLOGY MARKET, BY PRODUCTS, 2018-2032 (USD MILLION)
TABLE 183 JAPAN OPHTHALMIC SURGICAL ACCESSORIES IN OPHTHALMOLOGY MARKET, BY PRODUCTS, 2018-2032 (USD MILLION)
TABLE 184 JAPAN DRUGS IN OPHTHALMOLOGY MARKET, BY PRODUCTS, 2018-2032 (USD MILLION)
TABLE 185 JAPAN ANTI-VEGF DRUGS IN OPHTHALMOLOGY MARKET, BY PRODUCTS, 2018-2032 (USD MILLION)
TABLE 186 JAPAN ANTI-GLAUCOMA DRUGS IN OPHTHALMOLOGY MARKET, BY PRODUCTS, 2018-2032 (USD MILLION)
TABLE 187 JAPAN PROSTAGLANDIN ANALOGS IN OPHTHALMOLOGY MARKET, BY PRODUCTS, 2018-2032 (USD MILLION)
TABLE 188 JAPAN BETA ADRENERGIC ANTAGONISTS IN OPHTHALMOLOGY MARKET, BY PRODUCTS, 2018-2032 (USD MILLION)
TABLE 189 JAPAN ALPHA ADRENERGIC AGONISTS IN OPHTHALMOLOGY MARKET, BY PRODUCTS, 2018-2032 (USD MILLION)
TABLE 190 JAPAN MIOTICS IN OPHTHALMOLOGY MARKET, BY PRODUCTS, 2018-2032 (USD MILLION)
TABLE 191 JAPAN ANTI-INFLAMMATORY DRUGS IN OPHTHALMOLOGY MARKET, BY PRODUCTS, 2018-2032 (USD MILLION)
TABLE 192 JAPAN OTHERS IN OPHTHALMOLOGY MARKET, BY PRODUCTS, 2018-2032 (USD MILLION)
TABLE 193 JAPAN VISION CARE PRODUCTS IN OPHTHALMOLOGY MARKET, BY PRODUCTS, 2018-2032 (USD MILLION)
TABLE 194 JAPAN CONTACT LENSES IN OPHTHALMOLOGY MARKET, BY PRODUCTS, 2018-2032 (USD MILLION)
TABLE 195 JAPAN OPHTHALMOLOGY MARKET, BY DISEASES, 2018-2032 (USD MILLION)
TABLE 196 JAPAN DRUGS IN OPHTHALMOLOGY MARKET, BY DRUG TYPE, 2018-2032 (USD MILLION)
TABLE 197 JAPAN DRUGS IN OPHTHALMOLOGY MARKET, BY PRESCRIPTION MODE, 2018-2032 (USD MILLION)
TABLE 198 JAPAN DRUGS IN OPHTHALMOLOGY MARKET, BY ROUTE OF ADMINISTRATION, 2018-2032 (USD MILLION)
TABLE 199 JAPAN TOPICAL IN OPHTHALMOLOGY MARKET, BY ROUTE OF ADMINISTRATION, 2018-2032 (USD MILLION)
TABLE 200 JAPAN LOCAL OCULAR IN OPHTHALMOLOGY MARKET, BY ROUTE OF ADMINISTRATION, 2018-2032 (USD MILLION)
TABLE 201 JAPAN INJECTABLES IN OPHTHALMOLOGY MARKET, BY ROUTE OF ADMINISTRATION, 2018-2032 (USD MILLION)
TABLE 202 JAPAN ORAL IN OPHTHALMOLOGY MARKET, BY ROUTE OF ADMINISTRATION, 2018-2032 (USD MILLION)
TABLE 203 JAPAN OPHTHALMOLOGY MARKET, BY COMPREHENSIVE EYE EXAMINATION, 2018-2032 (USD MILLION)
TABLE 204 JAPAN REFRACTION IN OPHTHALMOLOGY MARKET, BY COMPREHENSIVE EYE EXAMINATION, 2018-2032 (USD MILLION)
TABLE 205 JAPAN VISUAL ACUITY TEST IN OPHTHALMOLOGY MARKET, BY COMPREHENSIVE EYE EXAMINATION, 2018-2032 (USD MILLION)
TABLE 206 JAPAN INTRAOCULAR PRESSURE IN OPHTHALMOLOGY MARKET, BY COMPREHENSIVE EYE EXAMINATION, 2018-2032 (USD MILLION)
TABLE 207 JAPAN ANTERIOR SEGMENT AND PUPILLARY EXAMINATION IN OPHTHALMOLOGY MARKET, BY COMPREHENSIVE EYE EXAMINATION, 2018-2032 (USD MILLION)
TABLE 208 JAPAN VISUAL FIELDS TEST IN OPHTHALMOLOGY MARKET, BY COMPREHENSIVE EYE EXAMINATION, 2018-2032 (USD MILLION)
TABLE 209 JAPAN OPHTHALMOLOGY MARKET, BY END USER, 2018-2032 (USD MILLION)
TABLE 210 JAPAN OPHTHALMOLOGY MARKET, BY DISTRIBUTION CHANNEL, 2018-2032 (USD MILLION)
TABLE 211 JAPAN RETAIL SALES IN OPHTHALMOLOGY MARKET, BY DISTRIBUTION CHANNEL, 2018-2032 (USD MILLION)
TABLE 212 SOUTH KOREA OPHTHALMOLOGY MARKET, BY PRODUCTS, 2018-2032 (USD MILLION)
TABLE 213 SOUTH KOREA DEVICE IN OPHTHALMOLOGY MARKET, BY PRODUCTS, 2018-2032 (USD MILLION)
TABLE 214 SOUTH KOREA SURGICAL DEVICE IN OPHTHALMOLOGY MARKET, BY PRODUCT, 2018-2032 (USD MILLION)
TABLE 215 SOUTH KOREA OPHTHALMIC VISCOELASTIC DEVICES IN OPHTHALMOLOGY MARKET, BY PRODUCTS, 2018-2032 (USD MILLION)
TABLE 216 SOUTH KOREA VITREORETINAL SURGICAL DEVICES IN OPHTHALMOLOGY MARKET, BY PRODUCTS, 2018-2032 (USD MILLION)
TABLE 217 SOUTH KOREA REFRACTIVE SURGICAL DEVICES IN OPHTHALMOLOGY MARKET, BY PRODUCTS, 2018-2032 (USD MILLION)
TABLE 218 SOUTH KOREA GLAUCOMA SURGICAL DEVICES IN OPHTHALMOLOGY MARKET, BY PRODUCTS, 2018-2032 (USD MILLION)
TABLE 219 SOUTH KOREA DIAGNOSTIC DEVICE IN OPHTHALMOLOGY MARKET, BY PRODUCTS, 2018-2032 (USD MILLION)
TABLE 220 SOUTH KOREA OPHTHALMIC ULTRASOUND IMAGING SYSTEMS IN OPHTHALMOLOGY MARKET, BY PRODUCTS, 2018-2032 (USD MILLION)
TABLE 221 SOUTH KOREA OPHTHALMIC SURGICAL ACCESSORIES IN OPHTHALMOLOGY MARKET, BY PRODUCTS, 2018-2032 (USD MILLION)
TABLE 222 SOUTH KOREA DRUGS IN OPHTHALMOLOGY MARKET, BY PRODUCTS, 2018-2032 (USD MILLION)
TABLE 223 SOUTH KOREA ANTI-VEGF DRUGS IN OPHTHALMOLOGY MARKET, BY PRODUCTS, 2018-2032 (USD MILLION)
TABLE 224 SOUTH KOREA ANTI-GLAUCOMA DRUGS IN OPHTHALMOLOGY MARKET, BY PRODUCTS, 2018-2032 (USD MILLION)
TABLE 225 SOUTH KOREA PROSTAGLANDIN ANALOGS IN OPHTHALMOLOGY MARKET, BY PRODUCTS, 2018-2032 (USD MILLION)
TABLE 226 SOUTH KOREA BETA ADRENERGIC ANTAGONISTS IN OPHTHALMOLOGY MARKET, BY PRODUCTS, 2018-2032 (USD MILLION)
TABLE 227 SOUTH KOREA ALPHA ADRENERGIC AGONISTS IN OPHTHALMOLOGY MARKET, BY PRODUCTS, 2018-2032 (USD MILLION)
TABLE 228 SOUTH KOREA MIOTICS IN OPHTHALMOLOGY MARKET, BY PRODUCTS, 2018-2032 (USD MILLION)
TABLE 229 SOUTH KOREA ANTI-INFLAMMATORY DRUGS IN OPHTHALMOLOGY MARKET, BY PRODUCTS, 2018-2032 (USD MILLION)
TABLE 230 SOUTH KOREA OTHERS IN OPHTHALMOLOGY MARKET, BY PRODUCTS, 2018-2032 (USD MILLION)
TABLE 231 SOUTH KOREA VISION CARE PRODUCTS IN OPHTHALMOLOGY MARKET, BY PRODUCTS, 2018-2032 (USD MILLION)
TABLE 232 SOUTH KOREA CONTACT LENSES IN OPHTHALMOLOGY MARKET, BY PRODUCTS, 2018-2032 (USD MILLION)
TABLE 233 SOUTH KOREA OPHTHALMOLOGY MARKET, BY DISEASES, 2018-2032 (USD MILLION)
TABLE 234 SOUTH KOREA DRUGS IN OPHTHALMOLOGY MARKET, BY DRUG TYPE, 2018-2032 (USD MILLION)
TABLE 235 SOUTH KOREA DRUGS IN OPHTHALMOLOGY MARKET, BY PRESCRIPTION MODE, 2018-2032 (USD MILLION)
TABLE 236 SOUTH KOREA DRUGS IN OPHTHALMOLOGY MARKET, BY ROUTE OF ADMINISTRATION, 2018-2032 (USD MILLION)
TABLE 237 SOUTH KOREA TOPICAL IN OPHTHALMOLOGY MARKET, BY ROUTE OF ADMINISTRATION, 2018-2032 (USD MILLION)
TABLE 238 SOUTH KOREA LOCAL OCULAR IN OPHTHALMOLOGY MARKET, BY ROUTE OF ADMINISTRATION, 2018-2032 (USD MILLION)
TABLE 239 SOUTH KOREA INJECTABLES IN OPHTHALMOLOGY MARKET, BY ROUTE OF ADMINISTRATION, 2018-2032 (USD MILLION)
TABLE 240 SOUTH KOREA ORAL IN OPHTHALMOLOGY MARKET, BY ROUTE OF ADMINISTRATION, 2018-2032 (USD MILLION)
TABLE 241 SOUTH KOREA OPHTHALMOLOGY MARKET, BY COMPREHENSIVE EYE EXAMINATION, 2018-2032 (USD MILLION)
TABLE 242 SOUTH KOREA REFRACTION IN OPHTHALMOLOGY MARKET, BY COMPREHENSIVE EYE EXAMINATION, 2018-2032 (USD MILLION)
TABLE 243 SOUTH KOREA VISUAL ACUITY TEST IN OPHTHALMOLOGY MARKET, BY COMPREHENSIVE EYE EXAMINATION, 2018-2032 (USD MILLION)
TABLE 244 SOUTH KOREA INTRAOCULAR PRESSURE IN OPHTHALMOLOGY MARKET, BY COMPREHENSIVE EYE EXAMINATION, 2018-2032 (USD MILLION)
TABLE 245 SOUTH KOREA ANTERIOR SEGMENT AND PUPILLARY EXAMINATION IN OPHTHALMOLOGY MARKET, BY COMPREHENSIVE EYE EXAMINATION, 2018-2032 (USD MILLION)
TABLE 246 SOUTH KOREA VISUAL FIELDS TEST IN OPHTHALMOLOGY MARKET, BY COMPREHENSIVE EYE EXAMINATION, 2018-2032 (USD MILLION)
TABLE 247 SOUTH KOREA OPHTHALMOLOGY MARKET, BY END USER, 2018-2032 (USD MILLION)
TABLE 248 SOUTH KOREA OPHTHALMOLOGY MARKET, BY DISTRIBUTION CHANNEL, 2018-2032 (USD MILLION)
TABLE 249 SOUTH KOREA RETAIL SALES IN OPHTHALMOLOGY MARKET, BY DISTRIBUTION CHANNEL, 2018-2032 (USD MILLION)
TABLE 250 AUSTRALIA OPHTHALMOLOGY MARKET, BY PRODUCTS, 2018-2032 (USD MILLION)
TABLE 251 AUSTRALIA DEVICE IN OPHTHALMOLOGY MARKET, BY PRODUCTS, 2018-2032 (USD MILLION)
TABLE 252 AUSTRALIA SURGICAL DEVICE IN OPHTHALMOLOGY MARKET, BY PRODUCT, 2018-2032 (USD MILLION)
TABLE 253 AUSTRALIA OPHTHALMIC VISCOELASTIC DEVICES IN OPHTHALMOLOGY MARKET, BY PRODUCTS, 2018-2032 (USD MILLION)
TABLE 254 AUSTRALIA VITREORETINAL SURGICAL DEVICES IN OPHTHALMOLOGY MARKET, BY PRODUCTS, 2018-2032 (USD MILLION)
TABLE 255 AUSTRALIA REFRACTIVE SURGICAL DEVICES IN OPHTHALMOLOGY MARKET, BY PRODUCTS, 2018-2032 (USD MILLION)
TABLE 256 AUSTRALIA GLAUCOMA SURGICAL DEVICES IN OPHTHALMOLOGY MARKET, BY PRODUCTS, 2018-2032 (USD MILLION)
TABLE 257 AUSTRALIA DIAGNOSTIC DEVICE IN OPHTHALMOLOGY MARKET, BY PRODUCTS, 2018-2032 (USD MILLION)
TABLE 258 AUSTRALIA OPHTHALMIC ULTRASOUND IMAGING SYSTEMS IN OPHTHALMOLOGY MARKET, BY PRODUCTS, 2018-2032 (USD MILLION)
TABLE 259 AUSTRALIA OPHTHALMIC SURGICAL ACCESSORIES IN OPHTHALMOLOGY MARKET, BY PRODUCTS, 2018-2032 (USD MILLION)
TABLE 260 AUSTRALIA DRUGS IN OPHTHALMOLOGY MARKET, BY PRODUCTS, 2018-2032 (USD MILLION)
TABLE 261 AUSTRALIA ANTI-VEGF DRUGS IN OPHTHALMOLOGY MARKET, BY PRODUCTS, 2018-2032 (USD MILLION)
TABLE 262 AUSTRALIA ANTI-GLAUCOMA DRUGS IN OPHTHALMOLOGY MARKET, BY PRODUCTS, 2018-2032 (USD MILLION)
TABLE 263 AUSTRALIA PROSTAGLANDIN ANALOGS IN OPHTHALMOLOGY MARKET, BY PRODUCTS, 2018-2032 (USD MILLION)
TABLE 264 AUSTRALIA BETA ADRENERGIC ANTAGONISTS IN OPHTHALMOLOGY MARKET, BY PRODUCTS, 2018-2032 (USD MILLION)
TABLE 265 AUSTRALIA ALPHA ADRENERGIC AGONISTS IN OPHTHALMOLOGY MARKET, BY PRODUCTS, 2018-2032 (USD MILLION)
TABLE 266 AUSTRALIA MIOTICS IN OPHTHALMOLOGY MARKET, BY PRODUCTS, 2018-2032 (USD MILLION)
TABLE 267 AUSTRALIA ANTI-INFLAMMATORY DRUGS IN OPHTHALMOLOGY MARKET, BY PRODUCTS, 2018-2032 (USD MILLION)
TABLE 268 AUSTRALIA OTHERS IN OPHTHALMOLOGY MARKET, BY PRODUCTS, 2018-2032 (USD MILLION)
TABLE 269 AUSTRALIA VISION CARE PRODUCTS IN OPHTHALMOLOGY MARKET, BY PRODUCTS, 2018-2032 (USD MILLION)
TABLE 270 AUSTRALIA CONTACT LENSES IN OPHTHALMOLOGY MARKET, BY PRODUCTS, 2018-2032 (USD MILLION)
TABLE 271 AUSTRALIA OPHTHALMOLOGY MARKET, BY DISEASES, 2018-2032 (USD MILLION)
TABLE 272 AUSTRALIA DRUGS IN OPHTHALMOLOGY MARKET, BY DRUG TYPE, 2018-2032 (USD MILLION)
TABLE 273 AUSTRALIA DRUGS IN OPHTHALMOLOGY MARKET, BY PRESCRIPTION MODE, 2018-2032 (USD MILLION)
TABLE 274 AUSTRALIA DRUGS IN OPHTHALMOLOGY MARKET, BY ROUTE OF ADMINISTRATION, 2018-2032 (USD MILLION)
TABLE 275 AUSTRALIA TOPICAL IN OPHTHALMOLOGY MARKET, BY ROUTE OF ADMINISTRATION, 2018-2032 (USD MILLION)
TABLE 276 AUSTRALIA LOCAL OCULAR IN OPHTHALMOLOGY MARKET, BY ROUTE OF ADMINISTRATION, 2018-2032 (USD MILLION)
TABLE 277 AUSTRALIA INJECTABLES IN OPHTHALMOLOGY MARKET, BY ROUTE OF ADMINISTRATION, 2018-2032 (USD MILLION)
TABLE 278 AUSTRALIA ORAL IN OPHTHALMOLOGY MARKET, BY ROUTE OF ADMINISTRATION, 2018-2032 (USD MILLION)
TABLE 279 AUSTRALIA OPHTHALMOLOGY MARKET, BY COMPREHENSIVE EYE EXAMINATION, 2018-2032 (USD MILLION)
TABLE 280 AUSTRALIA REFRACTION IN OPHTHALMOLOGY MARKET, BY COMPREHENSIVE EYE EXAMINATION, 2018-2032 (USD MILLION)
TABLE 281 AUSTRALIA VISUAL ACUITY TEST IN OPHTHALMOLOGY MARKET, BY COMPREHENSIVE EYE EXAMINATION, 2018-2032 (USD MILLION)
TABLE 282 AUSTRALIA INTRAOCULAR PRESSURE IN OPHTHALMOLOGY MARKET, BY COMPREHENSIVE EYE EXAMINATION, 2018-2032 (USD MILLION)
TABLE 283 AUSTRALIA ANTERIOR SEGMENT AND PUPILLARY EXAMINATION IN OPHTHALMOLOGY MARKET, BY COMPREHENSIVE EYE EXAMINATION, 2018-2032 (USD MILLION)
TABLE 284 AUSTRALIA VISUAL FIELDS TEST IN OPHTHALMOLOGY MARKET, BY COMPREHENSIVE EYE EXAMINATION, 2018-2032 (USD MILLION)
TABLE 285 AUSTRALIA OPHTHALMOLOGY MARKET, BY END USER, 2018-2032 (USD MILLION)
TABLE 286 AUSTRALIA OPHTHALMOLOGY MARKET, BY DISTRIBUTION CHANNEL, 2018-2032 (USD MILLION)
TABLE 287 AUSTRALIA RETAIL SALES IN OPHTHALMOLOGY MARKET, BY DISTRIBUTION CHANNEL, 2018-2032 (USD MILLION)
TABLE 288 INDONESIA OPHTHALMOLOGY MARKET, BY PRODUCTS, 2018-2032 (USD MILLION)
TABLE 289 INDONESIA DEVICE IN OPHTHALMOLOGY MARKET, BY PRODUCTS, 2018-2032 (USD MILLION)
TABLE 290 INDONESIA SURGICAL DEVICE IN OPHTHALMOLOGY MARKET, BY PRODUCT, 2018-2032 (USD MILLION)
TABLE 291 INDONESIA OPHTHALMIC VISCOELASTIC DEVICES IN OPHTHALMOLOGY MARKET, BY PRODUCTS, 2018-2032 (USD MILLION)
TABLE 292 INDONESIA VITREORETINAL SURGICAL DEVICES IN OPHTHALMOLOGY MARKET, BY PRODUCTS, 2018-2032 (USD MILLION)
TABLE 293 INDONESIA REFRACTIVE SURGICAL DEVICES IN OPHTHALMOLOGY MARKET, BY PRODUCTS, 2018-2032 (USD MILLION)
TABLE 294 INDONESIA GLAUCOMA SURGICAL DEVICES IN OPHTHALMOLOGY MARKET, BY PRODUCTS, 2018-2032 (USD MILLION)
TABLE 295 INDONESIA DIAGNOSTIC DEVICE IN OPHTHALMOLOGY MARKET, BY PRODUCTS, 2018-2032 (USD MILLION)
TABLE 296 INDONESIA OPHTHALMIC ULTRASOUND IMAGING SYSTEMS IN OPHTHALMOLOGY MARKET, BY PRODUCTS, 2018-2032 (USD MILLION)
TABLE 297 INDONESIA OPHTHALMIC SURGICAL ACCESSORIES IN OPHTHALMOLOGY MARKET, BY PRODUCTS, 2018-2032 (USD MILLION)
TABLE 298 INDONESIA DRUGS IN OPHTHALMOLOGY MARKET, BY PRODUCTS, 2018-2032 (USD MILLION)
TABLE 299 INDONESIA ANTI-VEGF DRUGS IN OPHTHALMOLOGY MARKET, BY PRODUCTS, 2018-2032 (USD MILLION)
TABLE 300 INDONESIA ANTI-GLAUCOMA DRUGS IN OPHTHALMOLOGY MARKET, BY PRODUCTS, 2018-2032 (USD MILLION)
TABLE 301 INDONESIA PROSTAGLANDIN ANALOGS IN OPHTHALMOLOGY MARKET, BY PRODUCTS, 2018-2032 (USD MILLION)
TABLE 302 INDONESIA BETA ADRENERGIC ANTAGONISTS IN OPHTHALMOLOGY MARKET, BY PRODUCTS, 2018-2032 (USD MILLION)
TABLE 303 INDONESIA ALPHA ADRENERGIC AGONISTS IN OPHTHALMOLOGY MARKET, BY PRODUCTS, 2018-2032 (USD MILLION)
TABLE 304 INDONESIA MIOTICS IN OPHTHALMOLOGY MARKET, BY PRODUCTS, 2018-2032 (USD MILLION)
TABLE 305 INDONESIA ANTI-INFLAMMATORY DRUGS IN OPHTHALMOLOGY MARKET, BY PRODUCTS, 2018-2032 (USD MILLION)
TABLE 306 INDONESIA OTHERS IN OPHTHALMOLOGY MARKET, BY PRODUCTS, 2018-2032 (USD MILLION)
TABLE 307 INDONESIA VISION CARE PRODUCTS IN OPHTHALMOLOGY MARKET, BY PRODUCTS, 2018-2032 (USD MILLION)
TABLE 308 INDONESIA CONTACT LENSES IN OPHTHALMOLOGY MARKET, BY PRODUCTS, 2018-2032 (USD MILLION)
TABLE 309 INDONESIA OPHTHALMOLOGY MARKET, BY DISEASES, 2018-2032 (USD MILLION)
TABLE 310 INDONESIA DRUGS IN OPHTHALMOLOGY MARKET, BY DRUG TYPE, 2018-2032 (USD MILLION)
TABLE 311 INDONESIA DRUGS IN OPHTHALMOLOGY MARKET, BY PRESCRIPTION MODE, 2018-2032 (USD MILLION)
TABLE 312 INDONESIA DRUGS IN OPHTHALMOLOGY MARKET, BY ROUTE OF ADMINISTRATION, 2018-2032 (USD MILLION)
TABLE 313 INDONESIA TOPICAL IN OPHTHALMOLOGY MARKET, BY ROUTE OF ADMINISTRATION, 2018-2032 (USD MILLION)
TABLE 314 INDONESIA LOCAL OCULAR IN OPHTHALMOLOGY MARKET, BY ROUTE OF ADMINISTRATION, 2018-2032 (USD MILLION)
TABLE 315 INDONESIA INJECTABLES IN OPHTHALMOLOGY MARKET, BY ROUTE OF ADMINISTRATION, 2018-2032 (USD MILLION)
TABLE 316 INDONESIA ORAL IN OPHTHALMOLOGY MARKET, BY ROUTE OF ADMINISTRATION, 2018-2032 (USD MILLION)
TABLE 317 INDONESIA OPHTHALMOLOGY MARKET, BY COMPREHENSIVE EYE EXAMINATION, 2018-2032 (USD MILLION)
TABLE 318 INDONESIA REFRACTION IN OPHTHALMOLOGY MARKET, BY COMPREHENSIVE EYE EXAMINATION, 2018-2032 (USD MILLION)
TABLE 319 INDONESIA VISUAL ACUITY TEST IN OPHTHALMOLOGY MARKET, BY COMPREHENSIVE EYE EXAMINATION, 2018-2032 (USD MILLION)
TABLE 320 INDONESIA INTRAOCULAR PRESSURE IN OPHTHALMOLOGY MARKET, BY COMPREHENSIVE EYE EXAMINATION, 2018-2032 (USD MILLION)
TABLE 321 INDONESIA ANTERIOR SEGMENT AND PUPILLARY EXAMINATION IN OPHTHALMOLOGY MARKET, BY COMPREHENSIVE EYE EXAMINATION, 2018-2032 (USD MILLION)
TABLE 322 INDONESIA VISUAL FIELDS TEST IN OPHTHALMOLOGY MARKET, BY COMPREHENSIVE EYE EXAMINATION, 2018-2032 (USD MILLION)
TABLE 323 INDONESIA OPHTHALMOLOGY MARKET, BY END USER, 2018-2032 (USD MILLION)
TABLE 324 INDONESIA OPHTHALMOLOGY MARKET, BY DISTRIBUTION CHANNEL, 2018-2032 (USD MILLION)
TABLE 325 INDONESIA RETAIL SALES IN OPHTHALMOLOGY MARKET, BY DISTRIBUTION CHANNEL, 2018-2032 (USD MILLION)
TABLE 326 THAILAND OPHTHALMOLOGY MARKET, BY PRODUCTS, 2018-2032 (USD MILLION)
TABLE 327 THAILAND DEVICE IN OPHTHALMOLOGY MARKET, BY PRODUCTS, 2018-2032 (USD MILLION)
TABLE 328 THAILAND SURGICAL DEVICE IN OPHTHALMOLOGY MARKET, BY PRODUCT, 2018-2032 (USD MILLION)
TABLE 329 THAILAND OPHTHALMIC VISCOELASTIC DEVICES IN OPHTHALMOLOGY MARKET, BY PRODUCTS, 2018-2032 (USD MILLION)
TABLE 330 THAILAND VITREORETINAL SURGICAL DEVICES IN OPHTHALMOLOGY MARKET, BY PRODUCTS, 2018-2032 (USD MILLION)
TABLE 331 THAILAND REFRACTIVE SURGICAL DEVICES IN OPHTHALMOLOGY MARKET, BY PRODUCTS, 2018-2032 (USD MILLION)
TABLE 332 THAILAND GLAUCOMA SURGICAL DEVICES IN OPHTHALMOLOGY MARKET, BY PRODUCTS, 2018-2032 (USD MILLION)
TABLE 333 THAILAND DIAGNOSTIC DEVICE IN OPHTHALMOLOGY MARKET, BY PRODUCTS, 2018-2032 (USD MILLION)
TABLE 334 THAILAND OPHTHALMIC ULTRASOUND IMAGING SYSTEMS IN OPHTHALMOLOGY MARKET, BY PRODUCTS, 2018-2032 (USD MILLION)
TABLE 335 THAILAND OPHTHALMIC SURGICAL ACCESSORIES IN OPHTHALMOLOGY MARKET, BY PRODUCTS, 2018-2032 (USD MILLION)
TABLE 336 THAILAND DRUGS IN OPHTHALMOLOGY MARKET, BY PRODUCTS, 2018-2032 (USD MILLION)
TABLE 337 THAILAND ANTI-VEGF DRUGS IN OPHTHALMOLOGY MARKET, BY PRODUCTS, 2018-2032 (USD MILLION)
TABLE 338 THAILAND ANTI-GLAUCOMA DRUGS IN OPHTHALMOLOGY MARKET, BY PRODUCTS, 2018-2032 (USD MILLION)
TABLE 339 THAILAND PROSTAGLANDIN ANALOGS IN OPHTHALMOLOGY MARKET, BY PRODUCTS, 2018-2032 (USD MILLION)
TABLE 340 THAILAND BETA ADRENERGIC ANTAGONISTS IN OPHTHALMOLOGY MARKET, BY PRODUCTS, 2018-2032 (USD MILLION)
TABLE 341 THAILAND ALPHA ADRENERGIC AGONISTS IN OPHTHALMOLOGY MARKET, BY PRODUCTS, 2018-2032 (USD MILLION)
TABLE 342 THAILAND MIOTICS IN OPHTHALMOLOGY MARKET, BY PRODUCTS, 2018-2032 (USD MILLION)
TABLE 343 THAILAND ANTI-INFLAMMATORY DRUGS IN OPHTHALMOLOGY MARKET, BY PRODUCTS, 2018-2032 (USD MILLION)
TABLE 344 THAILAND OTHERS IN OPHTHALMOLOGY MARKET, BY PRODUCTS, 2018-2032 (USD MILLION)
TABLE 345 THAILAND VISION CARE PRODUCTS IN OPHTHALMOLOGY MARKET, BY PRODUCTS, 2018-2032 (USD MILLION)
TABLE 346 THAILAND CONTACT LENSES IN OPHTHALMOLOGY MARKET, BY PRODUCTS, 2018-2032 (USD MILLION)
TABLE 347 THAILAND OPHTHALMOLOGY MARKET, BY DISEASES, 2018-2032 (USD MILLION)
TABLE 348 THAILAND DRUGS IN OPHTHALMOLOGY MARKET, BY DRUG TYPE, 2018-2032 (USD MILLION)
TABLE 349 THAILAND DRUGS IN OPHTHALMOLOGY MARKET, BY PRESCRIPTION MODE, 2018-2032 (USD MILLION)
TABLE 350 THAILAND DRUGS IN OPHTHALMOLOGY MARKET, BY ROUTE OF ADMINISTRATION, 2018-2032 (USD MILLION)
TABLE 351 THAILAND TOPICAL IN OPHTHALMOLOGY MARKET, BY ROUTE OF ADMINISTRATION, 2018-2032 (USD MILLION)
TABLE 352 THAILAND LOCAL OCULAR IN OPHTHALMOLOGY MARKET, BY ROUTE OF ADMINISTRATION, 2018-2032 (USD MILLION)
TABLE 353 THAILAND INJECTABLES IN OPHTHALMOLOGY MARKET, BY ROUTE OF ADMINISTRATION, 2018-2032 (USD MILLION)
TABLE 354 THAILAND ORAL IN OPHTHALMOLOGY MARKET, BY ROUTE OF ADMINISTRATION, 2018-2032 (USD MILLION)
TABLE 355 THAILAND OPHTHALMOLOGY MARKET, BY COMPREHENSIVE EYE EXAMINATION, 2018-2032 (USD MILLION)
TABLE 356 THAILAND REFRACTION IN OPHTHALMOLOGY MARKET, BY COMPREHENSIVE EYE EXAMINATION, 2018-2032 (USD MILLION)
TABLE 357 THAILAND VISUAL ACUITY TEST IN OPHTHALMOLOGY MARKET, BY COMPREHENSIVE EYE EXAMINATION, 2018-2032 (USD MILLION)
TABLE 358 THAILAND INTRAOCULAR PRESSURE IN OPHTHALMOLOGY MARKET, BY COMPREHENSIVE EYE EXAMINATION, 2018-2032 (USD MILLION)
TABLE 359 THAILAND ANTERIOR SEGMENT AND PUPILLARY EXAMINATION IN OPHTHALMOLOGY MARKET, BY COMPREHENSIVE EYE EXAMINATION, 2018-2032 (USD MILLION)
TABLE 360 THAILAND VISUAL FIELDS TEST IN OPHTHALMOLOGY MARKET, BY COMPREHENSIVE EYE EXAMINATION, 2018-2032 (USD MILLION)
TABLE 361 THAILAND OPHTHALMOLOGY MARKET, BY END USER, 2018-2032 (USD MILLION)
TABLE 362 THAILAND OPHTHALMOLOGY MARKET, BY DISTRIBUTION CHANNEL, 2018-2032 (USD MILLION)
TABLE 363 THAILAND RETAIL SALES IN OPHTHALMOLOGY MARKET, BY DISTRIBUTION CHANNEL, 2018-2032 (USD MILLION)
TABLE 364 MALAYSIA OPHTHALMOLOGY MARKET, BY PRODUCTS, 2018-2032 (USD MILLION)
TABLE 365 MALAYSIA DEVICE IN OPHTHALMOLOGY MARKET, BY PRODUCTS, 2018-2032 (USD MILLION)
TABLE 366 MALAYSIA SURGICAL DEVICE IN OPHTHALMOLOGY MARKET, BY PRODUCT, 2018-2032 (USD MILLION)
TABLE 367 MALAYSIA OPHTHALMIC VISCOELASTIC DEVICES IN OPHTHALMOLOGY MARKET, BY PRODUCTS, 2018-2032 (USD MILLION)
TABLE 368 MALAYSIA VITREORETINAL SURGICAL DEVICES IN OPHTHALMOLOGY MARKET, BY PRODUCTS, 2018-2032 (USD MILLION)
TABLE 369 MALAYSIA REFRACTIVE SURGICAL DEVICES IN OPHTHALMOLOGY MARKET, BY PRODUCTS, 2018-2032 (USD MILLION)
TABLE 370 MALAYSIA GLAUCOMA SURGICAL DEVICES IN OPHTHALMOLOGY MARKET, BY PRODUCTS, 2018-2032 (USD MILLION)
TABLE 371 MALAYSIA DIAGNOSTIC DEVICE IN OPHTHALMOLOGY MARKET, BY PRODUCTS, 2018-2032 (USD MILLION)
TABLE 372 MALAYSIA OPHTHALMIC ULTRASOUND IMAGING SYSTEMS IN OPHTHALMOLOGY MARKET, BY PRODUCTS, 2018-2032 (USD MILLION)
TABLE 373 MALAYSIA OPHTHALMIC SURGICAL ACCESSORIES IN OPHTHALMOLOGY MARKET, BY PRODUCTS, 2018-2032 (USD MILLION)
TABLE 374 MALAYSIA DRUGS IN OPHTHALMOLOGY MARKET, BY PRODUCTS, 2018-2032 (USD MILLION)
TABLE 375 MALAYSIA ANTI-VEGF DRUGS IN OPHTHALMOLOGY MARKET, BY PRODUCTS, 2018-2032 (USD MILLION)
TABLE 376 MALAYSIA ANTI-GLAUCOMA DRUGS IN OPHTHALMOLOGY MARKET, BY PRODUCTS, 2018-2032 (USD MILLION)
TABLE 377 MALAYSIA PROSTAGLANDIN ANALOGS IN OPHTHALMOLOGY MARKET, BY PRODUCTS, 2018-2032 (USD MILLION)
TABLE 378 MALAYSIA BETA ADRENERGIC ANTAGONISTS IN OPHTHALMOLOGY MARKET, BY PRODUCTS, 2018-2032 (USD MILLION)
TABLE 379 MALAYSIA ALPHA ADRENERGIC AGONISTS IN OPHTHALMOLOGY MARKET, BY PRODUCTS, 2018-2032 (USD MILLION)
TABLE 380 MALAYSIA MIOTICS IN OPHTHALMOLOGY MARKET, BY PRODUCTS, 2018-2032 (USD MILLION)
TABLE 381 MALAYSIA ANTI-INFLAMMATORY DRUGS IN OPHTHALMOLOGY MARKET, BY PRODUCTS, 2018-2032 (USD MILLION)
TABLE 382 MALAYSIA OTHERS IN OPHTHALMOLOGY MARKET, BY PRODUCTS, 2018-2032 (USD MILLION)
TABLE 383 MALAYSIA VISION CARE PRODUCTS IN OPHTHALMOLOGY MARKET, BY PRODUCTS, 2018-2032 (USD MILLION)
TABLE 384 MALAYSIA CONTACT LENSES IN OPHTHALMOLOGY MARKET, BY PRODUCTS, 2018-2032 (USD MILLION)
TABLE 385 MALAYSIA OPHTHALMOLOGY MARKET, BY DISEASES, 2018-2032 (USD MILLION)
TABLE 386 MALAYSIA DRUGS IN OPHTHALMOLOGY MARKET, BY DRUG TYPE, 2018-2032 (USD MILLION)
TABLE 387 MALAYSIA DRUGS IN OPHTHALMOLOGY MARKET, BY PRESCRIPTION MODE, 2018-2032 (USD MILLION)
TABLE 388 MALAYSIA DRUGS IN OPHTHALMOLOGY MARKET, BY ROUTE OF ADMINISTRATION, 2018-2032 (USD MILLION)
TABLE 389 MALAYSIA TOPICAL IN OPHTHALMOLOGY MARKET, BY ROUTE OF ADMINISTRATION, 2018-2032 (USD MILLION)
TABLE 390 MALAYSIA LOCAL OCULAR IN OPHTHALMOLOGY MARKET, BY ROUTE OF ADMINISTRATION, 2018-2032 (USD MILLION)
TABLE 391 MALAYSIA INJECTABLES IN OPHTHALMOLOGY MARKET, BY ROUTE OF ADMINISTRATION, 2018-2032 (USD MILLION)
TABLE 392 MALAYSIA ORAL IN OPHTHALMOLOGY MARKET, BY ROUTE OF ADMINISTRATION, 2018-2032 (USD MILLION)
TABLE 393 MALAYSIA OPHTHALMOLOGY MARKET, BY COMPREHENSIVE EYE EXAMINATION, 2018-2032 (USD MILLION)
TABLE 394 MALAYSIA REFRACTION IN OPHTHALMOLOGY MARKET, BY COMPREHENSIVE EYE EXAMINATION, 2018-2032 (USD MILLION)
TABLE 395 MALAYSIA VISUAL ACUITY TEST IN OPHTHALMOLOGY MARKET, BY COMPREHENSIVE EYE EXAMINATION, 2018-2032 (USD MILLION)
TABLE 396 MALAYSIA INTRAOCULAR PRESSURE IN OPHTHALMOLOGY MARKET, BY COMPREHENSIVE EYE EXAMINATION, 2018-2032 (USD MILLION)
TABLE 397 MALAYSIA ANTERIOR SEGMENT AND PUPILLARY EXAMINATION IN OPHTHALMOLOGY MARKET, BY COMPREHENSIVE EYE EXAMINATION, 2018-2032 (USD MILLION)
TABLE 398 MALAYSIA VISUAL FIELDS TEST IN OPHTHALMOLOGY MARKET, BY COMPREHENSIVE EYE EXAMINATION, 2018-2032 (USD MILLION)
TABLE 399 MALAYSIA OPHTHALMOLOGY MARKET, BY END USER, 2018-2032 (USD MILLION)
TABLE 400 MALAYSIA OPHTHALMOLOGY MARKET, BY DISTRIBUTION CHANNEL, 2018-2032 (USD MILLION)
TABLE 401 MALAYSIA RETAIL SALES IN OPHTHALMOLOGY MARKET, BY DISTRIBUTION CHANNEL, 2018-2032 (USD MILLION)
TABLE 402 PHILIPPINES OPHTHALMOLOGY MARKET, BY PRODUCTS, 2018-2032 (USD MILLION)
TABLE 403 PHILIPPINES DEVICE IN OPHTHALMOLOGY MARKET, BY PRODUCTS, 2018-2032 (USD MILLION)
TABLE 404 PHILIPPINES SURGICAL DEVICE IN OPHTHALMOLOGY MARKET, BY PRODUCT, 2018-2032 (USD MILLION)
TABLE 405 PHILIPPINES OPHTHALMIC VISCOELASTIC DEVICES IN OPHTHALMOLOGY MARKET, BY PRODUCTS, 2018-2032 (USD MILLION)
TABLE 406 PHILIPPINES VITREORETINAL SURGICAL DEVICES IN OPHTHALMOLOGY MARKET, BY PRODUCTS, 2018-2032 (USD MILLION)
TABLE 407 PHILIPPINES REFRACTIVE SURGICAL DEVICES IN OPHTHALMOLOGY MARKET, BY PRODUCTS, 2018-2032 (USD MILLION)
TABLE 408 PHILIPPINES GLAUCOMA SURGICAL DEVICES IN OPHTHALMOLOGY MARKET, BY PRODUCTS, 2018-2032 (USD MILLION)
TABLE 409 PHILIPPINES DIAGNOSTIC DEVICE IN OPHTHALMOLOGY MARKET, BY PRODUCTS, 2018-2032 (USD MILLION)
TABLE 410 PHILIPPINES OPHTHALMIC ULTRASOUND IMAGING SYSTEMS IN OPHTHALMOLOGY MARKET, BY PRODUCTS, 2018-2032 (USD MILLION)
TABLE 411 PHILIPPINES OPHTHALMIC SURGICAL ACCESSORIES IN OPHTHALMOLOGY MARKET, BY PRODUCTS, 2018-2032 (USD MILLION)
TABLE 412 PHILIPPINES DRUGS IN OPHTHALMOLOGY MARKET, BY PRODUCTS, 2018-2032 (USD MILLION)
TABLE 413 PHILIPPINES ANTI-VEGF DRUGS IN OPHTHALMOLOGY MARKET, BY PRODUCTS, 2018-2032 (USD MILLION)
TABLE 414 PHILIPPINES ANTI-GLAUCOMA DRUGS IN OPHTHALMOLOGY MARKET, BY PRODUCTS, 2018-2032 (USD MILLION)
TABLE 415 PHILIPPINES PROSTAGLANDIN ANALOGS IN OPHTHALMOLOGY MARKET, BY PRODUCTS, 2018-2032 (USD MILLION)
TABLE 416 PHILIPPINES BETA ADRENERGIC ANTAGONISTS IN OPHTHALMOLOGY MARKET, BY PRODUCTS, 2018-2032 (USD MILLION)
TABLE 417 PHILIPPINES ALPHA ADRENERGIC AGONISTS IN OPHTHALMOLOGY MARKET, BY PRODUCTS, 2018-2032 (USD MILLION)
TABLE 418 PHILIPPINES MIOTICS IN OPHTHALMOLOGY MARKET, BY PRODUCTS, 2018-2032 (USD MILLION)
TABLE 419 PHILIPPINES ANTI-INFLAMMATORY DRUGS IN OPHTHALMOLOGY MARKET, BY PRODUCTS, 2018-2032 (USD MILLION)
TABLE 420 PHILIPPINES OTHERS IN OPHTHALMOLOGY MARKET, BY PRODUCTS, 2018-2032 (USD MILLION)
TABLE 421 PHILIPPINES VISION CARE PRODUCTS IN OPHTHALMOLOGY MARKET, BY PRODUCTS, 2018-2032 (USD MILLION)
TABLE 422 PHILIPPINES CONTACT LENSES IN OPHTHALMOLOGY MARKET, BY PRODUCTS, 2018-2032 (USD MILLION)
TABLE 423 PHILIPPINES OPHTHALMOLOGY MARKET, BY DISEASES, 2018-2032 (USD MILLION)
TABLE 424 PHILIPPINES DRUGS IN OPHTHALMOLOGY MARKET, BY DRUG TYPE, 2018-2032 (USD MILLION)
TABLE 425 PHILIPPINES DRUGS IN OPHTHALMOLOGY MARKET, BY PRESCRIPTION MODE, 2018-2032 (USD MILLION)
TABLE 426 PHILIPPINES DRUGS IN OPHTHALMOLOGY MARKET, BY ROUTE OF ADMINISTRATION, 2018-2032 (USD MILLION)
TABLE 427 PHILIPPINES TOPICAL IN OPHTHALMOLOGY MARKET, BY ROUTE OF ADMINISTRATION, 2018-2032 (USD MILLION)
TABLE 428 PHILIPPINES LOCAL OCULAR IN OPHTHALMOLOGY MARKET, BY ROUTE OF ADMINISTRATION, 2018-2032 (USD MILLION)
TABLE 429 PHILIPPINES INJECTABLES IN OPHTHALMOLOGY MARKET, BY ROUTE OF ADMINISTRATION, 2018-2032 (USD MILLION)
TABLE 430 PHILIPPINES ORAL IN OPHTHALMOLOGY MARKET, BY ROUTE OF ADMINISTRATION, 2018-2032 (USD MILLION)
TABLE 431 PHILIPPINES OPHTHALMOLOGY MARKET, BY COMPREHENSIVE EYE EXAMINATION, 2018-2032 (USD MILLION)
TABLE 432 PHILIPPINES REFRACTION IN OPHTHALMOLOGY MARKET, BY COMPREHENSIVE EYE EXAMINATION, 2018-2032 (USD MILLION)
TABLE 433 PHILIPPINES VISUAL ACUITY TEST IN OPHTHALMOLOGY MARKET, BY COMPREHENSIVE EYE EXAMINATION, 2018-2032 (USD MILLION)
TABLE 434 PHILIPPINES INTRAOCULAR PRESSURE IN OPHTHALMOLOGY MARKET, BY COMPREHENSIVE EYE EXAMINATION, 2018-2032 (USD MILLION)
TABLE 435 PHILIPPINES ANTERIOR SEGMENT AND PUPILLARY EXAMINATION IN OPHTHALMOLOGY MARKET, BY COMPREHENSIVE EYE EXAMINATION, 2018-2032 (USD MILLION)
TABLE 436 PHILIPPINES VISUAL FIELDS TEST IN OPHTHALMOLOGY MARKET, BY COMPREHENSIVE EYE EXAMINATION, 2018-2032 (USD MILLION)
TABLE 437 PHILIPPINES OPHTHALMOLOGY MARKET, BY END USER, 2018-2032 (USD MILLION)
TABLE 438 PHILIPPINES OPHTHALMOLOGY MARKET, BY DISTRIBUTION CHANNEL, 2018-2032 (USD MILLION)
TABLE 439 PHILIPPINES RETAIL SALES IN OPHTHALMOLOGY MARKET, BY DISTRIBUTION CHANNEL, 2018-2032 (USD MILLION)
TABLE 440 SINGAPORE OPHTHALMOLOGY MARKET, BY PRODUCTS, 2018-2032 (USD MILLION)
TABLE 441 SINGAPORE DEVICE IN OPHTHALMOLOGY MARKET, BY PRODUCTS, 2018-2032 (USD MILLION)
TABLE 442 SINGAPORE SURGICAL DEVICE IN OPHTHALMOLOGY MARKET, BY PRODUCT, 2018-2032 (USD MILLION)
TABLE 443 SINGAPORE OPHTHALMIC VISCOELASTIC DEVICES IN OPHTHALMOLOGY MARKET, BY PRODUCTS, 2018-2032 (USD MILLION)
TABLE 444 SINGAPORE VITREORETINAL SURGICAL DEVICES IN OPHTHALMOLOGY MARKET, BY PRODUCTS, 2018-2032 (USD MILLION)
TABLE 445 SINGAPORE REFRACTIVE SURGICAL DEVICES IN OPHTHALMOLOGY MARKET, BY PRODUCTS, 2018-2032 (USD MILLION)
TABLE 446 SINGAPORE GLAUCOMA SURGICAL DEVICES IN OPHTHALMOLOGY MARKET, BY PRODUCTS, 2018-2032 (USD MILLION)
TABLE 447 SINGAPORE DIAGNOSTIC DEVICE IN OPHTHALMOLOGY MARKET, BY PRODUCTS, 2018-2032 (USD MILLION)
TABLE 448 SINGAPORE OPHTHALMIC ULTRASOUND IMAGING SYSTEMS IN OPHTHALMOLOGY MARKET, BY PRODUCTS, 2018-2032 (USD MILLION)
TABLE 449 SINGAPORE OPHTHALMIC SURGICAL ACCESSORIES IN OPHTHALMOLOGY MARKET, BY PRODUCTS, 2018-2032 (USD MILLION)
TABLE 450 SINGAPORE DRUGS IN OPHTHALMOLOGY MARKET, BY PRODUCTS, 2018-2032 (USD MILLION)
TABLE 451 SINGAPORE ANTI-VEGF DRUGS IN OPHTHALMOLOGY MARKET, BY PRODUCTS, 2018-2032 (USD MILLION)
TABLE 452 SINGAPORE ANTI-GLAUCOMA DRUGS IN OPHTHALMOLOGY MARKET, BY PRODUCTS, 2018-2032 (USD MILLION)
TABLE 453 SINGAPORE PROSTAGLANDIN ANALOGS IN OPHTHALMOLOGY MARKET, BY PRODUCTS, 2018-2032 (USD MILLION)
TABLE 454 SINGAPORE BETA ADRENERGIC ANTAGONISTS IN OPHTHALMOLOGY MARKET, BY PRODUCTS, 2018-2032 (USD MILLION)
TABLE 455 SINGAPORE ALPHA ADRENERGIC AGONISTS IN OPHTHALMOLOGY MARKET, BY PRODUCTS, 2018-2032 (USD MILLION)
TABLE 456 SINGAPORE MIOTICS IN OPHTHALMOLOGY MARKET, BY PRODUCTS, 2018-2032 (USD MILLION)
TABLE 457 SINGAPORE ANTI-INFLAMMATORY DRUGS IN OPHTHALMOLOGY MARKET, BY PRODUCTS, 2018-2032 (USD MILLION)
TABLE 458 SINGAPORE OTHERS IN OPHTHALMOLOGY MARKET, BY PRODUCTS, 2018-2032 (USD MILLION)
TABLE 459 SINGAPORE VISION CARE PRODUCTS IN OPHTHALMOLOGY MARKET, BY PRODUCTS, 2018-2032 (USD MILLION)
TABLE 460 SINGAPORE CONTACT LENSES IN OPHTHALMOLOGY MARKET, BY PRODUCTS, 2018-2032 (USD MILLION)
TABLE 461 SINGAPORE OPHTHALMOLOGY MARKET, BY DISEASES, 2018-2032 (USD MILLION)
TABLE 462 SINGAPORE DRUGS IN OPHTHALMOLOGY MARKET, BY DRUG TYPE, 2018-2032 (USD MILLION)
TABLE 463 SINGAPORE DRUGS IN OPHTHALMOLOGY MARKET, BY PRESCRIPTION MODE, 2018-2032 (USD MILLION)
TABLE 464 SINGAPORE DRUGS IN OPHTHALMOLOGY MARKET, BY ROUTE OF ADMINISTRATION, 2018-2032 (USD MILLION)
TABLE 465 SINGAPORE TOPICAL IN OPHTHALMOLOGY MARKET, BY ROUTE OF ADMINISTRATION, 2018-2032 (USD MILLION)
TABLE 466 SINGAPORE LOCAL OCULAR IN OPHTHALMOLOGY MARKET, BY ROUTE OF ADMINISTRATION, 2018-2032 (USD MILLION)
TABLE 467 SINGAPORE INJECTABLES IN OPHTHALMOLOGY MARKET, BY ROUTE OF ADMINISTRATION, 2018-2032 (USD MILLION)
TABLE 468 SINGAPORE ORAL IN OPHTHALMOLOGY MARKET, BY ROUTE OF ADMINISTRATION, 2018-2032 (USD MILLION)
TABLE 469 SINGAPORE OPHTHALMOLOGY MARKET, BY COMPREHENSIVE EYE EXAMINATION, 2018-2032 (USD MILLION)
TABLE 470 SINGAPORE REFRACTION IN OPHTHALMOLOGY MARKET, BY COMPREHENSIVE EYE EXAMINATION, 2018-2032 (USD MILLION)
TABLE 471 SINGAPORE VISUAL ACUITY TEST IN OPHTHALMOLOGY MARKET, BY COMPREHENSIVE EYE EXAMINATION, 2018-2032 (USD MILLION)
TABLE 472 SINGAPORE INTRAOCULAR PRESSURE IN OPHTHALMOLOGY MARKET, BY COMPREHENSIVE EYE EXAMINATION, 2018-2032 (USD MILLION)
TABLE 473 SINGAPORE ANTERIOR SEGMENT AND PUPILLARY EXAMINATION IN OPHTHALMOLOGY MARKET, BY COMPREHENSIVE EYE EXAMINATION, 2018-2032 (USD MILLION)
TABLE 474 SINGAPORE VISUAL FIELDS TEST IN OPHTHALMOLOGY MARKET, BY COMPREHENSIVE EYE EXAMINATION, 2018-2032 (USD MILLION)
TABLE 475 SINGAPORE OPHTHALMOLOGY MARKET, BY END USER, 2018-2032 (USD MILLION)
TABLE 476 SINGAPORE OPHTHALMOLOGY MARKET, BY DISTRIBUTION CHANNEL, 2018-2032 (USD MILLION)
TABLE 477 SINGAPORE RETAIL SALES IN OPHTHALMOLOGY MARKET, BY DISTRIBUTION CHANNEL, 2018-2032 (USD MILLION)
TABLE 478 REST OF ASIA-PACIFIC OPHTHALMOLOGY MARKET, BY PRODUCTS, 2018-2032 (USD MILLION)
Lista de figuras
FIGURE 1 ASIA-PACIFIC OPHTHALMOLOGY MARKET: SEGMENTATION
FIGURE 2 ASIA-PACIFIC OPHTHALMOLOGY MARKET: DATA TRIANGULATION
FIGURE 3 ASIA-PACIFIC OPHTHALMOLOGY MARKET: DROC ANALYSIS
FIGURE 4 ASIA-PACIFIC OPHTHALMOLOGY MARKET: ASIA-PACIFIC VS REGIONAL MARKET ANALYSIS
FIGURE 5 ASIA-PACIFIC OPHTHALMOLOGY MARKET: COMPANY RESEARCH ANALYSIS
FIGURE 6 ASIA-PACIFIC OPHTHALMOLOGY MARKET: INTERVIEW DEMOGRAPHICS
FIGURE 7 ASIA-PACIFIC OPHTHALMOLOGY MARKET: MARKET APPLICATION COVERAGE GRID
FIGURE 8 ASIA-PACIFIC OPHTHALMOLOGY MARKET: DBMR MARKET POSITION GRID
FIGURE 9 ASIA-PACIFIC OPHTHALMOLOGY MARKET: VENDOR SHARE ANALYSIS
FIGURE 10 ASIA-PACIFIC OPHTHALMOLOGY MARKET: SEGMENTATION
FIGURE 11 THREE SEGMENTS COMPRISE THE ASIA-PACIFIC OPHTHALMOLOGY MARKET, BY PRODUCTS
FIGURE 12 EXECUTIVE SUMMARY
FIGURE 13 STRATEGIC DECISIONS
FIGURE 14 RISING INCIDENCE OF EYE DISORDERS IS DRIVING THE GROWTH OF THE ASIA-PACIFIC OPHTHALMOLOGY MARKET FROM 2025 TO 2032
FIGURE 15 THE PRODUCTS SEGMENT IS EXPECTED TO ACCOUNT FOR THE LARGEST SHARE OF THE ASIA-PACIFIC OPHTHALMOLOGY MARKET IN 2025 AND 2032
FIGURE 16 DROC ANALYSIS
FIGURE 17 ASIA-PACIFIC OPHTHALMOLOGY MARKET: BY PRODUCTS, 2024
FIGURE 18 ASIA-PACIFIC OPHTHALMOLOGY MARKET: BY PRODUCTS, 2025-2032 (USD MILLION)
FIGURE 19 ASIA-PACIFIC OPHTHALMOLOGY MARKET: BY PRODUCTS, CAGR (2025-2032)
FIGURE 20 ASIA-PACIFIC OPHTHALMOLOGY MARKET: BY PRODUCTS, LIFELINE CURVE
FIGURE 21 ASIA-PACIFIC OPHTHALMOLOGY MARKET: BY DISEASES, 2024
FIGURE 22 ASIA-PACIFIC OPHTHALMOLOGY MARKET: BY DISEASES, 2025-2032 (USD MILLION)
FIGURE 23 ASIA-PACIFIC OPHTHALMOLOGY MARKET: BY DISEASES, CAGR (2025-2032)
FIGURE 24 ASIA-PACIFIC OPHTHALMOLOGY MARKET: BY DISEASES, LIFELINE CURVE
FIGURE 25 ASIA-PACIFIC OPHTHALMOLOGY MARKET: BY COMPREHENSIVE EYE EXAMINATION, 2024
FIGURE 26 ASIA-PACIFIC OPHTHALMOLOGY MARKET: BY COMPREHENSIVE EYE EXAMINATION, 2025-2032 (USD MILLION)
FIGURE 27 ASIA-PACIFIC OPHTHALMOLOGY MARKET: BY COMPREHENSIVE EYE EXAMINATION, CAGR (2025-2032)
FIGURE 28 ASIA-PACIFIC OPHTHALMOLOGY MARKET: BY COMPREHENSIVE EYE EXAMINATION, LIFELINE CURVE
FIGURE 29 ASIA-PACIFIC OPHTHALMOLOGY MARKET: BY END USER, 2024
FIGURE 30 ASIA-PACIFIC OPHTHALMOLOGY MARKET: BY END USER, 2025-2032 (USD MILLION)
FIGURE 31 ASIA-PACIFIC OPHTHALMOLOGY MARKET: BY END USER, CAGR (2025-2032)
FIGURE 32 ASIA-PACIFIC OPHTHALMOLOGY MARKET: BY END USER, LIFELINE CURVE
FIGURE 33 ASIA-PACIFIC OPHTHALMOLOGY MARKET: BY DISTRIBUTION CHANNEL ,2024
FIGURE 34 ASIA-PACIFIC OPHTHALMOLOGY MARKET: BY DISTRIBUTION CHANNEL, 2025-2032 (USD MILLION)
FIGURE 35 ASIA-PACIFIC OPHTHALMOLOGY MARKET: BY DISTRIBUTION CHANNEL, CAGR (2025-2032)
FIGURE 36 ASIA-PACIFIC OPHTHALMOLOGY MARKET: BY DISTRIBUTION CHANNEL, LIFELINE CURVE
FIGURE 37 ASIA-PACIFIC OPHTHALMOLOGY MARKET SNAPSHOT
FIGURE 38 ASIA-PACIFIC OPHTHALMOLOGY MARKET: COMPANY SHARE 2024 (%)
Metodología de investigación
La recopilación de datos y el análisis del año base se realizan utilizando módulos de recopilación de datos con muestras de gran tamaño. La etapa incluye la obtención de información de mercado o datos relacionados a través de varias fuentes y estrategias. Incluye el examen y la planificación de todos los datos adquiridos del pasado con antelación. Asimismo, abarca el examen de las inconsistencias de información observadas en diferentes fuentes de información. Los datos de mercado se analizan y estiman utilizando modelos estadísticos y coherentes de mercado. Además, el análisis de la participación de mercado y el análisis de tendencias clave son los principales factores de éxito en el informe de mercado. Para obtener más información, solicite una llamada de un analista o envíe su consulta.
La metodología de investigación clave utilizada por el equipo de investigación de DBMR es la triangulación de datos, que implica la extracción de datos, el análisis del impacto de las variables de datos en el mercado y la validación primaria (experto en la industria). Los modelos de datos incluyen cuadrícula de posicionamiento de proveedores, análisis de línea de tiempo de mercado, descripción general y guía del mercado, cuadrícula de posicionamiento de la empresa, análisis de patentes, análisis de precios, análisis de participación de mercado de la empresa, estándares de medición, análisis global versus regional y de participación de proveedores. Para obtener más información sobre la metodología de investigación, envíe una consulta para hablar con nuestros expertos de la industria.
Personalización disponible
Data Bridge Market Research es líder en investigación formativa avanzada. Nos enorgullecemos de brindar servicios a nuestros clientes existentes y nuevos con datos y análisis que coinciden y se adaptan a sus objetivos. El informe se puede personalizar para incluir análisis de tendencias de precios de marcas objetivo, comprensión del mercado de países adicionales (solicite la lista de países), datos de resultados de ensayos clínicos, revisión de literatura, análisis de mercado renovado y base de productos. El análisis de mercado de competidores objetivo se puede analizar desde análisis basados en tecnología hasta estrategias de cartera de mercado. Podemos agregar tantos competidores sobre los que necesite datos en el formato y estilo de datos que esté buscando. Nuestro equipo de analistas también puede proporcionarle datos en archivos de Excel sin procesar, tablas dinámicas (libro de datos) o puede ayudarlo a crear presentaciones a partir de los conjuntos de datos disponibles en el informe.

