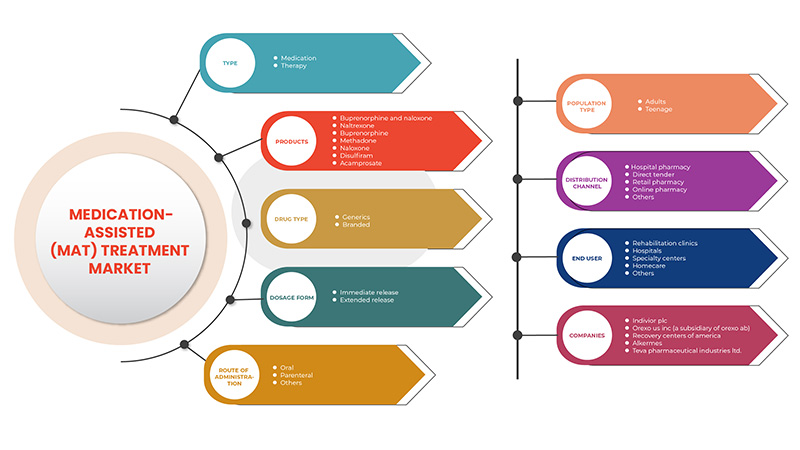
Asia-Pacific Medication-Assisted Treatment (MAT) Market, By Type (Medication and Therapy), Products (Buprenorphine and Naloxone, Naltrexone, Buprenorphine, Methadone, Naloxone, Disulfiram and Acamprosate), Drug Type (Generics and Branded), Dosage Form (Immediate Release and Extended Release), Route of Administration (Oral, Parenteral and Others), Population Type (Adults and Teenage), End User (Rehabilitation Clinics, Hospitals, Specialty Centres, Homecare and Others) Distribution Channel (Hospital Pharmacy, Direct Tender, Retail Pharmacy, Online Pharmacy and Others), Industry Trends and Forecast to 2029
Market Analysis and Insights
The Food and Drug Administration (FDA) approved three clinical drugs: buprenorphine, methadone, and naltrexone. Medication-assisted treatment (MAT) is applied to cure alcohol use disorder, opioid dependency medication, and opioid overdose prevention medication. Alcohol use disorder (AUD) is a medical condition characterized by an impaired ability to stop alcohol use despite adverse social, occupational, or health consequences. Acamprosate, disulfiram, and naltrexone are the most common medications used to treat alcohol use disorder (AUD). The opioid dependency medication, rise in addiction for opioids among patients. Buprenorphine, methadone, and naltrexone are used to treat opioid use disorders to short-acting opioids such as heroin, morphine, and codeine, as well as semi-synthetic opioids like oxycodone and hydrocodone. These MAT medications are safe for months, years, or even a lifetime.
Market Definition
Medication-assisted treatment (MAT) involves using medications, combined with counseling and behavioral therapies, to provide a complete patient approach for the treatment of substance use disorders. MAT is primarily used to treat addiction to opioids such as heroin and prescription pain relievers. The aim of MAT is proper recovery, which includes improved patient survival, increased treatment retention, reduced illicit response, and a rise in pregnancy outcomes among women. For opioid overdose prevention medication, naloxone is used to prevent opioid overdose by reversing the toxic effects of the overdose. According to the World Health Organization (WHO) and Substance Abuse and Mental Health Services Administration (SAMHSA) naloxone is one of many medications considered essential to a functioning health care system.
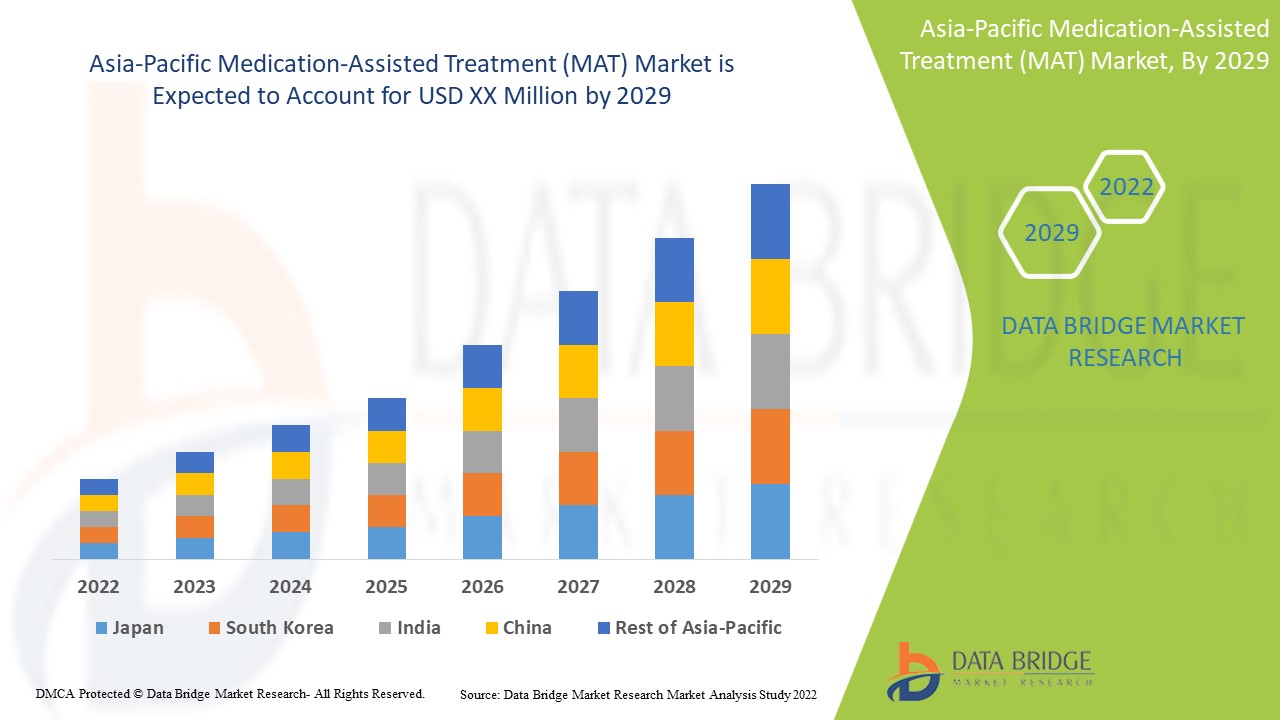
The Asia-Pacific medication-assisted treatment is supportive and aims to reduce the severity of the symptoms. Data Bridge Market Research analyses that the medication-assisted treatment (MAT) market will grow at a CAGR of 10.5% from 2022 to 2029.
|
Report Metric |
Details |
|
Forecast Period |
2022 to 2029 |
|
Base Year |
2021 |
|
Historic Years |
2020 (Customizable to 2019 - 2014) |
|
Quantitative Units |
Revenue in USD Million, Pricing in USD |
|
Segments Covered |
Por tipo (medicamento y terapia), productos (buprenorfina y naloxona, naltrexona, buprenorfina, metadona, naloxona, disulfiram y acamprosato), tipo de medicamento (genéricos y de marca), forma farmacéutica (liberación inmediata y liberación prolongada), vía de administración (oral, parenteral y otras), tipo de población (adultos y adolescentes), usuario final (clínicas de rehabilitación, hospitales, centros especializados, atención domiciliaria y otros), canal de distribución (farmacia hospitalaria, licitación directa, farmacia minorista, farmacia en línea y otros) |
|
Países cubiertos |
China, Japón, Corea del Sur, India, Australia, Singapur, Tailandia, Malasia, Indonesia, Filipinas, Vietnam y resto de Asia-Pacífico. |
|
Actores del mercado cubiertos |
Indivior PLC, Sun Pharmaceutical Industries Ltd., Taj Pharmaceuticals Limited, Hikma Pharmaceuticals PLC, Pfizer Inc., Glenmark Pharmaceutical Inc., Viatris Inc., Alvogen, Accord Healthcare, Teva Pharmaceutical Industries Ltd., Dr. Reddy's Laboratories Ltd., Amneal Pharmaceuticals LLC, entre otros. |
Dinámica del mercado de tratamiento asistido por medicamentos (MAT) en Asia y el Pacífico
Conductores
- El aumento de la incidencia de los trastornos por consumo de opioides (medicamentos para la dependencia de opioides)
El tratamiento asistido con medicamentos (MAT, por sus siglas en inglés) utiliza medicamentos en combinación con terapias conductuales y de asesoramiento para brindar un enfoque integral al paciente en el tratamiento de los trastornos por consumo de sustancias. Los medicamentos utilizados en el MAT están aprobados por la Administración de Alimentos y Medicamentos (FDA, por sus siglas en inglés), y los programas de MAT están diseñados clínicamente y adaptados para satisfacer las necesidades de cada paciente.
Por ejemplo,
- La prevalencia del consumo de opioides de alto riesgo (por inyección o consumo regular o de larga duración) entre adultos (de 15 a 64 años) en Asia y el Pacífico se ha mantenido relativamente estable durante muchos años, y se estima que los consumidores representan alrededor del 0,35 % de la población de la UE.
Como las empresas participan constantemente en actividades de investigación y desarrollo, el conocimiento sobre la incidencia de los trastornos por consumo de alcohol y opioides ayudaría a encontrar soluciones novedosas y facilitaría más colaboraciones. Esto significa un aumento en las inversiones relacionadas con la investigación y el desarrollo para iniciar medicamentos genéricos en el tratamiento asistido por medicamentos (MAT), lo que se espera que impulse el crecimiento del mercado.
- La financiación gubernamental para el tratamiento asistido por medicamentos (MAT)
A pesar de la eficacia demostrada de las farmacoterapias para tratar el consumo de opioides y los trastornos relacionados con el alcohol, se han observado limitaciones en la implementación de medicamentos para el tratamiento de las adicciones (MAT) por parte de programas de tratamiento especializados. Es necesario prestar especial atención a las fuentes específicas de financiación, la estructura organizativa y los recursos de personal, realizando una inversión a largo plazo que alinee el pago con los posibles beneficiarios futuros.
Por ejemplo,
- En febrero de 2021, se financió el Programa Integrado de Capacitación sobre Trastornos por Consumo de Sustancias (ISTP) para planificar, desarrollar y operar un programa de capacitación de 12 meses a tiempo completo o 24 meses a tiempo parcial para enfermeros profesionales y asistentes médicos para el tratamiento asistido con medicamentos (MAT). La financiación amplía la fuerza laboral capacitada para brindar atención a personas que necesitan salud mental y prevención de trastornos por consumo de opioides.
La financiación por parte del gobierno se traduciría en seguridad para el paciente y ahorro de costes. Además, los hospitales y las agencias de atención sanitaria administrarían este tratamiento a un precio más bajo gracias a la colaboración con las organizaciones gubernamentales. Por tanto, se espera que los avances en las actividades de investigación y desarrollo y la financiación por parte del gobierno impulsen el crecimiento del mercado.
Oportunidades
- Aumento del gasto sanitario
Además, el aumento de las actividades de investigación y desarrollo y el aumento de las inversiones por parte de organizaciones gubernamentales y privadas impulsarán nuevas oportunidades para la tasa de crecimiento del mercado.
Por ejemplo,
- En marzo de 2020, los datos del Instituto Nacional de Salud (NIH) indican que Medicare gastó alrededor de USD 829.500 millones en 2020, o el 20 por ciento del total del NHE.
El aumento del gasto sanitario también es beneficioso para el desarrollo económico y el crecimiento del sector sanitario. Además, el aumento de los ingresos disponibles de la población es un factor favorable. Se espera que todo lo anterior genere oportunidades lucrativas de tratamiento asistido con medicamentos (MAT).
- Iniciativa estratégica de los actores del mercado
La demanda de tratamientos asistidos con medicamentos (MAT) ha aumentado en los EE. UU. y la región Asia-Pacífico debido al tratamiento oportuno de enfermedades crónicas. Estos factores favorables aumentan la necesidad de medicamentos y, para satisfacer la demanda del mercado, los actores principales y secundarios del mercado están utilizando diversas estrategias.
Los principales actores también están tratando de diseñar estrategias específicas, como lanzamientos de productos, adquisiciones, aprobaciones, expansiones y asociaciones, para garantizar el buen funcionamiento del negocio, evitar riesgos y aumentar el crecimiento a largo plazo de las ventas del mercado.
Por ejemplo,
- En abril de 2021, Adamis Pharmaceuticals Corporation, junto con USWM, anunció el lanzamiento y la disponibilidad de un producto de naloxona inyectable de dosis alta ZIMHI para ayudar a combatir las muertes por sobredosis de opioides. Se espera que el lanzamiento aumente los ingresos del segmento de productos, lo que impulsará el crecimiento del mercado, y que ZIMHI esté disponible a un precio reducido para los socorristas y las organizaciones de salud comunitarias.
Estas iniciativas estratégicas de los actores del mercado, que incluyen adquisiciones, conferencias y lanzamientos de productos enfocados en segmentos específicos, están ayudando a las empresas a crecer y mejorar sus carteras de productos, lo que en última instancia conduce a una mayor generación de ingresos. Por lo tanto, estas iniciativas estratégicas de los actores del mercado brindan una oportunidad que los ayuda a impulsar el crecimiento del mercado.
Restricción/Desafío
- Efectos secundarios de los medicamentos utilizados en el tratamiento asistido por medicamentos (MAT)
El tratamiento asistido con medicamentos (MAT) implica el uso de medicamentos, combinados con terapias conductuales y de asesoramiento, para brindar un enfoque integral del paciente como parte de la estrategia de tratamiento. Por lo tanto, se espera que el alto costo actual muestre una tendencia descendente en el futuro. Se ha demostrado que el MAT es más eficaz para tratar los trastornos por consumo de alcohol y opioides. Sin embargo, se han informado ciertos efectos secundarios.
Por ejemplo,
- La metadona y la buprenorfina, medicamentos genéricos, son químicamente similares a los opioides, por lo que sus efectos secundarios también pueden ser similares. Estos pueden incluir estreñimiento, somnolencia y mareos. Algunas personas pueden experimentar efectos secundarios más graves.
Las complicaciones adversas notificadas provocarían una disminución de las ventas de medicamentos para la dependencia de opioides, lo que limitaría las ventas de los medicamentos. Además, afectaría a la fiabilidad de los fabricantes que participan en este mercado y, por tanto, se espera que frene el crecimiento del mercado.
Impacto de la COVID-19 en el mercado de tratamientos asistidos con medicamentos (MAT)
Durante la pandemia, el tratamiento asistido por medicamentos (MAT) reduce notablemente la mortalidad y la morbilidad de los pacientes con COVID-19. Se necesitan más estudios a gran escala para aprobar estos resultados. Se debe definir un protocolo para el tratamiento asistido por medicamentos (MAT) en la infección por COVID-19 para lograr los mejores resultados clínicos posibles. Los ensayos clínicos se llevaron a cabo durante la COVID-19. Los servicios de medicación para el trastorno por consumo de opioides (MOUD) son vitales para abordar la crisis de los opioides, y la COVID-19 ha afectado significativamente la prestación de MOUD.
Desarrollo reciente
- En abril de 2021, Adamis Pharmaceuticals Corporation, junto con USWM, anunció el lanzamiento y la disponibilidad de un producto de naloxona inyectable de dosis alta ZIMHI para ayudar a combatir las muertes por sobredosis de opioides. Se espera que el lanzamiento aumente los ingresos del segmento de productos, lo que impulsará el crecimiento del mercado, y que ZIMHI esté disponible a un precio reducido para los socorristas y las organizaciones de salud comunitarias.
Alcance del mercado de tratamiento asistido por medicamentos (MAT) en Asia y el Pacífico
El mercado de tratamientos asistidos por medicamentos (MAT) está segmentado en base a ocho segmentos: tipo, productos, tipo de fármaco, forma de dosificación, vía de administración, tipo de población, usuario final y canal de distribución. El crecimiento entre estos segmentos le ayudará a analizar los segmentos de crecimiento reducido en las industrias y brindará a los usuarios una valiosa descripción general del mercado y conocimientos del mercado para ayudarlos a tomar decisiones estratégicas para identificar las principales aplicaciones del mercado.
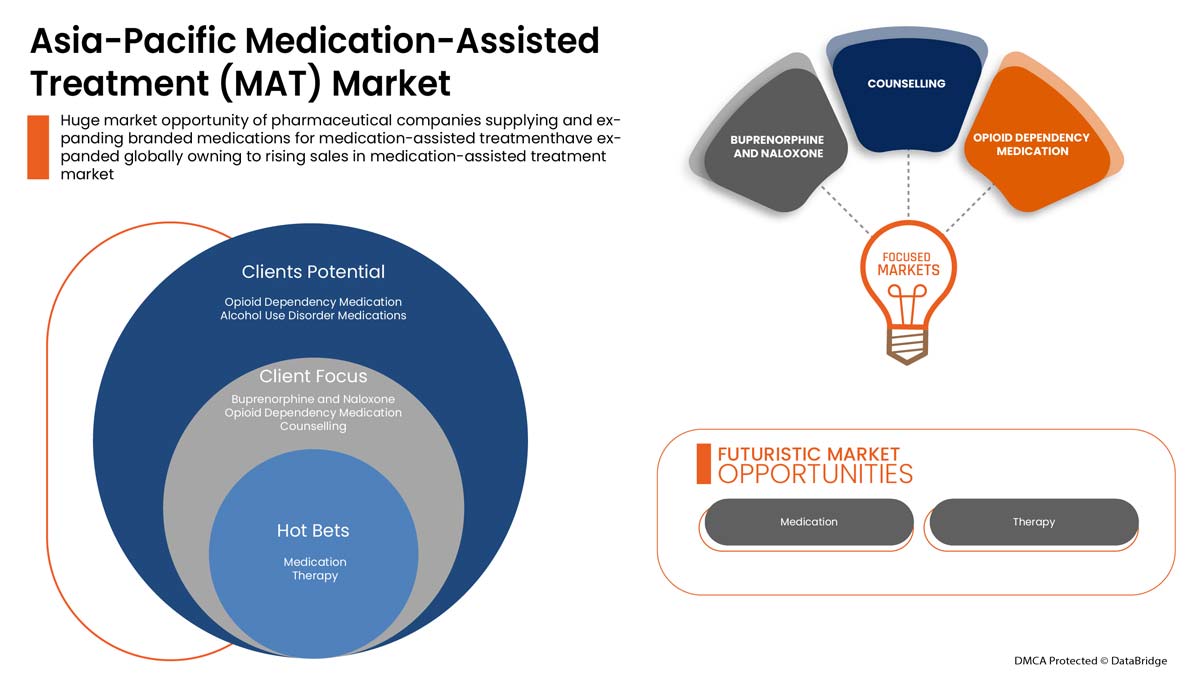
Tipo
- Medicamento
- Terapia
Sobre la base del tipo, el mercado de tratamiento asistido por medicamentos (MAT) de Asia-Pacífico se segmenta en medicamentos y terapias.
Productos
- Buprenorfina y naloxona
- Naltrexona
- Buprenorfina
- Metadona
- Naloxona
- Disulfiram
- Acamprosato
Sobre la base de los productos, el mercado de tratamiento asistido por medicamentos (MAT) de Asia-Pacífico está segmentado en buprenorfina y naloxona, naltrexona, buprenorfina, metadona, naloxona, disulfiram y acamprosato.
Tipo de droga
- Genéricos
- De marca
Según el tipo de medicamento, el mercado de tratamiento asistido por medicamentos (MAT) de Asia-Pacífico está segmentado en genéricos y de marca.
Forma de dosificación
- Publicación inmediata
- Versión extendida
Sobre la base de la forma de dosificación, el mercado de tratamiento asistido por medicamentos (MAT) de Asia-Pacífico está segmentado en liberación inmediata y liberación prolongada.
Vía de administración
- Oral
- Parenteral
- Otros
Sobre la base de la vía de administración, el mercado de tratamiento asistido por medicamentos (MAT) de Asia-Pacífico está segmentado en oral , parenteral y otros.
Tipo de población
- Adultos
- Joven
Según el tipo de población, el mercado de tratamiento asistido por medicamentos (MAT) de Asia-Pacífico está segmentado en adultos y adolescentes.
Usuario final
- Clínicas de rehabilitación
- Hospitales
- Centros de especialidades
- Cuidado domiciliario
- Otros
Sobre la base del usuario final, el mercado de tratamiento asistido por medicamentos (MAT) de Asia-Pacífico está segmentado en clínicas de rehabilitación, hospitales, centros especializados, atención domiciliaria y otros.
Canal de distribución
- Farmacia hospitalaria
- Licitación directa
- Farmacia minorista
- Farmacia en línea
- Otros
Sobre la base del canal de distribución, el mercado de tratamiento asistido por medicamentos (MAT) de Asia-Pacífico está segmentado en farmacia hospitalaria, licitación directa, farmacia minorista, farmacia en línea y otros.
Análisis y perspectivas regionales del mercado de tratamiento asistido por medicamentos (MAT)
Se analiza el mercado de tratamiento asistido por medicamentos (MAT) de Asia y el Pacífico y se proporcionan información y tendencias del tamaño del mercado por regiones, tipo de producto, tipo, aplicación, flujo de trabajo, usuario final y canal de distribución mencionados anteriormente.
Los países cubiertos en el informe del mercado de tratamiento asistido por medicamentos (MAT) son China, Japón, Corea del Sur, India, Australia, Singapur, Tailandia, Malasia, Indonesia, Filipinas, Vietnam y el resto de Asia-Pacífico.
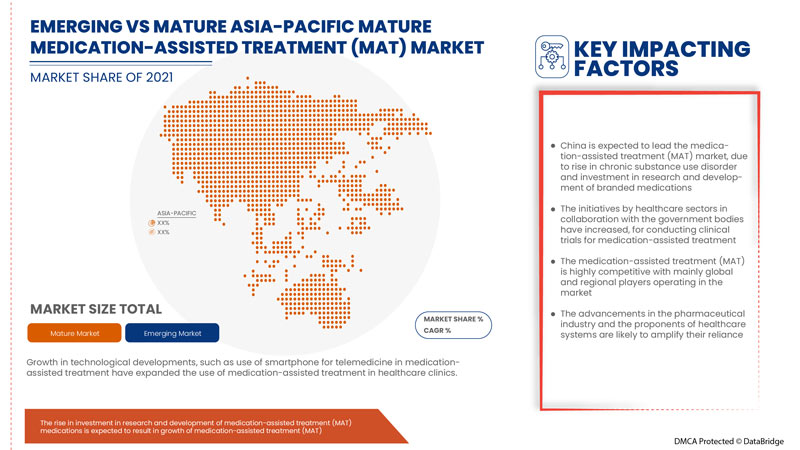
Se espera que China domine el mercado debido al aumento de casos de trastornos por consumo de alcohol y al aumento de la población que recibe tratamiento asistido con medicamentos (MAT) y programas de concientización sobre el tratamiento asistido con medicamentos (MAT) en la región de Asia y el Pacífico.
La sección de países del informe también proporciona factores de impacto de mercado individuales y cambios en la regulación nacional que afectan las tendencias actuales y futuras del mercado. Los puntos de datos como nuevas ventas, ventas de reemplazo, demografía del país, epidemiología de enfermedades y aranceles de importación y exportación son algunos de los indicadores importantes utilizados para pronosticar el escenario del mercado para países individuales. Además, la presencia y disponibilidad de marcas globales y sus desafíos enfrentados debido a la competencia grande o escasa de las marcas locales y nacionales, el impacto de los canales de venta se consideran al proporcionar un análisis de pronóstico de los datos del país.
Análisis del panorama competitivo y de la cuota de mercado del tratamiento asistido con medicamentos (MAT)
El panorama competitivo del mercado de tratamiento asistido por medicamentos (MAT) de Asia-Pacífico proporciona detalles por competidor. Los detalles incluidos son una descripción general de la empresa, las finanzas de la empresa, los ingresos generados, el potencial de mercado, la inversión en investigación y desarrollo, las nuevas iniciativas de mercado, la presencia en Asia-Pacífico, los sitios e instalaciones de producción, las capacidades de producción, las fortalezas y debilidades de la empresa, el lanzamiento de productos, la amplitud y variedad de productos, el dominio de las aplicaciones. Los puntos de datos anteriores proporcionados solo están relacionados con el enfoque de las empresas en relación con el mercado de tratamiento asistido por medicamentos.
Algunos de los principales actores que operan en el mercado de tratamiento asistido por medicamentos (MAT) son Indivior PLC, Sun Pharmaceutical Industries Ltd., Taj Pharmaceuticals Limited, Hikma Pharmaceuticals PLC, Pfizer Inc., Glenmark Pharmaceutical Inc., Viatris Inc., Alvogen, Accord Healthcare, Teva Pharmaceutical Industries Ltd., Amneal Pharmaceuticals LLC. entre otros.
SKU-
Obtenga acceso en línea al informe sobre la primera nube de inteligencia de mercado del mundo
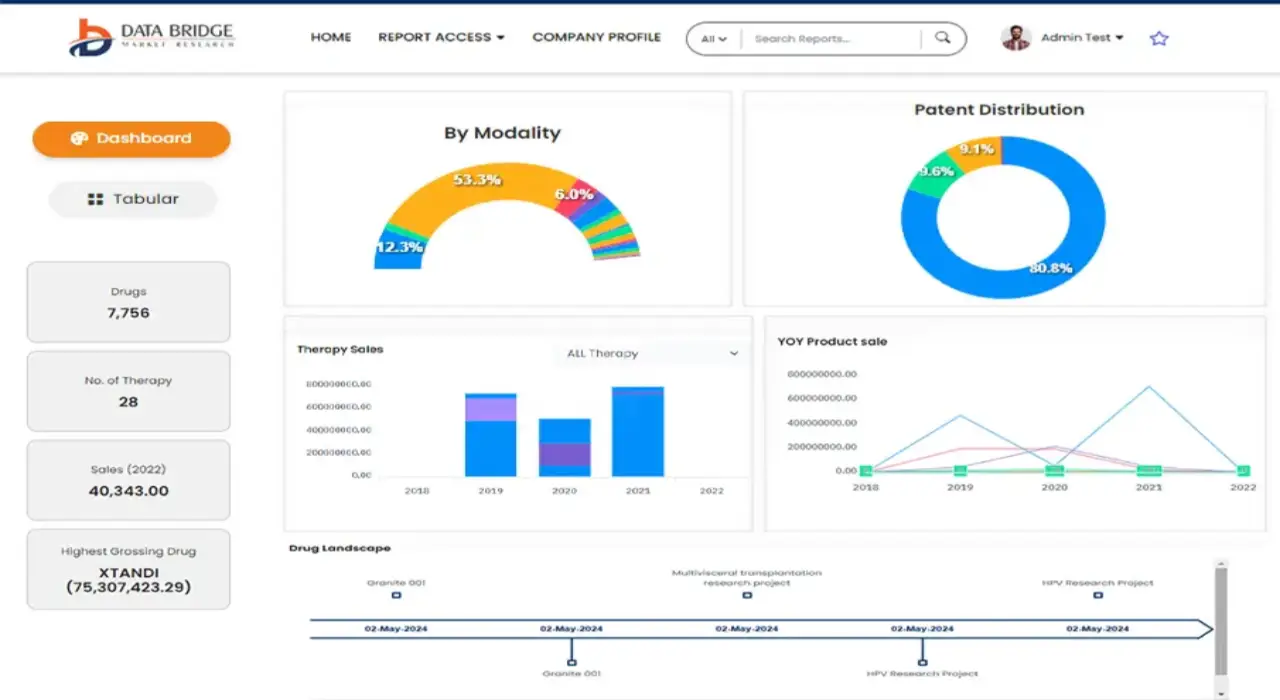
- Panel de análisis de datos interactivo
- Panel de análisis de empresas para oportunidades con alto potencial de crecimiento
- Acceso de analista de investigación para personalización y consultas
- Análisis de la competencia con panel interactivo
- Últimas noticias, actualizaciones y análisis de tendencias
- Aproveche el poder del análisis de referencia para un seguimiento integral de la competencia
Tabla de contenido
1 INTRODUCTION
1.1 OBJECTIVES OF THE STUDY
1.2 MARKET DEFINITION
1.3 OVERVIEW OF ASIA PACIFIC MEDICATION-ASSISTED TREATMENT (MAT) MARKET
1.4 CURRENCY AND PRICING
1.5 LIMITATIONS
1.6 MARKETS COVERED
2 ASIA PACIFIC MEDICATION-ASSISTED TREATMENT (MAT) MARKET: SEGMENTATION
2.1 MARKETS COVERED
2.2 GEOGRAPHICAL SCOPE
2.3 YEARS CONSIDERED FOR THE STUDY
2.4 DBMR TRIPOD DATA VALIDATION MODEL
2.5 PRIMARY INTERVIEWS WITH KEY OPINION LEADERS
2.6 MULTIVARIATE MODELLING
2.7 PRODUCT SEGMENT LIFELINE CURVE
2.8 DBMR MARKET POSITION GRID
2.9 VENDOR SHARE ANALYSIS
2.1 MARKET END USER COVERAGE GRID
2.11 SECONDARY SOURCES
3 EXECUTIVE SUMMARY
4 PREMIUM INSIGHTS
4.1 EPIDEMIOLOGY
4.2 PESTEL
4.3 PORTER'S FIVE FORCES MODEL
4.4 ANNUAL INCIDENCE OF SUBJECTS ENTERING MEDICATION-ASSISTED TREATMENT IN ALCOHOL, OPIOID USE DISORDER, AND OPIOID OVERDOSE PREVENTION (2021)
4.5 ANNUAL NUMBER OF TREATMENTS WITH CLONIDINE AND WITH LOFEXIDINE IN OPIOID USE DISORDER AND OPIOID OVERDOSE PREVENTION (2021)
4.6 ANNUAL INCIDENCE OF INDIVIDUALS RE-ENTERING MEDICATION-ASSISTED TREATMENT. FOR EXAMPLE, SOMEONE MAY DROP OUT OF TREATMENT AND RESTART TREATMENT LATER (2021)
4.7 ANNUAL USE OF NALTREXONE INJECTION AS PART OF TREATMENT FOR THE INITIAL WITHDRAWAL FROM OPIOIDS, AND ANNUAL MAINTENANCE THERAPY USING NALTREXONE INJECTION (2021)
4.8 PIPELINE ANALYSIS FOR MEDICATION-ASSISTED TREATMENT (MAT) MARKET
5 ASIA PACIFIC MEDICATION-ASSISTED TREATMENT MARKET: REGULATIONS
6 MARKET OVERVIEW
6.1 DRIVERS
6.1.1 THE RISE IN INCIDENCE OF ALCOHOL USE DISORDER AND OPIOID USE DISORDERS
6.1.2 THE FUNDING BY THE GOVERNMENT FOR MEDICATION-ASSISTED TREATMENT (MAT)
6.1.3 THE RISE IN THE POPULATION RECEIVING MEDICATION-ASSISTED TREATMENT (MAT) AND MEDICATION-ASSISTED AWARENESS PROGRAMMESMEDICATION-ASSISTED TREATMENT (MAT)
6.1.4 USE OF REIMBURSEMENT FOR MEDICATION-ASSISTED TREATMENT (MAT)
6.2 RESTRAINTS
6.2.1 SIDE EFFECTS OF DRUGS USED IN MEDICATION-ASSISTED TREATMENT (MAT)
6.2.2 ETHICAL ISSUES RELATED TO USE OF MEDICATION-ASSISTED TREATMENTMEDICATION-ASSISTED TREATMENT (MAT)
6.2.3 RISE IN PRODUCT RECALLS
6.3 OPPORTUNITIES
6.3.1 STRATEGIC INITIATIVE BY MARKET PLAYERS
6.3.2 RISE IN HEALTHCARE EXPENDITURE
6.4 CHALLENGES
6.4.1 THE LACK OF SKILLED PROFESSIONALS, REQUIRED FOR MEDICATION-ASSISTED TREATMENT
6.4.2 STRINGENT REGULATIONS
6.4.3 DISCONTINUATION OF MEDICATION-ASSISTED TREATMENT (MAT)
7 ASIA PACIFIC MEDICATION-ASSISTED TREATMENT (MAT) MARKET, BY TYPE
7.1 OVERVIEW
7.2 MEDICATION
7.2.1 OPIOID DEPENDENCY MEDICATION
7.2.1.1 BUPRENORPHINE AND NALOXONE
7.2.1.2 BUPRENORPHINE
7.2.1.3 METHADONE
7.2.1.4 NALTREXONE
7.2.2 ALCOHOL USE DISORDER MEDICATIONS
7.2.2.1 NALTREXONE
7.2.2.2 DISULFIRAM
7.2.2.3 ACAMPROSATE
7.2.3 OPIOID OVERDOSE PREVENTION MEDICATION
7.2.3.1 NALOXONE
7.3 THERAPY
7.3.1 BEHAVIORAL THERAPY
7.3.2 EDUCATIONAL THERAPY
7.3.3 COUNSELLING
7.3.4 VOCATIONAL THERAPY
7.3.5 OTHERS
8 ASIA PACIFIC MEDICATION-ASSISTED TREATMENT (MAT) MARKET, BY PRODUCTS
8.1 OVERVIEW
8.2 BUPRENORPHINE AND NALOXONE
8.3 NALTREXONE
8.4 BUPRENORPHINE
8.5 METHADONE
8.6 NALOXONE
8.7 DISULFIRAM
8.8 ACAMPROSATE
9 ASIA PACIFIC MEDICATION-ASSISTED TREATMENT (MAT) MARKET, BY DRUG TYPE
9.1 OVERVIEW
9.2 GENERICS
9.3 BRANDED
9.3.1 SUBOXONE
9.3.2 VIVITROL
9.3.3 BUTRANS
9.3.4 ZUBSOLV
9.3.5 PROBUPHINE
9.3.6 OTHERS
10 ASIA PACIFIC MEDICATION-ASSISTED TREATMENT (MAT) MARKET, BY DOSAGE FORM
10.1 OVERVIEW
10.2 IMMEDIATE RELEASE
10.3 EXTENDED RELEASE
11 ASIA PACIFIC MEDICATION-ASSISTED TREATMENT (MAT) MARKET, BY ROUTE OF ADMINISTRATION
11.1 OVERVIEW
11.2 ORAL
11.2.1 TABLET
11.2.2 SUBLINGUAL FILM
11.2.3 OTHERS
11.3 PARENTERAL
11.3.1 SOLUTION
11.3.2 SUSPENSION
11.4 OTHERS
12 ASIA PACIFIC MEDICATION-ASSISTED TREATMENT (MAT) MARKET, BY POPULATION TYPE
12.1 OVERVIEW
12.2 ADULTS
12.3 TEENAGE
13 ASIA PACIFIC MEDICATION-ASSISTED TREATMENT (MAT) MARKET, BY END USER
13.1 OVERVIEW
13.2 REHABILITATION CLINICS
13.3 HOSPITALS
13.4 SPECIALTY CENTERS
13.5 HOMECARE
13.6 OTHERS
14 ASIA PACIFIC MEDICATION-ASSISTED TREATMENT (MAT) MARKET, BY DISTRIBUTION CHANNEL
14.1 OVERVIEW
14.2 HOSPITAL PHARMACY
14.3 DIRECT TENDER
14.4 RETAIL PHARMACY
14.5 ONLINE PHARMACY
14.6 OTHERS
15 ASIA PACIFIC MEDICATION-ASSISTED TREATMENT (MAT) MARKET, BY REGION
15.1 ASIA-PACIFIC
15.1.1 CHINA
15.1.2 JAPAN
15.1.3 INDIA
15.1.4 AUSTRALIA
15.1.5 SOUTH KOREA
15.1.6 SINGAPORE
15.1.7 MALAYSIA
15.1.8 THAILAND
15.1.9 INDONESIA
15.1.10 PHILIPPINES
15.1.11 VIETNAM
15.1.12 REST OF ASIA-PACIFIC
16 ASIA PACIFIC MEDICATION-ASSISTED TREATMENT (MAT) MARKET: COMPANY LANDSCAPE
16.1 COMPANY SHARE ANALYSIS: ASIA PACIFIC
17 SWOT ANALYSIS
18 COMPANY PROFILE
18.1 TEVA PHARMACEUTICAL INDUSTRIES LTD. (2021)
18.1.1 COMPANY SNAPSHOT
18.1.2 REVENUE ANALYSIS
18.1.3 COMPANY SHARE ANALYSIS
18.1.4 PRODUCT PORTFOLIO
18.1.5 RECENT DEVELOPMENTS
18.2 INDIVOR PLC (2021)
18.2.1 COMPANY SNAPSHOT
18.2.2 REVENUE ANALYSIS
18.2.3 COMPANY SHARE ANALYSIS
18.2.4 PRODUCT PORTFOLIO
18.2.5 RECENT DEVELOPMENTS
18.3 VIATRIS INC (2021)
18.3.1 COMPANY SNAPSHOT
18.3.2 REVENUE ANALYSIS
18.3.3 COMPANY SHARE ANALYSIS
18.3.4 PRODUCT PORTFOLIO
18.3.5 RECENT DEVELOPMENTS
18.4 SUN PHARMACEUTICAL INDUSTRIES LTD (2021)
18.4.1 COMPANY SNAPSHOT
18.4.2 REVENUE ANALYSIS
18.4.3 COMPANY SHARE ANALYSIS
18.4.4 PRODUCT PORTFOLIO
18.4.5 RECENT DEVELOPMENTS
18.5 ALKERMES (2021)
18.5.1 COMPANY SNAPSHOT
18.5.2 REVENUE ANALYSIS
18.5.3 COMPANY SHARE ANALYSIS
18.5.4 PRODUCT PORTFOLIO
18.5.5 RECENT DEVELOPMENTS
18.6 PURDUE PHARMA L.P. (2021)
18.6.1 COMPANY SNAPSHOT
18.6.2 PRODUCT PORTFOLIO
18.6.3 RECENT DEVELOPMENTS
18.7 PFIZER (2021)
18.7.1 COMPANY SNAPSHOT
18.7.2 REVENUE ANALYSIS
18.7.3 PRODUCT PORTFOLIO
18.7.4 RECENT DEVELOPMENTS
18.8 GLENMARK PHARMACEUTICAL INC (2021)
18.8.1 COMPANY SNAPSHOT
18.8.2 REVENUE ANALYSIS
18.8.3 PRODUCT PORTFOLIO
18.8.4 RECENT DEVELOPMENTS
18.9 DR. REDDY’S LABORATORIES LTD (2021)
18.9.1 COMPANY SNAPSHOT
18.9.2 REVENUE ANALYSIS
18.9.3 PRODUCT PORTFOLIO
18.9.4 RECENT DEVELOPMENTS
18.1 ALVOGEN (2021)
18.10.1 COMPANY SNAPSHOT
18.10.2 PRODUCT PORTFOLIO
18.10.3 RECENT DEVELOPMENTS
18.11 ADAMIS PHARMACEUTICALS CORPORATION (2021)
18.11.1 COMPANY SNAPSHOT
18.11.2 REVENUE ANALYSIS
18.11.3 PRODUCT PORTFOLIO
18.11.4 RECENT DEVELOPMENTS
18.12 ACCORD HEALTHCARE (A SUBSIDIARY OF INTAS PHARMACEUTICALS)
18.12.1 COMPANY SNAPSHOT
18.12.2 PRODUCT PORTFOLIO
18.12.3 RECENT DEVELOPMENTS
18.13 AMNEAL PHARMACEUTICALS LLC (2021)
18.13.1 COMPANY SNAPSHOT
18.13.2 REVENUE ANALYSIS
18.13.3 PRODUCT PORTFOLIO
18.13.4 RECENT DEVELOPMENTS
18.14 AMERICAN ADDICTION CENTERS (2021)
18.14.1 COMPANY SNAPSHOT
18.14.2 PRODUCT PORTFOLIO
18.14.3 RECENT DEVELOPMENTS
18.15 HIKMA PHARMACEUTICALS PLC (2021)
18.15.1 COMPANY SNAPSHOT
18.15.2 REVENUE ANALYSIS
18.15.3 PRODUCT PORTFOLIO
18.15.4 RECENT DEVELOPMENTS
18.16 LANNETT (2021)
18.16.1 COMPANY SNAPSHOT
18.16.2 REVENUE ANALYSIS
18.16.3 PRODUCT PORTFOLIO
18.16.4 RECENT DEVELOPMENT
18.17 MALLINCKRODT (2021)
18.17.1 COMPANY SNAPSHOT
18.17.2 REVENUE ANALYSIS
18.17.3 PRODUCT PORTFOLIO
18.17.4 RECENT DEVELOPMENT
18.18 OREXO US INC (A SUBSIDIARY OF OREXO, INC) (2021)
18.18.1 COMPANY SNAPSHOT
18.18.2 REVENUE ANALYSIS
18.18.3 PRODUCT PORTFOLIO
18.18.4 RECENT DEVELOPMENT
18.19 PINNACLE TREATMENT CENTERS
18.19.1 COMPANY SNAPSHOT
18.19.2 PRODUCT PORTFOLIO
18.19.3 RECENT DEVELOPMENT
18.2 RECOVERY CENTERS OF AMERICA
18.20.1 COMPANY SNAPSHOT
18.20.2 PRODUCT PORTFOLIO
18.20.3 RECENT DEVELOPMENTS
18.21 TAJ PHARMACEUTICALS LIMITED
18.21.1 COMPANY SNAPSHOT
18.21.2 PRODUCT PORTFOLIO
18.21.3 RECENT DEVELOPMENTS
18.22 TITAN PHARMACEUTICALS (2021)
18.22.1 COMPANY SNAPSHOT
18.22.2 REVENUE ANALYSIS
18.22.3 PRODUCT PORTFOLIO
18.22.4 RECENT DEVELOPMENTS
18.23 VISTAPHARM, INC (A SUBSIDIARY OF VERTICE PHARMA, LLC. (2021))
18.23.1 COMPANY SNAPSHOT
18.23.2 PRODUCT PORTFOLIO
18.23.3 RECENT DEVELOPMENTS
19 QUESTIONNAIRE
20 RELATED REPORTS
Lista de Tablas
TABLE 1 ASIA PACIFIC MEDICATION-ASSISTED TREATMENT (MAT) MARKET, BY TYPE, 2020-2029 (USD MILLION)
TABLE 2 ASIA PACIFIC MEDICATION IN MEDICATION-ASSISTED TREATMENT (MAT) MARKET, BY REGION, 2020-2029 (USD MILLION)
TABLE 3 ASIA PACIFIC MEDICATION IN MEDICATION-ASSISTED TREATMENT (MAT) MARKET, BY TYPE, 2020-2029 (USD MILLION)
TABLE 4 ASIA PACIFIC OPIOID DEPENDENCY MEDICATION IN MEDICATION-ASSISTED TREATMENT (MAT) MARKET, BY TYPE, 2020-2029 (USD MILLION)
TABLE 5 ASIA PACIFIC ALCOHOL USE DISORDER MEDICATIONS IN MEDICATION-ASSISTED TREATMENT (MAT) MARKET, BY TYPE, 2020-2029 (USD MILLION)
TABLE 6 ASIA PACIFIC OPIOID OVERDOSE PREVENTION MEDICATION IN MEDICATION-ASSISTED TREATMENT (MAT) MARKET, BY TYPE, 2020-2029 (USD MILLION)
TABLE 7 ASIA PACIFIC THERAPY IN MEDICATION-ASSISTED TREATMENT (MAT) MARKET, BY REGION, 2020-2029 (USD MILLION)
TABLE 8 ASIA PACIFIC THERAPY IN MEDICATION-ASSISTED TREATMENT (MAT) MARKET, BY TYPE, 2020-2029 (USD MILLION)
TABLE 9 ASIA PACIFIC MEDICATION-ASSISTED TREATMENT (MAT) MARKET, BY PRODUCTS, 2020-2029 (USD MILLION)
TABLE 10 ASIA PACIFIC BUPRENORPHINE AND NALOXONE IN MEDICATION-ASSISTED TREATMENT (MAT) MARKET, BY REGION, 2020-2029 (USD MILLION)
TABLE 11 ASIA PACIFIC NALTREXONE IN MEDICATION-ASSISTED TREATMENT (MAT) MARKET, BY REGION, 2020-2029 (USD MILLION)
TABLE 12 ASIA PACIFIC BUPRENORPHINE IN MEDICATION-ASSISTED TREATMENT (MAT) MARKET, BY REGION, 2020-2029 (USD MILLION)
TABLE 13 ASIA PACIFIC METHADONE IN MEDICATION-ASSISTED TREATMENT (MAT) MARKET, BY REGION, 2020-2029 (USD MILLION)
TABLE 14 ASIA PACIFIC NALOXONE IN MEDICATION-ASSISTED TREATMENT (MAT) MARKET, BY REGION, 2020-2029 (USD MILLION)
TABLE 15 ASIA PACIFIC DISULFIRAM IN MEDICATION-ASSISTED TREATMENT (MAT) MARKET, BY REGION, 2020-2029 (USD MILLION)
TABLE 16 ASIA PACIFIC ACAMPROSATE IN MEDICATION-ASSISTED TREATMENT (MAT) MARKET, BY REGION, 2020-2029 (USD MILLION)
TABLE 17 ASIA PACIFIC MEDICATION-ASSISTED TREATMENT (MAT) MARKET, BY DRUG TYPE, 2020-2029 (USD MILLION)
TABLE 18 ASIA PACIFIC GENERICS IN MEDICATION-ASSISTED TREATMENT (MAT) MARKET, BY REGION, 2020-2029 (USD MILLION)
TABLE 19 ASIA PACIFIC BRANDED IN MEDICATION-ASSISTED TREATMENT (MAT) MARKET, BY REGION, 2020-2029 (USD MILLION)
TABLE 20 ASIA PACIFIC BRANDED IN MEDICATION-ASSISTED TREATMENT (MAT) MARKET, BY DRUG TYPE, 2020-2029 (USD MILLION)
TABLE 21 ASIA PACIFIC MEDICATION-ASSISTED TREATMENT (MAT) MARKET, BY DOSAGE FORM, 2020-2029 (USD MILLION)
TABLE 22 ASIA PACIFIC IMMEDIATE RELEASE IN MEDICATION-ASSISTED TREATMENT (MAT) MARKET, BY REGION, 2020-2029 (USD MILLION)
TABLE 23 ASIA PACIFIC EXTENDED RELEASE IN MEDICATION-ASSISTED TREATMENT (MAT) MARKET, BY REGION, 2020-2029 (USD MILLION)
TABLE 24 ASIA PACIFIC MEDICATION-ASSISTED TREATMENT (MAT) MARKET, BY ROUTE OF ADMINISTRATION, 2020-2029 (USD MILLION)
TABLE 25 ASIA PACIFIC ORAL IN MEDICATION-ASSISTED TREATMENT (MAT) MARKET, BY REGION, 2020-2029 (USD MILLION)
TABLE 26 ASIA PACIFIC ORAL IN MEDICATION-ASSISTED TREATMENT (MAT) MARKET, BY ROUTE OF ADMINISTRATION, 2020-2029 (USD MILLION)
TABLE 27 ASIA PACIFIC PARENTERAL IN MEDICATION-ASSISTED TREATMENT (MAT) MARKET, BY REGION, 2020-2029 (USD MILLION)
TABLE 28 ASIA PACIFIC PARENTERAL IN MEDICATION-ASSISTED TREATMENT (MAT) MARKET, BY ROUTE OF ADMINISTRATION, 2020-2029 (USD MILLION)
TABLE 29 ASIA PACIFIC OTHERS IN MEDICATION-ASSISTED TREATMENT (MAT) MARKET, BY REGION, 2020-2029 (USD MILLION)
TABLE 30 ASIA PACIFIC MEDICATION-ASSISTED TREATMENT (MAT) MARKET, BY POPULATION TYPE, 2020-2029 (USD MILLION)
TABLE 31 ASIA PACIFIC ADULTS IN MEDICATION-ASSISTED TREATMENT (MAT) MARKET, BY REGION, 2020-2029 (USD MILLION)
TABLE 32 ASIA PACIFIC TEENAGE IN MEDICATION-ASSISTED TREATMENT (MAT) MARKET, BY REGION, 2020-2029 (USD MILLION)
TABLE 33 ASIA PACIFIC MEDICATION-ASSISTED TREATMENT (MAT) MARKET, BY END USER, 2020-2029 (USD MILLION)
TABLE 34 ASIA PACIFIC REHABILITATION CLINICS IN MEDICATION-ASSISTED TREATMENT (MAT) MARKET, BY REGION, 2020-2029 (USD MILLION)
TABLE 35 ASIA PACIFIC HOSPITALS IN MEDICATION-ASSISTED TREATMENT (MAT) MARKET, BY REGION, 2020-2029 (USD MILLION)
TABLE 36 ASIA PACIFIC SPECIALTY CENTERS IN MEDICATION-ASSISTED TREATMENT (MAT) MARKET, BY REGION, 2020-2029 (USD MILLION)
TABLE 37 ASIA PACIFIC HOMECARE IN MEDICATION-ASSISTED TREATMENT (MAT) MARKET, BY REGION, 2020-2029 (USD MILLION)
TABLE 38 ASIA PACIFIC OTHERS IN MEDICATION-ASSISTED TREATMENT (MAT) MARKET, BY REGION, 2020-2029 (USD MILLION)
TABLE 39 ASIA PACIFIC MEDICATION-ASSISTED TREATMENT (MAT) MARKET, BY DISTRIBUTION CHANNEL, 2020-2029 (USD MILLION)
TABLE 40 ASIA PACIFIC HOSPITAL PHARMACY IN MEDICATION-ASSISTED TREATMENT (MAT) MARKET, BY REGION, 2020-2029 (USD MILLION)
TABLE 41 ASIA PACIFIC DIRECT TENDER IN MEDICATION-ASSISTED TREATMENT (MAT) MARKET, BY REGION, 2020-2029 (USD MILLION)
TABLE 42 ASIA PACIFIC RETAIL PHARMACY IN MEDICATION-ASSISTED TREATMENT (MAT) MARKET, BY REGION, 2020-2029 (USD MILLION)
TABLE 43 ASIA PACIFIC ONLINE PHARMACY IN MEDICATION-ASSISTED TREATMENT (MAT) MARKET, BY REGION, 2020-2029 (USD MILLION)
TABLE 44 ASIA PACIFIC OTHERS IN MEDICATION-ASSISTED TREATMENT (MAT) MARKET, BY REGION, 2020-2029 (USD MILLION)
TABLE 45 ASIA-PACIFIC MEDICATION-ASSISTED TREATMENT (MAT) MARKET, BY COUNTRY, 2020-2029 (USD MILLION)
TABLE 46 ASIA-PACIFIC MEDICATION-ASSISTED TREATMENT (MAT) MARKET, BY TYPE, 2020-2029 (USD MILLION)
TABLE 47 ASIA-PACIFIC MEDICATION IN MEDICATION-ASSISTED TREATMENT (MAT) MARKET, BY TYPE, 2020-2029 (USD MILLION)
TABLE 48 ASIA-PACIFIC OPIOID DEPENDENCY MEDICATION IN MEDICATION-ASSISTED TREATMENT (MAT) MARKET, BY TYPE, 2020-2029 (USD MILLION)
TABLE 49 ASIA-PACIFIC ALCOHOL USE DISORDER MEDICATIONS IN MEDICATION-ASSISTED TREATMENT (MAT) MARKET, BY TYPE, 2020-2029 (USD MILLION)
TABLE 50 ASIA-PACIFIC OPIOID OVERDOSE PREVENTION MEDICATION IN MEDICATION-ASSISTED TREATMENT (MAT) MARKET, BY TYPE, 2020-2029 (USD MILLION)
TABLE 51 ASIA-PACIFIC THERAPY IN MEDICATION-ASSISTED TREATMENT (MAT) MARKET, BY TYPE, 2020-2029 (USD MILLION)
TABLE 52 ASIA-PACIFIC MEDICATION-ASSISTED TREATMENT (MAT) MARKET, BY PRODUCTS, 2020-2029 (USD MILLION)
TABLE 53 ASIA-PACIFIC MEDICATION-ASSISTED TREATMENT (MAT) MARKET, BY DRUG TYPE, 2020-2029 (USD MILLION)
TABLE 54 ASIA-PACIFIC BRANDED IN MEDICATION-ASSISTED TREATMENT (MAT) MARKET, BY DRUG TYPE, 2020-2029 (USD MILLION)
TABLE 55 ASIA-PACIFIC MEDICATION-ASSISTED TREATMENT (MAT) MARKET, BY DOSAGE FORM, 2020-2029 (USD MILLION)
TABLE 56 ASIA-PACIFIC MEDICATION-ASSISTED TREATMENT (MAT) MARKET, BY ROUTE OF ADMINISTRATION, 2020-2029 (USD MILLION)
TABLE 57 ASIA-PACIFIC ORAL IN MEDICATION-ASSISTED TREATMENT (MAT) MARKET, BY ROUTE OF ADMINISTRATION, 2020-2029 (USD MILLION)
TABLE 58 ASIA-PACIFIC PARENTERAL IN MEDICATION-ASSISTED TREATMENT (MAT) MARKET, BY ROUTE OF ADMINISTRATION, 2020-2029 (USD MILLION)
TABLE 59 ASIA-PACIFIC MEDICATION-ASSISTED TREATMENT (MAT) MARKET, BY POPULATION TYPE, 2020-2029 (USD MILLION)
TABLE 60 ASIA-PACIFIC MEDICATION-ASSISTED TREATMENT (MAT) MARKET, BY END USER, 2020-2029 (USD MILLION)
TABLE 61 ASIA-PACIFIC MEDICATION-ASSISTED TREATMENT (MAT) MARKET, BY DISTRIBUTION CHANNEL, 2020-2029 (USD MILLION)
TABLE 62 CHINA MEDICATION-ASSISTED TREATMENT (MAT) MARKET, BY TYPE, 2020-2029 (USD MILLION)
TABLE 63 CHINA MEDICATION IN MEDICATION-ASSISTED TREATMENT (MAT) MARKET, BY TYPE, 2020-2029 (USD MILLION)
TABLE 64 CHINA OPIOID DEPENDENCY MEDICATION IN MEDICATION-ASSISTED TREATMENT (MAT) MARKET, BY TYPE, 2020-2029 (USD MILLION)
TABLE 65 CHINA ALCOHOL USE DISORDER MEDICATIONS IN MEDICATION-ASSISTED TREATMENT (MAT) MARKET, BY TYPE, 2020-2029 (USD MILLION)
TABLE 66 CHINA OPIOID OVERDOSE PREVENTION MEDICATION IN MEDICATION-ASSISTED TREATMENT (MAT) MARKET, BY TYPE, 2020-2029 (USD MILLION)
TABLE 67 CHINA THERAPY IN MEDICATION-ASSISTED TREATMENT (MAT) MARKET, BY TYPE, 2020-2029 (USD MILLION)
TABLE 68 CHINA MEDICATION-ASSISTED TREATMENT (MAT) MARKET, BY PRODUCTS, 2020-2029 (USD MILLION)
TABLE 69 CHINA MEDICATION-ASSISTED TREATMENT (MAT) MARKET, BY DRUG TYPE, 2020-2029 (USD MILLION)
TABLE 70 CHINA BRANDED IN MEDICATION-ASSISTED TREATMENT (MAT) MARKET, BY DRUG TYPE, 2020-2029 (USD MILLION)
TABLE 71 CHINA MEDICATION-ASSISTED TREATMENT (MAT) MARKET, BY DOSAGE FORM, 2020-2029 (USD MILLION)
TABLE 72 CHINA MEDICATION-ASSISTED TREATMENT (MAT) MARKET, BY ROUTE OF ADMINISTRATION, 2020-2029 (USD MILLION)
TABLE 73 CHINA ORAL IN MEDICATION-ASSISTED TREATMENT (MAT) MARKET, BY ROUTE OF ADMINISTRATION, 2020-2029 (USD MILLION)
TABLE 74 CHINA PARENTERAL IN MEDICATION-ASSISTED TREATMENT (MAT) MARKET, BY ROUTE OF ADMINISTRATION, 2020-2029 (USD MILLION)
TABLE 75 CHINA MEDICATION-ASSISTED TREATMENT (MAT) MARKET, BY POPULATION TYPE, 2020-2029 (USD MILLION)
TABLE 76 CHINA MEDICATION-ASSISTED TREATMENT (MAT) MARKET, BY END USER, 2020-2029 (USD MILLION)
TABLE 77 CHINA MEDICATION-ASSISTED TREATMENT (MAT) MARKET, BY DISTRIBUTION CHANNEL, 2020-2029 (USD MILLION)
TABLE 78 JAPAN MEDICATION-ASSISTED TREATMENT (MAT) MARKET, BY TYPE, 2020-2029 (USD MILLION)
TABLE 79 JAPAN MEDICATION IN MEDICATION-ASSISTED TREATMENT (MAT) MARKET, BY TYPE, 2020-2029 (USD MILLION)
TABLE 80 JAPAN OPIOID DEPENDENCY MEDICATION IN MEDICATION-ASSISTED TREATMENT (MAT) MARKET, BY TYPE, 2020-2029 (USD MILLION)
TABLE 81 JAPAN ALCOHOL USE DISORDER MEDICATIONS IN MEDICATION-ASSISTED TREATMENT (MAT) MARKET, BY TYPE, 2020-2029 (USD MILLION)
TABLE 82 JAPAN OPIOID OVERDOSE PREVENTION MEDICATION IN MEDICATION-ASSISTED TREATMENT (MAT) MARKET, BY TYPE, 2020-2029 (USD MILLION)
TABLE 83 JAPAN THERAPY IN MEDICATION-ASSISTED TREATMENT (MAT) MARKET, BY TYPE, 2020-2029 (USD MILLION)
TABLE 84 JAPAN MEDICATION-ASSISTED TREATMENT (MAT) MARKET, BY PRODUCTS, 2020-2029 (USD MILLION)
TABLE 85 JAPAN MEDICATION-ASSISTED TREATMENT (MAT) MARKET, BY DRUG TYPE, 2020-2029 (USD MILLION)
TABLE 86 JAPAN MEDICATION-ASSISTED TREATMENT (MAT) MARKET, BY DOSAGE FORM, 2020-2029 (USD MILLION)
TABLE 87 JAPAN MEDICATION-ASSISTED TREATMENT (MAT) MARKET, BY ROUTE OF ADMINISTRATION, 2020-2029 (USD MILLION)
TABLE 88 JAPAN ORAL IN MEDICATION-ASSISTED TREATMENT (MAT) MARKET, BY ROUTE OF ADMINISTRATION, 2020-2029 (USD MILLION)
TABLE 89 JAPAN PARENTERAL IN MEDICATION-ASSISTED TREATMENT (MAT) MARKET, BY ROUTE OF ADMINISTRATION, 2020-2029 (USD MILLION)
TABLE 90 JAPAN MEDICATION-ASSISTED TREATMENT (MAT) MARKET, BY POPULATION TYPE, 2020-2029 (USD MILLION)
TABLE 91 JAPAN MEDICATION-ASSISTED TREATMENT (MAT) MARKET, BY END USER, 2020-2029 (USD MILLION)
TABLE 92 JAPAN MEDICATION-ASSISTED TREATMENT (MAT) MARKET, BY DISTRIBUTION CHANNEL, 2020-2029 (USD MILLION)
TABLE 93 INDIA MEDICATION-ASSISTED TREATMENT (MAT) MARKET, BY TYPE, 2020-2029 (USD MILLION)
TABLE 94 INDIA MEDICATION IN MEDICATION-ASSISTED TREATMENT (MAT) MARKET, BY TYPE, 2020-2029 (USD MILLION)
TABLE 95 INDIA OPIOID DEPENDENCY MEDICATION IN MEDICATION-ASSISTED TREATMENT (MAT) MARKET, BY TYPE, 2020-2029 (USD MILLION)
TABLE 96 INDIA ALCOHOL USE DISORDER MEDICATIONS IN MEDICATION-ASSISTED TREATMENT (MAT) MARKET, BY TYPE, 2020-2029 (USD MILLION)
TABLE 97 INDIA OPIOID OVERDOSE PREVENTION MEDICATION IN MEDICATION-ASSISTED TREATMENT (MAT) MARKET, BY TYPE, 2020-2029 (USD MILLION)
TABLE 98 INDIA THERAPY IN MEDICATION-ASSISTED TREATMENT (MAT) MARKET, BY TYPE, 2020-2029 (USD MILLION)
TABLE 99 INDIA MEDICATION-ASSISTED TREATMENT (MAT) MARKET, BY PRODUCTS, 2020-2029 (USD MILLION)
TABLE 100 INDIA MEDICATION-ASSISTED TREATMENT (MAT) MARKET, BY DRUG TYPE, 2020-2029 (USD MILLION)
TABLE 101 INDIA MEDICATION-ASSISTED TREATMENT (MAT) MARKET, BY DOSAGE FORM, 2020-2029 (USD MILLION)
TABLE 102 INDIA MEDICATION-ASSISTED TREATMENT (MAT) MARKET, BY ROUTE OF ADMINISTRATION, 2020-2029 (USD MILLION)
TABLE 103 INDIA ORAL IN MEDICATION-ASSISTED TREATMENT (MAT) MARKET, BY ROUTE OF ADMINISTRATION, 2020-2029 (USD MILLION)
TABLE 104 INDIA PARENTERAL IN MEDICATION-ASSISTED TREATMENT (MAT) MARKET, BY ROUTE OF ADMINISTRATION, 2020-2029 (USD MILLION)
TABLE 105 INDIA MEDICATION-ASSISTED TREATMENT (MAT) MARKET, BY POPULATION TYPE, 2020-2029 (USD MILLION)
TABLE 106 INDIA MEDICATION-ASSISTED TREATMENT (MAT) MARKET, BY END USER, 2020-2029 (USD MILLION)
TABLE 107 INDIA MEDICATION-ASSISTED TREATMENT (MAT) MARKET, BY DISTRIBUTION CHANNEL, 2020-2029 (USD MILLION)
TABLE 108 AUSTRALIA MEDICATION-ASSISTED TREATMENT (MAT) MARKET, BY TYPE, 2020-2029 (USD MILLION)
TABLE 109 AUSTRALIA MEDICATION IN MEDICATION-ASSISTED TREATMENT (MAT) MARKET, BY TYPE, 2020-2029 (USD MILLION)
TABLE 110 AUSTRALIA OPIOID DEPENDENCY MEDICATION IN MEDICATION-ASSISTED TREATMENT (MAT) MARKET, BY TYPE, 2020-2029 (USD MILLION)
TABLE 111 AUSTRALIA ALCOHOL USE DISORDER MEDICATIONS IN MEDICATION-ASSISTED TREATMENT (MAT) MARKET, BY TYPE, 2020-2029 (USD MILLION)
TABLE 112 AUSTRALIA OPIOID OVERDOSE PREVENTION MEDICATION IN MEDICATION-ASSISTED TREATMENT (MAT) MARKET, BY TYPE, 2020-2029 (USD MILLION)
TABLE 113 AUSTRALIA THERAPY IN MEDICATION-ASSISTED TREATMENT (MAT) MARKET, BY TYPE, 2020-2029 (USD MILLION)
TABLE 114 AUSTRALIA MEDICATION-ASSISTED TREATMENT (MAT) MARKET, BY PRODUCTS, 2020-2029 (USD MILLION)
TABLE 115 AUSTRALIA MEDICATION-ASSISTED TREATMENT (MAT) MARKET, BY DRUG TYPE, 2020-2029 (USD MILLION)
TABLE 116 AUSTRALIA BRANDED IN MEDICATION-ASSISTED TREATMENT (MAT) MARKET, BY DRUG TYPE, 2020-2029 (USD MILLION)
TABLE 117 AUSTRALIA MEDICATION-ASSISTED TREATMENT (MAT) MARKET, BY DOSAGE FORM, 2020-2029 (USD MILLION)
TABLE 118 AUSTRALIA MEDICATION-ASSISTED TREATMENT (MAT) MARKET, BY ROUTE OF ADMINISTRATION, 2020-2029 (USD MILLION)
TABLE 119 AUSTRALIA ORAL IN MEDICATION-ASSISTED TREATMENT (MAT) MARKET, BY ROUTE OF ADMINISTRATION, 2020-2029 (USD MILLION)
TABLE 120 AUSTRALIA PARENTERAL IN MEDICATION-ASSISTED TREATMENT (MAT) MARKET, BY ROUTE OF ADMINISTRATION, 2020-2029 (USD MILLION)
TABLE 121 AUSTRALIA MEDICATION-ASSISTED TREATMENT (MAT) MARKET, BY POPULATION TYPE, 2020-2029 (USD MILLION)
TABLE 122 AUSTRALIA MEDICATION-ASSISTED TREATMENT (MAT) MARKET, BY END USER, 2020-2029 (USD MILLION)
TABLE 123 AUSTRALIA MEDICATION-ASSISTED TREATMENT (MAT) MARKET, BY DISTRIBUTION CHANNEL, 2020-2029 (USD MILLION)
TABLE 124 SOUTH KOREA MEDICATION-ASSISTED TREATMENT (MAT) MARKET, BY TYPE, 2020-2029 (USD MILLION)
TABLE 125 SOUTH KOREA MEDICATION IN MEDICATION-ASSISTED TREATMENT (MAT) MARKET, BY TYPE, 2020-2029 (USD MILLION)
TABLE 126 SOUTH KOREA OPIOID DEPENDENCY MEDICATION IN MEDICATION-ASSISTED TREATMENT (MAT) MARKET, BY TYPE, 2020-2029 (USD MILLION)
TABLE 127 SOUTH KOREA ALCOHOL USE DISORDER MEDICATIONS IN MEDICATION-ASSISTED TREATMENT (MAT) MARKET, BY TYPE, 2020-2029 (USD MILLION)
TABLE 128 SOUTH KOREA OPIOID OVERDOSE PREVENTION MEDICATION IN MEDICATION-ASSISTED TREATMENT (MAT) MARKET, BY TYPE, 2020-2029 (USD MILLION)
TABLE 129 SOUTH KOREA THERAPY IN MEDICATION-ASSISTED TREATMENT (MAT) MARKET, BY TYPE, 2020-2029 (USD MILLION)
TABLE 130 SOUTH KOREA MEDICATION-ASSISTED TREATMENT (MAT) MARKET, BY PRODUCTS, 2020-2029 (USD MILLION)
TABLE 131 SOUTH KOREA MEDICATION-ASSISTED TREATMENT (MAT) MARKET, BY DRUG TYPE, 2020-2029 (USD MILLION)
TABLE 132 SOUTH KOREA MEDICATION-ASSISTED TREATMENT (MAT) MARKET, BY DOSAGE FORM, 2020-2029 (USD MILLION)
TABLE 133 SOUTH KOREA MEDICATION-ASSISTED TREATMENT (MAT) MARKET, BY ROUTE OF ADMINISTRATION, 2020-2029 (USD MILLION)
TABLE 134 SOUTH KOREA ORAL IN MEDICATION-ASSISTED TREATMENT (MAT) MARKET, BY ROUTE OF ADMINISTRATION, 2020-2029 (USD MILLION)
TABLE 135 SOUTH KOREA PARENTERAL IN MEDICATION-ASSISTED TREATMENT (MAT) MARKET, BY ROUTE OF ADMINISTRATION, 2020-2029 (USD MILLION)
TABLE 136 SOUTH KOREA MEDICATION-ASSISTED TREATMENT (MAT) MARKET, BY POPULATION TYPE, 2020-2029 (USD MILLION)
TABLE 137 SOUTH KOREA MEDICATION-ASSISTED TREATMENT (MAT) MARKET, BY END USER, 2020-2029 (USD MILLION)
TABLE 138 SOUTH KOREA MEDICATION-ASSISTED TREATMENT (MAT) MARKET, BY DISTRIBUTION CHANNEL, 2020-2029 (USD MILLION)
TABLE 139 SINGAPORE MEDICATION-ASSISTED TREATMENT (MAT) MARKET, BY TYPE, 2020-2029 (USD MILLION)
TABLE 140 SINGAPORE MEDICATION IN MEDICATION-ASSISTED TREATMENT (MAT) MARKET, BY TYPE, 2020-2029 (USD MILLION)
TABLE 141 SINGAPORE OPIOID DEPENDENCY MEDICATION IN MEDICATION-ASSISTED TREATMENT (MAT) MARKET, BY TYPE, 2020-2029 (USD MILLION)
TABLE 142 SINGAPORE ALCOHOL USE DISORDER MEDICATIONS IN MEDICATION-ASSISTED TREATMENT (MAT) MARKET, BY TYPE, 2020-2029 (USD MILLION)
TABLE 143 SINGAPORE OPIOID OVERDOSE PREVENTION MEDICATION IN MEDICATION-ASSISTED TREATMENT (MAT) MARKET, BY TYPE, 2020-2029 (USD MILLION)
TABLE 144 SINGAPORE THERAPY IN MEDICATION-ASSISTED TREATMENT (MAT) MARKET, BY TYPE, 2020-2029 (USD MILLION)
TABLE 145 SINGAPORE MEDICATION-ASSISTED TREATMENT (MAT) MARKET, BY PRODUCTS, 2020-2029 (USD MILLION)
TABLE 146 SINGAPORE MEDICATION-ASSISTED TREATMENT (MAT) MARKET, BY DRUG TYPE, 2020-2029 (USD MILLION)
TABLE 147 SINGAPORE MEDICATION-ASSISTED TREATMENT (MAT) MARKET, BY DOSAGE FORM, 2020-2029 (USD MILLION)
TABLE 148 SINGAPORE MEDICATION-ASSISTED TREATMENT (MAT) MARKET, BY ROUTE OF ADMINISTRATION, 2020-2029 (USD MILLION)
TABLE 149 SINGAPORE ORAL IN MEDICATION-ASSISTED TREATMENT (MAT) MARKET, BY ROUTE OF ADMINISTRATION, 2020-2029 (USD MILLION)
TABLE 150 SINGAPORE PARENTERAL IN MEDICATION-ASSISTED TREATMENT (MAT) MARKET, BY ROUTE OF ADMINISTRATION, 2020-2029 (USD MILLION)
TABLE 151 SINGAPORE MEDICATION-ASSISTED TREATMENT (MAT) MARKET, BY POPULATION TYPE, 2020-2029 (USD MILLION)
TABLE 152 SINGAPORE MEDICATION-ASSISTED TREATMENT (MAT) MARKET, BY END USER, 2020-2029 (USD MILLION)
TABLE 153 SINGAPORE MEDICATION-ASSISTED TREATMENT (MAT) MARKET, BY DISTRIBUTION CHANNEL, 2020-2029 (USD MILLION)
TABLE 154 MALAYSIA MEDICATION-ASSISTED TREATMENT (MAT) MARKET, BY TYPE, 2020-2029 (USD MILLION)
TABLE 155 MALAYSIA MEDICATION IN MEDICATION-ASSISTED TREATMENT (MAT) MARKET, BY TYPE, 2020-2029 (USD MILLION)
TABLE 156 MALAYSIA OPIOID DEPENDENCY MEDICATION IN MEDICATION-ASSISTED TREATMENT (MAT) MARKET, BY TYPE, 2020-2029 (USD MILLION)
TABLE 157 MALAYSIA ALCOHOL USE DISORDER MEDICATIONS IN MEDICATION-ASSISTED TREATMENT (MAT) MARKET, BY TYPE, 2020-2029 (USD MILLION)
TABLE 158 MALAYSIA OPIOID OVERDOSE PREVENTION MEDICATION IN MEDICATION-ASSISTED TREATMENT (MAT) MARKET, BY TYPE, 2020-2029 (USD MILLION)
TABLE 159 MALAYSIA THERAPY IN MEDICATION-ASSISTED TREATMENT (MAT) MARKET, BY TYPE, 2020-2029 (USD MILLION)
TABLE 160 MALAYSIA MEDICATION-ASSISTED TREATMENT (MAT) MARKET, BY PRODUCTS, 2020-2029 (USD MILLION)
TABLE 161 MALAYSIA MEDICATION-ASSISTED TREATMENT (MAT) MARKET, BY DRUG TYPE, 2020-2029 (USD MILLION)
TABLE 162 MALAYSIA BRANDED IN MEDICATION-ASSISTED TREATMENT (MAT) MARKET, BY DRUG TYPE, 2020-2029 (USD MILLION)
TABLE 163 MALAYSIA MEDICATION-ASSISTED TREATMENT (MAT) MARKET, BY DOSAGE FORM, 2020-2029 (USD MILLION)
TABLE 164 MALAYSIA MEDICATION-ASSISTED TREATMENT (MAT) MARKET, BY ROUTE OF ADMINISTRATION, 2020-2029 (USD MILLION)
TABLE 165 MALAYSIA ORAL IN MEDICATION-ASSISTED TREATMENT (MAT) MARKET, BY ROUTE OF ADMINISTRATION, 2020-2029 (USD MILLION)
TABLE 166 MALAYSIA PARENTERAL IN MEDICATION-ASSISTED TREATMENT (MAT) MARKET, BY ROUTE OF ADMINISTRATION, 2020-2029 (USD MILLION)
TABLE 167 MALAYSIA MEDICATION-ASSISTED TREATMENT (MAT) MARKET, BY POPULATION TYPE, 2020-2029 (USD MILLION)
TABLE 168 MALAYSIA MEDICATION-ASSISTED TREATMENT (MAT) MARKET, BY END USER, 2020-2029 (USD MILLION)
TABLE 169 MALAYSIA MEDICATION-ASSISTED TREATMENT (MAT) MARKET, BY DISTRIBUTION CHANNEL, 2020-2029 (USD MILLION)
TABLE 170 THAILAND MEDICATION-ASSISTED TREATMENT (MAT) MARKET, BY TYPE, 2020-2029 (USD MILLION)
TABLE 171 THAILAND MEDICATION IN MEDICATION-ASSISTED TREATMENT (MAT) MARKET, BY TYPE, 2020-2029 (USD MILLION)
TABLE 172 THAILAND OPIOID DEPENDENCY MEDICATION IN MEDICATION-ASSISTED TREATMENT (MAT) MARKET, BY TYPE, 2020-2029 (USD MILLION)
TABLE 173 THAILAND ALCOHOL USE DISORDER MEDICATIONS IN MEDICATION-ASSISTED TREATMENT (MAT) MARKET, BY TYPE, 2020-2029 (USD MILLION)
TABLE 174 THAILAND OPIOID OVERDOSE PREVENTION MEDICATION IN MEDICATION-ASSISTED TREATMENT (MAT) MARKET, BY TYPE, 2020-2029 (USD MILLION)
TABLE 175 THAILAND THERAPY IN MEDICATION-ASSISTED TREATMENT (MAT) MARKET, BY TYPE, 2020-2029 (USD MILLION)
TABLE 176 THAILAND MEDICATION-ASSISTED TREATMENT (MAT) MARKET, BY PRODUCTS, 2020-2029 (USD MILLION)
TABLE 177 THAILAND MEDICATION-ASSISTED TREATMENT (MAT) MARKET, BY DRUG TYPE, 2020-2029 (USD MILLION)
TABLE 178 THAILAND MEDICATION-ASSISTED TREATMENT (MAT) MARKET, BY DOSAGE FORM, 2020-2029 (USD MILLION)
TABLE 179 THAILAND MEDICATION-ASSISTED TREATMENT (MAT) MARKET, BY ROUTE OF ADMINISTRATION, 2020-2029 (USD MILLION)
TABLE 180 THAILAND ORAL IN MEDICATION-ASSISTED TREATMENT (MAT) MARKET, BY ROUTE OF ADMINISTRATION, 2020-2029 (USD MILLION)
TABLE 181 THAILAND PARENTERAL IN MEDICATION-ASSISTED TREATMENT (MAT) MARKET, BY ROUTE OF ADMINISTRATION, 2020-2029 (USD MILLION)
TABLE 182 THAILAND MEDICATION-ASSISTED TREATMENT (MAT) MARKET, BY POPULATION TYPE, 2020-2029 (USD MILLION)
TABLE 183 THAILAND MEDICATION-ASSISTED TREATMENT (MAT) MARKET, BY END USER, 2020-2029 (USD MILLION)
TABLE 184 THAILAND MEDICATION-ASSISTED TREATMENT (MAT) MARKET, BY DISTRIBUTION CHANNEL, 2020-2029 (USD MILLION)
TABLE 185 INDONESIA MEDICATION-ASSISTED TREATMENT (MAT) MARKET, BY TYPE, 2020-2029 (USD MILLION)
TABLE 186 INDONESIA MEDICATION IN MEDICATION-ASSISTED TREATMENT (MAT) MARKET, BY TYPE, 2020-2029 (USD MILLION)
TABLE 187 INDONESIA OPIOID DEPENDENCY MEDICATION IN MEDICATION-ASSISTED TREATMENT (MAT) MARKET, BY TYPE, 2020-2029 (USD MILLION)
TABLE 188 INDONESIA ALCOHOL USE DISORDER MEDICATIONS IN MEDICATION-ASSISTED TREATMENT (MAT) MARKET, BY TYPE, 2020-2029 (USD MILLION)
TABLE 189 INDONESIA OPIOID OVERDOSE PREVENTION MEDICATION IN MEDICATION-ASSISTED TREATMENT (MAT) MARKET, BY TYPE, 2020-2029 (USD MILLION)
TABLE 190 INDONESIA THERAPY IN MEDICATION-ASSISTED TREATMENT (MAT) MARKET, BY TYPE, 2020-2029 (USD MILLION)
TABLE 191 INDONESIA MEDICATION-ASSISTED TREATMENT (MAT) MARKET, BY PRODUCTS, 2020-2029 (USD MILLION)
TABLE 192 INDONESIA MEDICATION-ASSISTED TREATMENT (MAT) MARKET, BY DRUG TYPE, 2020-2029 (USD MILLION)
TABLE 193 INDONESIA BRANDED IN MEDICATION-ASSISTED TREATMENT (MAT) MARKET, BY DRUG TYPE, 2020-2029 (USD MILLION)
TABLE 194 INDONESIA MEDICATION-ASSISTED TREATMENT (MAT) MARKET, BY DOSAGE FORM, 2020-2029 (USD MILLION)
TABLE 195 INDONESIA MEDICATION-ASSISTED TREATMENT (MAT) MARKET, BY ROUTE OF ADMINISTRATION, 2020-2029 (USD MILLION)
TABLE 196 INDONESIA ORAL IN MEDICATION-ASSISTED TREATMENT (MAT) MARKET, BY ROUTE OF ADMINISTRATION, 2020-2029 (USD MILLION)
TABLE 197 INDONESIA PARENTERAL IN MEDICATION-ASSISTED TREATMENT (MAT) MARKET, BY ROUTE OF ADMINISTRATION, 2020-2029 (USD MILLION)
TABLE 198 INDONESIA MEDICATION-ASSISTED TREATMENT (MAT) MARKET, BY POPULATION TYPE, 2020-2029 (USD MILLION)
TABLE 199 INDONESIA MEDICATION-ASSISTED TREATMENT (MAT) MARKET, BY END USER, 2020-2029 (USD MILLION)
TABLE 200 INDONESIA MEDICATION-ASSISTED TREATMENT (MAT) MARKET, BY DISTRIBUTION CHANNEL, 2020-2029 (USD MILLION)
TABLE 201 PHILIPPINES MEDICATION-ASSISTED TREATMENT (MAT) MARKET, BY TYPE, 2020-2029 (USD MILLION)
TABLE 202 PHILIPPINES MEDICATION IN MEDICATION-ASSISTED TREATMENT (MAT) MARKET, BY TYPE, 2020-2029 (USD MILLION)
TABLE 203 PHILIPPINES OPIOID DEPENDENCY MEDICATION IN MEDICATION-ASSISTED TREATMENT (MAT) MARKET, BY TYPE, 2020-2029 (USD MILLION)
TABLE 204 PHILIPPINES ALCOHOL USE DISORDER MEDICATIONS IN MEDICATION-ASSISTED TREATMENT (MAT) MARKET, BY TYPE, 2020-2029 (USD MILLION)
TABLE 205 PHILIPPINES OPIOID OVERDOSE PREVENTION MEDICATION IN MEDICATION-ASSISTED TREATMENT (MAT) MARKET, BY TYPE, 2020-2029 (USD MILLION)
TABLE 206 PHILIPPINES THERAPY IN MEDICATION-ASSISTED TREATMENT (MAT) MARKET, BY TYPE, 2020-2029 (USD MILLION)
TABLE 207 PHILIPPINES MEDICATION-ASSISTED TREATMENT (MAT) MARKET, BY PRODUCTS, 2020-2029 (USD MILLION)
TABLE 208 PHILIPPINES MEDICATION-ASSISTED TREATMENT (MAT) MARKET, BY DRUG TYPE, 2020-2029 (USD MILLION)
TABLE 209 PHILIPPINES MEDICATION-ASSISTED TREATMENT (MAT) MARKET, BY DOSAGE FORM, 2020-2029 (USD MILLION)
TABLE 210 PHILIPPINES MEDICATION-ASSISTED TREATMENT (MAT) MARKET, BY ROUTE OF ADMINISTRATION, 2020-2029 (USD MILLION)
TABLE 211 PHILIPPINES ORAL IN MEDICATION-ASSISTED TREATMENT (MAT) MARKET, BY ROUTE OF ADMINISTRATION, 2020-2029 (USD MILLION)
TABLE 212 PHILIPPINES PARENTERAL IN MEDICATION-ASSISTED TREATMENT (MAT) MARKET, BY ROUTE OF ADMINISTRATION, 2020-2029 (USD MILLION)
TABLE 213 PHILIPPINES MEDICATION-ASSISTED TREATMENT (MAT) MARKET, BY POPULATION TYPE, 2020-2029 (USD MILLION)
TABLE 214 PHILIPPINES MEDICATION-ASSISTED TREATMENT (MAT) MARKET, BY END USER, 2020-2029 (USD MILLION)
TABLE 215 PHILIPPINES MEDICATION-ASSISTED TREATMENT (MAT) MARKET, BY DISTRIBUTION CHANNEL, 2020-2029 (USD MILLION)
TABLE 216 VIETNAM MEDICATION-ASSISTED TREATMENT (MAT) MARKET, BY TYPE, 2020-2029 (USD MILLION)
TABLE 217 VIETNAM MEDICATION IN MEDICATION-ASSISTED TREATMENT (MAT) MARKET, BY TYPE, 2020-2029 (USD MILLION)
TABLE 218 VIETNAM OPIOID DEPENDENCY MEDICATION IN MEDICATION-ASSISTED TREATMENT (MAT) MARKET, BY TYPE, 2020-2029 (USD MILLION)
TABLE 219 VIETNAM ALCOHOL USE DISORDER MEDICATIONS IN MEDICATION-ASSISTED TREATMENT (MAT) MARKET, BY TYPE, 2020-2029 (USD MILLION)
TABLE 220 VIETNAM OPIOID OVERDOSE PREVENTION MEDICATION IN MEDICATION-ASSISTED TREATMENT (MAT) MARKET, BY TYPE, 2020-2029 (USD MILLION)
TABLE 221 VIETNAM THERAPY IN MEDICATION-ASSISTED TREATMENT (MAT) MARKET, BY TYPE, 2020-2029 (USD MILLION)
TABLE 222 VIETNAM MEDICATION-ASSISTED TREATMENT (MAT) MARKET, BY PRODUCTS, 2020-2029 (USD MILLION)
TABLE 223 VIETNAM MEDICATION-ASSISTED TREATMENT (MAT) MARKET, BY DRUG TYPE, 2020-2029 (USD MILLION)
TABLE 224 VIETNAM MEDICATION-ASSISTED TREATMENT (MAT) MARKET, BY DOSAGE FORM, 2020-2029 (USD MILLION)
TABLE 225 VIETNAM MEDICATION-ASSISTED TREATMENT (MAT) MARKET, BY ROUTE OF ADMINISTRATION, 2020-2029 (USD MILLION)
TABLE 226 VIETNAM ORAL IN MEDICATION-ASSISTED TREATMENT (MAT) MARKET, BY ROUTE OF ADMINISTRATION, 2020-2029 (USD MILLION)
TABLE 227 VIETNAM PARENTERAL IN MEDICATION-ASSISTED TREATMENT (MAT) MARKET, BY ROUTE OF ADMINISTRATION, 2020-2029 (USD MILLION)
TABLE 228 VIETNAM MEDICATION-ASSISTED TREATMENT (MAT) MARKET, BY POPULATION TYPE, 2020-2029 (USD MILLION)
TABLE 229 VIETNAM MEDICATION-ASSISTED TREATMENT (MAT) MARKET, BY END USER, 2020-2029 (USD MILLION)
TABLE 230 VIETNAM MEDICATION-ASSISTED TREATMENT (MAT) MARKET, BY DISTRIBUTION CHANNEL, 2020-2029 (USD MILLION)
TABLE 231 REST OF ASIA-PACIFIC MEDICATION-ASSISTED TREATMENT (MAT) MARKET, BY TYPE, 2020-2029 (USD MILLION)
Lista de figuras
FIGURE 1 ASIA PACIFIC MEDICATION-ASSISTED TREATMENT (MAT) MARKET : SEGMENTATION
FIGURE 2 ASIA PACIFIC MEDICATION-ASSISTED TREATMENT (MAT) MARKET: DATA TRIANGULATION
FIGURE 3 ASIA PACIFIC MEDICATION-ASSISTED TREATMENT (MAT) MARKET: DROC ANALYSIS
FIGURE 4 ASIA PACIFIC MEDICATION-ASSISTED TREATMENT (MAT) MARKET: ASIA PACIFIC VS REGIONAL MARKET ANALYSIS
FIGURE 5 ASIA PACIFIC MEDICATION-ASSISTED TREATMENT (MAT) MARKET: COMPANY RESEARCH ANALYSIS
FIGURE 6 ASIA PACIFIC MEDICATION-ASSISTED TREATMENT (MAT) MARKET: INTERVIEW DEMOGRAPHICS
FIGURE 7 ASIA PACIFIC MEDICATION-ASSISTED TREATMENT (MAT) MARKET: DBMR POSITION GRID
FIGURE 8 ASIA PACIFIC MEDICATION-ASSISTED TREATMENT (MAT) MARKET: VENDOR SHARE ANALYSIS
FIGURE 9 ASIA PACIFIC MEDICATION-ASSISTED TREATMENT (MAT) MARKET: END USER COVERAGE GRID
FIGURE 10 ASIA PACIFIC MEDICATION-ASSISTED TREATMENT (MAT) MARKET: SEGMENTATION
FIGURE 11 NORTH AMERICA IS ANTICIPATED TO DOMINATE THE ASIA PACIFIC MEDICATION-ASSISTED TREATMENT (MAT) MARKET AND ASIA-PACIFIC IS ESTIMATED TO BE GROWING WITH THE HIGHEST CAGR IN THE FORECAST PERIOD OF 2022 TO 2029
FIGURE 12 INCREASED INCIDENCE OF ALCOHOL USE DISORDERS AND RISE IN PRODUCT APPROVALS IS EXPECTED TO DRIVE ASIA PACIFIC MEDICATION-ASSISTED TREATMENT (MAT) MARKET FROM 2022 TO 2029
FIGURE 13 TYPE SEGMENT IS EXPECTED TO HAVE THE LARGEST SHARE OF THE ASIA PACIFIC MEDICATION-ASSISTED TREATMENT (MAT) MARKET FROM 2022 & 2029
FIGURE 14 DRIVERS, RESTRAINTS, OPPORTUNITIES, AND CHALLENGES OF THE ASIA PACIFIC MEDICATION-ASSISTED TREATMENT (MAT) MARKET
FIGURE 15 INCIDENCE OF ALCOHOL CONSUMPTION IN 2019
FIGURE 16 ASIA PACIFIC MEDICATION-ASSISTED TREATMENT (MAT) MARKET: BY TYPE, 2021
FIGURE 17 ASIA PACIFIC MEDICATION-ASSISTED TREATMENT (MAT) MARKET: BY TYPE, 2022-2029 (USD MILLION)
FIGURE 18 ASIA PACIFIC MEDICATION-ASSISTED TREATMENT (MAT) MARKET: BY TYPE, CAGR (2022-2029)
FIGURE 19 ASIA PACIFIC MEDICATION-ASSISTED TREATMENT (MAT) MARKET: BY TYPE, LIFELINE CURVE
FIGURE 20 ASIA PACIFIC MEDICATION-ASSISTED TREATMENT (MAT) MARKET: BY PRODUCTS, 2021
FIGURE 21 ASIA PACIFIC MEDICATION-ASSISTED TREATMENT (MAT) MARKET: BY PRODUCTS, 2022-2029 (USD MILLION)
FIGURE 22 ASIA PACIFIC MEDICATION-ASSISTED TREATMENT (MAT) MARKET: BY PRODUCTS, CAGR (2022-2029)
FIGURE 23 ASIA PACIFIC MEDICATION-ASSISTED TREATMENT (MAT) MARKET: BY PRODUCTS, LIFELINE CURVE
FIGURE 24 ASIA PACIFIC MEDICATION-ASSISTED TREATMENT (MAT) MARKET: BY DRUG TYPE, 2021
FIGURE 25 ASIA PACIFIC MEDICATION-ASSISTED TREATMENT (MAT) MARKET: BY DRUG TYPE, 2022-2029 (USD MILLION)
FIGURE 26 ASIA PACIFIC MEDICATION-ASSISTED TREATMENT (MAT) MARKET: BY DRUG TYPE, CAGR (2022-2029)
FIGURE 27 ASIA PACIFIC MEDICATION-ASSISTED TREATMENT (MAT) MARKET: BY DRUG TYPE, LIFELINE CURVE
FIGURE 28 ASIA PACIFIC MEDICATION-ASSISTED TREATMENT (MAT) MARKET: BY DOSAGE FORM, 2021
FIGURE 29 ASIA PACIFIC MEDICATION-ASSISTED TREATMENT (MAT) MARKET: BY DOSAGE FORM, 2022-2029 (USD MILLION)
FIGURE 30 ASIA PACIFIC MEDICATION-ASSISTED TREATMENT (MAT) MARKET: BY DOSAGE FORM, CAGR (2022-2029)
FIGURE 31 ASIA PACIFIC MEDICATION-ASSISTED TREATMENT (MAT) MARKET: BY DOSAGE FORM, LIFELINE CURVE
FIGURE 32 ASIA PACIFIC MEDICATION-ASSISTED TREATMENT (MAT) MARKET: BY ROUTE OF ADMINISTRATION, 2021
FIGURE 33 ASIA PACIFIC MEDICATION-ASSISTED TREATMENT (MAT) MARKET: BY ROUTE OF ADMINISTRATION, 2022-2029 (USD MILLION)
FIGURE 34 ASIA PACIFIC MEDICATION-ASSISTED TREATMENT (MAT) MARKET: BY ROUTE OF ADMINISTRATION, CAGR (2022-2029)
FIGURE 35 ASIA PACIFIC MEDICATION-ASSISTED TREATMENT (MAT) MARKET: BY ROUTE OF ADMINISTRATION, LIFELINE CURVE
FIGURE 36 ASIA PACIFIC MEDICATION-ASSISTED TREATMENT (MAT) MARKET: BY POPULATION TYPE, 2021
FIGURE 37 ASIA PACIFIC MEDICATION-ASSISTED TREATMENT (MAT) MARKET: BY POPULATION TYPE, 2022-2029 (USD MILLION)
FIGURE 38 ASIA PACIFIC MEDICATION-ASSISTED TREATMENT (MAT) MARKET: BY POPULATION TYPE, CAGR (2022-2029)
FIGURE 39 ASIA PACIFIC MEDICATION-ASSISTED TREATMENT (MAT) MARKET: BY POPULATION TYPE, LIFELINE CURVE
FIGURE 40 ASIA PACIFIC MEDICATION-ASSISTED TREATMENT (MAT) MARKET: BY END USER, 2021
FIGURE 41 ASIA PACIFIC MEDICATION-ASSISTED TREATMENT (MAT) MARKET: BY END USER, 2022-2029 (USD MILLION)
FIGURE 42 ASIA PACIFIC MEDICATION-ASSISTED TREATMENT (MAT) MARKET: BY END USER, CAGR (2022-2029)
FIGURE 43 ASIA PACIFIC MEDICATION-ASSISTED TREATMENT (MAT) MARKET: BY END USER, LIFELINE CURVE
FIGURE 44 ASIA PACIFIC MEDICATION-ASSISTED TREATMENT (MAT) MARKET: BY DISTRIBUTION CHANNEL, 2021
FIGURE 45 ASIA PACIFIC MEDICATION-ASSISTED TREATMENT (MAT) MARKET: BY DISTRIBUTION CHANNEL, 2022-2029 (USD MILLION)
FIGURE 46 ASIA PACIFIC MEDICATION-ASSISTED TREATMENT (MAT) MARKET: BY DISTRIBUTION CHANNEL, CAGR (2022-2029)
FIGURE 47 ASIA PACIFIC MEDICATION-ASSISTED TREATMENT (MAT) MARKET: BY DISTRIBUTION CHANNEL, LIFELINE CURVE
FIGURE 48 ASIA-PACIFIC MEDICATION-ASSISTED TREATMENT (MAT) MARKET: SNAPSHOT (2021)
FIGURE 49 ASIA-PACIFIC MEDICATION-ASSISTED TREATMENT (MAT) MARKET: BY COUNTRY (2021)
FIGURE 50 ASIA-PACIFIC MEDICATION-ASSISTED TREATMENT (MAT) MARKET: BY COUNTRY (2022 & 2029)
FIGURE 51 ASIA-PACIFIC MEDICATION-ASSISTED TREATMENT (MAT) MARKET: BY COUNTRY (2021 & 2029)
FIGURE 52 ASIA-PACIFIC MEDICATION-ASSISTED TREATMENT (MAT) MARKET: BY TYPE (2022-2029)
FIGURE 53 ASIA PACIFIC MEDICATION-ASSISTED TREATMENT (MAT) MARKET: COMPANY SHARE 2021 (%)
Metodología de investigación
La recopilación de datos y el análisis del año base se realizan utilizando módulos de recopilación de datos con muestras de gran tamaño. La etapa incluye la obtención de información de mercado o datos relacionados a través de varias fuentes y estrategias. Incluye el examen y la planificación de todos los datos adquiridos del pasado con antelación. Asimismo, abarca el examen de las inconsistencias de información observadas en diferentes fuentes de información. Los datos de mercado se analizan y estiman utilizando modelos estadísticos y coherentes de mercado. Además, el análisis de la participación de mercado y el análisis de tendencias clave son los principales factores de éxito en el informe de mercado. Para obtener más información, solicite una llamada de un analista o envíe su consulta.
La metodología de investigación clave utilizada por el equipo de investigación de DBMR es la triangulación de datos, que implica la extracción de datos, el análisis del impacto de las variables de datos en el mercado y la validación primaria (experto en la industria). Los modelos de datos incluyen cuadrícula de posicionamiento de proveedores, análisis de línea de tiempo de mercado, descripción general y guía del mercado, cuadrícula de posicionamiento de la empresa, análisis de patentes, análisis de precios, análisis de participación de mercado de la empresa, estándares de medición, análisis global versus regional y de participación de proveedores. Para obtener más información sobre la metodología de investigación, envíe una consulta para hablar con nuestros expertos de la industria.
Personalización disponible
Data Bridge Market Research es líder en investigación formativa avanzada. Nos enorgullecemos de brindar servicios a nuestros clientes existentes y nuevos con datos y análisis que coinciden y se adaptan a sus objetivos. El informe se puede personalizar para incluir análisis de tendencias de precios de marcas objetivo, comprensión del mercado de países adicionales (solicite la lista de países), datos de resultados de ensayos clínicos, revisión de literatura, análisis de mercado renovado y base de productos. El análisis de mercado de competidores objetivo se puede analizar desde análisis basados en tecnología hasta estrategias de cartera de mercado. Podemos agregar tantos competidores sobre los que necesite datos en el formato y estilo de datos que esté buscando. Nuestro equipo de analistas también puede proporcionarle datos en archivos de Excel sin procesar, tablas dinámicas (libro de datos) o puede ayudarlo a crear presentaciones a partir de los conjuntos de datos disponibles en el informe.